Fabrication of Fe/Fe3C@porous carbon sheets from biomass and their application for simultaneous reduction and adsorption of uranium(VI) from solution†
Xiangxue
Wang
a,
Shouwei
Zhang
ab,
Jiaxing
Li
*a,
Jinzhang
Xu
b and
Xiangke
Wang
*ac
aInstitute of Plasma Physics, Chinese Academy of Sciences, P.O. Box 1126, Hefei, 230031, P. R. China. E-mail: lijx@ipp.ac.cn; xkwang@ipp.ac.cn; Fax: +86-551-65591310; Tel: +86-551-65592788
bSchool of Materials Science and Engineering, Hefei University of Technology, 230031, Hefei, P. R. China
cFaculty of Engineering, King Abdulaziz University, Jeddah 21589, Saudi Arabia
First published on 25th July 2014
Abstract
Carbon-encapsulated Fe/Fe3C nanoparticles embedded in porous carbon sheets (Fe/Fe3C@PCS) were fabricated by a one step carbothermic reduction, using natural abundant biomass derivatives. Batch experimental results showed that Fe/Fe3C@PCS could effectively remove the radionuclide U(VI) from simulated wastewater in the presence of carbonate or calcium under laboratory conditions with reduced cost, improved activity and enhanced kinetics. Compared with activated carbon (AC), Fe/Fe3C@PCS is more efficient, and can remove U(VI) quantitatively at an initial concentration of up to 140 mg L−1. The major reaction pathway involved the reduction of U(VI) to the insoluble U(IV) species as identified by X-ray photoelectron spectroscopy (XPS) analysis. This study demonstrated the potential application of Fe/Fe3C@PCS as a low cost and effective remediation strategy for U-contaminated wastewater cleanup.
1. Introduction
With the development of the nuclear industry, a large amount of radioactive waste, such as 235U, 63Ni, 90Sr, 137Cs and 60Co, has been discharged into aquatic systems. The increasing levels of toxic radionuclides exhibit a serious threat to ecological systems because of their long half-lives and the transport of radionuclides in the environment.1–6 For the sake of ecological security and human health, an urgent issue is to develop advanced techniques and materials for the effective purification of radioactive wastewater, whilst the technologies should be inexpensive, swift, effective and environmentally friendly.3,7–11The in situ chemical reduction of contaminants by zerovalent iron (ZVI) represents a potentially more effective, lower cost alternative compared to other remediation technologies.12–17 However, relatively few studies have examined the potential applications of ZVI supported nanomaterials to reduce or to remove radionuclides from contaminated ground water. Compared to bulk ZVI, nano-ZVI (nZVI) has a much larger surface area and volume ratio, higher surface energy and reaction activity than conventional bulk or microscale materials for wastewater treatment.16–21 Experimentally, nZVI has been proven to be highly effective for the removal/degradation of a wide range of aqueous chemical contaminants, including chlorinated organics, azo dyes, inorganic anions and a range of heavy metal ions.13,19–23 However, unmodified nZVI particles are chemically unstable and tend to agglomerate because of their high surface energies and intrinsic magnetic interactions, which limits their further application due to the loss of their chemical reactivity and mobility through the subsurface.24,25 Hydrophilic or amphiphilic organic chemicals have been applied to immobilize nZVI by adsorption to enhance the steric or electrostatic repulsions in order to inhibit the aggregation of nZVI and to increase the stability of the suspensions.13,26–28
However, it is still a challenge to better control the aggregation of nZVI nanoparticles and to further optimize their reactivity and stability.17 The high cost associated with nZVI remediation is another unavoidable problem. Recently, material science technologies have been developed to prepare porous-based materials as the support substrates for nZVI, among which porous carbon materials show great advantages because of their high chemical stability, adsorption capacity and low cost.15,29–31 Carbon-based nanomaterials, such as carbon nanotubes, graphene and carbon dot composites, have been used as promising materials for the removal of pollutants.7,32–34 Considering the economic, environmental and societal factors, it is worthwhile to use renewable materials to produce porous carbon materials. However, only a few papers have reported the application of biomass-related porous carbon materials in wastewater treatment. Gelatin is an animal derivative composed of various proteins, produced by partial hydrolysis of collagen, extracted from the skin, boiled crushed bones and connective tissues of animals. As a cheap, renewable, environmentally friendly and commercially available biomaterial, it may be a promising precursor for porous carbon to support U(VI) remediation.27,35
Thereby, we herein present a green, inexpensive process to make reactive iron nanoparticles (Fe/Fe3C@PCS) by reacting soluble iron salts with gelatin via a simple carbothermic reduction method. Their physicochemical properties were carefully characterized by X-ray diffraction (XRD), Fourier transform infrared spectroscopy (FTIR), transmission electron microscopy (TEM), scanning electron microscopy (SEM) and X-ray photoelectron spectroscopy (XPS). The use of excess carbon in the process could provide a high carbon-supported surface area and prevent nZVI aggregation. Experiments of U(VI) adsorption on Fe/Fe3C@PCS were carried out in the presence of carbonates and calcium chloride. The adsorption kinetics and the possible U(VI) adsorption mechanism on Fe/Fe3C@PCS were investigated and discussed in detail.
2. Experimental section
2.1 Materials
Fe/Fe3C@PCS was synthesized from Fe-loaded biomass, which was prepared by a biosorption process using biomass as an adsorbent at ambient temperature. Briefly, 1.5 g Fe(NO3)3·9H2O was dissolved in 100 mL Milli-Q water, followed by the addition of 3 g gelatin. This solution was shaken in an oscillator at 400 rpm for 10 h before evaporating off the water at 80 °C overnight. The solid residue was placed in a quartz tube and purged with nitrogen for 1 hour before being heated to 800 °C at a rate of 5 °C min−1 and maintained for 1 h under N2 with a flow rate of 200 mL min−1. Then, it was cooled to ambient temperature and kept under N2 for several hours before being removed from the tube furnace. The as-prepared Fe/Fe3C@PCS composites were ready for characterization, reactivity tests and transport measurements. For comparison, a series of composites was prepared by adjusting the mass ratio of gelatin and Fe(NO3)3·9H2O (1![[thin space (1/6-em)]](https://www.rsc.org/images/entities/char_2009.gif) :
:![[thin space (1/6-em)]](https://www.rsc.org/images/entities/char_2009.gif) 1 and 3
1 and 3![[thin space (1/6-em)]](https://www.rsc.org/images/entities/char_2009.gif) :
:![[thin space (1/6-em)]](https://www.rsc.org/images/entities/char_2009.gif) 1 by mass), and activated carbon (AC) from gelatin without Fe(NO3)3·9H2O was also synthesized.
1 by mass), and activated carbon (AC) from gelatin without Fe(NO3)3·9H2O was also synthesized.
2.2 Characterization
X-ray diffraction (XRD) patterns were obtained on a Rigaku D/MAX2500 V with Cu Kα radiation. The surface morphologies were analyzed using a high-resolution transmission electron microscope (HRTEM) (JEOL-2100F, Japan) and field emission scanning electron microscopy (FE-SEM) (Sirion 200, FEI electron optics company, USA) coupled with EDX (INCA energy, UK). X-ray photoelectron spectroscopy (XPS) spectra were obtained on a VG ESCALAB MK II X-ray photoelectron spectrometer with a Mg Kα excitation source (1253.6 eV). The specific surface area and pore structure were determined by N2 adsorption–desorption isotherms at 77 K on a Micromeritics Gemini apparatus (ASAP 2020M1C, Micromeritics Co. USA). Fourier transform infrared spectroscopy (FTIR) was carried out on a Bruker EQUINOX55 spectrometer (Nexus) on KBr pellets at room temperature.2.3 Batch experiments
All of the experiments were carried out in polyethylene centrifuge tubes under N2 conditions at a temperature of 25 °C by batch technique. Briefly, the suspension of adsorbent and U(VI) stock solution were added to achieve the desired concentrations. The pH was adjusted to the desired values by adding negligible volumes of 0.1 or 0.01 M HCl or NaOH. The suspensions were shaken for the required time and separated by centrifugation at 10![[thin space (1/6-em)]](https://www.rsc.org/images/entities/char_2009.gif) 000 rpm for 20 min. The U(VI) extractions were performed in 40 mM bicarbonate solution under N2 conditions. The concentrations of U(VI) were measured using a U Arsenazo-III spectrophotometer at a wavelength of 650 nm. In addition, U(VI)removal = U(VI)adsorbed + U(VI)reduction. All of the experiments were carried out in duplicate and the error values were calculated as the standard deviation of the duplicates divided by the square root of two.
000 rpm for 20 min. The U(VI) extractions were performed in 40 mM bicarbonate solution under N2 conditions. The concentrations of U(VI) were measured using a U Arsenazo-III spectrophotometer at a wavelength of 650 nm. In addition, U(VI)removal = U(VI)adsorbed + U(VI)reduction. All of the experiments were carried out in duplicate and the error values were calculated as the standard deviation of the duplicates divided by the square root of two.
3. Results and discussion
3.1 Sample characterization
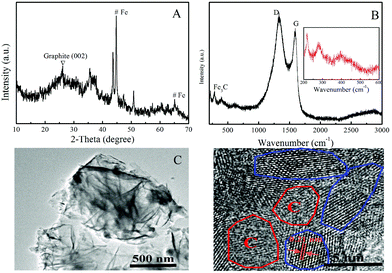
The XRD pattern of the as-prepared Fe/Fe3C@PCS is shown in Fig. 1A. The diffraction peak at 26.5° corresponds to the (002) plane of graphitic carbon, while the peaks at 44.8° and 65.1° indicate the presence of large amounts of α-Fe (JCPDS, No. 87-0722). The rest of the diffraction peaks are characteristic of the crystalline planes of Fe3C species (JCPDS, No. 89-2867).30,31 The XRD result confirms that the composite consists of graphite carbon and Fe/Fe3C species. Fig. 1B shows the Raman spectrum of Fe/Fe3C@PCS.The Raman spectrum of Fe/Fe3C@PCS displays the well-documented D band at 1328 cm−1 and G band at 1588 cm−1, assigned to the D mode corresponding to the structural defects/disorder and the G mode related to the first-order scattering of the E2g mode observed for sp2 carbon domains, respectively, which are characteristic of graphitic-like materials, indicating the generation of graphitic carbon shells during pyrolysis.30,31 The spectrum of the sample also shows the presence of iron carbide indicated by the peak series between 200 and 600 cm−1, usually attributed to stretching modes between the metal and carbon atoms.36 Generally, Raman modes of bulk iron carbide are usually inactive or simply not observed due to the metallic nature of iron carbide. In this case the fact that these modes were observed may be due to the surface and size-effects of Fe/Fe3C@PCS. The FTIR and XPS results analysis of Fe/Fe3C@PCS are shown in Fig. S1 and S2.†
The TEM image of Fe/Fe3C@PCS is shown in Fig. 1C, which indicates that the sample is mainly composed of few-layer and multilayer porous graphene-like nanosheets that are stacked and folded together. This structural morphology ensures a relatively high surface area, which is beneficial for adsorbing contaminants onto the surface of materials from wastewater. HRTEM was also applied to characterize the detailed structure of Fe/Fe3C@PCS, as shown in Fig. 1D and Fig. S3.† The Fe/Fe3C nanocrystals are interconnected with graphene-like nanosheets, and a well-defined crystalline lattice spacing of 0.21 nm can be observed in the core, which is consistent with the (211) diffraction peak of Fe3C.31 The characterization results indicate that the as-prepared Fe/Fe3C@PCS is mainly composed of Fe with a relatively low amount of Fe3C nanoparticles. To further demonstrate the presence of the Fe/Fe3C structure, the element mapping and energy-dispersive spectroscopy (EDS) spectra are given in Fig. S4.† The EDS analysis of Fe/Fe3C@PCS indicates that Fe, C and O were detected. The elemental mapping of Fe/Fe3C@PCS indicated the uniform distribution of the three elements within the sheet structures, which proves that Fe/Fe3C is uniformly deposited on the surface of the carbon sheet. In addition, the nitrogen adsorption–desorption isotherm of Fe/Fe3C@PCS is shown in Fig. S5.† Based on the nitrogen quantity adsorbed at different relative pressures, the N2-BET surface area of Fe/Fe3C@PCS was found to be ∼95.9 m2 g−1.
3.2 Remediation of U(VI)
The removal of U(VI) by Fe/Fe3C@PCS, bare nZVI and AC with different contact times is shown in Fig. 2A. For Fe/Fe3C@PCS, the adsorption reached equilibrium within 20 min and no detectable amount of U(VI) was observed in the solution, while ∼63% of U(VI) was removed from solution in the case of nZVI with an adsorption equilibrium time of ∼60 min, which was triple that of Fe/Fe3C@PCS. The higher removal of U(VI) by Fe/Fe3C@PCS indicates that a significant reduction of U(VI) occurred after U(VI) sorption on the solid particles.13,17,37 The longer reductive precipitation process is attributed to the corrosion of Fe, which involves an electron transfer process from Fe to U(VI).37 As for AC, the highest adsorption rate was detected for the removal of U(VI), reaching adsorption equilibrium within 10 min. But the removal efficiency was the lowest (only ∼22%), which indicates that U(VI) removal by AC is mainly through surface adsorption or complexation that is known to exhibit relatively fast reaction kinetics.8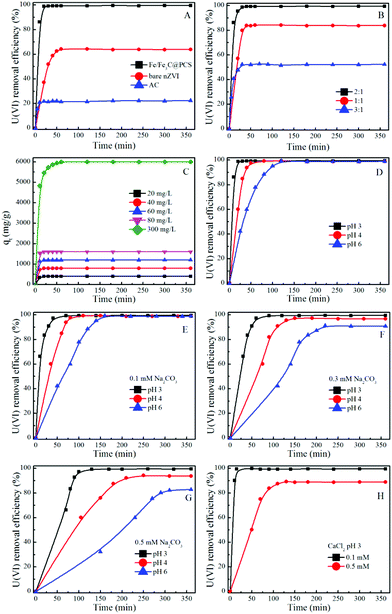 | ||
| Fig. 2 Effect of contact time on the removal of U(VI) from aqueous solution using solid particles under different experimental conditions (T = 25 °C, Cadsorbent = 0.05 g L−1, CU(VI) = 60 mg L−1). | ||
A comparison between Fe/Fe3C@PCS and nZVI indicates that Fe/Fe3C@PCS can remove U(VI) faster than nZVI because PCS can stabilize Fe/Fe3C nanoparticles, preventing their aggregation and increasing the reactivity of Fe/Fe3C. The synthesized PCS materials also have interconnected structures, which can improve the mass transport and enhance the supporting layer. A continuously interconnected structure can facilitate reactant transportation inside the pores, decrease the mass transfer resistance, assure better contact between adsorbent and U(VI), and create more opportunity for the reductive precipitation of U(VI). The high removal efficiency of Fe/Fe3C@PCS might be a consequence of the continuous reaction of Fe/Fe3C with U(VI). Bare nZVI will be oxidized easily to form an iron oxide film when it is exposed to air/water. However, once coupled with PCS, Fe/Fe3C will act as a micro-anode and PCS will act as a micro-cathode.16 These small electrodes can prevent the formation of an oxide film and accelerate the corrosion of the Fe/Fe3C nanoparticles, which is further confirmed by the longer reaction time of nZVI (60 min to reach equilibrium) than that of Fe/Fe3C@PCS (20 min to reach equilibrium).16
Because PCS can greatly improve nZVI to remove U(VI), Fe/Fe3C@PCS samples from different mass ratios of gelatin to Fe(NO3)3 (1![[thin space (1/6-em)]](https://www.rsc.org/images/entities/char_2009.gif) :
:![[thin space (1/6-em)]](https://www.rsc.org/images/entities/char_2009.gif) 1 to 3
1 to 3![[thin space (1/6-em)]](https://www.rsc.org/images/entities/char_2009.gif) :
:![[thin space (1/6-em)]](https://www.rsc.org/images/entities/char_2009.gif) 1) were also investigated for U(VI) removal. As presented in Fig. 2B, the removal efficiency of U(VI) by Fe/Fe3C@PCS (1
1) were also investigated for U(VI) removal. As presented in Fig. 2B, the removal efficiency of U(VI) by Fe/Fe3C@PCS (1![[thin space (1/6-em)]](https://www.rsc.org/images/entities/char_2009.gif) :
:![[thin space (1/6-em)]](https://www.rsc.org/images/entities/char_2009.gif) 1) was measured to be ∼83%, which was improved to ∼99% when the ratio was changed to 2
1) was measured to be ∼83%, which was improved to ∼99% when the ratio was changed to 2![[thin space (1/6-em)]](https://www.rsc.org/images/entities/char_2009.gif) :
:![[thin space (1/6-em)]](https://www.rsc.org/images/entities/char_2009.gif) 1. However, a further increment of mass ratio of gelatin to Fe(NO3)3 (3
1. However, a further increment of mass ratio of gelatin to Fe(NO3)3 (3![[thin space (1/6-em)]](https://www.rsc.org/images/entities/char_2009.gif) :
:![[thin space (1/6-em)]](https://www.rsc.org/images/entities/char_2009.gif) 1) decreased the removal efficiency, from which it could be concluded that the excess PCS derived from gelatin was not conducive to U(VI) removal. PCS derived from gelatin acted as a cathode, and the area ratio of anode (Fe/Fe3C) to cathode (PCS) was one of the major factors to affect the galvanic corrosion process, especially for a small anode with a large cathode, which could result in serious corrosion.8 Meanwhile, a negative effect was observed for a higher ratio of PCS (3
1) decreased the removal efficiency, from which it could be concluded that the excess PCS derived from gelatin was not conducive to U(VI) removal. PCS derived from gelatin acted as a cathode, and the area ratio of anode (Fe/Fe3C) to cathode (PCS) was one of the major factors to affect the galvanic corrosion process, especially for a small anode with a large cathode, which could result in serious corrosion.8 Meanwhile, a negative effect was observed for a higher ratio of PCS (3![[thin space (1/6-em)]](https://www.rsc.org/images/entities/char_2009.gif) :
:![[thin space (1/6-em)]](https://www.rsc.org/images/entities/char_2009.gif) 1). The Fe/Fe3C particles wrapped by too much PCS, leading to a hindering of the contact between Fe particles and uranyl ions. Considering the economic cost and removal efficiency, the mass ratio of gelatin
1). The Fe/Fe3C particles wrapped by too much PCS, leading to a hindering of the contact between Fe particles and uranyl ions. Considering the economic cost and removal efficiency, the mass ratio of gelatin![[thin space (1/6-em)]](https://www.rsc.org/images/entities/char_2009.gif) :
:![[thin space (1/6-em)]](https://www.rsc.org/images/entities/char_2009.gif) Fe(NO3)3 = 2
Fe(NO3)3 = 2![[thin space (1/6-em)]](https://www.rsc.org/images/entities/char_2009.gif) :
:![[thin space (1/6-em)]](https://www.rsc.org/images/entities/char_2009.gif) 1 was used in further studies.
1 was used in further studies.
Fig. 2C displays the adsorbed amount of U(VI) on Fe/Fe3C@PCS (2![[thin space (1/6-em)]](https://www.rsc.org/images/entities/char_2009.gif) :
:![[thin space (1/6-em)]](https://www.rsc.org/images/entities/char_2009.gif) 1) at different initial U(VI) concentrations, which clearly indicates that the total amount of adsorbed U(VI) increases with increasing initial U(VI) concentration. This is attributed to the increased available U(VI) at higher initial concentrations. Higher initial adsorbate concentration provides a higher driving force for ion transportation from solution to the Fe/Fe3C@PCS surface, resulting in increased collisions between U(VI) ions and active sites on the surface of Fe/Fe3C@PCS.17
1) at different initial U(VI) concentrations, which clearly indicates that the total amount of adsorbed U(VI) increases with increasing initial U(VI) concentration. This is attributed to the increased available U(VI) at higher initial concentrations. Higher initial adsorbate concentration provides a higher driving force for ion transportation from solution to the Fe/Fe3C@PCS surface, resulting in increased collisions between U(VI) ions and active sites on the surface of Fe/Fe3C@PCS.17
The pH effect (3.0, 4.0 and 6.0), which acts as a control experiment, was also considered, as shown in Fig. 2D. The removal efficiency of U(VI) was almost unchanged with increasing pH values, while the equilibrium time increased greatly with increasing pH values, which were measured to be 20 min at pH 3.0, 80 min at pH 4.0 and 120 min at pH 6.0, respectively. This can be explained by the species of U(VI) ions at different pH values. Below pH 3.0, the main species of U(VI) is UO22+, which can easily migrate and be removed by Fe/Fe3C/PCS. In the pH range 4.0–6.0, [(UO2)2(OH)2]2+, [UO2OH]+ and [(UO2)3(OH)5]+ ions are the predominant species, which have increased stabilities, reduced migration and increase the equilibrium time.13
Fig. 2E–H present the U(VI) removal from solution to Fe/Fe3C@PCS (2![[thin space (1/6-em)]](https://www.rsc.org/images/entities/char_2009.gif) :
:![[thin space (1/6-em)]](https://www.rsc.org/images/entities/char_2009.gif) 1) at different solution compositions. The removal rate decreased with increasing carbonate or calcium concentrations. For example, at a carbonate concentration of 0.1 mM, over 99% of U(VI) was removed within 70 min at pH 3.0, within 110 min at pH 4.0, and within 170 min at pH 6.0 (Fig. 2E), respectively. When the carbonate concentration was further increased to 0.5 mM, 360 min was required to remove ∼99% U(VI) at pH 3.0, ∼94% U(VI) at pH 4.0, and ∼82% U(V) at pH 6.0 (Fig. 2G). This is because the activity of U(VI) ions in solution is reduced greatly at high ionic strengths, which accordingly limits their migration to the surface of Fe/Fe3C@PCS and thereby extends the equilibrium time. The removal rate of U(VI) could also be affected by the concentration of the electrolyte (CaCl2) (Fig. 2H). As the CaCl2 concentration increased from 0.1 to 0.5 mM, the removal efficiency decreased from ∼99% to ∼88% within 2 h of contact time. The suppression of calcium on U(VI) removal and reduction may be the result of the combined effects of competitive adsorption and electrostatic repulsion between Ca2+ and uranyl-hydroxyl ions. The calcium ions can form complexes with uranyl ions and thereby decrease their adsorption on Fe/Fe3C@PCS.38 Pillay et al.11 pointed out that Cl− can hinder metal ion removal by carbon materials. The high Cl− concentration restricts the binding of U(VI) on the surface of Fe/Fe3C@PCS, and thereby decreases U(VI) adsorption.
1) at different solution compositions. The removal rate decreased with increasing carbonate or calcium concentrations. For example, at a carbonate concentration of 0.1 mM, over 99% of U(VI) was removed within 70 min at pH 3.0, within 110 min at pH 4.0, and within 170 min at pH 6.0 (Fig. 2E), respectively. When the carbonate concentration was further increased to 0.5 mM, 360 min was required to remove ∼99% U(VI) at pH 3.0, ∼94% U(VI) at pH 4.0, and ∼82% U(V) at pH 6.0 (Fig. 2G). This is because the activity of U(VI) ions in solution is reduced greatly at high ionic strengths, which accordingly limits their migration to the surface of Fe/Fe3C@PCS and thereby extends the equilibrium time. The removal rate of U(VI) could also be affected by the concentration of the electrolyte (CaCl2) (Fig. 2H). As the CaCl2 concentration increased from 0.1 to 0.5 mM, the removal efficiency decreased from ∼99% to ∼88% within 2 h of contact time. The suppression of calcium on U(VI) removal and reduction may be the result of the combined effects of competitive adsorption and electrostatic repulsion between Ca2+ and uranyl-hydroxyl ions. The calcium ions can form complexes with uranyl ions and thereby decrease their adsorption on Fe/Fe3C@PCS.38 Pillay et al.11 pointed out that Cl− can hinder metal ion removal by carbon materials. The high Cl− concentration restricts the binding of U(VI) on the surface of Fe/Fe3C@PCS, and thereby decreases U(VI) adsorption.
The reductive percentage of U(VI) to U(IV) in the total removal of U(VI) by Fe/Fe3C@PCS is also measured as shown in Fig. 3, which demonstrates that the reduction efficiency of U(VI) to U(IV) decreases with increasing pH or carbonate concentration. The pseudo-first order removal rate constants (kremoval) and reduction rate constants (kreduction) at various pH values under different conditions are listed in Table 1.
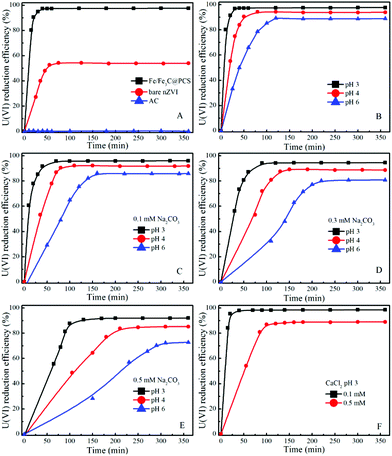 | ||
| Fig. 3 Reduction of U(VI) to U(IV) as a function of contact time under different conditions (T = 25 °C, Cadsorbent = 0.05 g L−1, CU(VI) = 60 mg L−1). | ||
| Condition | Concentration (mM) | pH 3.0 | pH 4.0 | pH 6.0 | |||
|---|---|---|---|---|---|---|---|
| k removal | k reduction | k removal | k reduction | k removal | k reduction | ||
| Control | 0 | 0.20442 | 0.16930 | 0.05645 | 0.05017 | 0.02428 | 0.02182 |
| Carbonate | 0.1 | 0.10258 | 0.09251 | 0.03132 | 0.03054 | 0.01347 | 0.01269 |
| 0.3 | 0.04228 | 0.03510 | 0.01753 | 0.01634 | 0.00691 | 0.00572 | |
| 0.5 | 0.02151 | 0.01865 | 0.00994 | 0.00840 | 0.00076 | 0.00110 | |
| Calcium | 0.1 | 0.24771 | 0.23838 | — | — | — | — |
| 0.5 | 0.02199 | 0.02093 | — | — | — | — | |
In the absence of carbonate or calcium, the removal rates were larger than the reduction rates, indicating that the overall reaction was controlled by the reduction process. But in the presence of carbonate, the removal and reduction rate constants decreased. For instance, at pH 3.0, in the absence of carbonate, the removal and reduction rate constants were 0.20442 and 0.16930, respectively, whereas at the concentration of 0.5 mM carbonate, the rate constants were decreased to 0.02151 and 0.01865, respectively. The results indicate a strong inhibition by carbonate on U(VI) adsorption and reduction. As the present uranium species changed with pH and ionic strength, Visual MINEQL + 3.0 was applied to simulate the relative distribution of the U(VI) species under a wide variety of pH values.24 As shown in Fig. 4, within pH 3.0 to 6.0, uranium predominantly exists as UO22+, [(UO2)2(OH)2]2+, [UO2OH]+, UO2CO3(aq), UO2(CO3)34−, etc. Uranyl-hydroxyl species have relatively simple structures and can easily migrate from solution to the surface of Fe/Fe3C@PCS for U(VI) removal. However, UO22+/CO32− complexes could form complicated molecular structures with higher stability, which prevent the removal process. That is, the inhibition by carbonate is attributed to the formation of stable U(VI) carbonate aqueous complexes, and thereby decreasing U(VI) adsorption, and finally inhibiting the process of U(VI) reduction.37 A similar reduction rate and removal rate are observed in the presence of calcium, suggesting that the overall reaction is controlled by the reduction process.
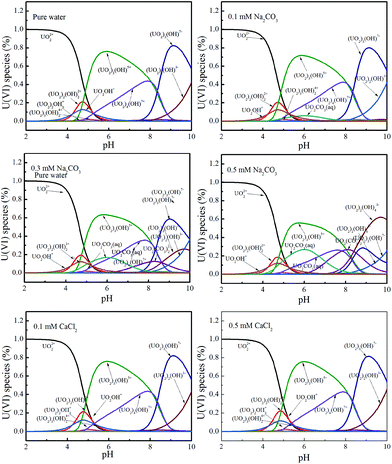 | ||
| Fig. 4 Relative distribution of U(VI) species as a function of pH under different conditions. The concentration of U(VI) is 60 mg L−1. | ||
3.3 U(VI) removal capacity
The efficiency and capacity for U(VI) removal via reductive precipitation and adsorption by Fe/Fe3C@PCS and AC were further evaluated. Fig. 5A shows that the typical adsorption isotherm of U(VI) on AC can be described well by the Langmuir model while that of U(VI) on Fe/Fe3C@PCS is nearly a straight line (Fig. 5B). The results indicate that AC is quite effective in the removal of U(VI) at a relatively low solution concentration, while most of the U(VI) ions are left in solution when the initial U(VI) concentration is relatively high, which is attributed to the limited sorption capacity of AC. The adsorption capacity of U(VI) by AC depends on the limited active adsorption sites, so the adsorption sites are saturated quickly because the amount of U(VI) in solution is much higher than the number of adsorption sites on the surface of the AC. In contrast, almost 100% U(VI) is removed from solution even when the initial U(VI) concentration in solution reaches 140 mg L−1, due to the high specific surface area and strong interaction of U(VI) with Fe/Fe3C@PCS. The apparent “high capacity” for U(VI) removal by Fe/Fe3C@PCS suggests that the electrochemical corrosion of iron is the main driving force, producing electrons for U(VI) reduction and removal from the aqueous solutions. As the corrosion proceeds, the U(VI) will be reduced and removed from solution, giving an apparently “infinite” capacity. Therefore, the U(VI) removal process is a reductive precipitation of U(VI) by Fe/Fe3C@PCS rather than an adsorption.13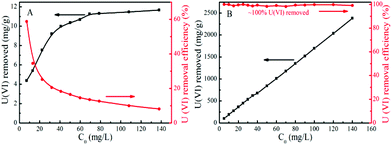 | ||
| Fig. 5 Effect of initial U(VI) concentration on U(VI) removal efficiency by AC (A) and by Fe/Fe3C@PCS (B) (T = 25 °C, Cadsorbent = 0.05 g L−1, pH ∼ 4). | ||
The removal mechanism of U(VI) from solution to Fe/Fe3C@PCS and AC was also investigated by the desorption of U(VI) from Fe/Fe3C@PCS and AC. As for AC, nearly 98% U(VI) can be extracted from the AC using carbonate solution (1 M), further indicating that the U(VI) removal is mainly dominated by the surface physical adsorption, and U(VI) reduction to U(IV) does not contribute to the U(VI) removal. However, the majority of surface adsorbed U(VI) is precipitated on the surface of Fe/Fe3C@PCS with only 5% U(VI) being washed out from the Fe/Fe3C@PCS to solution (Table 2), confirming the in situ reduction of surface adsorbed U(VI) into U(IV) on Fe/Fe3C@PCS. The pseudo-first order U(VI) removal and reduction rate constants by Fe/Fe3C@PCS, nZVI and AC are shown in Table 3. The obtained precipitates were also confirmed by XPS and EDS analysis.
| Before wash (mg) | After wash (mg) | U desorbed (%) | |
|---|---|---|---|
| Fe/Fe3C@PCS | 19.92 | 18.89 | 5.17% |
| AC | 4.47 | 0.07 | 98.43% |
| Material | Fe/Fe3C@PC | nZVI | AC |
|---|---|---|---|
| Removal rate constant (kremoval) (min−1) | 0.2044 | 0.0539 | 0.2663 |
| Reduction rate constant (kreduction) (min−1) | 0.1693 | 0.0379 | ∼0 |
In Fig. 6A, the peaks of Fe, U and C were observed in the sample of Fe/Fe3C@PCS after the removal of U(VI). In the XPS spectra of Fe 2p (Fig. 6B), iron (hydr)oxides and Fe3C were the predominant species with trace amounts of Fe. The Fe 2p3/2 peaks at 711.4 and 713.8 eV are unique peaks for ferric irons, such as hydrated ferric oxide and hematite. The presence of Fe(III) indicates that Fe(II) could reduce U(VI) to U(IV).37 The relative proportion of U(VI) and U(IV) is 0.566. The U 4f peaks were used to determine the relative proportion of U(VI) and U(IV) in Fe/Fe3C@PCS, as shown in Fig. 6C. The U(IV) peaks were located at 380.5 eV (±0.2 eV) and 391.4 eV (±0.2 eV), comparable to the reported values for non-stoichiometric UO2, commonly referred to as UO2+x, where x ≤ 2. The U(VI) peaks, found at 382.3 eV (±0.2 eV) and 393.1 eV (±0.2 eV), were assigned to the adsorbed uranyl on AC or Fe/Fe3C@PCS, while UO3 was found at the binding energies of 381.6 eV (±0.2 eV) and 392.5 eV (±0.2 eV).37 The shifted peaks towards the reduced U(VI) peak energies clearly indicate the presence of non-stoichiometric UO2 at the surface of the material, suggesting the fast reduction of U(VI) to U(IV) and then the formation of UO2 oxides after the adsorption on the surface of Fe/Fe3C@PCS. Curve fitting and analysis showed that U(VI) and non-stoichiometric UO2 account for ∼59% of the U. The EDS spectrum of Fe/Fe3C@PCS with adsorbed U(VI) showed both iron and uranium peaks. Primary elements in the Fe/Fe3C@PC included C, Fe, O and U (Fig. 6D). After adsorption of U(VI) on Fe/Fe3C@PCS and washing with 0.1 M Na2CO3, the Fe/Fe3C@PCS was investigated by elemental mapping analysis and the results are shown in Fig. 7. It is clear that the morphology of the sheets was not altered. Elemental mapping images after U(VI) adsorption and in situ reduction suggest that the U atoms are uniformly dispersed within the sheets.
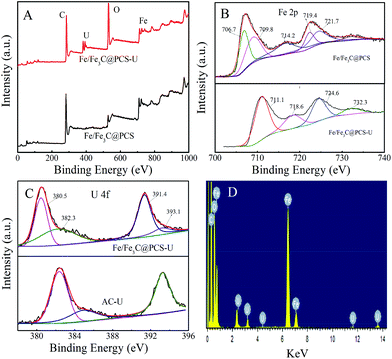 | ||
| Fig. 6 XPS full (A), Fe2p (B), and U4f (C) spectra and EDS pattern (D) of the material before and after adsorption of U(VI). | ||
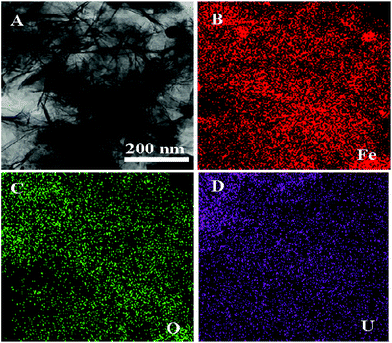 | ||
| Fig. 7 TEM image (A) and elemental mapping images (B–D) of the material after adsorption of U(VI) on Fe/Fe3C@PCS and washing with 0.1 M Na2CO3. | ||
4. Conclusions
In summary, we have demonstrated a facile and cost-effective method to prepare core–shell structured Fe/Fe3C@PCS from biomass derivatives by a one-step carbon thermal reduction. The prepared Fe/Fe3C@PCS can be used as a potentially strong adsorbent to remove uranium from aqueous solutions via surface adsorption and in situ reduction of U(VI) into U(IV) and then the formation of UO2 oxides. The Fe/Fe3C@PCS is also effective in the removal of U(VI) in the presence of carbonate or calcium, demonstrating the potential application of Fe/Fe3C@PCS as a low cost and effective remediation strategy for U-contaminated wastewater cleanup from industrial or environmental origins.Acknowledgements
The authors acknowledge the financial support from the National Natural Science Foundation of China (21207136, 21225730 and 91326202), the Ministry of Science and Technology of China (2011CB933700) and the Hefei Center for Physical Science and Technology (2012FXZY005).Notes and references
- D. A. Atwood, Radionuclides in the Environment, Wiley, 2013 Search PubMed.
- D. M. Mackay and J. A. Cherry, Environ. Sci. Technol., 1989, 23, 630–636 CrossRef CAS.
- D. D. Shao, Z. Q. Jiang, X. K. Wang, J. X. Li and Y. D. Meng, J. Phys. Chem. B, 2009, 113, 860–864 CrossRef CAS PubMed.
- C. L. Chen and X. K. Wang, Ind. Eng. Chem. Res., 2006, 45, 9144–9149 CrossRef CAS.
- M. C. Liu, C. L. Chen, J. Hu, X. L. Wu and X. K. Wang, J. Phys. Chem. C, 2011, 115, 25234–25240 Search PubMed.
- C. L. Chen, J. Hu, D. D. Shao, J. X. Li and X. K. Wang, J. Hazard. Mater., 2009, 164, 923–928 Search PubMed.
- G. X. Zhao, T. Wen, X. Yang, S. B. Yang, J. L. Liao, J. Hu, D. D. Shao and X. K. Wang, Dalton Trans., 2012, 41, 6182–6188 Search PubMed.
- X. M. Dou, R. Li, B. Zhao and W. Y. Liang, J. Hazard. Mater., 2010, 182, 108–114 CrossRef CAS PubMed.
- M. Wazne, G. P. Korfiatis and X. G. Meng, Environ. Sci. Technol., 2003, 37, 3619–3624 CrossRef CAS.
- W. J. Liu, K. Tian, H. Jiang and H. Q. Yu, Sci. Rep., 2013, 3 Search PubMed , 2419.
- K. Pillay, E. M. Cukrowska and N. J. Coville, J. Hazard. Mater., 2009, 166, 1067–1075 CrossRef CAS PubMed.
- H. Choi, S. Agarwal and S. R. Al-Abed, Environ. Sci. Technol., 2009, 43, 488–493 Search PubMed.
- B. Gu, L. Liang, M. J. Dickey, X. Yin and S. Dai, Environ. Sci. Technol., 1998, 32, 3366–3373 Search PubMed.
- Y. Q. Liu and G. V. Lowry, Environ. Sci. Technol., 2006, 40, 6085–6090 Search PubMed.
- L. B. Hoch, E. J. Mack, B. W. Hydutsky, J. M. Hershman, I. M. Skluzacek and T. E. Mallouk, Environ. Sci. Technol., 2008, 42, 2600–2605 CrossRef CAS.
- X. S. Lv, J. Xu, G. M. Jiang and X. H. Xu, Chemosphere, 2011, 85, 1204–1209 Search PubMed.
- S. Yan, B. Hua, Z. Y. Bao, J. Yang, C. X. Liu and B. L. Deng, Environ. Sci. Technol., 2010, 44, 7783–7789 CrossRef CAS PubMed.
- J. D. Atkinson, M. E. Fortunato, S. A. Dastgheib, M. Rostam-Abadi, M. J. Rood and K. S. Suslick, Carbon, 2011, 49, 587–598 CrossRef CAS PubMed.
- T. Phenrat, N. Saleh, K. Sirk, R. D. Tilton and G. V. Lowry, Environ. Sci. Technol., 2007, 41, 284–290 Search PubMed.
- D. M. Fan, R. P. Anitori, B. M. Tebo, P. G. Tratnyek, J. S. L. Pacheco, R. K. Kukkadapu, M. H. Engelhard, M. E. Bowden, L. Kovarik and B. W. Arey, Environ. Sci. Technol., 2013, 47, 5302–5310 Search PubMed.
- Z. Q. Li, K. Greden, P. J. J. Alvarez, K. B. Gregory and G. V. Lowry, Environ. Sci. Technol., 2010, 44, 3462–3467 Search PubMed.
- Y. Liu, T. Phenrat and G. V. Lowry, Environ. Sci. Technol., 2007, 41, 7881–7887 CrossRef CAS.
- R. A. Crane and T. B. Scott, J. Hazard. Mater., 2012, 211, 112–125 CrossRef PubMed.
- R. A. Crane, M. Dickinson, I. C. Popescu and T. B. Scott, Water Res., 2011, 45, 2931–2942 CrossRef CAS PubMed.
- B. Sunkara, J. J. Zhan, J. B. He, G. L. McPherson, G. Piringer and V. T. John, ACS Appl. Mater. Interfaces, 2010, 2, 2854–2862 Search PubMed.
- J. Quinn, C. Geiger, C. Clausen, K. Brooks, C. Coon, S. O'Hara, T. Krug, D. Major, W. S. Yoon, A. Gavaskar and T. Holdsworth, Environ. Sci. Technol., 2005, 39, 1309–1318 CrossRef CAS.
- F. He and D. Y. Zhao, Environ. Sci. Technol., 2005, 39, 3314–3320 CrossRef CAS.
- F. He and D. Y. Zhao, Environ. Sci. Technol., 2007, 41, 6216–6221 CrossRef CAS.
- H. C. Ma, K. Teng, Y. H. Fu, Y. Song, Y. W. Wang and X. L. Dong, Energy Environ. Sci., 2011, 4, 3067–3074 CAS.
- Z. H. Wen, S. Q. Ci, F. Zhang, X. L. Feng, S. M. Cui, S. Mao, S. L. Luo, Z. He and J. H. Chen, Adv. Mater., 2012, 24, 1399–1404 CrossRef CAS PubMed.
- D. H. Liu, Y. Guo, L. H. Zhang, W. C. Li, T. Sun and A. H. Lu, Small, 2013, 9, 3852–3857 CrossRef CAS PubMed.
- G. X. Zhao, J. X. Li, X. M. Ren, C. L. Chen and X. K. Wang, Environ. Sci. Technol., 2011, 45, 10454–10462 CrossRef CAS PubMed.
- X. K. Wang, C. L. Chen, W. P. Hu, A. P. Ding, D. Xu and X. Zhou, Environ. Sci. Technol., 2005, 39, 2856–2860 CrossRef CAS.
- Q. T. Huang, S. R. Hu, H. Q. Zhang, J. H. Chen, Y. S. He, F. M. Li, W. Weng, J. C. Ni, X. X. Bao and Y. Lin, Analyst, 2013, 138, 5417–5423 RSC.
- B. Xu, S. S. Hou, G. P. Cao, F. Wu and Y. S. Yang, J. Mater. Chem., 2012, 22, 19088–19093 RSC.
- M. M. Doeff, J. D. Wilcox, R. Yu, A. Aumentado, M. Marcinek and R. Kostecki, J. Solid State Electrochem., 2008, 12, 995–1001 CrossRef CAS PubMed.
- T. B. Scott, G. C. Allen, P. J. Heard and M. G. Randell, Geochim. Cosmochim. Acta, 2005, 69, 5639–5646 CrossRef CAS PubMed.
- W. M. Dong, W. P. Ball, C. X. Liu, Z. M. Wang, A. T. Stone, J. Bai and J. M. Zachara, Environ. Sci. Technol., 2005, 39, 7949–7955 CrossRef CAS.
Footnote |
| † Electronic supplementary information (ESI) available. See DOI: 10.1039/c4qi00071d |
| This journal is © the Partner Organisations 2014 |

