
Supersensitive CeOx-based nanocomposite sensor for the electrochemical detection of hydroxyl free radicals†
Surachet
Duanghathaipornsuk
 a,
Dong-Shik
Kim
a,
Tamara L.
Phares
b,
Cheng-Han
Li
c,
Joerg R.
Jinschek
c and
Ana C.
Alba-Rubio
*a
a,
Dong-Shik
Kim
a,
Tamara L.
Phares
b,
Cheng-Han
Li
c,
Joerg R.
Jinschek
c and
Ana C.
Alba-Rubio
*a
aDepartment of Chemical Engineering, The University of Toledo, Toledo, OH 43606, USA. E-mail: ana.albarubio@utoledo.edu
bDepartment of Bioengineering, The University of Toledo, Toledo, OH 43606, USA
cDepartment of Materials Science and Engineering, The Ohio State University, Columbus, OH 43210, USA
First published on 25th February 2021
Abstract
It is well known that an excess of hydroxyl radicals (˙OH) in the human body is responsible for oxidative stress-related diseases. An understanding of the relationship between the concentration of ˙OH and those diseases could contribute to better diagnosis and prevention. Here we present a supersensitive nanosensor integrated with an electrochemical method to measure the concentration of ˙OH in vitro. The electrochemical sensor consists of a composite comprised of ultrasmall cerium oxide nanoclusters (<2 nm) grafted to a highly conductive carbon deposited on a screen-printed carbon electrode (SPCE). Cyclic voltammetry (CV) and electrochemical impedance spectroscopy (EIS) were used to analyze the interaction between cerium oxide nanoclusters and ˙OH. The CV results demonstrated that this electrochemical sensor had the capacity of detecting ˙OH with a high degree of accuracy and selectivity, achieving a consistent performance. Additionally, EIS results confirmed that our electrochemical sensor was able to differentiate ˙OH from hydrogen peroxide (H2O2), which is another common reactive oxygen species (ROS) found in the human body. The limit of detection (LOD) observed with this electrochemical sensor was of 0.6 μM. Furthermore, this nanosized cerium oxide-based electrochemical sensor successfully detected in vitro the presence of ˙OH in preosteoblast cells from newborn mouse bone tissue. The supersensitive electrochemical sensor is expected to be beneficially used in multiple applications, including medical diagnosis, fuel–cell technology, and food and cosmetic industries.
Introduction
Reactive oxygen species (ROS) are well known for being extremely reactive. Extensive research has been conducted to understand the impact of ROS on different industries1,2 and on human health.3,4 Among the ROS, the study of hydroxyl radicals (˙OH) is especially challenging due to their high reactivity and extremely short lifetime of nanoseconds.5 The generation of ˙OH possesses several advantages and disadvantages, depending on the field of study. For example, the presence of ˙OH results to be beneficial for the destruction of harmful contaminants in solids and liquids via Advanced Oxidation Processes (AOPs) and Electrochemical Advanced Oxidation Processes (EAOPs).6–8 However, the presence of ˙OH can also offer disadvantages, such as the degradation of the polymer electrolyte membrane (PEM) in fuel cells,9 which leads to low efficiency and shorter lifetime. In the human body, hydroxyl radicals (˙OH) are generated in mitochondria,10 blood,11 and interstitial fluid12 to preserve the normal functions of cells, including immunity,13 apoptosis,14 cell signaling,15 and cellular senescence.16 However, the overproduction of ˙OH can damage adjacent cells resulting in the development of oxidative stress-related diseases, such as aging, cancer,17 and Alzheimer's and Parkinson's diseases.18,19 A better understanding of the impact of ˙OH on those oxidative stress-related diseases is necessary to effectively prevent and treat them. Therefore, it is important to develop technologies for monitoring the levels of ˙OH in human tissues, organs, and blood, as this can help to diagnose these severe diseases in the early stages.Various researchers have integrated sensing elements such as proteins20,21 and metal oxides nanoparticles22,23 with electrochemical techniques to develop nanosensors for the detection of chemical species of interest. The use of electrochemical techniques posseses several advantages over other methods, as the sensitivity and selectivity can be easily controlled by modifying the sensing element on the surface of the electrode.24,25 Morever, the electrochemical techniques can provide a real-time detection, which is especially important when monitoring species with short lifetime.26 Inspired by previous findings, this study reports the use of ultrasmall cerium oxide nanoclusters as the sensing element for the development of a highly sensitive and selective electrochemical sensor for ˙OH detection. According to former reports, cerium oxide nanoparticles (CeNPs) demonstrated a selective removal of ˙OH in living tissues.27,28 The scavenge of ˙OH by CeNPs is based on the dual oxidation state of cerium oxide, which can be easily switched between Ce3+ and Ce4+ by oxidizing or reducing species in the medium, respectively.29,30Fig. 1 shows the mechanism for which Ce3+ sites on CeNPs specifically reacts with ˙OH via the oxidation reaction turning into Ce4+ sites. After that, Ce4+ can be reversibly reduced to Ce3+via the reduction reaction.29,31,32 The redox reaction between CeNPs (sensing element) and ˙OH (analyte) permits the use of the electrochemical technique for the detection of ˙OH.
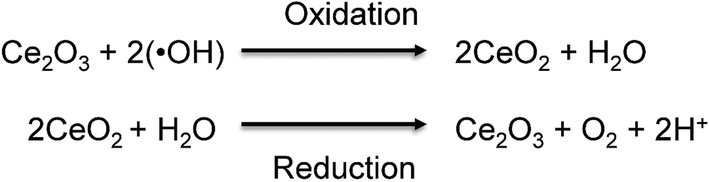 | ||
| Fig. 1 Redox reaction between CeNPs and hydroxyl radicals (˙OH). Reprinted from S. Duanghathaipornsuk, F. A. O. Alateeq, S. S. Kim, D.-S. Kim and A. C. Alba-Rubio, The effects of size and content of cerium oxide nanoparticles on a composite sensor for hydroxyl radicals detection, Sens. Actuators, B, 321, 128467, Copyright (2020), with permission from Elsevier.33 | ||
As Ce3+ sites are responsible for the reaction with ˙OH, several research groups have seeked to maximize the concentration of Ce3+ sites on CeNPs to improve their ˙OH scavenging capacity.33,34 In order to minimize the size of CeNPs, and thus, maximize the amount of Ce3+ sites for ˙OH scavenging and detection, we employed Surface Organometallic Chemistry (SOMC) to obtain nanosized CeOx.35,36 We hypothesized that the size and dispersion of the CeOx nanoclusters could be adjusted by controlling the loading of the organometallic precursor. Even though the size and dispersion of the CeOx nanoclusters could be controlled, the conductivity of the electrochemical sensor is also essential to provide a high sensitivity. For this reason, we decided to anchor CeOx nanoclusters onto a highly-conductive carbon using a SOMC method.37,38 The successful development of a supersensitive composite sensor for ˙OH detection is expected to help understand the relationship between the ˙OH concentration and some oxidative stress-related diseases, which in turn would facilitate more effective prevention and treatments.
Materials and methods
Materials
Tris(cyclopentadienyl)cerium(III) was purchased from Strem Chemicals, Inc. Vulcan XCmax 22 highly-conductive carbon and tetrahydrofuran (99.9%, extra pure, anhydrous, stabilized with BHT) were obtained from Cabot, USA and ACROS Organics, USA, respectively. Potassium hexacyanoferrate(II) trihydrate (98.5–102.0%), potassium hexacyanoferrate(III) (>99%), iron(II) sulfate heptahydrate (>99%), potassium chloride (>99%), and a 30 wt% hydrogen peroxide solution were obtained from Sigma-Aldrich (USA). Screen-printed carbon electrodes (Pine Instruments, USA) coated with a 2 mm-diameter carbon working electrode, a Ag/AgCl reference electrode, and a carbon counter electrode were used as the sensor base. Cyclic voltammetry (CV) and electrochemical impedance spectroscopy (EIS) were performed using a Gamry Reference 600 potentiostat (Gamry Instruments, USA).Acid treatment of carbon support
Highly-conductive Vulcan XCmax 22 carbon was treated with a 5 M HNO3 aqueous solution under reflux (105 °C) for 6 h to functionalize the surface with carboxyl groups. After that, the acid-treated carbon was filtered and washed with deionized water until the pH was around 7. Then, the sample was dried in an oven at 60 °C for 12 h.Anchorage of the CeOx nanoclusters to the acid-treated carbon
Prior to the synthesis of the CeOx nanoclusters/carbon composite, the acid-treated carbon was dried at 105 °C under vacuum for 24 h. Then, the CeOx organometallic precursor was anchored to the carboxyl groups using a SOMC method. To do so, a calculated mass of tris(cyclopentadienyl)cerium(III) was dissolved in tetrahydrofuran (THF) under inert atmosphere. This solution was then added to the dried acid-treated carbon and stirred under inert atmosphere for total uptake (color disappearance). After 6 h of stirring, the flask was connected to a Schlenk line to remove THF. Subsequently, the dried solid product was treated at 400 °C for 2 h under nitrogen for ligands removal (Fig. S1†). Finally, the product was collected and used later as the sensing element for the detection of ˙OH.Characterization of the CeOx nanoclusters/carbon composites
The success of the acid treatment and the anchorage of the CeOx precursor to the carbon surface was confirmed using an FTS-4000 Varian Excalibur Series Fourier-transform infrared (FTIR) spectrometer in the range of 800–3800 cm−1. For that, we used 5 mg of a blended powder containing the sample and KBr (1![[thin space (1/6-em)]](https://www.rsc.org/images/entities/char_2009.gif) :300 wt ratio) to make a thin pellet. Moreover, the samples were characterized using a TA Instruments Q50 thermogravimetric analyzer (TGA) to determine the required temperature to remove the ligands of the CeOx precursor. To do so, 12 mg of sample was heated from 25 to 1200 °C with a heating ramp of 10 °C min−1 under 50 mL min−1 N2 flow. The size and the dispersion of the CeOx nanoclusters on the carbon surface were studied by high-angle annular dark-field scanning transmission electron microscopy (HAADF-STEM) with collection angles of 106–200 mrad using a FEI Titan3™ G2 60–300 S/TEM and by energy dispersive X-ray spectroscopy (EDS) elemental mapping using a probe-corrected Thermo Scientific Themis-Z™ STEM. For that, the composite powders were dispersed in ethanol followed by sonication for 10 min. After that, the dispersion was dropped onto 300-mesh copper TEM grids coated with lacey carbon films. The actual loading of cerium (as CeOx nanoclusters) on the carbon support was determined by inductively coupled plasma optical emission spectrometry (ICP-OES) at Galbraith Laboratories, Inc. Finally, the surface contents of Ce3+ and Ce4+ were determined from spectra obtained in a Kratos Axis Ultra XPS with a monochromatic Al X-ray source operating at 10 mA and 15 kV.
:300 wt ratio) to make a thin pellet. Moreover, the samples were characterized using a TA Instruments Q50 thermogravimetric analyzer (TGA) to determine the required temperature to remove the ligands of the CeOx precursor. To do so, 12 mg of sample was heated from 25 to 1200 °C with a heating ramp of 10 °C min−1 under 50 mL min−1 N2 flow. The size and the dispersion of the CeOx nanoclusters on the carbon surface were studied by high-angle annular dark-field scanning transmission electron microscopy (HAADF-STEM) with collection angles of 106–200 mrad using a FEI Titan3™ G2 60–300 S/TEM and by energy dispersive X-ray spectroscopy (EDS) elemental mapping using a probe-corrected Thermo Scientific Themis-Z™ STEM. For that, the composite powders were dispersed in ethanol followed by sonication for 10 min. After that, the dispersion was dropped onto 300-mesh copper TEM grids coated with lacey carbon films. The actual loading of cerium (as CeOx nanoclusters) on the carbon support was determined by inductively coupled plasma optical emission spectrometry (ICP-OES) at Galbraith Laboratories, Inc. Finally, the surface contents of Ce3+ and Ce4+ were determined from spectra obtained in a Kratos Axis Ultra XPS with a monochromatic Al X-ray source operating at 10 mA and 15 kV.
Deposition of the CeOx nanoclusters/carbon composite onto the screen-printed carbon electrode (SPCE)
First, 10 mg of the CeOx nanoclusters/carbon composite was suspended in 10 mL of deionized water. Then, the solution was sonicated for 1 h and deposited onto the working electrode by delivering a single droplet (8 μL) using a micropipette. The droplet was then dried in an oven at 60 °C for 1 h. Once dried, the sensor was rinsed with deionized water and dried by gently flowing nitrogen. The CeOx nanoclusters/carbon-modified electrode was then used for the detection of ˙OH in the Fenton reaction and for the in vitro detection of ˙OH from preosteoblast cells.Use of the CeOx nanoclusters/carbon-modified electrode for the detection of ˙OH produced by the Fenton reaction
The Fenton reaction was used to generate ˙OH for testing the sensor. To do so, equal volumes of a solution of H2O2 and a solution of FeSO4·7H2O were used to generate ˙OH via the reduction of H2O2 in the presence of Fe2+ ions, in which the concentration of ˙OH was varied from 0.1 to 10 mM. Then, the CeOx nanoclusters/carbon-modified electrode was put into the Fenton reaction, and the interaction between the electrode and ˙OH was characterized by cyclic voltammetry (CV). The potential range selected for CV was from 0.4 to −0.6 V with a 100 mV s−1 scan rate. The first cycle of CV was carried out by submerging the electrode in the H2O2 solution. After that, the electrode was removed from the solution, and then an equal volume of the iron(II) sulfate solution was added to the H2O2 solution to generate ˙OH. Then, the electrode was immersed in the solution of H2O2 and FeSO4·7H2O to detect ˙OH. The current changes in the modified electrode before and after generating ˙OH were measured and referred to the presence of ˙OH.Use of the CeOx nanoclusters/carbon-modified electrode for the in vitro detection of ˙OH in preosteoblast cells
Preosteoblast cells (MC3T3) from newborn mouse bone tissue were obtained from the American Type Culture Collection (ATCC). A growth medium consisting of Minimum Essential Medium (MEM) α, nucleosides, 10 vol% of Fetal Bovine Serum (FBS), and 1 vol% of antibiotics and antimycotics was used to culture MC3T3 in an incubator under 5% CO2/air at 37 °C. To collect MC3T3 from the growth media, 4 mL of Trypsin-EDTA solution was added into the cell culture and left undisturbed for 3 min followed by the addition of 10 mL of the growth medium. Then, the solution was centrifuged at 32000 rpm for 15 min to separate MC3T3 from the solution. The collected MC3T3 (∼6 × 10⁶ cells) were resuspended in 1 mL of 0.01 M phosphate-buffered saline (PBS) to detect ˙OH released from MC3T3. The signal from the sensor was analyzed using CV and EIS. For CV and EIS analyses, 200 μL of the MC3T3 suspension was dropped on the surface of the 0.64 wt% Ce/carbon-modified electrode for the first cycle. Subsequent CV and EIS cycles were performed by dropping 100 μL of 0.0003, 0.004, and 0.05 mg mL−1 lipopolysaccharides (LPS) from E. Coli solutions in PBS, respectively, in order to induce additional oxidative stress. To compare the signals obtained from the MC3T3 suspension with the ˙OH signal generated by the Fenton reaction in a PBS solution, 60 mL of a 0.01 M PBS solution containing 10 mM iron(II) sulfate was degassed by flowing argon for 2 h to dissolve FeSO4·7H2O. After that, 1 mL of a 610 mM H2O2 solution in 0.01 M PBS was injected through a septum to produce ˙OH. Then, the 0.64 wt% Ce/carbon-modified electrode was submerged into the Fenton reaction to detect the presence of ˙OH. The experimental conditions for CV were described in the previous section, and the same procedure was used to perform EIS. The impedance changes and phase angle shifts in terms of frequencies in Bode plots were used to identify the presence of ˙OH. All EIS experiments were run in a frequency range of 0.01–10000 Hz with an alternating-current (AC) potential of Vrms = 5 mV and direct-current (DC) potential of 0.23 V.
Results and discussion
Functionalization of carbon by acid treatment
Since carboxyl groups on the carbon surface are used as the grafting points for the anchorage of the CeOx precursor, the highly-conductive carbon was previously functionalized by acid treatment with 5 M HNO3 to increase the number of carboxyl groups. The success of the functionalization was evaluated using FTIR before and after the acid treatment. As shown in Fig. 2, there are no significant bands on the untreated carbon (Fig. 2a). However, the FTIR spectrum of acid-treated carbon (Fig. 2b) shows some emergent bands at 1230 and 1377 cm−1, which can be assigned to the O–H bending deformation and the C![[double bond, length as m-dash]](https://www.rsc.org/images/entities/char_e001.gif) O symmetric deformation of the carboxyl groups, respectively.39,40 Furthermore, it presents two bands at 1580 and 1735 cm−1, which can be attributed to the CC stretching vibration and CO symmetric stretching mode, respectively.41,42 The presence of those four bands after the acid treatment confirms an increase in the number of carboxyl groups on the surface of carbon.
O symmetric deformation of the carboxyl groups, respectively.39,40 Furthermore, it presents two bands at 1580 and 1735 cm−1, which can be attributed to the CC stretching vibration and CO symmetric stretching mode, respectively.41,42 The presence of those four bands after the acid treatment confirms an increase in the number of carboxyl groups on the surface of carbon.
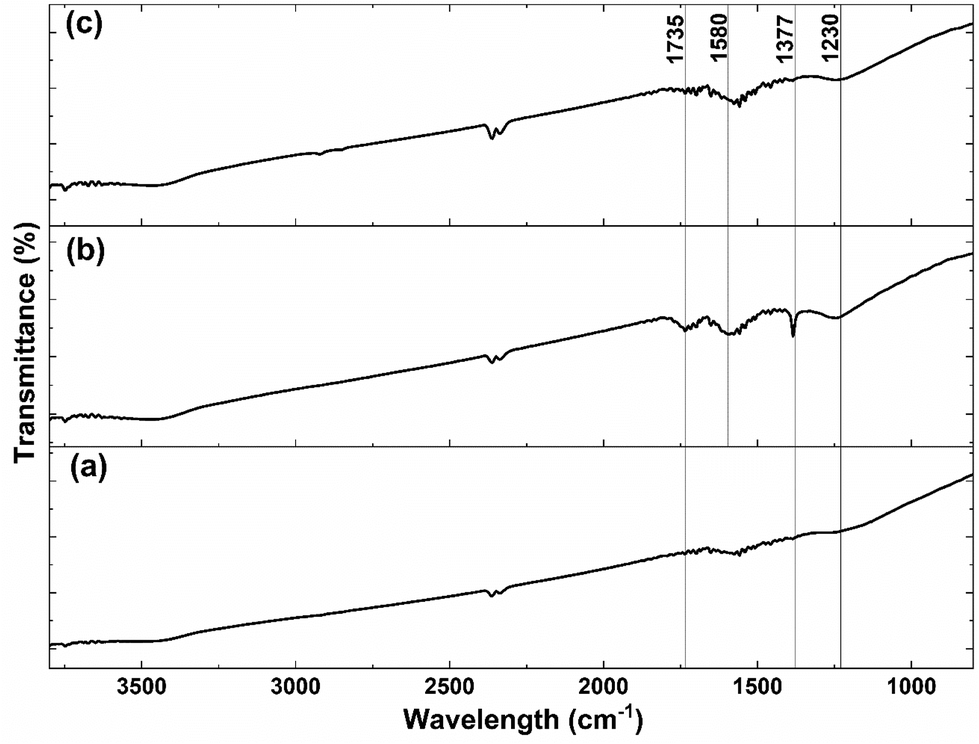 | ||
| Fig. 2 FTIR spectra of (a) carbon, (b) acid-treated carbon, and (c) CeOx nanoclusters/carbon composite (0.64 wt% Ce) after thermal treatment for ligands removal. | ||
Characterization of CeOx nanoclusters/carbon composites
Different characterization techniques were used to assess the effectiveness of the SOMC method for anchoring the CeOx precursor to the carboxyl groups on the carbon surface for the synthesis of the CeOx nanoclusters/carbon composites, as shown in Fig. S1.† FTIR was used again to confirm the anchorage of the CeOx precursor to the carboxyl groups. When comparing Fig. 2b and c, it can be observed that the intensity of the bands at 1230, 1377, 1580, and 1735 cm−1 significantly decreases after performing SOMC, which indicates the consumption of the carboxyl groups by the CeOx organometallic precursor to form CeOx nanoclusters on the carbon surface upon ligands removal by thermal treatment (Fig. S1†).Once confirmed the anchorage of the CeOx precursor on the carbon surface, we synthesized a series of composites with different loadings of tris(cyclopentadienyl)cerium(III), and these were labelled as X wt% Ce/Carbon, where X wt% Ce represents the theoretical Ce loading. Then, prior to the thermal treatment for ligands removal (Fig. S1†), we used TGA for further characterization of the materials. Fig. 3 compares the TGA profiles obtained with acid-treated carbon, 12.3, 18.4, and 24.6 wt% Ce/Carbon. As it can be seen in Fig. 3b, the acid-treated carbon shows two significant derivative weight losses at around 100 and 200–300 °C, which can be attributed to the loss of water and the degradation of the carboxyl groups, respectively.43 On the other hand, when the CeOx organometallic precursor is anchored to the carbon surface, there are four significant weight losses at around 100, 300–400, 400–500, and 700–1100 °C. As before, the first one corresponds to the loss of water. The derivative weight losses at 300–400 °C and 400–500 °C could be attributed to the thermal decomposition of the CeOx precursor physisorbed on the surface of the carbon support and the removal of the precursor ligands, respectively. And lastly, the derivative weight loss at 700–1100 °C could be ascribed to the decomposition of the CeOx precursor bound to the carbon surface. With the exception of the evolution of water of hydration at around 100 °C, it is noted that the area under every derivative weight loss increases with the loading of CeOx precursor added (Fig. 3b), which could be attributed to a large fraction of the CeOx precursor anchored to the carboxyl groups on carbon. Additionally, the higher evolution at 300–400 °C (physisorbed precursor) observed with 24.6 wt% Ce/Carbon could be explained as the saturation of the carboxyl groups on carbon due to efficient anchorage of the precursor, as it can be infered by the similar decomposition obtained with 18.4 and 24.6 wt% Ce/Carbon at higher temperatures (700–1100 °C). Therefore, TGA also confirmed the success of the SOMC method. It also helped us select the right temperature (400 °C) for the ligands removal from the CeOx precursor for the generation of the CeOx nanoclusters on the carbon surface (Fig. S1†).
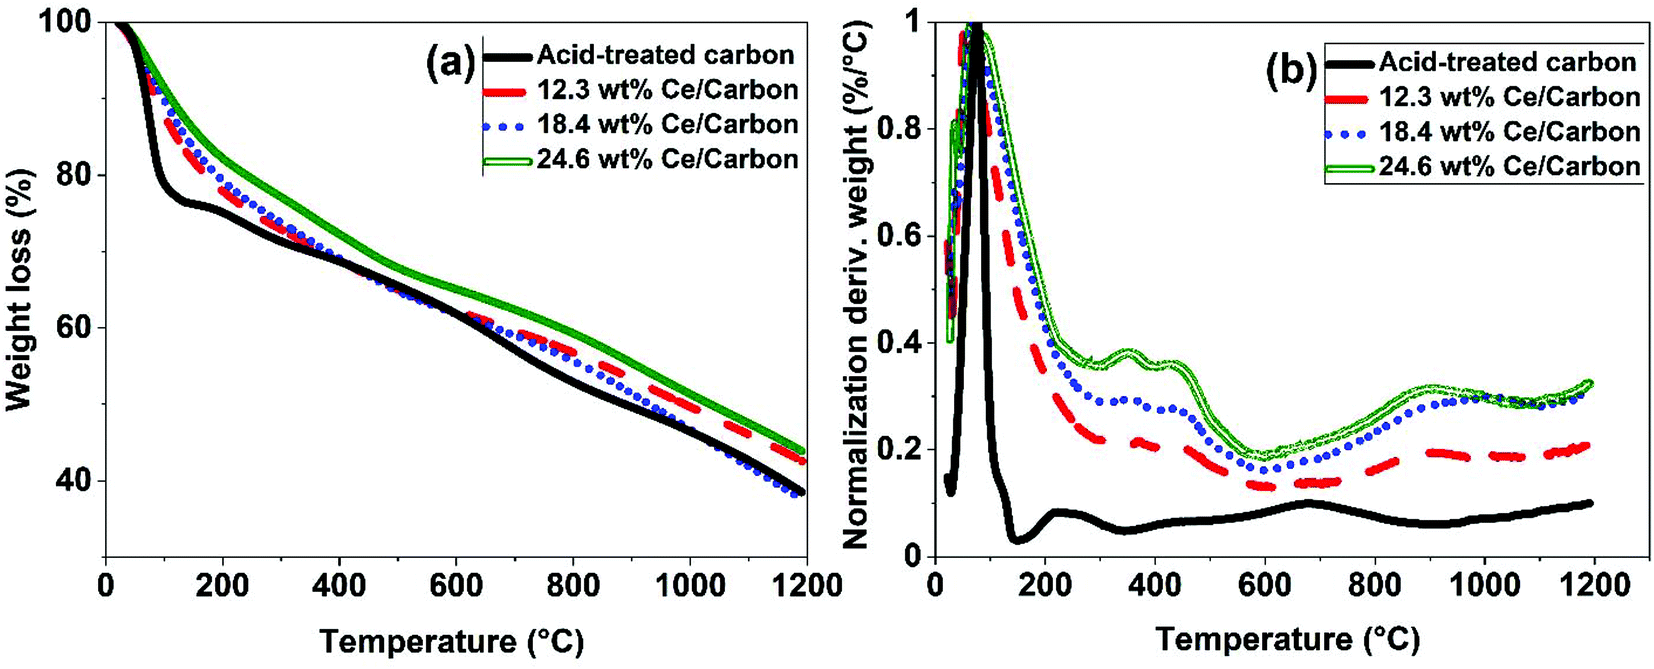 | ||
| Fig. 3 TGA results obtained with acid-treated carbon and 12.3, 18.4, and 24.6 wt% Ce/Carbon composites (before thermal treatment for ligands removal). | ||
ICP-OES was used to determine the actual Ce loading in the form of CeOx nanoclusters on the surface of the carbon support (Table 1). As shown in Table 1, the Ce loading increases with the amount of CeOx precursor added during the synthesis. While there was a good correlation between the theoretical and the actual Ce loadings when using diluted solutions of the CeOx precursor, a lower efficiency on the immobilization of the CeOx precursor was observed at higher loadings (Fig. S2†). For example, for a theoretical Ce loading of 38.9 wt%, the actual loading determined by ICP-OES was of 20.8 wt%, which is 54% lower than the theoretical one. This deviation is likely due to the saturation of the carboxyl groups on the carbon surface for efficient anchorage of the CeOx precursor. As a result, a fraction of the CeOx precursor is regarded weakly adsorbed on the carbon surface without chemically interacting with the support, being this easily decomposed during the thermal treatment for the removal of ligands. This is consistent with the TGA data presented in Fig. 3.
| Sample (theoretical Ce loading) | Actual Ce loading (wt%) |
|---|---|
| 0.64 wt% Ce/Carbon | 0.49 |
| 2.5 wt% Ce/Carbon | 3.34 |
| 18.4 wt% Ce/Carbon | 13.50 |
| 38.9 wt% Ce/Carbon | 20.80 |
As previously stated, it has been reported in the literature that there is a correlation between the concentrations of Ce3+ and Ce4+ species and the size of CeNPs, being the smaller ones richer in Ce3+, which are the active species for ˙OH scavenging and detection.31,44 In order to estimate the amount of active sites in our CeOx nanoclusters/carbon composites, we also characterized them by XPS. Fig. S3† shows the deconvolution of the XPS spectra obtained with the different CeOx nanoclusters/carbon composites. These spectra are composed of two multiplets (u and v) that correspond to the Ce 3d3/2 and Ce 3d5/2 spin–orbit components, respectively. While v0, v′, u0, and u′ represent the characteristic peaks of Ce3+, v, v′′, v′′′, u, u′′, and u′′′ represent those of Ce4+. Table 2 presents a summary of the results obtained from the deconvolution of these spectra, in which the abundance of Ce3+ sites was calculated as ([Ce3+]/([Ce3+] + [Ce4+])) × 100, where [Ce3+] represents the sum of the areas of the Ce3+ peaks (i.e., v0 + v′ + u0 + u′) and [Ce4+] represents the sum of the areas of the Ce4+ peaks (i.e., v + v′′ + v′′′ + u + u′′ + u′′′). As it can be seen in Table 2, there is a clear correlation between the Ce loading and the Ce3+/Ce4+ ratio, which provides additional information about the increased size of the CeOx nanoclusters at higher loadings. Likewise, the 0.64 wt% Ce/Carbon composite showed the highest content of Ce3+ sites due to the smaller size of the CeOx nanoclusters (higher dispersion). Remarkably, the SOMC method allowed us to obtain a Ce3+ content of 46.3%, the highest found in the literature when compared to previous reports that used different synthesis methods.30,45,46 Therefore, it can be concluded that the size of the CeOx nanoclusters increases with the loading of CeOx precursor, likely due to the saturation of the surface and agglomeration of the nanoclusters at higher loadings, which becomes significant on the 38.9 wt% Ce/Carbon composite.
| Sample (theoretical Ce loading) | % Ce3+ | % Ce4+ | Ce3+/Ce4+ |
|---|---|---|---|
| 0.64 wt% Ce/Carbon | 46.3 | 53.7 | 0.86 |
| 2.5 wt% Ce/Carbon | 43.4 | 56.6 | 0.77 |
| 18.4 wt% Ce/Carbon | 42.5 | 57.5 | 0.74 |
| 38.9 wt% Ce/Carbon | 29.0 | 71.0 | 0.41 |
Fig. 4 shows some STEM images of the 0.64 wt% Ce/Carbon (Fig. 4a) and 18.4 wt% Ce/Carbon (Fig. 4b) composites. Even when there is an uniform distribution of CeOx nanoclusters on carbon in both samples, it is evident the high degree of agglomeration and lower dispersion on the 18.4 wt% Ce/Carbon sample (Fig. 4b). This is in agreement with the lower content of Ce3+ observed on the composites with higher CeOx loadings (Table 2). In contrast, we found ultrasmall well-dispersed CeOx nanoclusters on the 0.64 wt% Ce/Carbon sample (Fig. 4a). The high dispersion of the CeOx nanoclusters on that sample was also confirmed by EDS mapping (Fig. S4†).
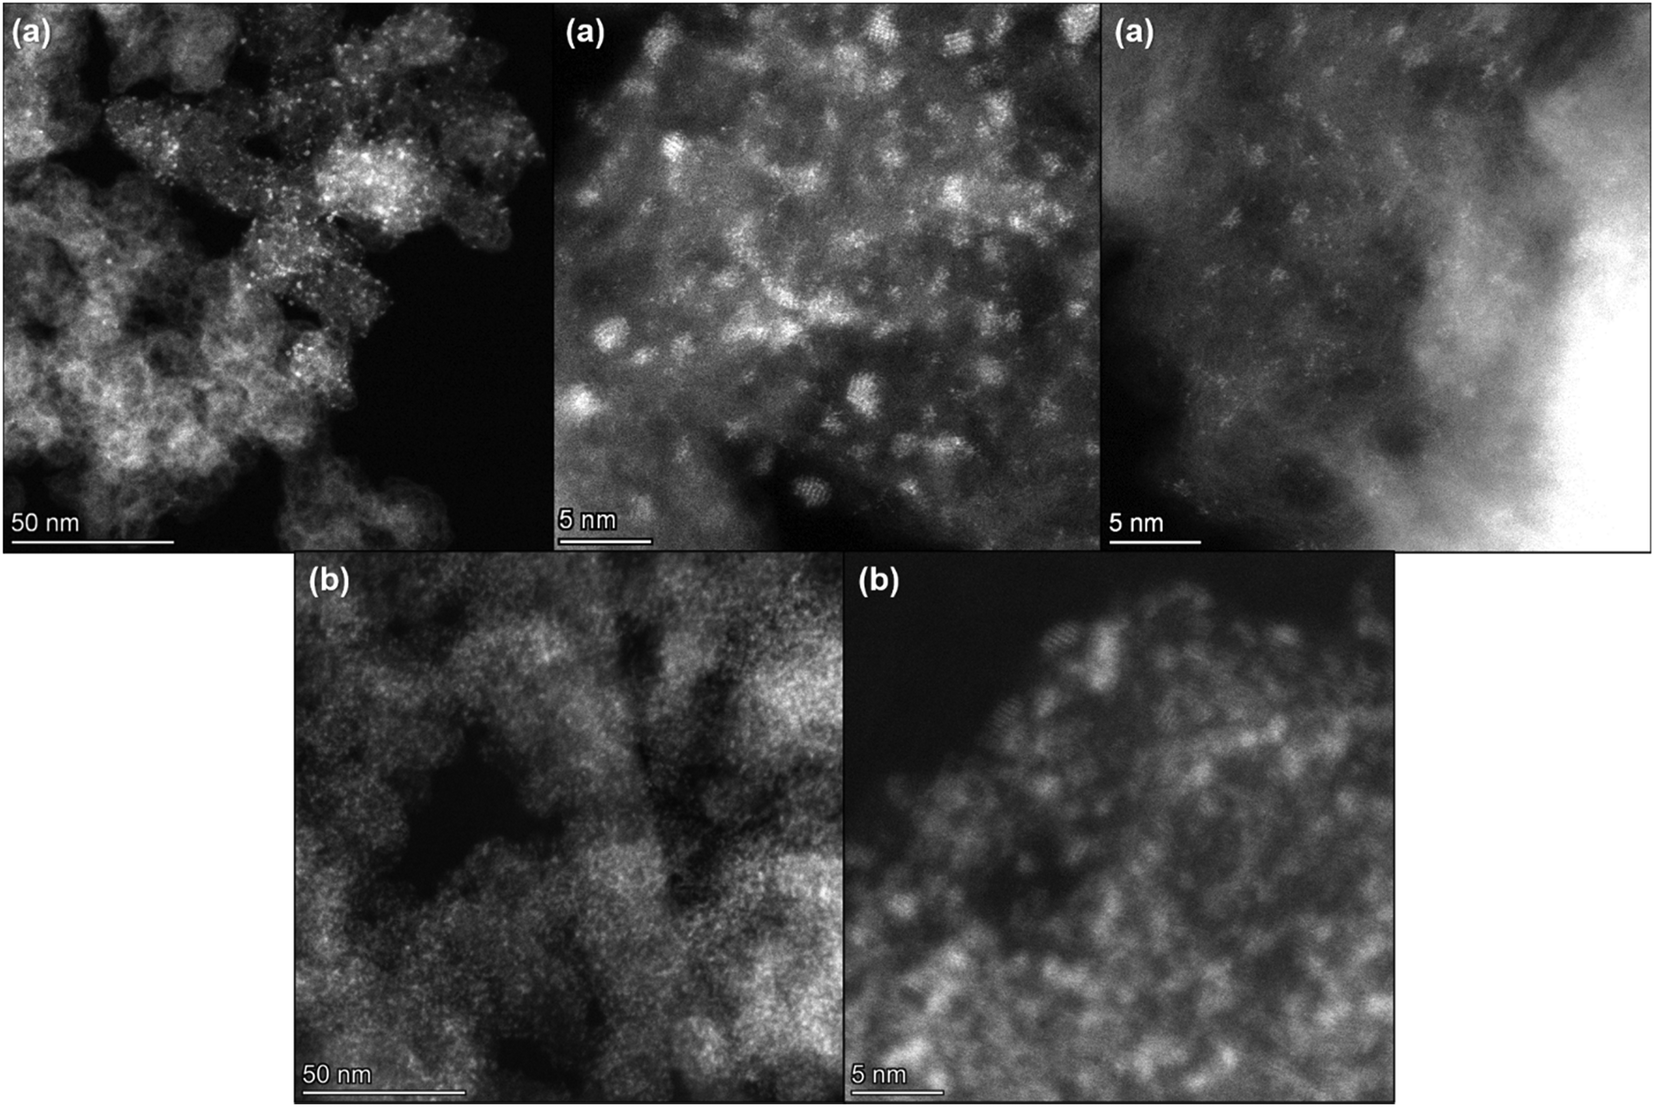 | ||
| Fig. 4 HAADF-STEM images of (a) 0.64 wt% Ce/Carbon and (b) 18.4 wt% Ce/Carbon composites. | ||
Hydroxyl radical detection in the Fenton reaction with the CeOx nanoclusters/carbon-modified sensor
Fig. 5 shows the reduction and oxidation responses (i.e., redox response) in CV. The redox response (ΔA) of the composite sensor was calculated using the current difference between the oxidation and reduction peaks resulted from the redox reaction between CeOx nanoclusters and ˙OH, as described in Fig. 5a. The redox response of the different CeOx nanoclusters/carbon composites to 10 mM ˙OH is shown in Fig. 5b. Interestingly, the composite with the highest loading of CeOx nanoclusters (38.9 wt% Ce/Carbon) showed the lowest redox response, which is due to the larger particle size resulted from agglomeration and the lower content of Ce3+ sites. On the other hand, the 18.4 wt% Ce/Carbon composite showed the highest redox response due to the combination of a high CeOx loading and dispersion (high content of Ce3+ sites).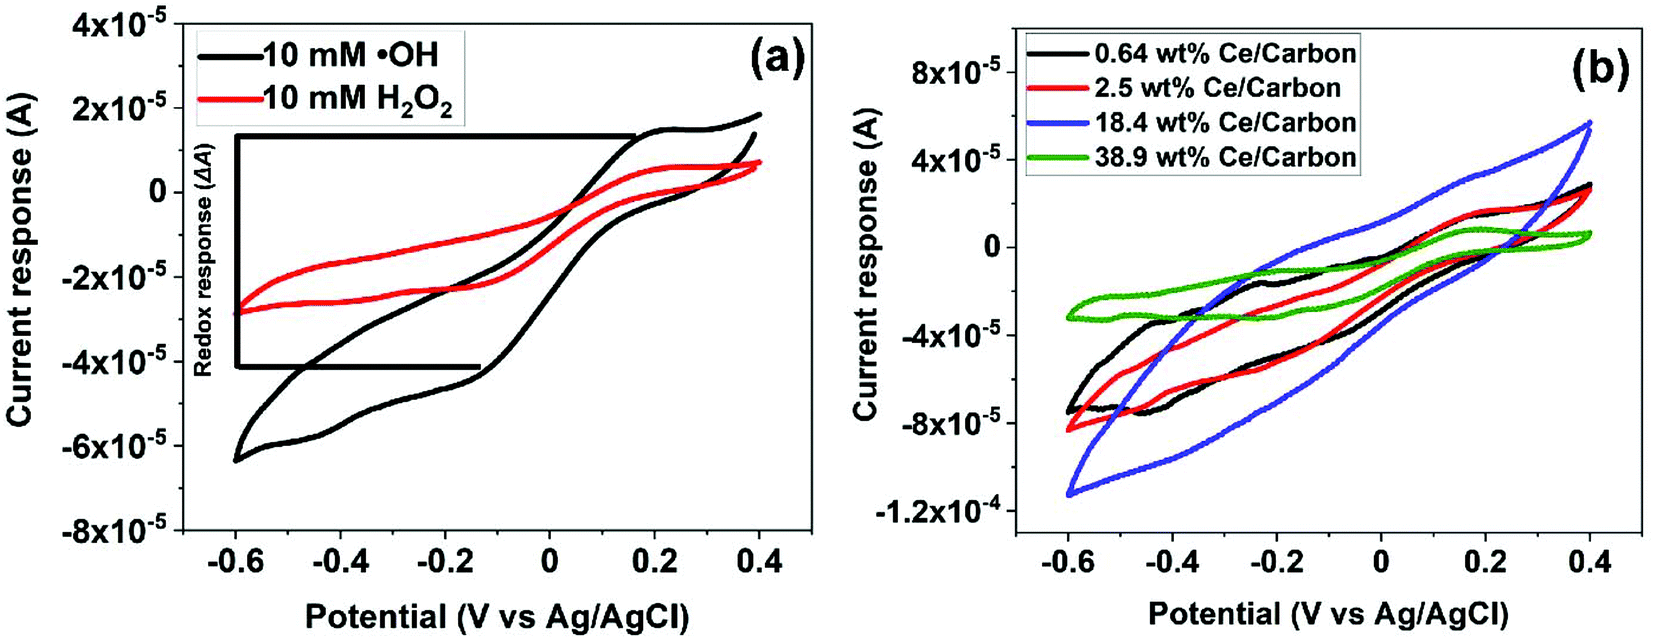 | ||
| Fig. 5 (a) Calculation example of the current response to hydroxyl radicals and (b) CV results of the sensor response toward 10 mM of ˙OH (Fenton reaction) with the different CeOx nanoclusters/carbon composites. | ||
ΔA obtained with the different CeOx nanoclusters/carbon samples have also been plotted in Fig. 6a for easier comparison. As it can be seen, the electrode modified with the highest CeOx loading (38.9 wt% Ce/Carbon) demonstrated a four times lower response (4 × 10⁻⁵ A) than the 18.4 wt% Ce/Carbon composite. As previously stated, the lower redox response can be attributed to the high degree of agglomeration and lower content of Ce3+ sites, as shown in Table 2.
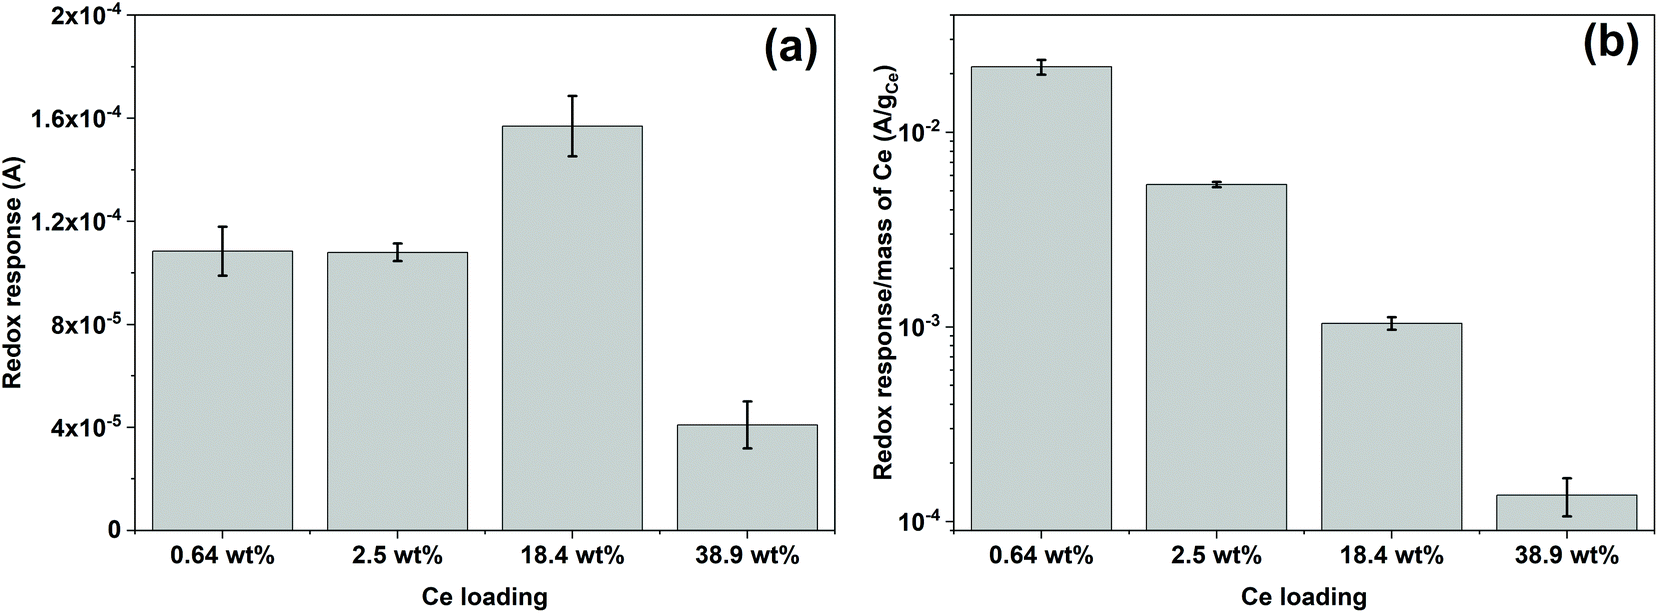 | ||
| Fig. 6 (a) Redox response obtained with the different CeOx nanoclusters/carbon composites toward 10 mM of ˙OH (Fenton reaction) and (b) redox response normalized per mass of cerium on the composite. The error bars represent the standard deviation of three repetitive measurements. | ||
It should be noted that even though the 2.5 and 18.4 wt% Ce/Carbon composites present similar Ce3+ contents, 43.4 and 42.5%, respectively, the latter resulted in a much higher redox response (1.6 × 10⁻⁴ A) compared to that obtained with the 2.5 wt% Ce/Carbon composite (1.1 × 10⁻⁴ A). This is due to the higher loading of CeOx nanoclusters that provide a larger number of Ce3+ active sites to interact with ˙OH. In order to compare the efficiency of the different composites for the detection of ˙OH, ΔAs in Fig. 6a were normalized per mass of Ce on the composite, and plotted in Fig. 6b. Even when the highest sensor response was obtained with the 18.4 wt% Ce/Carbon composite (Fig. 6a), the 0.64 wt% Ce/Carbon showed to be the most efficient, as it provided the highest reactivity per gram of Ce used (Fig. 6b), which is beneficial from an economic point of view. As shown in Fig. 6b, the ΔA per gram of Ce was of 20 mA g−1 with the 0.64 wt% Ce/Carbon composite, while it was of 0.15 mA g−1 with the 38.9 wt% Ce/Carbon sample, so that means that 1 g of Ce as CeOx nanoclusters on 0.64 wt% Ce/Carbon is 133 times more reactive towards ˙OH than the 38.9 wt% Ce/Carbon composite due to the small size of the CeOx nanoclusters, the higher content of active sites (Ce3+), and the lower degree of agglomeration. As the 0.64 wt% Ce/Carbon composite showed the highest efficiency (ΔA per gram of Ce), we used this material to further investigate the sensor response towards different concentrations of ˙OH generated from the Fenton reaction (Fig. S5†). As it can be seen in Fig. S5,† there are two distinctive regions: a linear relationship at low ˙OH concentrations (0–1 mM) and another that deviates from the linearity at high ˙OH concentrations, likely due to the lack of enough Ce3+ sites (due to the low CeOx loading) for complete ˙OH scavenging and detection. By using the linear relationship at low ˙OH concentrations, we obtained a limit of detection (LOD) as low as 0.6 μM, which is regarded as highly sensitive compared to others reported in the literature, as shown in Table 3.
| Sensor | Linear range (M) | LOD (M) | Ref. |
|---|---|---|---|
| CeNPs/GO-GCE | 1 × 10⁻⁵ to 1 × 10⁻³ | 8.5 × 10⁻⁵ | 33 |
| N–C/AuNPs/DNA/MCH/GCC | 5 × 10⁻⁵ to 5 × 10⁻⁴ | 2.5 × 10⁻⁵ | 47 |
| NPCN/PGE | 1 × 10⁻⁶ to 1 × 10⁻⁵ | 1.0 × 10⁻⁶ | 48 |
| Graphene/Au/Cys-PP-Zn2+ | 1 × 10⁻⁷ to 1 × 10⁻⁴ | 1.0 × 10⁻¹⁰ | 49 |
| Ce/carbon/GCE | 1 × 10⁻⁵ to 1 × 10⁻³ | 6.0 × 10⁻⁷ | This work |
In vitro detection of hydroxyl radicals in preosteoblast cells with the CeOx nanoclusters/carbon-modified sensor
The efficacy of the 0.64 wt% Ce/Carbon-modified electrode was also assessed in vitro with preosteoblast cells from newborn mouse bone tissue (MC3TC). As shown in Fig. S6,† the CV results showed a current response in the presence of MC3T3, which is attributed to be due to the generation of ˙OH from the cells. It is thought that MC3T3 cells were under oxidative stress due to the unfavorable conditions of centrifugation, transfer, and CV and EIS in the buffer solution, which caused the cells to generate ROS. As Wang et al. reported, due to the short lifetime of ˙OH, it seems difficult for the intercellular ˙OH to diffuse out of the cell membrane.49 It is thought that relatively stable ROS, such as superoxide (˙O2−), penetrates the cell membrane and ˙OH is generated extracellularly. In order to induce additional oxidative stress for MC3T3 and to boost the production of ˙OH extracellulary, we added 0.01 mg mL−1 of LPS and recorded the sensor response.49 As shown in Fig. S6,† upon the addition of LPS, the redox response increased as the sensor detected the additional generation of ˙OH. This increase in the current response is attributed to the generation of ˙OH, and not to the presence of LPS, as the LPS curve showed a negligible response comparable to that of the PBS buffer solution.In terms of the sensor selectivity, the 0.64 wt% Ce/Carbon-modified electrode also showed a distinctive response toward ˙OH when compared to a similar oxidizing chemical as H2O2. As shown in Fig. 7, the pattern of the phase angle change for ˙OH generated from the Fenton reaction is significantly different than that for H2O2. It is concluded that our composite sensor is not only highly sensitive, but it is also able to distinguish ˙OH from another similar oxidizing chemical such as H2O2. It is noted that MC3T3 + LPS shows a similar pattern of phase angle shift as ˙OH generated from the Fenton reaction, which confirms the detection of ˙OH released from the cells. For ˙OH, phase angle shifts occur at 0.06 and 0.3 Hz (Fenton reaction) and 0.16 and 0.6 Hz (cell + LPS), whereas only a shift was observed at 0.5 Hz for H2O2.
 | ||
| Fig. 7 Phase shifts in Bode plots for the electrochemical impedance spectroscopy (EIS) results obtained with the 0.64 wt% Ce/Carbon-modified electrode in the presence of PBS, LPS, H2O2, Fenton reaction, MC3T3, and MC3T3 + LPS (additional induced oxidative stress). | ||
In order to further study the induced oxidative stress in MC3T3 by the addition of LPS, CV was performed in the presence of different concentrations of LPS: 0.0001, 0.001, and 0.01 mg mL−1. These low concentrations were chosen to promote the oxidative stress and the generation of ˙OH without significant cells death.50 As previously stated, these experiments were carried out sequentially by the addition of further volumes of LPS solutions in PBS. Thus, the first CV curve was recorded after dropping 200 μL of MC3T3 in PBS onto the electrode. For the second one, 100 μL of a 0.0003 mg mL−1 LPS solution in PBS was added onto the previous droplet (200 μL) to reach an overall concentration of 0.0001 mg mL−1 LPS. Likewise, for the third cycle, 100 μL of a 0.004 mg mL−1 LPS solution in PBS was added onto the previous droplet (300 μL) to achieve a concentration of 0.001 mg mL−1 LPS. Finally, for the fourth cycle, 100 μL of a 0.05 mg mL−1 LPS solution in PBS was added onto the previous droplet (400 μL) to make a final concentration of 0.01 mg mL−1 LPS. As expected, the current response increased with the addition of LPS (Fig. 8a) as a result of the increased generation of ˙OH due to the additional induced oxidative stress of MC3T3. In order to account for the dilution effect on the second, third, and fourth cycles, Fig. 8b shows the current response normalized by the concentration of MC3T3, which was calculated in terms of the number of cells per droplet volume in every cycle. As it can be seen in Fig. 8b, the 0.64 wt% Ce/Carbon-modified electrode was able to detect the increased concentration of ˙OH in MC3T3 by the addition of LPS. It is noted that the sensor produced a proportional redox response to the increase of LPS, rising by 1.9 × 10⁻⁹ A per count per μL every time that the LPS concentration was increased in an order of magnitude. These results demonstrate the high sensitivity and selectivity of the sensor for the in vitro detection of ˙OH in biological systems.
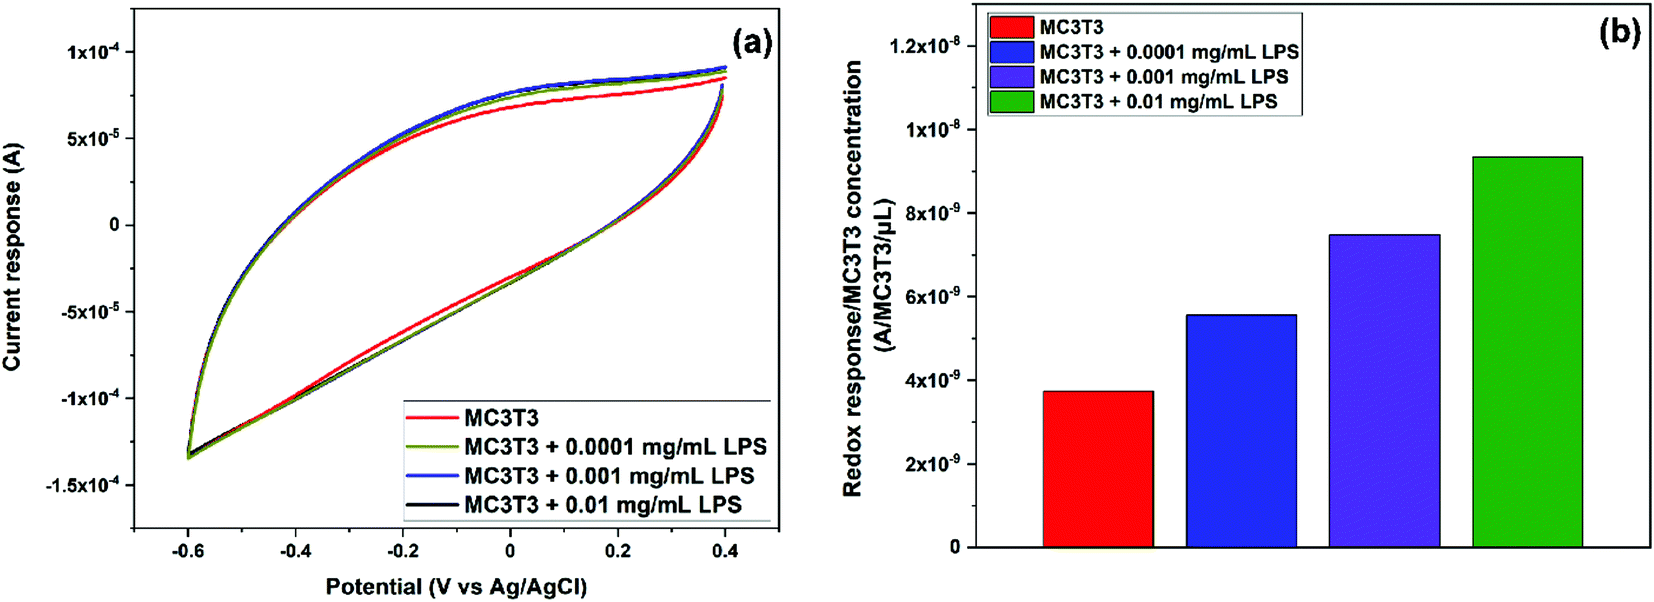 | ||
| Fig. 8 (a) CV results of the sensor response to MC3T3 and MC3T3 with three different concentrations of LPS (additional induced oxidative stress) with the 0.64 wt% Ce/Carbon composite and (b) Normalized current response by the concentration of MC3T3 (MC3T3 count per μL). | ||
Conclusions
We developed a highly sensitive CeOx nanoclusters/carbon-based electrochemical sensor for the detection of ˙OH. Surface organometallic chemistry (SOMC) was successfully used to anchor CeOx nanoclusters with a high content of Ce3+ sites (46.34%) to the surface of a highly-conductive carbon to produce a composite to be used as the sensing element for the electrochemical sensor. While the 18.4 wt% Ce/Carbon composite provided the largest current response toward ˙OH, another composite with a much lower CeOx loading (0.64 wt% Ce/Carbon) showed the highest sensitivity per mass of cerium used. The 0.64 wt% Ce/Carbon-modified sensor provided a limit of detection (LOD) as low as 0.6 μM of ˙OH. It was concluded that CeOx nanoclusters with a high content of Ce3+ sites can be effectively used for the electrochemical detection of ˙OH. In terms of selectivity, this sensor demonstrated the ability to differentiate ˙OH from a similar oxidizing chemical such as H2O2, which is essential for its use in complex systems. Remarkably, this sensor was successfully used for the direct detection of ˙OH from preosteoblast cells of mouse tissue with induced oxidative stress. The ability of this sensor to detect ˙OH in situ in the micromolar range paves a way to the use of the proposed technology in the diagnosis and treatment of oxidative stress-related diseases. It could be also used in other industrial applications, such as fuel–cell, food, cosmetic and pharmaceutical industries.Conflicts of interest
There are no conflicts to declare.Acknowledgements
This material is based upon work supported by the National Science Foundation under Grant No. 1817294. Electron microscopy was performed at the Center for Electron Microscopy and Analysis (CEMAS) at The Ohio State University. The authors are also thankful to G. Alba for the design of the graphical abstract.References
- T. M. Nolte, T. Nauser and L. Gubler, Phys. Chem. Chem. Phys., 2020, 22, 4516–4525 RSC.
- J. Chen, X. Yan, C. Fu, Y. Feng, C. Lin, X. Li, S. Shen, C. Ke and J. Zhang, ACS Appl. Mater. Interfaces, 2019, 11, 37779–37786 CrossRef CAS.
- S. Manoharan, G. J. Guillemin, R. S. Abiramasundari, M. M. Essa, M. Akbar and M. D. Akbar, Oxid. Med. Cell. Longevity, 2016, 2016, 1–15 CrossRef.
- G. Tse, B. P. Yan, Y. W. F. Chan, X. Y. Tian and Y. Huang, Front. Physiol., 2016, 3, 1–11 Search PubMed.
- J. M. Fontmorin, R. C. Burgos Castillo, W. Z. Tang and M. Sillanpää, Water Res., 2016, 99, 24–32 CrossRef CAS.
- G. Lyngsie, L. Krumina, A. Tunlid and P. Persson, Sci. Rep., 2018, 8, 1–9 CrossRef CAS.
- M. Cheng, G. Zeng, D. Huang, C. Lai, P. Xu, C. Zhang and Y. Liu, Chem. Eng. J., 2016, 284, 582–598 CrossRef CAS.
- F. C. Moreira, R. A. R. Boaventura, E. Brillas and V. J. P. Vilar, Appl. Catal., B, 2017, 202, 217–261 CrossRef CAS.
- A. Panchenko, J. Membr. Sci., 2006, 278, 269–278 CrossRef CAS.
- A. Glasauer and N. S. Chandel, Biochem. Pharmacol., 2014, 92, 90–101 CrossRef CAS.
- B. Wachowicz, B. Olas, H. M. Zbikowska and A. Buczyński, Platelets, 2002, 13, 175–182 CrossRef CAS.
- A. V. Crowe, A. McArdle, F. McArdle, D. M. Pattwell, G. M. Bell, G. J. Kemp, J. M. Bone, R. D. Griffiths and M. J. Jackson, Nephrol., Dial., Transplant., 2007, 22, 1177–1183 CrossRef CAS.
- J. F. Curtin, M. Donovan and T. G. Cotter, J. Immunol. Methods, 2002, 265, 49–72 CrossRef CAS.
- X. Li, S. Hao, A. Han, Y. Yang, G. Fang, J. Liu and S. Wang, J. Mater. Chem. B, 2019, 7, 4008–4016 RSC.
- V. J. Thannickal and B. L. Fanburg, Am. J. Physiol.: Lung Cell. Mol. Physiol., 2000, 279, 1005–1028 CrossRef.
- T. Sakai, J. Imai, T. Ito, H. Takagaki, M. Ui and S. Hatta, Biochem. Biophys. Res. Commun., 2017, 482, 1183–1189 CrossRef CAS.
- P. Poprac, K. Jomova, M. Simunkova, V. Kollar, C. J. Rhodes and M. Valko, Trends Pharmacol. Sci., 2017, 38, 592–607 CrossRef CAS.
- W. Ahmad, B. Ijaz, K. Shabbiri, F. Ahmed and S. Rehman, J. Biomed. Sci., 2017, 24, 1–10 CrossRef.
- A. Umeno, V. Biju and Y. Yoshida, Free Radic. Res., 2017, 51, 413–427 CrossRef CAS.
- B. Zhang, J. Chen, B. Liu and D. Tang, Biosens. Bioelectron., 2015, 69, 230–234 CrossRef CAS.
- Y. Lin, Q. Zhou, J. Li, J. Shu, Z. Qiu, Y. Lin and D. Tang, Anal. Chem., 2016, 88, 1030–1038 CrossRef CAS.
- J. Tang, X. Chen, J. Zhou, Q. Li, G. Chen and D. Tang, Analyst, 2013, 138, 4327–4333 RSC.
- M. Yuan, X. Guo, N. Li, Q. Li, S. Wang, C. Liu and H. Pang, Sens. Actuators, B, 2020, 320, 128556 CrossRef CAS.
- S. Duanghathaipornsuk, E. J. Farrell, A. C. Alba-Rubio, P. Zelenay and D.-S. Kim, Biosensors, 2021, 11, 30 CrossRef.
- Y. Cheng, X. Xiao, X. Guo, H. Yao and H. Pang, ACS Sustainable Chem. Eng., 2020, 8, 8675–8680 CrossRef CAS.
- Y. Zhang, S.-Y. Lu, Z. Shi, Z. L. Zhao, Q. Liu, J.-C. Gao, T. Liang, Z. Zou and C. M. Li, Nanoscale, 2019, 11, 4471–4477 RSC.
- A. Gupta, S. Das, C. J. Neal and S. Seal, J. Mater. Chem. B, 2016, 4, 3195–3202 RSC.
- A. L. Popov, S. I. Zaichkina, N. R. Popova, O. M. Rozanova, S. P. Romanchenko, O. S. Ivanova, A. A. Smirnov, E. V. Mironova, I. I. Selezneva and V. K. Ivanov, RSC Adv., 2016, 6, 106141–106149 RSC.
- Y. Xue, Q. Luan, D. Yang, X. Yao and K. Zhou, J. Phys. Chem. C, 2011, 115, 4433–4438 CrossRef CAS.
- I. Celardo, M. De Nicola, C. Mandoli, J. Z. Pedersen, E. Traversa and L. Ghibelli, ACS Nano, 2011, 5, 4537–4549 CrossRef CAS.
- P. Trogadas, J. Parrondo and V. Ramani, ACS Appl. Mater. Interfaces, 2012, 4, 5098–5102 CrossRef CAS.
- J. M. Perez, A. Asati, S. Nath and C. Kaittanis, Small, 2008, 4, 552–556 CrossRef CAS.
- S. Duanghathaipornsuk, F. A. O. Alateeq, S. S. Kim, D.-S. Kim and A. C. Alba-Rubio, Sens. Actuators, B, 2020, 321, 128467 CrossRef CAS.
- F. Zhang, P. Wang, J. Koberstein, S. Khalid and S.-W. Chan, Surf. Sci., 2004, 563, 74–82 CrossRef CAS.
- C. Copéret, A. Comas-Vives, M. P. Conley, D. P. Estes, A. Fedorov, V. Mougel, H. Nagae, F. Núñez-Zarur and P. A. Zhizhko, Chem. Rev., 2016, 116, 323–421 CrossRef.
- C. Copéret, A. Fedorov and P. A. Zhizhko, Catal. Lett., 2017, 147, 2247–2259 CrossRef.
- M. J. Lázaro, L. Calvillo, V. Celorrio, J. I. Pardo, S. Perathoner and R. Moliner, in Carbon black: production, properties and uses, ed. I. J. Sanders and T. L. Peeten, Nova Science Publishers, Inc., New York, 2011, pp. 41–68 Search PubMed.
- D. Pantea, H. Darmstadt, S. Kaliaguine and C. Roy, Appl. Surf. Sci., 2003, 217, 181–193 CrossRef CAS.
- T.-T. Zhao, W.-Z. Ge, Y.-X. Nie, Y.-X. Wang, F.-G. Zeng and Y. Qiao, Fuel Process. Technol., 2016, 150, 71–77 CrossRef CAS.
- J. Zhang, L. Chen, H. Yin, S. Jin, F. Liu and H. Chen, Environ. Pollut., 2017, 225, 86–92 CrossRef CAS.
- P. E. Fanning and M. A. Vannice, Carbon, 1993, 31, 721–730 CrossRef CAS.
- S. Mutyala and J. Mathiyarasu, Appl. Biochem. Biotechnol., 2014, 172, 1517–1529 CrossRef CAS.
- S. A. Chernyak, A. S. Ivanov, N. E. Strokova, K. I. Maslakov, S. V. Savilov and V. V. Lunin, J. Phys. Chem. C, 2016, 120, 17465–17474 CrossRef CAS.
- A. Filippi, F. Liu, J. Wilson, S. Lelieveld, K. Korschelt, T. Wang, Y. Wang, T. Reich, U. Pöschl, W. Tremel and H. Tong, RSC Adv., 2019, 9, 11077–11081 RSC.
- K. M. Kumar, M. Mahendhiran, M. C. Diaz, N. Hernandez-Como, A. Hernandez-Eligio, G. Torres-Torres, S. Godavarthi and L. M. Gomez, Mater. Lett., 2018, 214, 15–19 CrossRef CAS.
- S. Deshpande, S. Patil, S. V. N. T. Kuchibhatla and S. Seal, Appl. Phys. Lett., 2005, 87, 133113 CrossRef.
- Y. Huang, A. Sinha, H. Zhao, X. Dang, Y. Zhang and X. Quan, ChemistrySelect, 2019, 4, 12507–12511 CrossRef CAS.
- J. Ouyang, Z.-Q. Li, J. Zhang, C. Wang, J. Wang, X.-H. Xia and G.-J. Zhou, Analyst, 2014, 139, 3416–3422 RSC.
- Z. Wang, K. Yi, Q. Lin, L. Yang, X. Chen, H. Chen, Y. Liu and D. Wei, Nat. Commun., 2019, 10, 1544 CrossRef.
- C. Guo, L. Yuan, J.-G. Wang, F. Wang, X.-K. Yang, F.-H. Zhang, J.-L. Song, X.-Y. Ma, Q. Cheng and G.-H. Song, Inflammation, 2014, 37, 621–631 CrossRef CAS.
Footnote |
| † Electronic supplementary information (ESI) available. See DOI: 10.1039/d1nr00015b |
| This journal is © The Royal Society of Chemistry 2021 |