
 Open Access Article
 This Open Access Article is licensed under a
 Creative Commons Attribution 3.0 Unported Licence
Dual-purpose zinc and silicon complexes of 1,2,3-triazole group substituted phthalocyanine photosensitizers: synthesis and evaluation of photophysical, singlet oxygen generation, electrochemical and photovoltaic properties†
Emre Güzel *
*
Department of Chemistry, Sakarya University, TR54050 Serdivan, Sakarya, Turkey. E-mail: emreguzel_@outlook.com; eguzel@sakarya.edu.tr; Tel: +90-264-295-74-26
First published on 8th April 2019
Abstract
The synthesis, photophysical, singlet oxygen generation, electrochemical and photovoltaic properties of peripheral and axial 1,2,3-triazole group substituted zinc and silicon phthalocyanine complexes with strong absorption in the visible region were described. All novel complexes have been characterized by spectroscopic and electrochemical techniques. All the new compounds are highly soluble in most common organic solvents. The electronic absorption and fluorescence spectral properties of complexes 4 and 5 are investigated. The effects of the triazole group, different metal centers and position of the substituent on the photophysical, electrochemical and photovoltaic properties of the new phthalocyanines were also investigated for the first time in this work. According to the fluorescence measurements, the axially substituted silicon complex (5) showed higher fluorescence quantum yield (ΦF = 0.28) than the peripherally substituted zinc complex (4). In addition, quantum yields for singlet oxygen generation (ΦΔ = 0.32 for silicon complex (4) and ΦΔ = 0.76 for zinc complex (5) in DMSO) were obtained. Electrochemical studies show that complex 5 is present in non-aggregated form as a result of steric hindrance of the axial groups; the LUMO level of this complex is slightly more negative than the conduction band of TiO2 and electron injection might be less effective. Therefore, the power conversion efficiency of 1.30% for a complex 4 based dye-sensitized solar cell (DSSC) is higher than complex 5 (0.90%). Consequently, these zinc and silicon complexes are promising candidates not only for photodynamic therapy but also solar power conversion.
1. Introduction
Triazole groups, especially 1,2,4-triazoles and 1,2,3-triazoles, are important nitrogen heterocycles that have been widely studied as essential structural features of many of the potent azole fungicides.1 In recent years, chemical substances containing the 1,2,3-triazole group have been used as light stabilizers and optical brighteners. 1,2,3-Triazole moieties may be advantageous in binding biological molecular targets as they are stable against metabolic degradation, are capable of hydrogen bonding, and may increase the solubility of the compound.2,3 Although 1,2,3-triazole groups do not occur naturally, synthetic molecules containing 1,2,3-triazole units exhibit a variety of biological activities, and they have been utilized as starting compounds for the synthesis of many heterocycles. The importance of triazolic compounds in medicinal chemistry is undeniable. Triazole derivatives are also produced as a drug under varying different trade names such as anastrozole and letrozole for cancer and fluconazole, albaconazole, voriconazole and isavuconazole for anti-fungal treatment.4 In addition, derivatives containing the 1,2,3-triazole group are used as antinuclear agents, HIV-1 protease inhibitors, human β3-adrenergic receptors, and antituberculosis, antibacterial, miscellaneous, and anticancer agents.5 It is also known that pyridine derivatives form a coordination bond with the TiO2 surface.6 Therefore, the 1,2,3-triazole groups can be used as anchoring groups such as pyridine derivatives for dye-sensitized solar cells (DSSCs) due to these heterocyclic ligands.Phthalocyanines (Pcs) have high chemical and thermal stability, and high molar absorption coefficients and exhibit rich and diverse chemistry as well as specific optical, electronic, structural, and coordination properties. There has been great interest in phthalocyanines for use in photodynamic cancer therapy, especially due to their high absorption coefficient where penetration of light into tissue is optimal. The ability to generate reactive oxygen species, as well as these features that mainly produce singlet oxygen in the photodynamic process, have made suitable candidates for photodynamic therapy. Singlet oxygen is considered to be the primary cytotoxic agent that plays an important role in the photodynamic therapy of cancer. Single oxygen production requires the irradiation of an appropriate wavelength for stimulation of an effective photosensitizer, dissolved molecular oxygen, and a photosensitizer. A promising photosensitizer should have the ability to perform an efficient intersection transition so that it can transfer energy to underground-state molecular oxygen.7,8 Phthalocyanines are the leading photosensitizers with this property. The first step in PDT treatments is to synthesize suitable photosensitizers and to evaluate the photophysical and photochemical properties of this photosensitizers and to test its usability for the PDT. It is a fact that the metal atom coordinated to the phthalocyanine ring can alter the physical and chemical properties of the complex.9 Phthalocyanines with these properties are widely used as photosensitizers in both photodynamic cancer treatment and dye-sensitized solar cell (DSSC) applications.9–12 Particularly zinc and silicon metal coordinated phthalocyanine complexes have been used in the photodynamic therapy of cancer owing to the closed shell, diamagnetic ion (such as Si4+, Zn2+) give both high triplet quantum yields and long lifetimes.13–16 Also due to this diamagnetic metal properties, zinc phthalocyanines that have been studied widely by many groups are very important photosensitizers for DSSC applications. In addition, Zn(II) phthalocyanine complexes are used as photosensitizers owing to their long-lived (>1 ns) singlet excited states. Metal-free porphyrins and phthalocyanines are generally more ineffective photosensitizers than Zn(II) analogs and show a significant decrease in photo-current response due to low excited singlet states (the oxidation potential of free bases are generally more positive whereas the HOMO–LUMO gaps stay similar).17
Chemical structure of substituents which are attached to the peripheral or non-peripheral positions of phthalocyanines significantly change their properties such as absorption behavior and solubility.9,18–23 According to the positions of the substituents, it is readily understood that two different tetra-substituted phthalocyanines differ significantly in their photophysical and photochemical behaviors. Similarly, metal atoms coordinated to the phthalocyanine center are known to alter the electrochemical properties of the compound. The applications of the metallophthalocyanine complexes are almost entirely based on electron transfer reactions due to the 18 π-electron-conjugated system. In many applications of phthalocyanines, it is important to have a good understanding of the redox properties of these compounds.24–26
Taking these properties into consideration, it has focused on non-aggregate complexes as a strategy to explain Pcs in conjunction with the 1,2,3-triazole group to study aggregation, photophysical, singlet oxygen generation, electrochemical and photovoltaic properties. Besides the electrochemical behavior of MPcs was investigated so as to support the proposed structure. Determination of the electrochemical behavior of complexes will be important in assessing the possible use of complexes in different electrochemical fields such as electrocatalysis and electrosensing. In the literature, there are only few studies about the synthesis of 1,2,3-triazole-substituted phthalocyanines,27 despite there are many important studies about 1,2,4-triazole-substituted phthalocyanines.28–31 In addition, photo-physicochemical and electrochemical properties of phthalocyanines have widely known but the examination of these properties have been made for only few of 1,2,3-triazole bearing phthalocyanines. There are no studies examining and comparing all the photophysical, singlet oxygen generation, electrochemical and photovoltaic properties of peripheral substituted zinc and axial substituted silicon phthalocyanine complexes. Also, to the best of our knowledge, there is no report on the utilization of 1,2,3-triazole unit as an anchoring group into a dye molecule for DSSCs. This is the first study using the 1,2,3-triazole group as an anchoring group in DSSCs. Therefore, 1,2,3-triazole-substituted silicon and zinc phthalocyanines were designed and prepared. Also, their photo-physicochemical, electrochemical and photovoltaic properties were investigated.
2. Experimental
The used equipment, materials, and the photophysical, photochemical, electrochemical and photovoltaic parameters were supplied as ESI.†2.1. Synthesis
![[double bond, length as m-dash]](https://www.rsc.org/images/entities/char_e001.gif) C), 1503, 1447 (–NN triazole), 1352 (–C–N triazole) 1232, 1109, 1044, 759, 691, 522. 1H-NMR (300 MHz, CDCl3): δ 7.99 (s, 1H), 7.69 (m, 2H), 7.47 (m, 3H), 4.83 (s, 2H), 3.49 (m, 4H), 1.30 (m, 8H). 13C-NMR (75 MHz, CDCl3): δ 137.16, 129.99 (overlapped 2C signals), 129.06, 120.77 (overlapped 2C signals), 120.39, 70.86, 64.46, 62.98, 32.84, 29.79, 26.13, 25.76. Anal. calc. for C15H21N3O2: C, 65.43; H, 7.69; N, 15.26; O, 11.62; found: C, 65.13; H, 7.39; N, 15.46; O, 11.62. MS MALDI-TOF: m/z 275.82 [M]+.
C), 1503, 1447 (–NN triazole), 1352 (–C–N triazole) 1232, 1109, 1044, 759, 691, 522. 1H-NMR (300 MHz, CDCl3): δ 7.99 (s, 1H), 7.69 (m, 2H), 7.47 (m, 3H), 4.83 (s, 2H), 3.49 (m, 4H), 1.30 (m, 8H). 13C-NMR (75 MHz, CDCl3): δ 137.16, 129.99 (overlapped 2C signals), 129.06, 120.77 (overlapped 2C signals), 120.39, 70.86, 64.46, 62.98, 32.84, 29.79, 26.13, 25.76. Anal. calc. for C15H21N3O2: C, 65.43; H, 7.69; N, 15.26; O, 11.62; found: C, 65.13; H, 7.39; N, 15.46; O, 11.62. MS MALDI-TOF: m/z 275.82 [M]+.![[triple bond, length as m-dash]](https://www.rsc.org/images/entities/char_e002.gif) N), 1602 (Ar–CC), 1564, 1490, 1405 (–NN triazole), 1309 (–C–N triazole), 1254 (R–O–Ar), 1008, 759, 685, 526. 1H-NMR (300 MHz, CDCl3): δ 8.11 (s, 1H), 7.75 (m, 3H), 7.48 (m, 5H), 5.40 (s, 2H). 13C-NMR (75 MHz, CDCl3): δ 161.38, 142.80, 136.88, 135.61, 130.14 (overlapped 2C signals), 129.51, 121.88, 120.87 (overlapped 2C signals), 120.55, 119.74, 117.72, 115.78, 115.37, 108.16, 62.74. Anal. calc. for C17H11N5O: C, 67.77; H, 3.68; N, 23.24; O, 5.31; found: C, 66.04; H, 3.33; N, 23.66; O, 5.55. MS MALDI-TOF: m/z 301.43 [M]+.C), 1487, 1405, 1337 (–C–N triazole), 1232 (R–O–Ar), 1038, 948, 819, 744, 643, 470. UV-Vis λmax (nm) THF: 676, 610, 348. 1H-NMR (300 MHz, CDCl3): δ, ppm 9.18 (s, 4H, Triazole Ar–H), 8.84–7.46 (32H, m, Pc–Ar–H, and Ar–H), 5.75 (8H, s, OCH2). Anal. calc. for C68H44N20O4Zn: C, 64.28; H, 3.49; N, 22.05; O, 5.04; Zn, 5.15; found: C, 64.04; H, 3.33; N, 22.66. MS MALDI-TOF: m/z 1270.50 [M]+.C), 1519, 1433, 1428 (–NN triazole), 1332 (–C–N triazole), 1291, 1024, 909, 736, 645, 573, 530. UV-Vis λmax (nm) THF: 671, 605, 354. 1H-NMR (300 MHz, CDCl3): δ, ppm 9.56 (s, 8H, Pc–Hα), 8.26 (s, 8H, Pc–Hβ), 7.92–7.26 (m, 2H, triazole Ar–H and m, 10H, benzene Ar–H), 4.61–(−1.76) (m, 28H, CH2–O and Aliph. CH). Anal. calc. for C62H56N14O4Si: C, 68.36; H, 5.18; N, 18.00; O, 5.87; Si, 2.58; found: C, 68.04; H, 5.33; N, 18.66. MS MALDI-TOF: m/z 1095.95 [M + 6H]+.
N), 1602 (Ar–CC), 1564, 1490, 1405 (–NN triazole), 1309 (–C–N triazole), 1254 (R–O–Ar), 1008, 759, 685, 526. 1H-NMR (300 MHz, CDCl3): δ 8.11 (s, 1H), 7.75 (m, 3H), 7.48 (m, 5H), 5.40 (s, 2H). 13C-NMR (75 MHz, CDCl3): δ 161.38, 142.80, 136.88, 135.61, 130.14 (overlapped 2C signals), 129.51, 121.88, 120.87 (overlapped 2C signals), 120.55, 119.74, 117.72, 115.78, 115.37, 108.16, 62.74. Anal. calc. for C17H11N5O: C, 67.77; H, 3.68; N, 23.24; O, 5.31; found: C, 66.04; H, 3.33; N, 23.66; O, 5.55. MS MALDI-TOF: m/z 301.43 [M]+.C), 1487, 1405, 1337 (–C–N triazole), 1232 (R–O–Ar), 1038, 948, 819, 744, 643, 470. UV-Vis λmax (nm) THF: 676, 610, 348. 1H-NMR (300 MHz, CDCl3): δ, ppm 9.18 (s, 4H, Triazole Ar–H), 8.84–7.46 (32H, m, Pc–Ar–H, and Ar–H), 5.75 (8H, s, OCH2). Anal. calc. for C68H44N20O4Zn: C, 64.28; H, 3.49; N, 22.05; O, 5.04; Zn, 5.15; found: C, 64.04; H, 3.33; N, 22.66. MS MALDI-TOF: m/z 1270.50 [M]+.C), 1519, 1433, 1428 (–NN triazole), 1332 (–C–N triazole), 1291, 1024, 909, 736, 645, 573, 530. UV-Vis λmax (nm) THF: 671, 605, 354. 1H-NMR (300 MHz, CDCl3): δ, ppm 9.56 (s, 8H, Pc–Hα), 8.26 (s, 8H, Pc–Hβ), 7.92–7.26 (m, 2H, triazole Ar–H and m, 10H, benzene Ar–H), 4.61–(−1.76) (m, 28H, CH2–O and Aliph. CH). Anal. calc. for C62H56N14O4Si: C, 68.36; H, 5.18; N, 18.00; O, 5.87; Si, 2.58; found: C, 68.04; H, 5.33; N, 18.66. MS MALDI-TOF: m/z 1095.95 [M + 6H]+.3. Results and discussion
3.1. Synthesis and characterization
Scheme 1 exhibits the synthetic route of peripherally substituted zinc and diaxially substituted silicon phthalocyanines 4 and 5. Firstly, the 1,3-dipolar cycloaddition reaction of azidobenzene and propargyl alcohol gave the starting material compound 1 in 89% yield. Secondly, 6-((1-phenyl-1H-1,2,3-triazol-5-yl)methoxy)hexan-1-ol (2) was synthesized by treating (1-phenyl-1H-1,2,3-triazol-5-yl)methanol32 (1) with 6-chlorohexan-1-ol in ethanol at reflux temperature utilizing NaOH as the base. Thirdly, (1-phenyl-1H-1,2,3-triazol-5-yl)methanol (1) was treated with 4-nitrophthalonitrile in the presence of anhydrous K2CO3, giving phthalonitrile derivative containing 1,2,3-triazole group (3). Lastly, targeted peripherally substituted zinc (4) and axially substituted silicon complex (5) were prepared using starting materials 2 and 3. For zinc complex, the reaction in the presence of DBU or 1,5-diazabicyclo[4.3.0]non-5-ene (DBN) either in n-hexanol or in bulk is most efficient in comparison to another method. Therefore, ZnPc complex (4) was obtained by utilizing the anhydrous metal salt [Zn(CH3COO)2] in n-hexanol in the presence of DBU at reflux temperature, the reaction color turned dark blue and the reaction was stopped. To obtain a precipitate, the mixture was washed with different amounts of water and methanol. The new axially disubstituted SiPc complex (5) was prepared by heating from silicon phthalocyanine dichloride (SiCl2Pc) and 6-((1-phenyl-1H-1,2,3-triazol-5-yl)methoxy)hexan-1-ol in the presence of NaH in toluene at 120 °C for 6 h. | ||
| Scheme 1 The synthesis of compound 1, 2, phthalonitrile derivative 3 and it's zinc and silicon complexes (4 and 5) (i) NaOH, EtOH, 80 °C. (ii) K2CO3, DMF, 45 °C. (iii) DBU, n-pentanol, Zn(CH3COO)2, 140 °C. (iv) Toluene, NaH, 120 °C. | ||
The complexes 4 and 5 are generally soluble in organic solvents and can be readily purified by column chromatography using silica gel or Al2O3. The structures of the newly synthesized and well-purified compounds were elucidated by UV-Vis, FT-IR, 1H-NMR, 13C-NMR and MS spectroscopic methods. The results show that the synthesized compounds are coherent with the proposed structures.
The presence of 1,2,3-triazole groups in compound 2, phthalonitrile (3) and its zinc and silicon complexes (4 and 5) were confirmed by FT-IR analysis. Unlike 1,2,4-triazole groups, 1,2,3-triazole groups have stretching vibrations belonging to –NN groups instead of –CN, and they appeared around at around 1450 cm−1 like compound 2 in the FT-IR spectrum. Furthermore, the peak at 1352 cm−1 of the compound (2) containing 1,2,3-triazole group proved the presence of –C–N bonds in the structure (Fig. S1†). For compound 3, stretching vibrations of –CN at 2230 cm−1, aliphatic –C–H at 2971–2872 cm−1 and –C–N at 1309 cm−1 appeared at the expected frequencies. Also, the formation of compound 3 was confirmed by the disappearance of the –OH bands at 3372 cm−1 for 1 (Fig. S5†). Cyclotetramerization of the dinitrile 3 was confirmed by the absence of the sharp –CN vibration around 2230 cm−1 after zinc phthalocyanine complex (4) formation (Fig. S9†). Similarly, the formation of silicon phthalocyanine 5 was confirmed by the disappearance of the –OH band at 3372 cm−1 for 2 in the FT-IR spectrum of silicon phthalocyanine 5 (Fig. S12†). Generally, FT-IR spectra for both zinc complex 4 and silicon complex 5 support the structures of the complexes.
The 1H-NMR spectra are also compatible with the structures of the synthesized compounds. The 1H-NMR spectra of compounds 2–5 in CDCI3 gave the characteristic signals for the structures as expected. In the 1H-NMR spectrum of compound 2, one proton belonging to the 1,2,3-triazole ring was observed at 7.99 ppm as a singlet. Benzene protons were observed as multiplet at 7.69–7.47 ppm integrating five protons. Aliphatic protons were observed at 4.83–1.30 ppm (Fig. S2†). In 13C-NMR spectrum of compound 2, the aromatic and aliphatic carbons appeared at 137.16, 129.99 (overlapped 2C signals), 129.06, 120.77 (overlapped 2C signals), 120.39, 70.86, 64.46, 62.98, 32.84, 29.79, 26.13, 25.76 ppm (Fig. S3†). In the 1H-NMR spectrum of compound 3, one proton belonging to the 1,2,3-triazole ring was observed at 8.11 ppm as a singlet. Benzene protons were observed as multiplet at 7.75–7.48 ppm integrating eight protons. One singlet peak for OCH2 integrating two protons observed at 5.40 ppm (Fig. S6†). In 13C-NMR spectrum of compound 3, fifteen aliphatic and aromatic carbons and two nitrile carbons appeared at 161.38, 142.80, 136.88, 135.61, 130.14 (overlapped 2C signals), 129.51, 121.88, 120.87 (overlapped 2C signals), 120.55, 119.74, 117.72, 115.78, 115.37, 108.16, 62.74 ppm (Fig. S7†). The 1H-NMR spectrum of 4 is somewhat broader than the corresponding chemical shifts in the dinitrile derivative 3. 1H-NMR spectra of phthalocyanines are of broad nature, because of the presence of four positional isomers which tend to show similar chemical shifts. The second reason for broad signals is that phthalocyanines show an equilibrium of aggregation and disaggregation. In the 1H-NMR spectrum of zinc complex 4, four protons belonging to the 1,2,3-triazole ring was observed at 9.18 ppm as a singlet. Aromatic benzene protons of phthalocyanine and 1,2,3-triazole rings were observed as multiplet at 8.84–7.46 ppm. One singlet peak for OCH2 integrating eight protons observed at 5.75 ppm (Fig. S10†). The 1H-NMR measurement of silicon phthalocyanine complex 5 showed the expected total number of aliphatic and aromatic protons, confirming the purity of the complex. The 1H-NMR spectrum of silicon phthalocyanine complex 5 showed Hα and Hβ aromatic protons between 9.56 and 8.26 ppm. The other protons belonging to the 1,2,3-triazole ring and benzene protons were observed between 7.92 and 7.26 ppm. Aliphatic protons were observed 4.61–(−1.76) ppm (Fig. S13†). 1H-NMR spectrum of 5, Si–O–CH2 has shifted negative area (−1.76 ppm) because of magnetic anisotropy of phthalocyanine ring.33
The mass spectra of derivatives, which were obtained by MALDI-TOF techniques, confirmed the proposed structures. By using the instrument's reflectron mode to compare the theoretical and experimental monoisotopic m/z values of the compounds and starting materials, the highly resolved signals of each species in the MALDI-TOF mass spectra were well obtained. After evaluation of the MALDI-TOF mass spectra, it was found that the desired starting compounds and complexes were successfully purified using the experimental methods expressed in this study. In addition, it has been found that the synthesized compounds are sufficiently stable to detect structures without significant fragmentation under the conditions of MALDI-MS. The molecular ion peaks were observed at m/z: 275.85 [M]+ for 2 (Fig. S4†), 301.43 [M]+ for 3 (Fig. S8†), m/z: 1270.50 [M]+ for 4 (Fig. 1), 1095.98 [M + 6H]+ for 5 (Fig. S14†).
 | ||
| Fig. 1 The mass spectrum of the 1,2,3-triazole group substituted zinc phthalocyanine (4). | ||
3.2. Photophysical and photochemical studies
![[thin space (1/6-em)]](https://www.rsc.org/images/entities/char_2009.gif) ε = 4.77 and 4.56) and 676, 671 nm (logε = 4.86 and 4.89), respectively (Fig. 2).
ε = 4.77 and 4.56) and 676, 671 nm (logε = 4.86 and 4.89), respectively (Fig. 2).
 | ||
| Fig. 2 Absorption spectra of complexes 4 and 5 in THF (∼2 × 10⁻⁵ mol dm−3). | ||
It is known that the central metal ions in the phthalocyanine macrocycle can change the maximum value of the Q band maximum. In porphyrins present in the same family as phthalocyanine complexes, the blue shift of the Q band differs according to the ionic radius of the central metal ions and the electronegativity. Briefly, a larger electronegativity value or smaller ionic radius results in a shift to blue wavelength.34 It can be seen that the λmax of complex 5 exhibits a blue shift with respect to complex 4 owing to the Si(IV) ion has a smaller radius and larger electronegativity than the Zn(II) ion. As a result, the wavelengths of the Q-band absorption of the MPcs follow the order of Zn > Si (Fig. 2).
When the dyes are adsorbed on the TiO2 film without chenodeoxycholic acid (CDCA) as the co-adsorbent, the Q-band absorption maxima are red shifted by ∼10 nm compared with those in THF solution (Fig. 3). This result indicates that the interaction of 1,2,3-triazole moiety and TiO2 surface, which is similar to that reported in the interaction of the pyridine ring of the D–π–A fluorescent dyes with TiO2 surface.6 The spectrum of dye 4 exhibits the broadened Q-band and a new peak at around 635 nm, demonstrating the existence of molecular aggregates on the semiconductor surface.35 By the addition of the co-adsorbent to the dye solution, the absorption intensity of the new band relative to that of the Q-band remarkable decreased, which suggests that the aggregation of dye 4 on the TiO2 surface was suppressed by CDCA co-sensitization. In contrast, the spectra of dye 5 with and without CDCA show that there is little or no dye aggregation, indicating that the aggregate formation can be effectively hindered by the steric effect of long and flexible axial 1,2,3-triazole group in the molecule.
 | ||
| Fig. 3 UV-Vis absorption spectra of 4 (a) and 5 (b) without and with 1 mM CDCA on TiO2 film. | ||
Aggregation can often be expressed as the superposition of monomers, dimers, and rings in the solvent medium. There are lots of parameters for aggregation in phthalocyanines; concentration, the nature of the solvent, substituents present at the periphery or non-periphery, the metal ion at the macrocyclic core, and the operating temperature. In order to better examine the solubility and aggregation properties of the complexes, the aggregation study was also performed at ambient temperature in THF. The absorption spectra of phthalocyanines 4 and 5 were also obtained at different concentrations and Fig. 4 shows the results for complex 5. Axial substituted silicon phthalocyanine and peripheral substituted zinc phthalocyanine did not aggregate in THF at studied concentrations (Fig. S15†). As the concentration increased, a new band did not form on the high energy side owing to the formation of aggregate species, and the absorption intensity of the Q band was consistent with the Lambert–Beer's law (inset of Fig. 4).
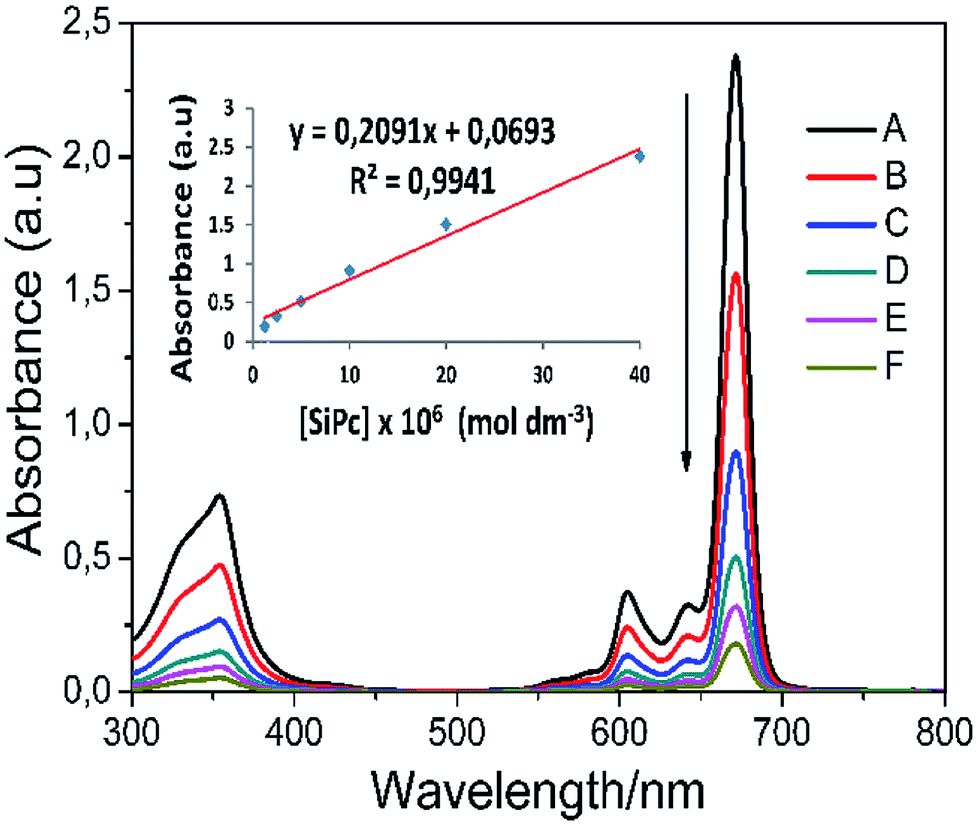 | ||
| Fig. 4 Electronic absorption spectra of complex 5 in THF at different concentrations: (A) 40 × 10−6, (B) 20 × 10−6, (C) 10 × 10−6, (D) 5 × 10⁻⁶, (E) 2.5 × 10⁻⁶ (F) 1.25 × 10⁻⁶ mol dm−3. The inset shows the calibration plot for Q band maximum. | ||
Solvents may interact with absorbing species in the solution, which changes the absorption wavelength. This interaction depends on the polarity of the solvent, the refractive index, the coordination power and the chemical structure of the solute. In general, the Q band wavelength of the phthalocyanine in the solvent shows red-shifting by increasing the refractive index of the solvent. This can best be defined by the Franck–Condon principle. According to this principle, the refraction index and the polarity of the solvent suggest that the species in the solvent can change the absorption wavelength. Thus, it is estimated that the Q band wavelength in a specific solvent is only related to the refractive index of the solvent, unless the solvent reacts with the species in the solution or induces any reaction. The electronic absorption spectra of complex 5 in different organic solvents (DMSO, DMF, CH2CI2, and CHCI3) and the plot of the Q band frequency versus the function (n2 − 1)/(2n2 + 1), where n is the refractive index of the solvent,36 are shown in Fig. 5. It can be seen that the Q band frequencies exhibit a linearly dependent on this function which proposes the Q band wavelength changes directly as the solvation rather than coordination.
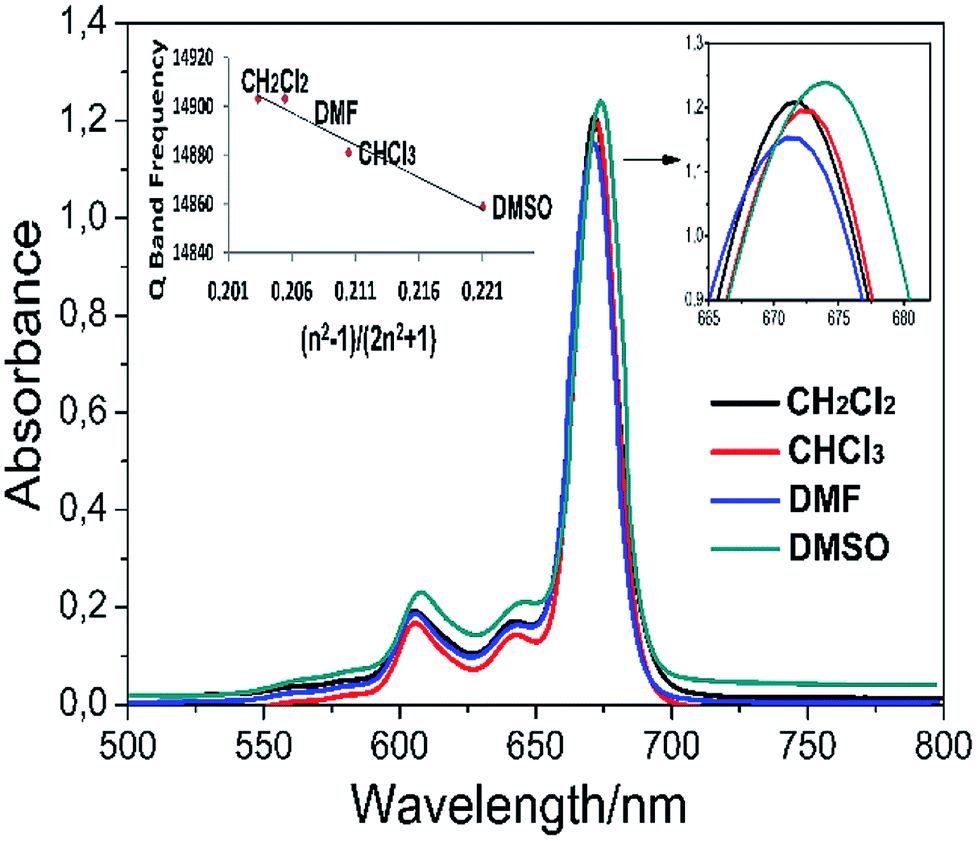 | ||
| Fig. 5 Absorption spectra of complex 5 in various solvents (∼15 × 10−6 mol dm−3). The inset exhibits a plot of the Q band frequency of complex 5 against the function (n2 − 1)/(2n2 + 1), where n is the solvents' refractive index. | ||
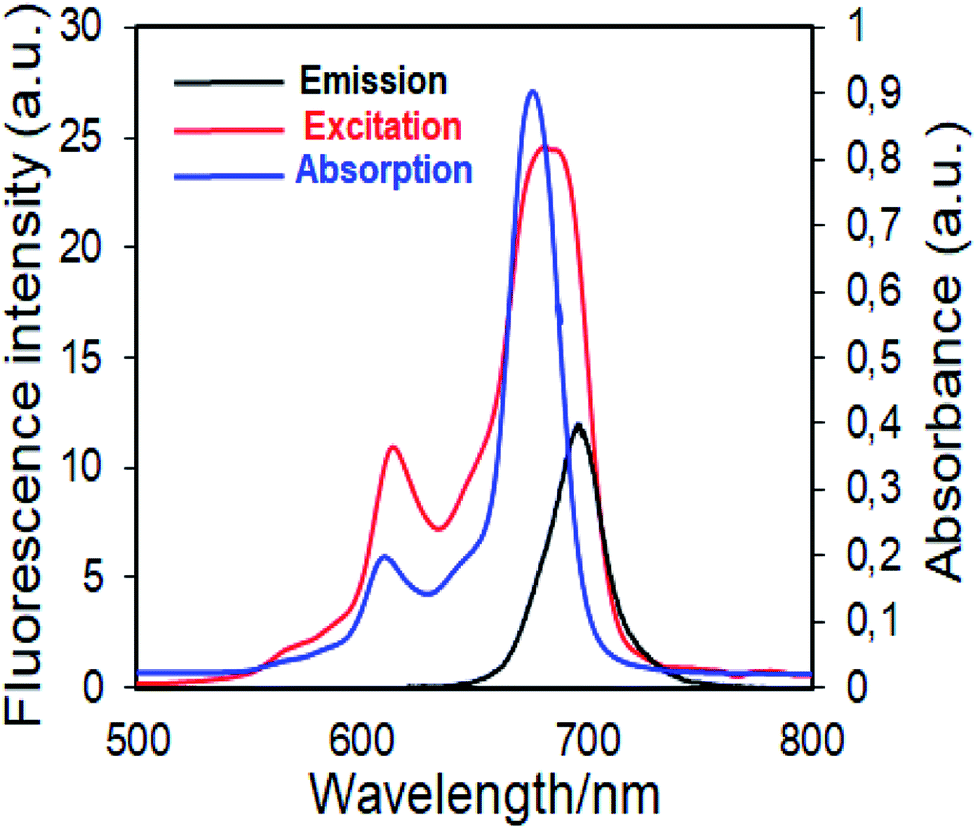 | ||
| Fig. 6 Electronic absorption, fluorescence emission and excitation spectra of 4 in DMSO. (Excitation wavelength = 697 nm.) | ||
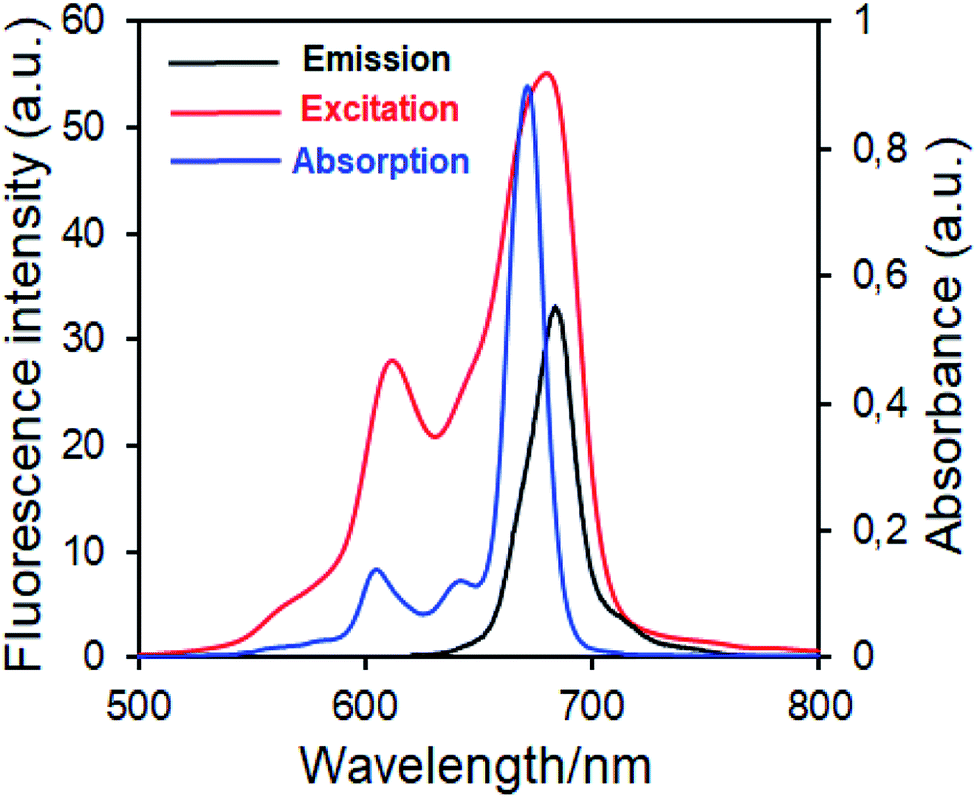 | ||
| Fig. 7 Electronic absorption, fluorescence emission and excitation spectra of 5 in DMSO. (Excitation wavelength = 686 nm.) | ||
Fluorescence emission maxima were observed at 691 nm for complex 4, 679 nm for compound 5 in DMSO. Stokes shifts from the complexes were detected to be in the same region as the standard phthalocyanines. However, in the case of wavelength results, the excitation spectra of the complexes 4 and 5 were slightly red-shifted when compared to the absorption spectra, suggesting that the nuclear configurations change the following excitation.
Fluorescence quantum yields of synthesized phthalocyanine complexes were determined using a comparative method. The standards used were ZnPc (ΦF = 0.18 (ref. 37)) for complex 4 in DMSO. The 1,2,3-triazole group containing silicon(IV) complex (5) showed higher ΦF values than zinc(II) complex (4). Although the ΦF value of 5 (SiPc) was higher than standard unsubstituted ZnPc and is lower than unsubstituted SiPc(Cl)2 in DMSO.38 Furthermore, the silicon complex (5) shows a higher fluorescence quantum yield than zinc complexes containing 1,2,4-triazole group in the literature,29 showing the superiority of the silicon complex over complexes containing similar groups. Fluorescence results revealed that phthalocyanines having the similar substituent; the silicon complex (5) showed a higher fluorescence quantum yield than the zinc complex (4) due to relatively less aggregation in DMSO solution.38
In order to show that the peripherally and axially 1,2,3-triazole group substituted zinc and silicon phthalocyanines are acceptable as useful photosensitizers, the phthalocyanines solution were prepared in a DPBF containing a DMSO solution. Careful control experiments have been carried out to remove other potential sources of media that can effect the absorption decrease. The spectral changes during singlet oxygen determination for complex 4 were given in Fig. 8. No significant change was observed in the absorption spectrum of phthalocyanines when kept in the dark for 21 seconds. (Fig. 8 for zinc complex 4, Fig. S16† for silicon complex 5.)
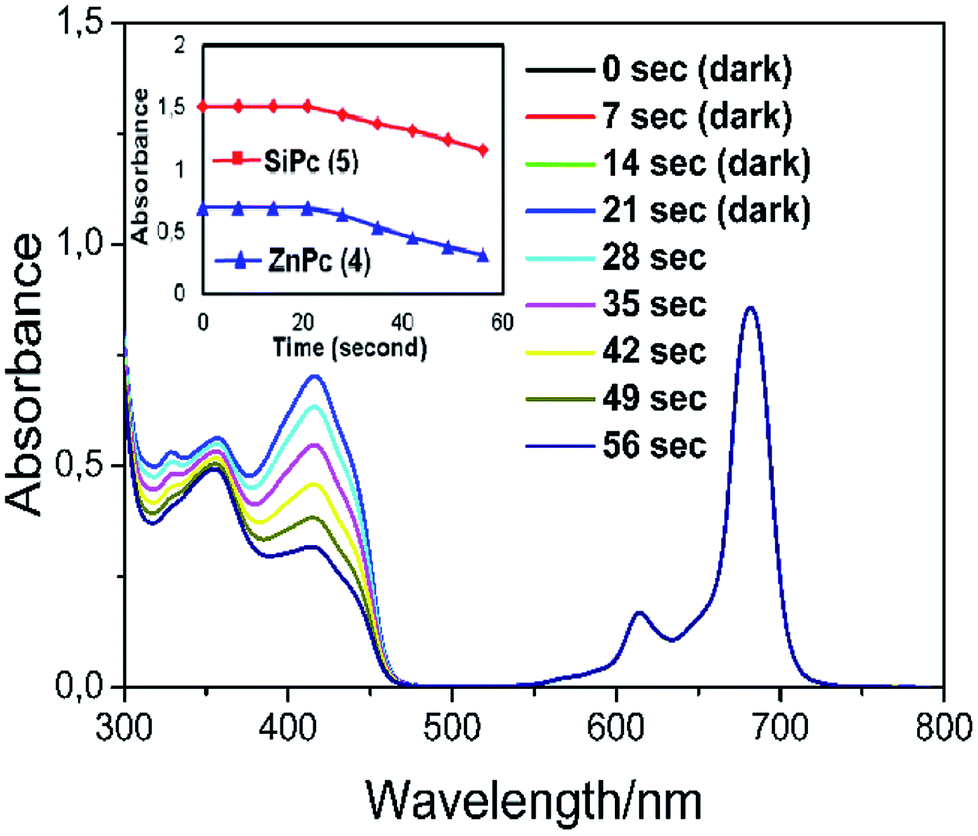 | ||
| Fig. 8 The reaction of singlet oxygen formed by zinc phthalocyanine complex (4) dissolved in DMSO with 1,3-diphenyl-isobenzofuran (DPBF). For the first 21 s, the solution was kept in the dark; thereafter, it was irradiated with a light source (650 nm cut-on filter) for 35 s. The total volume of the solution was set to be 3 mL. The absorption spectra were recorded every 7 seconds. The inset shows plot for DPBF absorbance in phthalocyanine solutions (4 and 5) versus irradiation time (second). | ||
Furthermore, the absorption peak belonging to the capture compound DPBF disappeared rapidly within 56 seconds in the irradiation red-light (with 650 nm cut-on filter) on phthalocyanine solutions. The Q band intensity of studied zinc and silicon phthalocyanine complexes did not show any changes during the ΦΔ determinations, confirming that this complex did not degrade using light irradiation during singlet oxygen studies. The ΦΔ values were found 0.76 for zinc complex (4) and for 0.32 silicon complex (5). The ΦΔ value of zinc phthalocyanine complex is 0.76 and this value is higher than the ΦΔ value (ΦΔ = 0.67 (ref. 39)) of respective unsubstituted ZnPc reference in DMSO. Similarly, the ΦΔ value of silicon phthalocyanine complex is 0.32 and this value is higher than the ΦΔ value (ΦΔ = 0.15 (ref. 38)) of respective unsubstituted SiPc(Cl)2 reference in DMSO. Compared to complexes containing similar triazole substituents in the literature,29,40 the zinc complex (4) exhibited a slightly higher singlet oxygen quantum yield value. Consequently, the substitution of the Pc core with 1,2,3-triazole groups increased the generation of singlet oxygen which is very functional for the usability of these Pcs as photosensitizers for PDT applications.
3.3. Electrochemical studies
The redox behaviors and energy levels of dyes 4 and 5 were investigated by using cyclic voltammetry (CV) and square wave voltammetry (SWV) measurements (Fig. 9) and the relevant data are listed in Table 2, along with some optical properties. It can be seen that dyes 4 and 5 show three and four redox processes, respectively. Compared with dye 4, dye 5 is not only more hardly oxidized but also more easily reduced owing to the tetra positive nature of silicon.41 The redox processes of dye 4 are considerably broad, implying that the presence of aggregated species due to the differences in the redox potentials of aggregated and nonaggregated species.42 In contrast, the redox processes of dye 5 are not broad. This may be due to the absence of aggregated species owing to its nonplanar nature. On the other hand, the oxidation potentials (O1) corresponding the HOMO levels of the dyes are more positive than that of the I−/I3− redox couple (0.4 V vs. NHE), guaranteeing efficient dye regeneration.43 The LUMO value of dye 4 is much more negative than the conduction band (CB) of TiO2 (−0.5 V vs. NHE), insuring efficient electron injection from the excited state of the dye to the TiO2 surface. However, the LUMO level of dye 5 is slightly more negative than the CB of TiO2 and electron injection might be less effective.44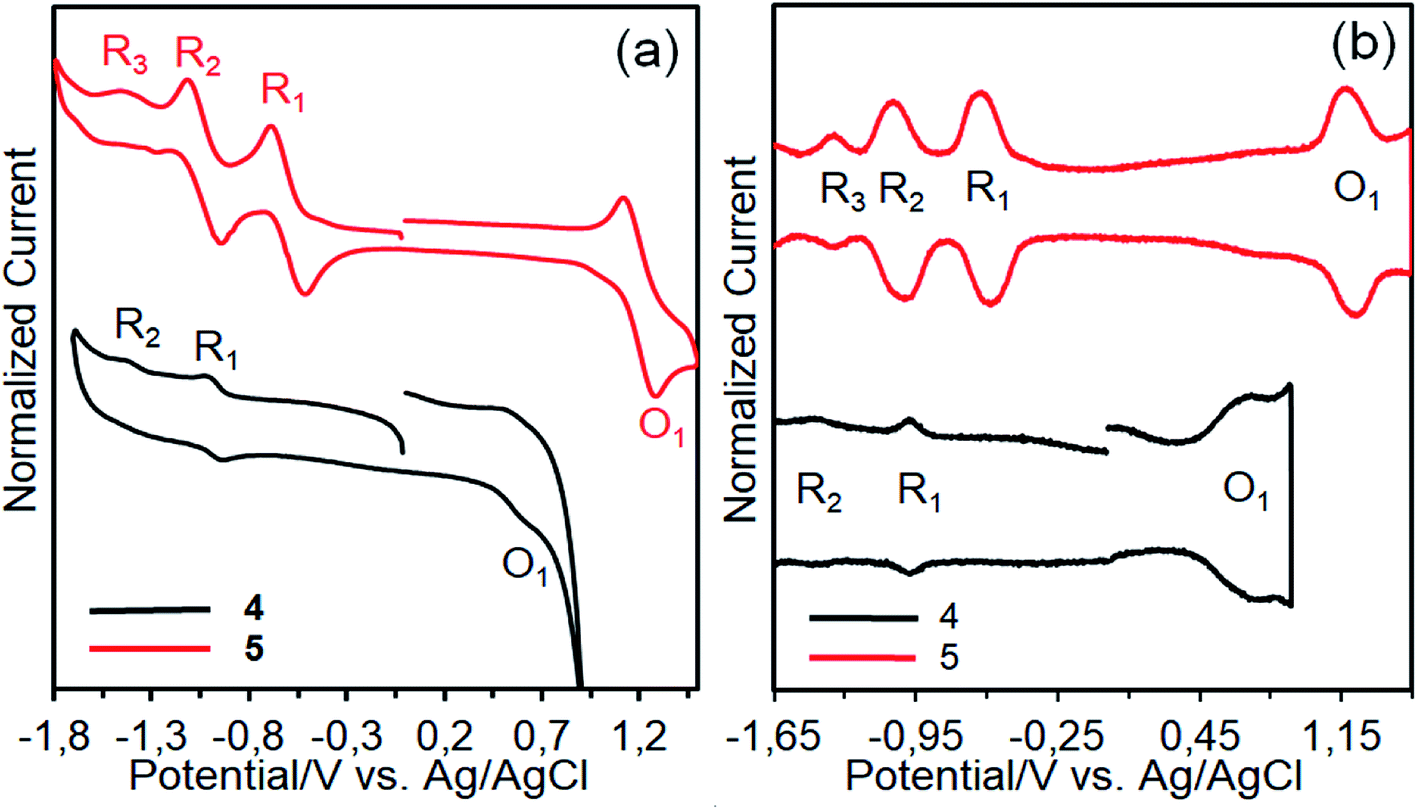 | ||
| Fig. 9 CVs (a) and SWVs (b) of dyes 4 and 5 on a GCE in TBABF4/DMSO. | ||
| Dye | λonseta (nm) | E0–0b (eV) | EHOMOc (V) | ELUMOd (V) |
|---|---|---|---|---|
| a Absorption onset wavelength (λonset) in THF solution.b The E0–0 (band gap) was calculated from the λonset using E0–0 = 1240/λonset.c The EHOMO was taken from the E1/2 of the O1 process in Fig. 9. The E1/2 of Fc/Fc+ was found to be 0.54 V, vs. Ag/AgCl. By comparing this value with that of 0.63 V vs. NHE, the potentials vs. Ag/AgCl can be converted to that vs. NHE by adding a value of 0.09 V.d The ELUMO was estimated with the formula ELUMO = EHOMO − E0–0. | ||||
| 4 | 699 | 1.77 | 0.65 | –1.12 |
| 5 | 687 | 1.80 | 1.26 | –0.54 |
3.4. Photovoltaic studies
Fig. 10 shows the J–V curves and IPCE spectra of the DSSCs based on 4 and 5 dyes fabricated in the absence and presence of 1 mM CDCA and their photovoltaic parameters are listed in Table 3. All the parameters presented are at optimum conditions. In the absence of CDCA, the short circuit current density (JSC) of 3.44 mA cm−2 and power conversion efficiency (PCE) of 0.96% for dye 4 based DSSC are slightly higher than dye 5 (JSC = 2.41 mA cm−2 and PCE = 0.84%). The photovoltaic performance of the former could be attributed to its red-shift absorption and higher dye loading on the TiO2 surface.45 This result revealed that the presence of four anchoring groups in the molecular structure of dye 4 results in a more efficient electron injection process into the TiO2 than its counterpart of two anchoring groups because the former provides a more effective binding onto the TiO2 surface, which is consistent with the increased dye loading.46 On the other hand, the dye 5 molecule can be bonded to the TiO2 surface by only one of the axial anchoring groups. The open-circuit voltage (VOC) of the dye 5 based device is higher than the dye 4 cell, indicating the suppression of charge recombination. Apparently, one of the axial groups, which is unable to bind to the TiO2 surface, favors to the improvement of VOC because this bulky group can block the I3− ions in the electrolyte from approaching the TiO2 surface, thus reducing the charge recombination rate.47 In the presence of CDCA, the cell based on dye 4 showed the highest PCE of 1.30%, which is a 35% improvement compared with the cell without CDCA. It indicates that this dye forms strong aggregates on the TiO2 surface in the absence of CDCA. In contrast, co-adsorption of dye 5 with CDCA increased the PCE (0.90%) of DSSC by around 7%, suggesting that the degree of molecular aggregations was very few. This result demonstrates that the introduction of sterically hindered substituents such as long and flexible axial 1,2,3-triazole units in the dye structures can expeditiously suppress aggregation, owing to disturbance of the π–π stacking.48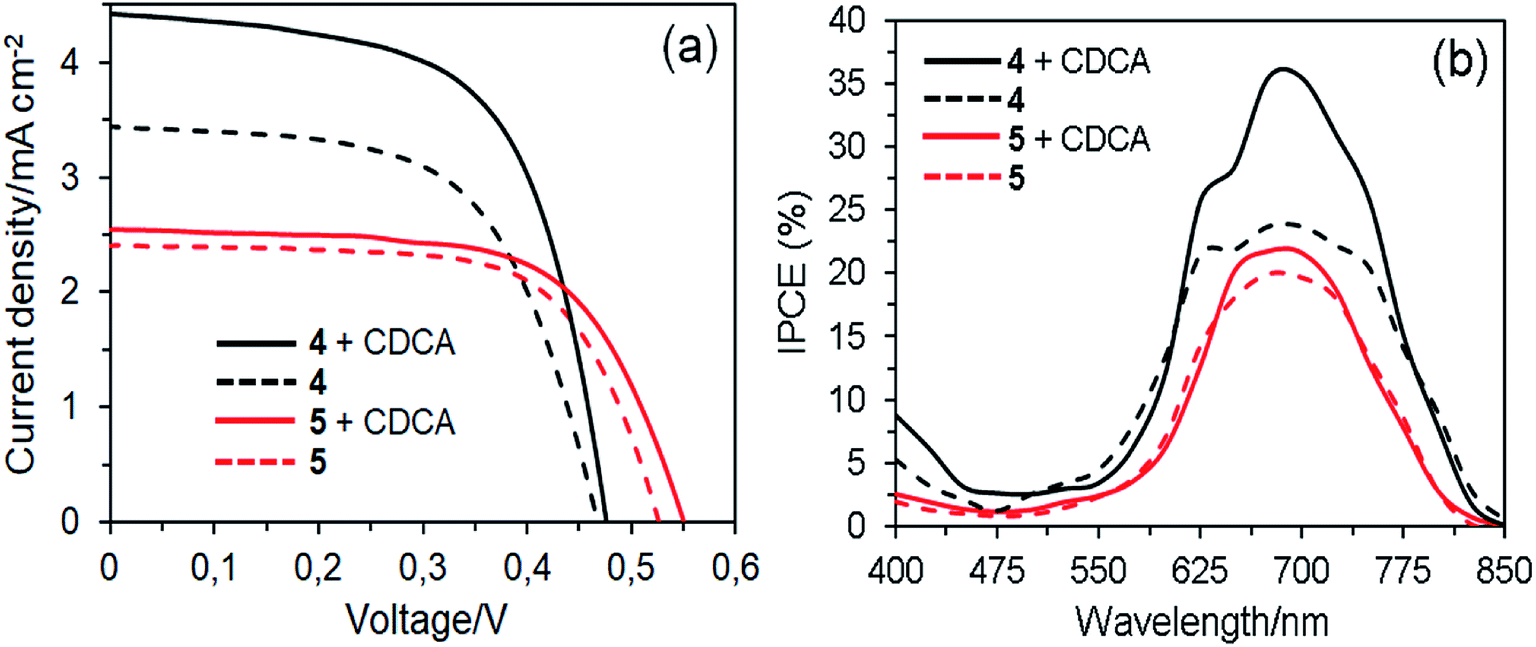 | ||
| Fig. 10 J–V curves (a) and IPCE spectra (b) of the DSSCs based on dyes 4 and 5 with and without CDCA. | ||
| Dye | CDCA (mM) | IPCE integrated current density (mA cm−2) | JSC (mA cm−2) | VOC (V) | FF | PCE (%) | Dye-loaded amount (mol cm−2) |
|---|---|---|---|---|---|---|---|
| 4 | 0.00 | 3.48 | 3.44 | 0.467 | 0.60 | 0.96 | 3.69 × 10⁻⁸ |
| 4 | 1.00 | 4.39 | 4.42 | 0.475 | 0.62 | 1.30 | 3.07 × 10⁻⁸ |
| 5 | 0.00 | 2.40 | 2.41 | 0.526 | 0.66 | 0.84 | 2.86 × 10⁻⁸ |
| 5 | 1.00 | 2.48 | 2.53 | 0.550 | 0.65 | 0.90 | 2.68 × 10⁻⁸ |
The difference in JSC was further confirmed by IPCE spectra, as a function of the incident light wavelength (Fig. 10b and Table 3). In good agreement with absorption spectra on the TiO2 films, the IPCE spectra for DSSCs based on dye 4 are broader than those of dye 5. In the absence of CDCA, the highest IPCE values of DSSCs based on dyes 4 and 5 are 23% and 19% at about 690 nm, respectively. However, the highest IPCE values of devices based on dyes 4 and 5 with the co-adsorbent represent 52% and 16% of improvement compared with those of the devices fabricated without the co-adsorbent. This means that the latter is less affected by aggregation issues. Nevertheless, compared with dye 4, dye 5 is unfavorable for photovoltaic applications due to the axial groups in the molecules significantly reduce the amount of dye loading onto the TiO2 surface, resulting in lowering of the photovoltaic performance.49
The J–V curves also display that the VOC values for DSSCs fabricated with CDCA are slightly improved as compared to those of without CDCA. The improvement of VOC can be explained by the co-adsorbent occupation of the free TiO2 surface and thereby to suppress the charge recombination.50 Electrochemical impedance spectroscopy (EIS) analysis was performed to further verify the VOC values of the DSSCs in the presence of CDCA (Fig. 11). The Nyquist plots have two semicircles and the right semicircle exhibits the charge recombination resistance between the TiO2 and the electrolyte (Fig. 11a). The radius of the right semicircle of DSSC based on dye 5 is higher than that of dye 4, which is agreement with their VOC values. The frequency maxima (f) of the left peaks in the Bode plots for DSSCs based on dyes 4 and 5 are 12.19 and 8.65 Hz, respectively (Fig. 11b). The corresponding electron lifetimes (τe), which can be estimated using equation τe = 1/2πf,51 are 13.06 and 18.4 ms, respectively, which is consistent with the VOC values.
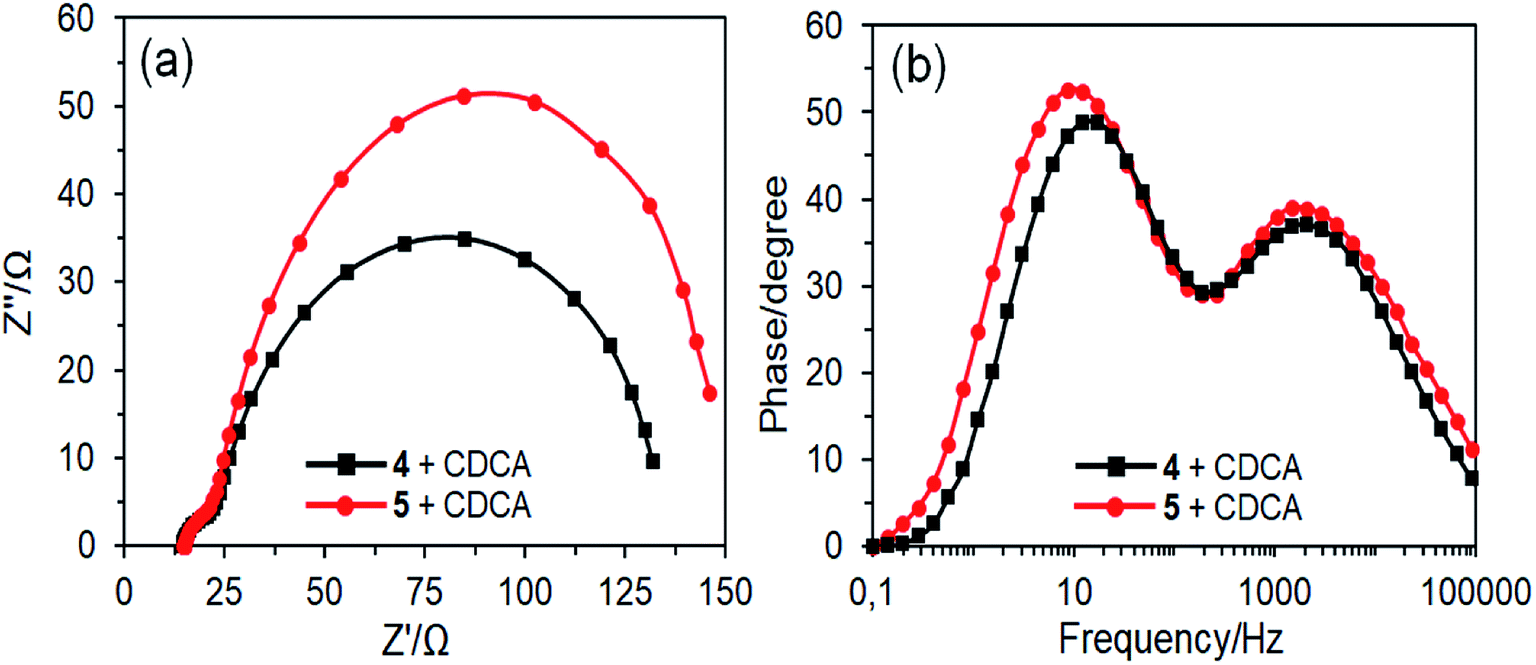 | ||
| Fig. 11 Nyquist (a) and Bode (b) plots of DSSCs based on dyes 4 and 5 with CDCA in the dark. | ||
4. Conclusion
As a consequence, in this work, the preparation, spectral characterization, aggregation, photophysical, singlet oxygen capability, electrochemical and photovoltaic properties of novel peripherally substituted zinc and axially disubstituted silicon phthalocyanine complexes are presented for the first time. The photophysical and singlet oxygen generation properties of axially substituted silicon and peripherally substituted zinc phthalocyanine complexes were investigated in DMSO. The 1,2,3-triazole group containing silicon(IV) complex (5) showed higher ΦF values than zinc(II) complex (4) and standard unsubstituted ZnPc. Also, the studied zinc complex (4) is produced efficiently singlet oxygen (ΦΔ = 0.76) in DMSO. These photophysical and photochemical results indicate that the synthesized phthalocyanine complexes (especially zinc complex) may be alternative to clinically approved photosensitizers with good solubility, red-shifts in the absorption spectrum, non-aggregating behaviors, and acceptable singlet oxygen quantum yields. Compared to complex 5, complex 4 exhibited red-shifted absorption and higher dye loading, which is beneficial for absorbing more photons and thus generating high photocurrent. On the other hand, the power conversion efficiencies of solar cells based on complexes 4 and 5 with the co-adsorbent improved by 35% and 7%, respectively, indicating that the introduction of axial 1,2,3-triazole groups may be able to play an anti-aggregation effect. This study has shown that these zinc and silicon phthalocyanines are promising photosensitizers for both photodynamic cancer therapy and dye-sensitized solar cell applications.Conflicts of interest
There are no conflicts to declare.Acknowledgements
The author wishes to thank Assoc. Prof. Dr İ. Şişman for his excellent technical support in electrochemical and photovoltaic measurements and helpful discussion.References
- C.-X. Tan, Y.-X. Shi, J.-Q. Weng, X.-H. Liu, B.-J. Li and W.-G. Zhao, Lett. Drug Des. Discovery, 2012, 9, 431–435 CrossRef CAS.
- D. K. Dalvie, A. S. Kalgutkar, S. C. Khojasteh-Bakht, R. S. Obach and J. P. O'Donnell, Chem. Res. Toxicol., 2002, 15, 269–293 Search PubMed.
- W. Seth Horne, M. K. Yadav, A. C. David Stout and M. R. Ghadiri, J. Am. Chem. Soc., 2004, 126, 15366–15367 CrossRef PubMed.
- S. Zhang, Z. Xu, C. Gao, Q.-C. Ren, L. Chang, Z.-S. Lv and L.-S. Feng, Eur. J. Med. Chem., 2017, 138, 501–513 CrossRef CAS PubMed.
- S. G. Agalave, S. R. Maujan and V. S. Pore, Chem.–Asian J., 2011, 6, 2696–2718 CrossRef CAS PubMed.
- Y. Ooyama, S. Inoue, T. Nagano, K. Kushimoto, J. Ohshita, I. Imae, K. Komaguchi and Y. Harima, Angew. Chem., Int. Ed., 2011, 50, 7429–7433 CrossRef CAS PubMed.
- L. Sobotta, S. Lijewski, J. Dlugaszewska, J. Nowicka, J. Mielcarek and T. Goslinski, Inorg. Chim. Acta, 2019, 489, 180–190 CrossRef CAS.
- N. Yesilgul, T. B. Uyar, O. Seven and E. U. Akkaya, ACS Omega, 2017, 2, 1367–1371 CrossRef CAS PubMed.
- E. Güzel, A. Atsay, S. Nalbantoglu, N. Şaki, A. L. Dogan, A. Gül and M. B. Koçak, Dyes Pigm., 2013, 97, 238–243 CrossRef.
- E. Güzel, İ. Şişman, A. Gül and M. B. Koçak, J. Porphyrins Phthalocyanines, 2019, 23, 279–286 CrossRef.
- M. Urbani, M.-E. Ragoussi, M. K. Nazeeruddin and T. Torres, Coord. Chem. Rev., 2019, 381, 1–64 CrossRef CAS.
- B. Yıldız, E. Güzel, N. Menges, İ. Şişman and M. Kasım Şener, Sol. Energy, 2018, 174, 527–536 CrossRef.
- E. Güzel, N. Şaki, M. Akın, M. Nebioğlu, İ. Şişman, A. Erdoğmuş and M. B. Koçak, Synth. Met., 2018, 245, 127–134 CrossRef.
- E. Güzel, G. Yaşa Atmaca, A. Erdoğmuş and M. B. Koçak, J. Coord. Chem., 2017, 70, 2659–2670 CrossRef.
- F. Dumoulin, M. Durmuş, V. Ahsen and T. Nyokong, Coord. Chem. Rev., 2010, 254, 2792–2847 CrossRef CAS.
- M. Göksel, M. Durmuş and D. Atilla, Photochem. Photobiol. Sci., 2016, 15, 1318–1329 RSC.
- M. V. Martínez-Díaz, G. de la Torre and T. Torres, Chem. Commun., 2010, 46, 7090 RSC.
- E. Güzel, Ş. Çetin, A. Günsel, A. T. Bilgiçli, İ. Şişman and M. N. Yarasir, Res. Chem. Intermed., 2018, 44, 971–989 CrossRef.
- M. K. Şener, A. Gül and M. B. Koçak, J. Porphyrins Phthalocyanines, 2003, 7, 617–622 CrossRef.
- B. Akkurt and E. Hamuryudan, Dyes Pigm., 2008, 79, 153–158 CrossRef CAS.
- C. Kantar, N. Akdemir, E. Ağar, N. Ocak and S. Şaşmaz, Dyes Pigm., 2008, 76, 7–12 CrossRef.
- N. Kabay and Y. Gök, Tetrahedron Lett., 2013, 54, 4086–4090 CrossRef CAS.
- S. Z. Yildiz, M. Küçükislamoǧlu and M. Tuna, J. Organomet. Chem., 2009, 694, 4152–4161 CrossRef CAS.
- M. Ozer, F. Yilmaz, H. Erer, I. Kani and O. Bekaroglu, Appl. Organomet. Chem., 2009, 23, 55–61 CrossRef.
- E. Güzel, A. Koca and M. B. Koçak, Supramol. Chem., 2017, 29, 536–546 CrossRef.
- R. Z. Uslu Kobak, E. S. Öztürk, A. Koca and A. Gül, Dyes Pigm., 2010, 86, 115–122 CrossRef CAS.
- H. Karaca, S. Sezer, Ş. Özalp-Yaman and C. Tanyeli, Polyhedron, 2014, 72, 147–156 CrossRef CAS.
- Ü. Demirbaş, D. Akyüz, A. Mermer, H. T. Akçay, N. Demirbaş, A. Koca and H. Kantekin, Spectrochim. Acta, Part A, 2016, 153, 478–487 CrossRef PubMed.
- H. T. Akçay, M. Pişkin, Ü. Demirbaş, R. Bayrak, M. Durmuş, E. Menteşe and H. Kantekin, J. Organomet. Chem., 2013, 745–746, 379–386 CrossRef.
- R. Bayrak, O. Bekircan, M. Durmuş and I. Deǧirmencioǧlu, J. Organomet. Chem., 2014, 767, 101–107 CrossRef CAS.
- A. Aktaş, D. Ünlüer, R. Z. U. Kobak, İ. Acar, E. Düğdü, A. Koca and H. Kantekin, Inorg. Nano-Met. Chem., 2017, 47, 830–840 CrossRef.
- J. T. Simmons, J. R. Allen, D. R. Morris, R. J. Clark, C. W. Levenson, M. W. Davidson and L. Zhu, Inorg. Chem., 2013, 52, 5838–5850 CrossRef CAS PubMed.
- H. Baş and Z. Biyiklioglu, J. Organomet. Chem., 2015, 791, 238–243 CrossRef.
- Z. Chen, Y. Wu and X. Zuo, Dyes Pigm., 2007, 73, 245–250 CrossRef CAS.
- H. Matsuzaki, T. N. Murakami, N. Masaki, A. Furube, M. Kimura and S. Mori, J. Phys. Chem. C, 2014, 118, 17205–17212 CrossRef CAS.
- N. S. Bayliss, J. Chem. Phys., 1950, 18, 292 CrossRef CAS.
- A. Ogunsipe, J. Chen and T. Nyokong, New J. Chem., 2004, 28, 822–827 RSC.
- G. Y. Atmaca, C. Dizman, T. Eren and A. Erdoğmuş, Spectrochim. Acta, Part A, 2015, 137, 244–249 CrossRef CAS PubMed.
- I. Gürol, M. Durmuş, V. Ahsen and T. Nyokong, Dalton Trans., 2007, 3782 RSC.
- A. Nas, S. Fandakl, H. Kantekin, A. Demirbaş and M. Durmuş, Dyes Pigm., 2012, 95, 8–17 CrossRef CAS.
- N. Masilela, M. Idowu and T. Nyokong, J. Photochem. Photobiol., A, 2009, 201, 91–97 CrossRef CAS.
- M. Çamur, M. Durmuş, A. Riza Özkaya and M. Bulut, Inorg. Chim. Acta, 2012, 383, 287–299 CrossRef.
- W. Ying, J. Yang, M. Wielopolski, T. Moehl, J.-E. Moser, P. Comte, J. Hua, S. M. Zakeeruddin, H. Tian and M. Grätzel, Chem. Sci., 2014, 5, 206–214 RSC.
- K. D. Seo, I. T. Choi and H. K. Kim, Chem.–Eur. J., 2015, 21, 14804–14811 CrossRef CAS PubMed.
- R. Misra, R. Maragani, K. R. Patel and G. D. Sharma, RSC Adv., 2014, 4, 34904–34911 RSC.
- K. Ladomenou, V. Nikolaou, G. Charalambidis and A. G. Coutsolelos, Dalton Trans., 2016, 45, 1111–1126 RSC.
- T. Ikeuchi, H. Nomoto, N. Masaki, M. J. Griffith, S. Mori and M. Kimura, Chem. Commun., 2014, 50, 1941–1943 RSC.
- Y. Ooyama and Y. Harima, Eur. J. Org. Chem., 2009, 2903–2934 CrossRef CAS.
- S.-G. Chen, H.-L. Jia, X.-H. Ju and H.-G. Zheng, Dyes Pigm., 2017, 146, 127–135 CrossRef CAS.
- X. Kang, J. Zhang, A. J. Rojas, D. O'Neil, P. Szymanski, S. R. Marder and M. A. El-Sayed, J. Mater. Chem. A, 2014, 2, 11229–11234 RSC.
- Y. Wang, C. Yang, J. Chen, H. Qi, J. Hua, Y. Liu, E. Baranoff, H. Tan, J. Fan and W. Zhu, Dyes Pigm., 2016, 127, 204–212 CrossRef CAS.
Footnote |
| † Electronic supplementary information (ESI) available. See DOI: 10.1039/c8ra10665g |
| This journal is © The Royal Society of Chemistry 2019 |