 Open Access Article
Preparation of high-performance monoazo disperse dyes bearing ester groups based on benzisothiazole and their dyeing performance on polyester fabrics†
Xiyu Song *ab,
Chuang Daia,
Mingda Lia,
Min Lic,
Liu Hud,
Yu Wanga,
Aiqin Hou
 b and
Hongfei Qiana
aKey Laboratory of Clean Dyeing and Finishing Technology of Zhejiang Province, Shaoxing University, Shaoxing 312000, PR China. E-mail: xiyusong@usx.edu.cn
bCollege of Chemistry and Chemical Engineering, Donghua University, Shanghai 201620, PR China
cCollege of Textile and Garment, Nantong University, Nantong 226019, PR China
dEngineering Research Center for Eco-Dyeing and Finishing of Textiles Ministry of Education, Zhejiang Sci-Tech University, Hangzhou 310018, PR China
First published on 2nd January 2024
Abstract
To obtain high-performance disperse dyes, a series of azo disperse dyes containing different kinds of ester groups based on benzisothiazole were synthesized by the coupling reaction of diazotization of 3-amino-5-nitro [2,1] benzisothiazole with N-substituted aniline compounds bearing different ester moieties. The structures of the synthesized dyes were evaluated using Fourier transform infrared spectroscopy (FT-IR), nuclear magnetic resonance techniques (1H-NMR), and MS analysis. UV-Vis spectrophotometry methods were applied to study absorption maxima, molar extinction coefficients, and solvatochromic behaviors of the dyes, and time-dependent density functional theory (TD-DFT) simulations were applied to reveal the nature of the absorption spectrum properties. Polyester fabrics were colored using a high-temperature dyeing method under pressure, and the dyed fabrics exhibited deep and bright intense blue hues. In addition, excellent fastness properties, including washing fastness, sublimation fastness, rubbing fastness, and light fastness, were achieved.
1. Introduction
The relationship between the molecular structure and properties of azo dyes have been explored in the last decades.1–3 Large amounts of dyes with low wash fastness are produced and applied to polyester dyeing every year. Due to the low water solubility of the disperse dyes, the dye particle residues on dyed polyester lead to decreased washing fastness.4,5 The request for high-performance disperse dyes is imperative. To cater the environmental protection requirements and the enhancement of environmental awareness, traditional dyes in the new standards and environmental requirements can no longer be applicable, high-performance disperse dyes possess the main significance in polyester dyeing field. Disperse dyes containing ester groups can be hydrolyzed to water-soluble dyes under alkaline conditions, which can also avoid staining during the washing process.6–8 Disperse dyes bearing ester functions were developed to decrease the staining tendency behaviors on microfibers, and the thermomigration problems exist in heat-setting and functional finishing process can also be reduced by introducing ester moieties. Aromatic heterocyclic structures have attracted great attention, which is attributed to their higher tinctorial strength, and brighter color shades on the synthetic fabrics.9–12 Heterocyclic diazo compounds, like 2-amino-6-nitrobenzothiazole, 2-aminothiazoles, 2-amino-5-nitrothiazole and 3,5-dinitro-2-aminothiophene, that can give polyester fibers dark colors are crucial in the synthesis of disperse dyes.13–16 Disperse dyes that are derived from 3-amino-5-nitro [2,1] benzisothiazole can produce darker colors compared to the above-mentioned heterocyclic dyes, which promoted the application of 3-amino-5-nitro [2,1] benzisothiazole in the synthesis of blue disperse dyes as substitutes for the anthraquinone disperse dyes in blue hues.17,18 Dyes synthesized from 3-amino-5-nitrobenzoisothiazole also exhibited good fastness, including sublimation fastness and light fastness.19,20 The structures of the mentioned dyes are shown in Fig. 1.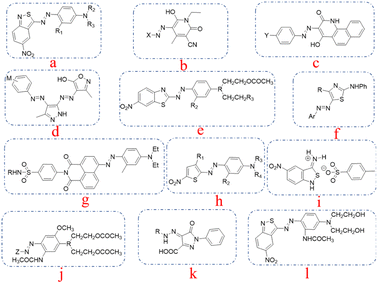 | ||
| Fig. 1 The typical structures of the dyes mentioned from references: (a) from ref. 9, (b) from ref. 10, (c) from ref. 11, (d) from ref. 12, (e) from ref. 13, (f) from ref. 14, (g) from ref. 15, (h) from ref. 16, (i) from ref. 17, (j) from ref. 18, (k) from ref. 19, (l) for ref. 20. | ||
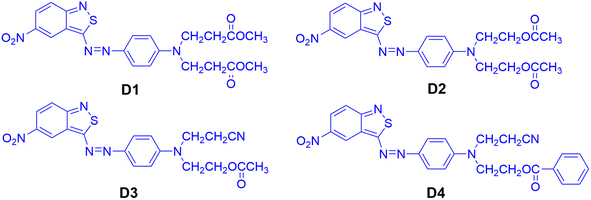
To correlate the dye structures with properties, benzisothiazole azo disperse dyes bearing different ester groups were synthesized, which exhibited excellent dyeing performance. In order to investigate the effect of different kinds of ester groups on the performance of the dyes, four disperse dyes were synthesized using N,N-di(β-methoxycarbonylethyl)aniline, N,N-diacetoxyethyl-aniline, N-acetoxyethyl-N-cyanoethyl-aniline, and N-benzoyloxyethyl-N-cyanoethyl-aniline as the coupling components, which could react with diazotized 3-amino-5-nitro [2,1] benzisothiazole to obtain the benzisothiazole dyes bearing ester groups. The spectral differences were rationalized in accordance with dye structures for comparative purposes based on the experimental results and simulated data. These dyes were applied to polyester fabrics using a high-temperature dyeing method. Colorimetric data and fastness properties of the dyed polyester fabrics were also evaluated. Quantum DFT simulation was applied to investigate the substituent effect on the dyeing performance of the designed dyes.
2. Experimental
2.1. Materials and physical measurements
Polyester fabrics (plain weave, wrap/weft density 54/48 yarn/cm) were obtained from Zhejiang Xinfa Dyeing and Finishing Company. N,N-Di(β-methoxycarbonylethyl)aniline, N,N-diacetoxyethyl-aniline, N-acetoxyethyl-N-cyanoethyl-aniline, N-benzoyloxyethyl-N-cyanoethyl-aniline, and 3-amino-5-nitro [2,1] benzisothiazole of industrial grade were obtained from Zhejiang Wanfeng Chemical Company, Shaoxing, China. Other chemicals used were obtained from the Shanghai Chemical Reagent Plant, Shanghai, China. All Chemicals were used as received without further purification.Fourier-transformed infrared (FTIR) spectra were measured using a Spectrum Two FT-IR spectrometer (PerkinElmer Inc., Llantrisant, UK) scanning between 4000 and 500 cm−1. Proton nuclear magnetic resonance (1H-NMR) was recorded on a Bruker AV 400 (Bruker Co., Faellanden, Switzerland), using dimethylsulphoxide-d6 (DMSO-d6) as solvents at 25 °C. Visible absorption spectra were measured using a UV-vis spectrometer (Hitachi Limited, Japan). Melting points were measured using the open capillary method with a Mel-Temp capillary melting point apparatus (Shanghai Precision and Scientific Instruments, China). MS analysis was performed on a Waters XEVO-TQD QCA1056 Series LCMS system.
2.2. Synthesis of the designed dyes
The chemical structures of the heterocyclic azo disperse dyes containing an ester group based on benzisothiazole are shown in Fig. 2. Diazotization of 3-amino-5-nitro [2,1] benzisothiazole was carried out by the previously reported method.21 N,N-Di(β-methoxycarbonylethyl)aniline, N,N-diacetoxyethyl-aniline, N-acetoxyethyl-N-cyanoethyl-aniline and N-benzoyloxyethyl-N-cyanoethyl-aniline were dissolved in acid water, then coupled with diazotized 3-amino-5-nitro [2,1] benzisothiazole. The synthesized dyes were filtered off, washed with water completely, and dried at 60 °C in an oven. The crude dried dyes were recrystallized from ethanol and named D1, D2, D3, and D4, respectively.D1: blue powder, 72.35% yield, mp 134–135 °C. 1H-NMR (400 MHz, DMSO-d6, δH, ppm): 9.09 (d, J = 2.2 Hz, 1H of nitrobenzisothiazole), 8.23 (dd, J = 2.4 Hz, 1H of nitrobenzisothiazole), 8.03 (dd, J = 9.6, 2.4 Hz, 2H, Ar-H), 7.89 (d, J = 9.6 Hz, 1H of nitrobenzisothiazole), 7.00 (d, J = 9.3 Hz, 2H, Ar-H), 3.83 (t, J = 7.1 Hz, 4H, –N–CH2–), 3.63 (s, 6H, –CH3), 2.71 (t, J = 7.4 Hz, 4H, –CH2–). 13C-NMR (100 MHz, DMSO-d6, δ, ppm) yielded 180.2, 171.5 (×2), 161.9, 152.5, 144.1, 143.3, 126.8, 123.0, 122.9, 122.5, 121.8, 120.5, 119.1, 112.8, 51.5 (×2), 46.3 (×2) and 31.5 (×2). Main FT-IR absorption peaks (KBr pellet, v cm−1): 2952 (R-H), 1728 (C![[double bond, length as m-dash]](https://www.rsc.org/images/entities/char_e001.gif) O), 1592, 1555, 1513&1341 (NO2), 1496, 1433, 1400, 1305, 1230, 1195, 1158, 1121, 1070, 1021. MS (ESI+) was m/z (%) = 472.28 (100) [M+].
O), 1592, 1555, 1513&1341 (NO2), 1496, 1433, 1400, 1305, 1230, 1195, 1158, 1121, 1070, 1021. MS (ESI+) was m/z (%) = 472.28 (100) [M+].
D2: dark blue powder, 85.35% yield, mp 150–151 °C. 1H-NMR (400 MHz, DMSO-d6, δH, ppm): 9.10 (d, J = 2.2 Hz, 1H of nitrobenzothiazole cycle), 8.23 (d, J = 9.6 Hz, 2H, 1H of nitrobenzothiazole cycle), 8.01 (d, J = 9.2 Hz, 2H, Ar-H), 7.89 (d, J = 9.6 Hz, 1H of nitrobenzisothiazole), 7.10 (d, J = 9.4 Hz, 2H, Ar-H), 4.28 (t, J = 5.6 Hz, 4H, –CH2–), 3.87 (t, J = 5.6 Hz, 4H, –CH2–), 2.00 (s, 6H, –CH3). 13C-NMR (100 MHz, DMSO-d6, δ, ppm) yielded 180.7, 170.8 (×2), 162.4, 154.0, 144.6, 143.8, 127.4, 123.5, 123.4, 123.0, 122.3, 121.1, 119.7, 113.5, 61.5 (×2), 49.7 (×2) and 21.1 (×2). Main FT-IR absorption peaks (KBr pellet, v cm−1): 2969 (R-H), 1729 (C![[double bond, length as m-dash]](https://www.rsc.org/images/entities/char_e001.gif) O), 1592, 1515&1324 (NO2), 1496, 1401, 1299, 1225, 1160, 1137, 1119, 1061. MS (ESI+) was m/z (%) = 472.28 (100) [M+].
O), 1592, 1515&1324 (NO2), 1496, 1401, 1299, 1225, 1160, 1137, 1119, 1061. MS (ESI+) was m/z (%) = 472.28 (100) [M+].
D3: blue powder, 97.36% yield, mp 160–161 °C. 1H-NMR (400 MHz, DMSO-d6, δH, ppm): 9.12 (d, J = 2.2 Hz, 1H of nitrobenzothiazole cycle), 8.24 (dd, J = 9.7 Hz, 2.4 Hz, 1H of nitrobenzothiazole cycle), 8.03 (d, J = 9.2 Hz, 2H, Ar-H), 7.91 (d, J = 9.6 Hz, 1H of nitrobenzothiazole cycle), 7.14 (d, J = 9.4 Hz, 2H, Ar-H), 4.28 (t, J = 5.6 Hz, 2H, –CH2–), 3.92 (dd, J = 15.5, 8.7 Hz, 2H, –CH2–), 3.89 (t, J = 5.6 Hz, 2H, –CH2–), 2.89 (t, J = 6.8 Hz, 2H, –CH2–), 2.00 (s, 3H, –CH3). 13C-NMR (100 MHz, DMSO-d6, δ, ppm) yielded 180.5, 170.8, 162.4, 153.3, 144.8, 144.1, 127.6, 123.6, 123.5, 123.0, 122.3, 121.1, 119.7, 113.6, 61.4, 49.2, 46.6, 21.1, 16.0. Main FT-IR absorption peaks (KBr pellet, v cm−1): 3094 (Ar-H), 2968 (R-H), 2246 (CN), 1729 (C![[double bond, length as m-dash]](https://www.rsc.org/images/entities/char_e001.gif) O), 1592, 1557, 1515 & 1325 (NO2), 1495, 1400, 1369, 1348, 1298, 1225, 1160, 1119, 1061. MS (ESI+) was m/z (%) = 439.38 (100) [M+].
O), 1592, 1557, 1515 & 1325 (NO2), 1495, 1400, 1369, 1348, 1298, 1225, 1160, 1119, 1061. MS (ESI+) was m/z (%) = 439.38 (100) [M+].
D4: blue powder, 96.4% yield, mp 183–184 °C, 1H-NMR (400 MHz, DMSO-d6, δH, ppm): 9.12 (d, J = 2.2 Hz, 1H of nitrobenzothiazole cycle), 8.24 (dd, J = 9.7 Hz, 2.4 Hz, 1H of nitrobenzothiazole cycle), 8.02 (d, J = 9.2 Hz, 2H, Ar-H), 7.95 (dd, J = 15.4, 8.3 Hz, 2H, Ar-H), 7.91 (d, J = 7.7 Hz, 1H of nitrobenzothiazole cycle), 7.64 (t, 1H, Ar-H), 7.51 (t, J = 7.7 Hz, 2H, Ar-H), 7.21 (d, J = 8.8 Hz, 2H, Ar-H), 4.55 (t, J = 5.6 Hz, 2H, –CH2–), 4.06 (s, 2H, –CH2–), 4.01 (s, 2H, –CH2–), 2.92 (dd, J = 13.1, 6.3 Hz, 2H, –CH2–). 13C-NMR (100 MHz, DMSO-d6, δ, ppm) yielded 180.6, 166.3, 166.2, 162.5, 153.4, 147.1, 144.9, 144.2, 133.9, 129.8, 129.7 (×2), 129.2 (×2), 127.6, 123.6, 119.7, 117.2, 113.8, 112.8 (×2), 62.7, 49.1, 46.6 and 15.8. Main FT-IR absorption peaks (KBr pellet, v cm−1): 3093 (Ar-H), 2959 (R-H), 2246 (CN), 1709 (C![[double bond, length as m-dash]](https://www.rsc.org/images/entities/char_e001.gif) O), 1593, 1560, 1401, 1513, and 1326 (NO2), 1295, 1273, 1247, 1161 (C–O), 1139, 1123, 1099, 1069, 1023. MS (ESI+) was m/z (%) = 501.35 (100) [M+].
O), 1593, 1560, 1401, 1513, and 1326 (NO2), 1295, 1273, 1247, 1161 (C–O), 1139, 1123, 1099, 1069, 1023. MS (ESI+) was m/z (%) = 501.35 (100) [M+].
2.3. Dyeing of polyester fabrics
The synthesized dyes and dispersant Reax 85A were milled together at a ratio of 1![[thin space (1/6-em)]](https://www.rsc.org/images/entities/char_2009.gif) :
:![[thin space (1/6-em)]](https://www.rsc.org/images/entities/char_2009.gif) 1 (w/w). Polyester fabrics were dyed with synthesized dyes in a STARLET DL-6000 IR dyeing machine (Daelim Starlet Co., Ltd, South Korea) at a liquor ratio of 1
1 (w/w). Polyester fabrics were dyed with synthesized dyes in a STARLET DL-6000 IR dyeing machine (Daelim Starlet Co., Ltd, South Korea) at a liquor ratio of 1![[thin space (1/6-em)]](https://www.rsc.org/images/entities/char_2009.gif) :
:![[thin space (1/6-em)]](https://www.rsc.org/images/entities/char_2009.gif) 20. The dyebath was prepared using dyes, 1% (o.w.f., on the weight of fabrics), and 10% (v/v) acetic acid solution was applied to adjusted pH = 4–5. Fabrics were dyed in a bath at 30 °C, then the temperature was raised to 130 °C, at 2 °C min−1, and maintained at 130 °C for 60 min. After cooling to room temperature, the dyed polyester fabrics were treated by reduction clearing to remove the loose color on the surface. The reduction clearing process was carried out at 85 °C for 15 min in an aqueous solution of 2 g L−1 sodium dithionite and 2 g L−1 sodium carbonate, finally rinsing with cool water and drying at ambient temperature.
20. The dyebath was prepared using dyes, 1% (o.w.f., on the weight of fabrics), and 10% (v/v) acetic acid solution was applied to adjusted pH = 4–5. Fabrics were dyed in a bath at 30 °C, then the temperature was raised to 130 °C, at 2 °C min−1, and maintained at 130 °C for 60 min. After cooling to room temperature, the dyed polyester fabrics were treated by reduction clearing to remove the loose color on the surface. The reduction clearing process was carried out at 85 °C for 15 min in an aqueous solution of 2 g L−1 sodium dithionite and 2 g L−1 sodium carbonate, finally rinsing with cool water and drying at ambient temperature.
2.4. Color yield assessment
The color yield (K/S) and colorimetric parameters of the dyed polyester fabrics were determined using a Datacolor SP 600+ spectrophotometer (Datacolor, Switzerland), under illuminant D65 using a 10° standard observer in the visible spectrum region 380–720 nm. The measurements of the dyed samples were taken on at least four different positions and averaged to achieve the final colorimetric parameters.2.5. Fastness properties
Fastness of the color was evaluated according to the respective international standard methods. Rubbing fastness was performed by using a crock meter (CM-5, Atlas Co., USA) with dry and wet samples according to ISO 105-X12 (2003), and the staining on the white test cloth was assessed according to the grayscale. Washing fastness was tested using a washing fastness apparatus (SW-12AII, Wenzhou Darong Textile Technology Co., Ltd, China) at 60 °C for 30 min according to ISO 105-C03 (2010), and adjacent fabrics of Multifibre DW (Shanghai Textile Industry Institute of Technical Supervision, China) were applied to assess the staining fastness. Sublimation fastness was processed by using a sublimation tester YG(B)605D (Wenzhou Darong Textile Technology Co., Ltd, China), samples and adjacent fabrics were heated at 180 °C for 30 s according to ISO 105/P01 (1993). Light fastness was studied by employing a light fastness tester (150S+, Altas Co. USA) with xenon lamps for a certain period of time according to ISO I05-B02 (2013), fastness levels were assessed using standard blue wool samples as a reference.2.6. Computational calculation
The quantum simulation of the designed dyes was performed using the Gaussian16 package. Given the push–pull structure of the designed dyes, charge-transfer excitation was expected, and it was optimized geometries and calculation of the frequencies for the final state of the dyes were calculated using Density Functional Theory (DFT) at ωB97X-D/6-31G(d) level. No imaginary frequency was detected by means of frequency analysis of the optimized geometries. Time-dependent density functional theory (TD-DFT) simulations were applied to investigate the photophysical properties of the dyestuffs at the PBE0/TZVP level. Simulations of the dyes in different solvents were performed using the Self-Consistent Reaction Field (SCRF) under the Solvation Model Density (SMD). Intermolecular energies were studied at ωB97X-D/6-311++(d,p) level to evaluate dye–fiber interactions that existed during the dyeing process, Basis set superposition error (BSSE) effects were considered by calculating the energy of the dyes and PET using the same method. The wavefunction analysis code Multiwfn was applied to illustrate the π electron distribution of dyes and the properties of their frontier orbitals.3. Results and discussions
3.1. Synthesis and spectral characterizations
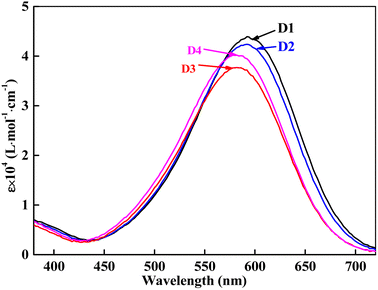
The heterocyclic monoazo dyes were prepared by coupling N,N-di(β-methoxycarbonylethyl)aniline, N,N-diacetoxyethyl-aniline, N-acetoxyethyl-N-cyanoethyl-aniline and N-benzoyloxyethyl-N-cyanoethyl-aniline with diazotized 3-amino-5-nitro [2,1] benzisothiazole (Scheme 1). The benzisothiazole azo dyes were obtained in good yields. Synthesized dyes were characterized by FT-IR, 1H-NMR, and MS techniques to estimate the correct structures, as described in the experimental section.The absorption maxima of the synthesized dyes ranged from 582 to 592 nm in DMF, as shown in Fig. 3, which was assigned to the π–π* transition of the conjugated system. The UV-vis spectra of these dyes in different solvents were measured and the data are summarized in Table 1. The used solvents have different dielectric constants (εs), N,N-dimethylformamide (DMF, 38.25), acetonitrile (CH3CN, 36.64), methanol (CH3OH, 32.60) and chloroform (CHCl3, 4.81). The absorption spectra of D1–D4 in DMF are shown in Fig. 3, and the absorption maxima (λexp) and extinction coefficients (ε) of the four dyes in solvents are shown in Table 1.
| Samples | Molecule Mass | λexp (nm) | ε × 104 (L mol−1 cm−1) | ||||||
|---|---|---|---|---|---|---|---|---|---|
| DMF | CH3CN | CH3OH | CHCl3 | DMF | CH3CN | CH3OH | CHCl3 | ||
| D1 | 471.12 | 592.0 | 576.5 | 578.5 | 572.5 | 4.39 | 4.47 | 4.46 | 4.03 |
| D2 | 471.12 | 591.0 | 576.5 | 574.0 | 570.0 | 4.24 | 4.33 | 4.35 | 4.06 |
| D3 | 438.11 | 583.0 | 565.0 | 562.0 | 554.5 | 3.77 | 3.85 | 3.91 | 3.32 |
| D4 | 500.13 | 582.5 | 564.0 | 563.5 | 553.5 | 4.02 | 4.08 | 4.09 | 3.77 |
As shown in Table 1, D1 and D2 exhibited almost the same λexp and ε in all four solvents, which is attributed to the carbonyl position on the ester moiety. A bathochromic shift from 591.0 nm of D2 to 583.0 nm of D3 was achieved by cyano of D3. Comparing D3 with D2, cyanoethyl replaced one ester group of the diester group. The cyano group is a strong electron-accepting group, making the aniline moiety weaker for electron-accepting compared to the diester aniline moiety, leading to a lower ε of D3 than D2. D3 and D4 also showed almost the same λmax in all four solvents because of the similar ester polarity. Comparing D4 with D3, the phenyl group conjugated with the carbonyl group of D4 to achieve higher ε than the alkyl linked carbonyl group of D3. The four dyes exhibited solvatochromic effect, a large red shift from CHCl3 to DMF, 19.5 nm for D1, 21 nm for D2, 18 nm for D3 and 18.5 nm were observed. The solvatochromism of the synthesized dyes was induced by the active proton migration caused by different polarities of the organic solvents.
To further study the photophysical properties of the dyes, TD-DFT simulations were applied. The simulated dipole moment (μ) and UV-vis absorption spectra, including the maximum absorbance (λc), corresponding μs and transition contribution of S0–S1 in solvents are summarized in Table 2.
| Dye | Solvent | μ (Debye) | λc (nm) | ε × 104 (L mol−1 cm−1) | Transition contribution/% | ||||||||||||||||||||||||||||||||||||||||||||||||||||||||||||||||||||||||||||||||||||||||||||||
|---|---|---|---|---|---|---|---|---|---|---|---|---|---|---|---|---|---|---|---|---|---|---|---|---|---|---|---|---|---|---|---|---|---|---|---|---|---|---|---|---|---|---|---|---|---|---|---|---|---|---|---|---|---|---|---|---|---|---|---|---|---|---|---|---|---|---|---|---|---|---|---|---|---|---|---|---|---|---|---|---|---|---|---|---|---|---|---|---|---|---|---|---|---|---|---|---|---|---|---|
| a S0 is the ground state (HOMO), S1 is the excited state (LUMO). | |||||||||||||||||||||||||||||||||||||||||||||||||||||||||||||||||||||||||||||||||||||||||||||||||||
| D1 (S0–S1) | DMF | 15.13 | 562 | 4.16 | 99.38 | ||||||||||||||||||||||||||||||||||||||||||||||||||||||||||||||||||||||||||||||||||||||||||||||
| CH3CN | 15.18 | 558 | 4.05 | 99.34 | |||||||||||||||||||||||||||||||||||||||||||||||||||||||||||||||||||||||||||||||||||||||||||||||
| CH3OH | 15.52 | 567 | 3.85 | 99.17 | |||||||||||||||||||||||||||||||||||||||||||||||||||||||||||||||||||||||||||||||||||||||||||||||
| CHCl3 | 14.05 | 553 | 4.14 | 99.32 | |||||||||||||||||||||||||||||||||||||||||||||||||||||||||||||||||||||||||||||||||||||||||||||||
| D2 (S0–S1) | DMF | 8.96 | 555 | 4.09 | 99.39 | ||||||||||||||||||||||||||||||||||||||||||||||||||||||||||||||||||||||||||||||||||||||||||||||
| CH3CN | 8.97 | 552 | 3.98 | 99.35 | |||||||||||||||||||||||||||||||||||||||||||||||||||||||||||||||||||||||||||||||||||||||||||||||
| CH3OH | 9.07 | 560 | 3.79 | 99.19 | |||||||||||||||||||||||||||||||||||||||||||||||||||||||||||||||||||||||||||||||||||||||||||||||
| CHCl3 | 7.97 | 542 | 4.08 | 99.31 | |||||||||||||||||||||||||||||||||||||||||||||||||||||||||||||||||||||||||||||||||||||||||||||||
| D3 (S0–S1) | DMF | 8.46 | 551 | 4.09 | 99.37 | ||||||||||||||||||||||||||||||||||||||||||||||||||||||||||||||||||||||||||||||||||||||||||||||
| CH3CN | 8.44 | 548 | 3.99 | 99.34 | |||||||||||||||||||||||||||||||||||||||||||||||||||||||||||||||||||||||||||||||||||||||||||||||
| CH3OH | 8.42 | 556 | 3.80 | 99.18 | |||||||||||||||||||||||||||||||||||||||||||||||||||||||||||||||||||||||||||||||||||||||||||||||
| CHCl3 | 7.44 | 537 | 4.08 | 99.30 | |||||||||||||||||||||||||||||||||||||||||||||||||||||||||||||||||||||||||||||||||||||||||||||||
| D4 (S0–S1) | DMF | 9.67 | 554 | 4.21 | 99.37 | ||||||||||||||||||||||||||||||||||||||||||||||||||||||||||||||||||||||||||||||||||||||||||||||
| CH3CN | 9.65 | 550 | 4.11 | 99.35 | |||||||||||||||||||||||||||||||||||||||||||||||||||||||||||||||||||||||||||||||||||||||||||||||
| CH3OH | 9.77 | 559 | 3.92 | 99.16 | |||||||||||||||||||||||||||||||||||||||||||||||||||||||||||||||||||||||||||||||||||||||||||||||
| CHCl3 | 8.81 | 540 | 4.19 | 99.30 | |||||||||||||||||||||||||||||||||||||||||||||||||||||||||||||||||||||||||||||||||||||||||||||||
The μ of those dyes was applied to estimate the polarity of the dyes, which was the product of the magnitude of the charge and the distance between the centers of the positive and negative charges. As shown in Table 2, the four dyes in the strong polar solvents, DMF, CH3CN, and CH3OH exhibited larger μ values than CHCl3. Apart from CH3OH, the λc and λexp of the four dyes exhibited the same bathochromic shift effect with decreased solvent εs. The obvious hypochromatic shifts and decrease of the ε values of the dyes in CH3OH were attributed to the protic solvent effect by a hydrogen bond between the dye molecules and CH3OH, which corresponded to higher μ in CH3OH.
The frontier molecular orbitals diagrams are shown in Fig. 4, HOMO is the π orbitals that existed in phenylazo moieties, meaning two phenyl rings linked by an azo bond, from the benzisothiazole section to phenyl rings. Comparing LUMO with HOMO, the electron distribution showed a slight change, which means S0–S1 was the local excitation caused by intramolecular charge transfer, the transition contributions were more than 99%, and CH3OH still the lowest among the four solvents, as shown in Table 2.
 | ||
| Fig. 4 Frontier molecular orbitals of dyes: L1–L4 are LUMO orbitals of D1–D4, and H1–H4 are HOMO orbitals of D1–D4. | ||
3.2. Dyeing property of the synthesized dyes for polyester fabrics
The synthesized four dyes were applied to polyester fabrics at the dye concentration of 1% (o.w.f.) using a high temperature and pressure dyeing method at pH = 4–5. CIELAB coordinates were measured, lightness (L*), a* present the degree of redness (+) and greenness (−), b* represent the degree of yellowness (+) and blueness (−), chroma (C*) and hue angle (h°) from 0° to 360°. The colorimetric data and K/S values of dyed polyester fabrics are listed in Table 3.| Samples | L* | a* | b* | C* | h° | K/S |
|---|---|---|---|---|---|---|
| D1 | 22.19 | 15.09 | −30.47 | 34.00 | 296.35 | 18.64 |
| D2 | 22.06 | 17.48 | −31.23 | 35.78 | 299.23 | 18.64 |
| D3 | 23.72 | 21.45 | −29.93 | 36.82 | 305.62 | 17.15 |
| D4 | 22.28 | 20.47 | −27.13 | 33.99 | 307.04 | 18.17 |
The absorption properties of these disperse dyes in the solution and the colorimetric properties of the polyester dyeing from such colorants are different. Although λexp of D1 and D2 was almost the same in the solution, obviously different color shades were observed with the naked eye, blue for D1 and purple blue for D2. D2 showed a redder shade than D1, which was attributed to a higher a* value. D3 dyed polyester fabric in hyacinth hue was distinct from D2, and exhibited a brighter hue than other analogues, which can be characterized using the increased a* value and decreased b* value in the negative. D3 and D4 showed almost the same λexp in the solution, D4 exhibited a higher ε value, which was attributed to a higher K/S value than D3. All four dyes achieved satisfactory color yields (K/S) leading to a heavy color depth at only 1% (o.w.f.) of the dye concentration.
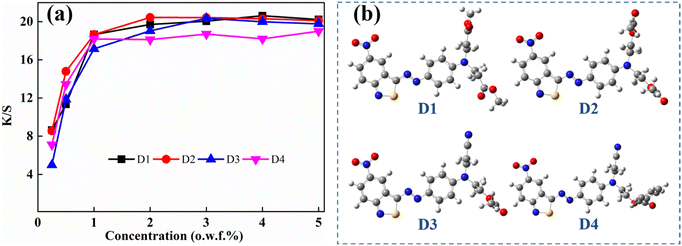
As shown in Fig. 5(a), the synthesized dyes exhibited increased color yield with increased dye concentration under 1%, with no significant improvement with further increased dye usage. The aimed dyes were azo bond connected benzisothiazole and phenyl structures, and exhibited excellent co-planarity, as shown in Fig. 5(b), which facilitated stronger dye–fiber interaction. The lattice dimensions of D1–D4 were also evaluated with DFT simulation, which were 1103, 1091, 957, and 1379 Å3, respectively. D4 showed a much larger molecular volume than the other dyes. The lower color yield of D4 at higher concentrations of over 2% was attributed to its twisted terminal ethopabate-induced surge molecular volume.
To investigate π–π interactions between dyes and polyester fabrics, face-to-face configurations were applied, and polyethylene glycol terephthalate (PET) was expressed as polyester. The chromogen-PET (a1), cyanoethyl-PET (a2), and ester-PET (a3) intermolecular interactions and their π–π interaction were studied and the data are shown in Fig. 6.
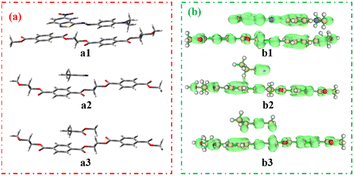 | ||
| Fig. 6 Intermolecular interaction models (a) and their π–π interaction models (b): green clouds mean π electron distribution. | ||
As shown in Fig. 7, a1–a3 interaction increases with the increased intermolecular distance with the minimum energy at 3.45–3.80 Å, which confirms the long-range interaction effect of the intermolecular system. The a1 configuration showed the minimum energy at 3.45 Å and −20.68 kcal mol−1, which was much larger than that of a2 and a3 configurations, the dominant dye–fiber interaction force was attributed to the chromogen skeleton. The a2 configurations showed the minimum energy at 3.80 Å, and exhibited stronger dye–fiber interaction than the a3 configuration, whose minimum energy was 3.50 Å at the similar minimum energy. The terminal groups, cyanoethyl and ester groups, showed obviously decreased interaction energy than the chromogen skeleton, which indicated that the chromogen skeleton plays the dominant role during the dye–fiber interaction.
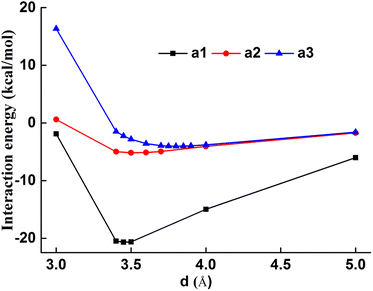 | ||
| Fig. 7 Intermolecular interaction energies of chromogen-PET (a1), cyanoethyl-PET (a2), ester-PET (a3). | ||
The fastness properties of the dyed fabrics, including rubbing fastness (dry and wet) washing fastness, sublimation fastness, and light fastness were evaluated using the grayscale rating (Table 4). Dry and wet rubbing fastness values of dyed polyester fabrics exhibited quite good dry and wet rubbing fastness with few exceptions. Ester-based dyes help to enhance affinity between the fiber and dye, enduring good rubbing fastness to the dyed fabrics. Ester-based dyes exhibited excellent washing fastness as expected, which can be attributed to the hydrolysis of pendant carboxylic acid ester groups. The bulk and polarity of synthesized dyes derived from ester-based coupling components exhibited high fastness to dry heat and achieved excellent sublimation.
| Samples | Fastness to rubbing | Fastness to washing | Fastness to sublimation | Fastness to light | |||||||||||||||||||||||||||||||||||||||||||||||||||||||||||||||||||||||||||||||||||||||||||||||
|---|---|---|---|---|---|---|---|---|---|---|---|---|---|---|---|---|---|---|---|---|---|---|---|---|---|---|---|---|---|---|---|---|---|---|---|---|---|---|---|---|---|---|---|---|---|---|---|---|---|---|---|---|---|---|---|---|---|---|---|---|---|---|---|---|---|---|---|---|---|---|---|---|---|---|---|---|---|---|---|---|---|---|---|---|---|---|---|---|---|---|---|---|---|---|---|---|---|---|---|
| Dry | Wet | SP | SC | SP | SC | ||||||||||||||||||||||||||||||||||||||||||||||||||||||||||||||||||||||||||||||||||||||||||||||
| a SC = staining on cotton; SP = staining on polyester. | |||||||||||||||||||||||||||||||||||||||||||||||||||||||||||||||||||||||||||||||||||||||||||||||||||
| D1 | 5 | 5 | 5 | 5 | 5 | 5 | 4–5 | ||||||||||||||||||||||||||||||||||||||||||||||||||||||||||||||||||||||||||||||||||||||||||||
| D2 | 4–5 | 5 | 5 | 5 | 5 | 5 | 5 | ||||||||||||||||||||||||||||||||||||||||||||||||||||||||||||||||||||||||||||||||||||||||||||
| D3 | 5 | 5 | 5 | 5 | 5 | 5 | 4–5 | ||||||||||||||||||||||||||||||||||||||||||||||||||||||||||||||||||||||||||||||||||||||||||||
| D4 | 4–5 | 5 | 5 | 5 | 5 | 5 | 4–5 | ||||||||||||||||||||||||||||||||||||||||||||||||||||||||||||||||||||||||||||||||||||||||||||
4. Conclusion
Four benzisothiazole azo disperse dyes containing ester groups were synthesized and characterized. D1 and D2 exhibited the same solvatochromic behaviors but showed absolutely different ε values in their solutions, which was attributed to the type of carboxyl ester group. Different ester groups substituted dyes exhibited different performances in visible absorption spectra. The solvatochromic effect was also observed in different polarized solvents and was explained with DFT simulations. These dyes were applied to the polyester fabrics using the high-temperature dyeing method, and the colorimetric properties and fastness parameters of the dyed fabrics were evaluated and compared. Quite high color yield values (K/S) were obtained, and the effect of molecular moieties on dye–fiber interaction was evaluated. All four dyes displayed excellent rubbing, washing, sublimation fastness, and good light fastness. It might be possible for the coloration of nylon, spandex, and their blended fabrics with good fastness and dyeing performance.Author contributions
X. S., A. H., and H. F. contributed to conceptualization, investigation, and writing original drat reparation. C. D. and Min L. contributed to writing the original draft. L. H., Mingda L. and Y. W. contributed to the conceptualization, review, and editing of the draft.Conflicts of interest
There are no conflicts to declare.Acknowledgements
This work was supported by the Postdoctoral Fellowship of Zhejiang Province [grant number ZJ2021109], Zhejiang Provincial Natural Science Foundation of China [grant number LQ23E030007], the Research project of Shaoxing University [grant number 2021LG014].Notes and references
- S. Fang, G. Feng, Y. Guo, W. Chen and H. Qian, Dyes Pigm., 2020, 176, 108225 CrossRef CAS.
- H. Jiang, L. Zhang, J. F. Cai, J. H. Ren, Z. H. Cui and W. G. Chen, Dyes Pigm., 2018, 151, 363–371 CrossRef CAS.
- L. Li, X. Song, S. Fang, L. Qian and H. Qian, Dyes Pigm., 2022, 201, 110239 CrossRef CAS.
- J. Qiu, J. Xiao, B. Tang, B. Ju and S. Zhang, Dyes Pigm., 2018, 160, 524–529 CrossRef.
- Y. Yang, M. Zhang, Z. Ju, P. Y. Tam, T. Hua, M. W. Younas, H. Kamrul and H. Hu, Text. Res. J., 2021, 91, 1641–1669 CrossRef CAS.
- X. Song, H. Chen, A. Hou and K. Xie, J. Mol. Liq., 2019, 296, 111892 CrossRef CAS.
- M. Wang, N. M. Hashem, H. Zhao, J. Wang, Y. Sun, X. Xiong, L. Zheng, M. Sofan and T. Abou Elmaaty, J. Supercrit. Fluids, 2021, 175, 105270 CrossRef CAS.
- S. Wang, L. Gao, A. Hou, K. Xie and X. Song, Dyes Pigm., 2021, 196, 109761 CrossRef CAS.
- X. Wang, J. Zhang, G. Liu, Y. Jiang, J. Du, D. Miao and C. Xu, ACS Omega, 2022, 7, 29858–29867 CrossRef CAS PubMed.
- X. Song, A. Hou, K. Xie and T. Hu, Fibers Polym., 2020, 21, 1743–1749 CrossRef CAS.
- E. M. Rufchahi and A. G. Gilani, Dyes Pigm., 2012, 95, 632–638 CrossRef CAS.
- A. Demirçalı, F. Karcı, O. Avinc, A. U. Kahrıman, G. Gedik and E. Bakan, J. Mol. Struct., 2019, 1181, 8–13 CrossRef.
- K. L. Georgiadou, E. G. Tsatsaroni and A. H. Kehayoglou, J. Appl. Polym. Sci., 2004, 92, 3479–3483 CrossRef CAS.
- M. Metwally, E. Abdel-Latif, F. Amer and G. Kaupp, Dyes Pigm., 2004, 60, 249–264 CrossRef CAS.
- H. Shaki, Fibers Polym., 2020, 21, 2530–2538 CrossRef CAS.
- J. H. Choi, S. H. Hong and A. D. Towns, Color. Technol., 1999, 115, 32–37 CAS.
- H. Battula, S. Anwarhussaini, S. A. Nahata, L. D. Patnaik, S. Ranga and S. Jayanty, J. Mol. Struct., 2021, 1225, 129090 CrossRef CAS.
- K. L. Georgiadou and E. G. Tsatsaroni, Dyes Pigm., 2002, 53, 73–78 CrossRef CAS.
- T. Tao, X.-L. Zhao, Y.-Y. Wang, H.-F. Qian and W. Huang, Dyes Pigm., 2019, 166, 226–232 CrossRef CAS.
- E. Karanikas, N. Nikolaidis and E. Tsatsaroni, J. Appl. Polym. Sci., 2012, 125, 3396–3403 CrossRef CAS.
- A. Hou, M. Li, F. Gao, K. Xie and X. Yu, Color. Technol., 2013, 129, 438–442 CAS.
Footnote |
| † Electronic supplementary information (ESI) available: Experimental and additional tables and figures for related components. See DOI: https://doi.org/10.1039/d3ra06452b |
| This journal is © The Royal Society of Chemistry 2024 |

