 Open Access Article
Evaluation of two core–shell (Ag2S@- and Bi2S3@-) sensors based on a metal–organic framework (NH2-MIL-125-Ti)/polyaniline for the electroanalysis of uric acid in urine samples†
Gullit
Deffo
 *ab,
Cyrille Ghislain
Fotsop
*ac,
Marcel Cédric Deussi
Ngaha
ad,
Sengor Gabou
Fogang
a,
Lionnel Averie
Vomo
a,
Bibiane Wandji
Nkuigoua
a,
Calmette Akenmo
Shella
a,
Alex Vincent
Somba
a,
Thierry Flavien Nde
Tene
a,
Ida Kouam
Tchummegne
ae,
Evangeline
Njanja
a,
Ignas Kenfack
Tonlé
 a,
Panchanan
Puzari
 b and
Emmanuel
Ngameni
f
aElectrochemistry and Chemistry of Materials, Department of Chemistry, Faculty of Science, University of Dschang, P. O. Box 67, Dschang, Cameroon. E-mail: gullitdeffo@gmail.com; fotsopcyril@yahoo.fr
bDepartment of Chemical Sciences, Tezpur University, Tezpur, Assam 784028, India
cInstitute of Chemistry, Faculty of Process and Systems Engineering, Universitätsplatz 2, 39106 Magdeburg, Germany
dDepartment of Chemistry, Higher Teacher Training College, University of Bamenda, Bambili P. O. Box. 39, Cameroon
eCenter for the Environment, Indian Institute of Technology Guwahati, Guwahati 781039, Assam, India
fUniversity of Yaoundé 1, Faculty of Science, Department of Chemistry, Laboratory of Analytical Chemistry, P. O. Box 812, Yaoundé, Cameroon
First published on 15th February 2024
Abstract
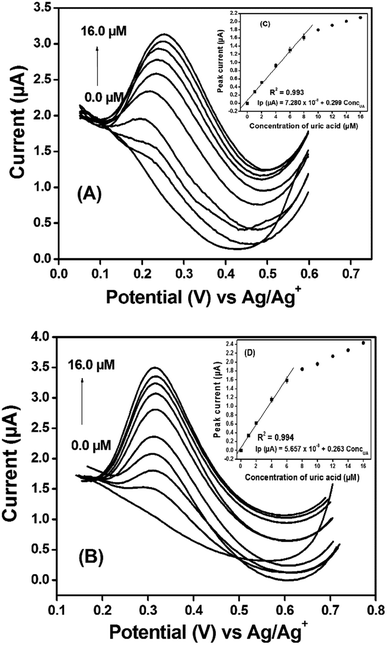
Chemical sensors for the determination of uric acid (UA) in human urine samples have been developed using a composite material based on two core–shells (Ag2S@- and Bi2S3@-) coated with a metal–organic framework (NH2-MIL-125-Ti) and polyaniline (PANI). The composite materials were characterized using Fourier transform infra-red (FTIR) spectroscopy, X-ray diffraction (XRD), scanning electron microscopy (SEM), energy dispersive X-ray (EDX/EDX-mapping), N2 adsorption–desorption, thermal gravimetric analysis/differential thermogravimetry (TGA/DTG), cyclic voltammetry (CV), and electrochemical impedance spectroscopy (EIS) techniques. Differential pulse voltammetry (DPV) studies show that the oxidation peak current of UA obtained with Ag2S@NH2-MIL-125(Ti)/PANI/GCE and Bi2S3@NH2-MIL-125(Ti)/PANI/GCE is respectively 2.45 and 2.31 times higher than the one obtained with a bare glassy carbon electrode (GCE). Calibration curves from 0 to 16 μM UA were generated after the optimization of critical parameters affecting the detection limit of UA. The sensitivities and limits of detection (LOD) obtained were 299.0 μA mM−1 and 0.579 μM, 263.0 μA mM−1 and 0.446 μM for Ag2S@NH2-MIL-125(Ti)/PANI/GCE and Bi2S3@/NH2-MIL125(Ti)/PANI/GCE, respectively. The developed sensors show good selectivity, reproducibility, repeatability and storage stability at room temperature. Finally, the sensor was successfully applied for the determination of UA in human urine samples. The sensors were able to detect UA in human urine samples even after 200 times dilution, offering new hope for future point-of-care testing (POCT) devices for uric acid analysis.
1. Introduction
In recent time, research on the development of electrochemical sensors and biosensors for human pathological samples has been drawing significant attention owing to their advantages such as improved sensitivity, operational simplicity, cost efficiency and the scope of converting to wearable miniaturized devices suitable for point-of-care testing (POCT) applications.1–3 The conventional analytical methods for these pathological samples include spectroscopic,4,5 chromatographic,6,7 enzyme-colorimetric8 and capillary electrophoresis.9 These methods require costly analytical instruments, trained personnel for analysis and they are time consuming which make them unsuitable for POCT application. In this regard, electrochemical methods are used as an alternative and promising strategy to achieve the objective of elaboration of point-of-care devices, especially for application in medicine. Medicinal compounds with more interest are found in the pathological samples. Uric acid (UA) is one of the compounds most frequently found in pathological samples. The amount of this species is the marker of health conditions of a human being as its low level as well as high level can cause different adverse health effects. In the human body, UA is produced by the metabolism of cells and purines.10 It provides an antioxidant defence in humans against oxidants and radicals, thereby, helping in the prevention of aging and cancer.11 Elevated levels of UA can cause hyperuricemia and gout and are closely related to other pathological symptoms such as fatty liver,11 heart disease,12 Parkinson's disease,13 atherosclerosis,14 kidney disease15 and Lesch-Nyhan syndrome.16 On the other hand, a low level of uric acid can cause certain genetic diseases.17,18 Due to the biomedical significance of UA, currently, the development of electrochemical sensors for its fast and low-cost effective quantification in physiological samples is gaining much research attention. Electrochemical methods for its determination in physiological samples face the problem that the oxidation potential of UA is close to some of the other compounds such as ascorbic acid, dopamine, acetaminophen, etc., thus interfering the analysis of one species by the other.19 Moreover, in physiological samples, uric acid is present at concentrations ranging from 160 to 500 μM.20–22 Therefore, the challenge while developing electrochemical sensors for this species is to prepare a receptor selective for the target analyte and which can detect it at a concentration in the physiological range or even less than that. Electrochemical sensors based on modification of a glassy carbon electrode (GCE) with different graphene-based composite materials show promising results in overcoming this problem. Such modifications include modification with PVP–graphene composites,23 reduced graphene oxide–palladium nanocomposites,24 titanium nitride-reduced graphene oxide composites,25 poly(sodium-4-styrenesulphonate) functionalized 3D graphene,26 holey nitrogen-doped graphene aerogels,27 and Ag nanoparticle-graphene oxide-poly(L-arginine) composites.28 Due to the increasing environmental awareness, in recent years, a significant research focus has been directed towards the utilization of biomass materials for the development of practical and value-added products including chemical sensors.29 Recently, Qi et al. have prepared Au nanoparticle-loaded egg shell CaCO3 composites for developing a nitrite sensor.30 Some research groups have reported the development of enzyme immobilization-based biosensors using an egg shell membrane (ESM) as the immobilization matrix.31 In our previous works, we have developed UA sensors and biosensors, based on biomass materials such as egg shell nano-CaCO3 and palm oil fibers.22–32 The design of new sensing materials for the detection of this physiological compound with higher sensitivity and resolution remains an area requiring much more work as the strategies for the development of wearable sensors are the final goal.33 Metal–organic frameworks (MOFs) as a new class of electrode materials offering new hope in this regard due to the synergistic catalytic behaviour and the electroactivity of the incorporated metals in MOFs.34 Nowadays, the utilization of MOFs as catalysts has attracted more and more attention owing to their versatile structures, topologies and composition, tunable functionalities, and highly ordered porous structure.35 They are crystalline materials made of organic linkers coordinatively connecting to metal-oxo clusters to yield a void-containing network.36 MOFs are known to have characteristics such as high porosity, high hydrothermal and chemical stability, and a large Brunauer–Emmett–Teller (BET)-specific surface area.36 Despite many promising advantages, the applications of MOFs in catalytic reactions are still largely restricted, mainly in terms of low activity caused by the blockage of active metal centers by organic linkers and the instability for recycling.37 To overcome the limitations, different kinds of strategies have been proposed including either introducing additional components into MOFs or pyrolyzing MOFs into different functional materials.35,38,40 Particularly, the latter route is much attractive due to the advantages of MOFs as precursors, such as flexible designability on compositions and micro/nanostructures, templating effect, and low cost. NH2-MIL-125(Ti), a porous amino-functionalized titanium based MOF, has been proved to be an efficient and stable support for metallic nanoparticles (Pd, Pt, and Au) and the resulting composites exhibited excellent heterogeneous catalytic performance.41 Improving the catalytic capacity of MOFs by coating their surface with metal particles to form core–shells has recently received high interest as a new avenue of research.35–41 Additionally, polymer materials reputed to be good conductors such as polyaniline would contribute to the signal amplification of an analyte. Polyaniline (PANI) is one of the most significant conducting polymers due to its facile preparation, tunable conductivity and high environmental stability. Thus, considerable efforts have been devoted to improving its unique electronic, optical and electrochemical properties, as well as the extensive applications in optical sensing and bio-electrochemical sensing.42 Taken together, the NH2-MIL-125(Ti) coated core–shell with PANI, to the best of our knowledge, has never been explored. In this work, composites of polyaniline and two core–shells@MOFs have been used to modify a bare GCE by drop coating and drying to form sensors labelled as Ag2S@NH2-MIL-125(Ti)/PANI/GCE and Bi2S3@/NH2-MIL-125(Ti)/PANI/GCE, used for the sensing of UA in urine samples. This work has not only demonstrated a novel use of core–shell-coated MOFs and polymer materials for a useful purpose, but it also shades new hopes for a potential alternative to the dependence on derived carbon materials in this field.2. Materials and methods
2.1. Materials
All chemicals and reagents were used as received without any purification. They included HCl (35%) and ammonium peroxydisulfate (NH4)2S2O8 (98%) from Emplura; gelatin from porcine skin; K3Fe(CN)6 (99%) and NaOH (98%) from Rankem; K2HPO4 (99%), KH2PO4 (99%), and KCl (99.5%) from Merck; 2-amino terephthalic acid (99%), titanium isopropoxide (99.8%), N,N-dimethylformamide (DMF, 99.8%), anhydrous methanol (99.8%), bismuth nitrate Bi(NO3)3·5H2O (99.5%), silver nitrate AgNO3 (99.8%), thiourea (98%), and uric acid (99%) were purchased from Sigma-Aldrich. Aniline, acetone and all other chemicals were purchased from Merck, Fisher and SRL.2.2. Synthesis of materials and preparation of working electrodes
NH2-MIL-125(Ti) was synthesized using the solvothermal method as previously described43,44 with modifications, briefly described in the ESI† (SI-1). The synthesis of Ag2S@NH2-MIL-125(Ti) and Bi2S3@NH2-MIL-125(Ti) is adapted from the method proposed45,46 with slight modifications shown in SI-2 (ESI†). Polyaniline (PANI) was synthesized using the method described (SI-3, ESI†).32–47 The geometric surface of the bare glassy carbon electrode (GCE) used (0.071 cm2) was calculated using the formula S = πr2, where π = 3.14 and the geometric radius r = 0.15 cm. Prior to its modification, the bare GCE was polished with alumina powder (0.3 μm size) and then sonicated in 1![[thin space (1/6-em)]](https://www.rsc.org/images/entities/char_2009.gif) :
:![[thin space (1/6-em)]](https://www.rsc.org/images/entities/char_2009.gif) 1 ethanol–water solution for 5 min. 4 mg of Ag2S@NH2-MIL-125(Ti) or Bi2S3@NH2-MIL-125(Ti) and 2 mg of PANI were dispersed in 1 mL (1
1 ethanol–water solution for 5 min. 4 mg of Ag2S@NH2-MIL-125(Ti) or Bi2S3@NH2-MIL-125(Ti) and 2 mg of PANI were dispersed in 1 mL (1![[thin space (1/6-em)]](https://www.rsc.org/images/entities/char_2009.gif) :
:![[thin space (1/6-em)]](https://www.rsc.org/images/entities/char_2009.gif) 1) of DMF/gelatin (5%) by ultrasonication for 30 min to give a homogeneous dispersion of Ag2S@NH2-MIL-125(Ti)/PANI or Bi2S3@NH2-MIL-125(Ti)/PANI. The clean GCE surface was then coated with 5 μL of resulting dispersions and dried in an oven at 40 °C for 15 min to obtain a thin film on the working electrode (referred as Ag2S@NH2-MIL-125(Ti)/PANI/GCE and Bi2S3@NH2-MIL-125(Ti)/PANI/GCE). For comparison studies, bare GCE, Ag2S/GCE, Bi2S3/GCE, NH2-MIL-125(Ti)/GCE, PANI/GCE, Ag2S@NH2-MIL-125(Ti)/GCE and Bi2S3@NH2-MIL-125(Ti)/GCE were also prepared using similar procedures.
1) of DMF/gelatin (5%) by ultrasonication for 30 min to give a homogeneous dispersion of Ag2S@NH2-MIL-125(Ti)/PANI or Bi2S3@NH2-MIL-125(Ti)/PANI. The clean GCE surface was then coated with 5 μL of resulting dispersions and dried in an oven at 40 °C for 15 min to obtain a thin film on the working electrode (referred as Ag2S@NH2-MIL-125(Ti)/PANI/GCE and Bi2S3@NH2-MIL-125(Ti)/PANI/GCE). For comparison studies, bare GCE, Ag2S/GCE, Bi2S3/GCE, NH2-MIL-125(Ti)/GCE, PANI/GCE, Ag2S@NH2-MIL-125(Ti)/GCE and Bi2S3@NH2-MIL-125(Ti)/GCE were also prepared using similar procedures.
2.3. Physicochemical and electrochemical procedures
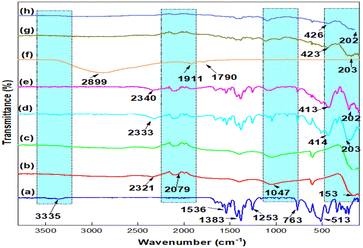
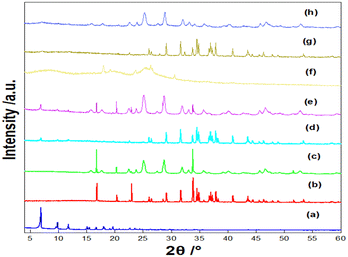
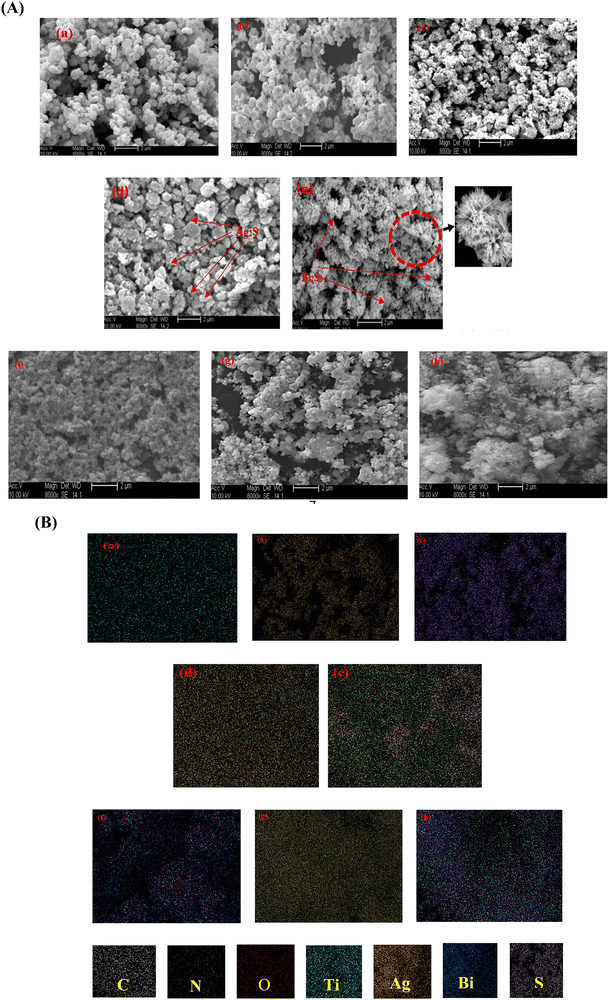
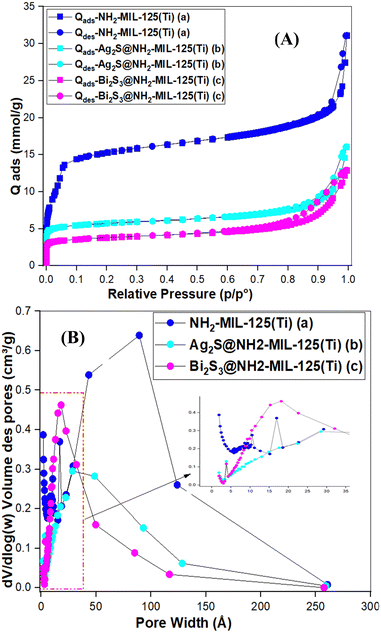
The physicochemical characterizations of NH2-MIL-125(Ti), Ag2S, Bi2S3, Ag2S@NH2-MIL-125(Ti), Bi2S3@NH2-MIL-125(Ti), PANI, Ag2S@NH2-MIL-125(Ti)/PANI, and Bi2S3@NH2-MIL-125(Ti)/PANI were performed via (i) Fourier transform infra-red (FTIR) spectroscopy conducted in the range of 4000–200 cm−1 using a spectrometer, specifically the “Nicolet iS50” model from Thermo Scientific, (ii) X-ray diffraction (XRD) recorded using CuKα radiation with wavelength (λ = 1.5406 Å) on an MPD X′Pert Pro diffractometer (PANanalytical), equipped with an X’Celerator detector, (iii) scanning electron microscopy/energy dispersive X-ray (SEM/EDX/SEM-mapping) using SEM (XL30 FESEM from FEI, Hillsboro) equipped with an EDX Genesis Energy Dispersive X-ray Detector, (iv) Brunauer–Emmett–Teller (BET) analysis using N2 adsorption–desorption isotherms, measured with a 3Flex share instrument from Micrometrics GmbH, Norcross, and (v) thermal gravimetric analysis/differential thermogravimetry (TGA/DTG) analyses using an STA 449C Jupiter instrument from Netzsch, Selb, Germany. Cyclic voltammetry (CV) and electrochemical impedance spectroscopic (EIS) techniques were used for the characterization of modified electrodes, while a differential pulse voltammetry (DPV) technique was used for the quantitative measurement of the uric acid (UA) analyte, and chronoamperometry (CA) was used for the interference studies. The conventional system of three electrodes was used, with the bare and modified GCE as a working electrode, platinum wire as an auxiliary electrode and Ag/AgCl (3 M KCl) as a reference electrode. Cyclic voltammograms were recorded from −0.80 to 1.0 V and from −0.050 to 0.850 V at a scan rate of 50 mV s−1, respectively, in 3 mL of 5 mM [Fe(CN)6]3−/4− (0.1 M KCl, pH 7.0) and 1 mM UA (PB, pH 7.0). Differential pulse voltammograms were recorded from −0.20 V to 0.90 V at step potential: 5 mV; amplitude: 60 mV; pulse width: 0.05 s; sample width: 0.01 s and pulse period: 0.2 s for all measurements, in 3 mL of UA solution in 0.1 M phosphate buffer (PB, pH 7.0). EIS was recorded in the frequency range from 1.0 kHz to 100.0 kHz at a potential of 0.40 V using 5 mM [Fe(CN)6]3−/4− in 0.10 M KCl. CA was conducted under pretreatment settings (Econdition = 0.450 V, tcondition = 0.0 s, Edeposition = 0.450 V and tdeposition = 5.0 s), and under amperometric detection settings [tequilibration = 5.0 s, tinterval = 1.0 s, trun = 1000.0 s, and Edc = 0.370 V (Ag2S@NH2-MIL-125(Ti)/PANI/GCE) or 0.440 V (Bi2S3@NH2-MIL-125(Ti)/PANI/GCE),] in 50 μM uric acid (0.10 M PB, pH 7.0) in the presence of 50 μM of interfering agents. The electroanalytical experiments were carried out on a PalmSens 3 potentiostat controlled by a computer, equipped with PSTrace (version 4.8) software for recording electrochemical experimental curves, and Origin™ 6.0 and 18 softwares for plotting the curves. Measurements of pH were carried out with a Metrohm 780 pH meter equipped with a glass electrode.3. Results and discussion
3.1. Physico-chemical characterization
3.2. Electrochemical characterization of the bare and modified GCEs
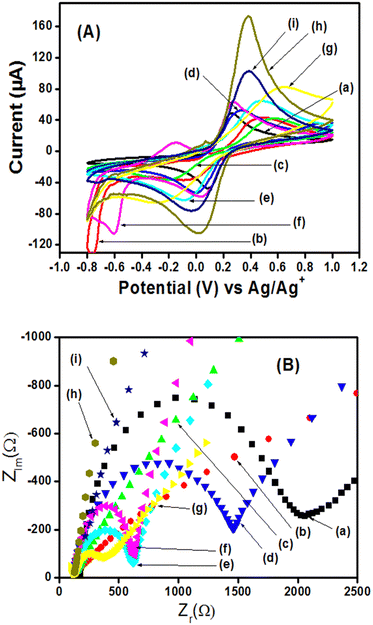
After the physicochemical characterization, the electrochemical characterization was performed using the potentiostat palmSens. In order to evaluate the permeability and conductivity of the prepared materials, the GCE modified with the thin film of each material was run inside 5 mM [Fe(CN)6]3−/4− in 0.1 M KCl (pH 7.0) using CV and EIS techniques. The intensity of the different peak currents obtained as shown in Fig. 6(A) follows the order h > i > g > e > f > d > a > b > c, while the values of charge transfer resistance (values given in bracket in Ohm) shown in Fig. 6(B) follow the order c (3264.85) > b (2768.73) > a (1913.44) > d (1340.97) > f (529.08) > e (479.92) > g (272.90) > i (38.16) > h (19.96). The highest values of the peak current obtained with Ag2S@NH2-MIL-125(Ti)/PANI/GCE (h) and Bi2S3@NH2-MIL-125(Ti)/PANI/GCE (i) which are, respectively, 3.78 and 2.31 times higher than the one obtained with bare GCE (a) can be explained by the synergistic effects of Ag2S, Bi2S3, NH2-MIL-125(Ti), and PANI, which are related respectively to their electrocatalytic ability, porosity, conductivity, and large specific surface area. The corresponding Rct values determined by the extrapolation of the semi-cycle of the Nyquist curves have shown that Ag2S@NH2-MIL-125(Ti)/PANI/GCE (h) and Bi2S3@NH2-MIL-125(Ti)/PANI/GCE allow the passage of electrons respectively 95.84 and 50.14 times faster than the bare GCE.The active surfaces of the bare GCE, Ag2S@NH2-MIL-125(Ti)/PANI/GCE, and Bi2S3@NH2-MIL-125(Ti)/PANI/GCE were found to be 0.0029 cm2, 0.0095 cm2, and 0.0062 cm2, respectively, obtained from the Randles Sevcik equation32,36,57,58 as shown in SI-6 (ESI†).
3.3. Electrochemical sensing of uric acid
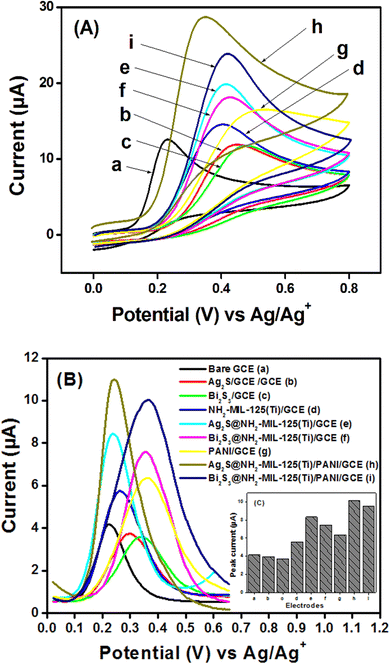
Prior to using each fabricated electrode for the electroanalysis of uric acid (UA), they were stabilized in a solution of 0.10 M phosphate buffer at pH 7.0, by running multicyclic voltammograms and it was found that maximum 6 cycles shown in Fig. SI-4 (ESI†) were sufficient to stabilize the working electrodes.The voltammograms shown in Fig. 7(B) were obtained between 0.0 V and 0.70 V. The highest peak current values obtained with Ag2S@NH2-MIL-125(Ti)/PANI/GCE and Bi2S3@NH2-MIL-125(Ti)/PANI/GCE are respectively 2.45 and 2.31 times higher than the one obtained with the bare GCE as shown in the inset histogram (Fig. 7(C)). These results can be explained by the good synergetic effect generated from the combination of the core–shells with a metal–organic framework and polyaniline. It can be noticed that the oxidation peak obtained with Ag2S@- has more electrocatalytic effect than Bi2S3@-, which is surely assigned to the fact that Ag has less weight than Bi. The types of interaction which may occur at the surface of the modified electrode have been illustrated in Scheme SI-1 (ESI†).
The kinetic studies have been evaluated at different scan rates in the scanning range from 10 to 150 mV s−1, as shown in Fig. SI-5 (ESI†). The plotting of the peak current versus the root square of the scan rate shows the correlation coefficient values (0.999 for Ag2S@- and 0.996 for Bi2S3@-) closed to 1, indicating that diffusion is the phenomenon which governs the transfer of particles at the surface of electrodes. Other kinetic parameters are given in SI-8 (ESI†).
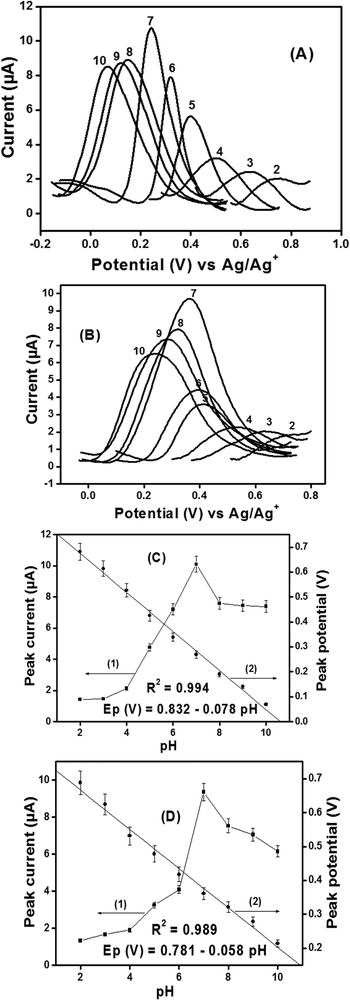
It is clearly seen in Fig. SI-6A and B (ESI†) that the peak current rapidly increases with the accumulation time up to 2 min and gets stabilized respectively for Ag2S@- and Bi2S3@- sensors. This increase can be explained by the large availability of the active surface areas and porosity sites, which get saturated after 2 min due to the total occupation of the fixation sites of the film by uric acid molecules. Therefore, pH 7.0 and accumulation time of 2 min (120 s) have been used as optimal parameters for the study of influence of concentration in the phosphate buffer solution.
| Electrode | Methods | Linear range (μM) | LOD (μM) | Ref. |
|---|---|---|---|---|
| DPV: Differential pulse voltammetry; SWV: square wave voltammetry; DP-ASV: differential pulse–anodic stripping voltammetry; HNGA/GCE: holey nitrogen-doped graphene aerogel; GQDs/IL-SPCE: graphene quantum dots/ionic liquid modified screen-printed carbon electrode; ERGO/GCE: electrochemically reduced graphene oxide modified glassy carbon electrode; Au/rGO/GCE: reduced graphene oxide and Au nanoplates modified glassy carbon electrode; G-30: graphene ink; PBG/GCE: poly(bromocresol green) modified glassy carbon electrode; DGH-Fc/GCE: ferrocene hybrid (Fc)/three dimensional graphene hydrogel (3DGH) nanocomposite modified glassy carbon electrode; ZIF-11/GCE: zeolite imidazolate framework-11 modified glassy carbon electrode; GO-PANI/GCE: graphene oxide-templated polyaniline microsheets modified glassy carbon electrode; nano-CaCO3/PANI/rGO/GCE: glassy carbon electrode modified with reduced graphene oxide, polyaniline, and nano-calcium carbonate; ERp-NBA/GO/CPE: carbon paste electrode modified with an electrochemically reduced para-nitrobenzoic acid/graphene oxide nanocomposite. | ||||
| HNGA/GCE | DPV | 5–50 | 0.12 | 27 |
| GQDs/IL-SPCE | DPV | 0.5–20 | 0.03 | 19 |
| ERGO/GCE | DPV | 0.5–60 | 0.5 | 61 |
| Au/rGO/GCE | DPV | 8.8–53 | 1.8 | 62 |
| Chitosan-graphene | DPV | 2.0–45 | 2 | 63 |
| G-30 | SWV | 0.5–150 | 0.29 | 64 |
| PBG/GCE | DPV | 0.5–200 | 0.17 | 65 |
| 3DGH-Fc/GCE | DPV | 8–400 | 0.07 | 66 |
| GO-PANI/GCE | DPV | 3–26 | 1 | 67 |
| ZIF-11/GCE | DP-ASV | 20–540 | 0.48 | 68 |
| Nano-CaCO3/PANI/rGO/GCE | DPV | 0.1–60 | 0.04 | 32 |
| ERp-NBA/GO/CPE | DPV | 0.1–600 | 0.05 | 69 |
| Ag2S@NH2-MIL-125(Ti)/PANI/GCE | DPV | 1–16 | 0.58 | This work |
| Bi2S3@NH2-MIL-125(Ti)/PANI/GCE | DPV | 1–16 | 0.45 | This work |
The reproducibility of the sensors has been evaluated by recording nine successive measurements on the same films and the DPV responses are shown in Fig. SI-8A and B (ESI†), and the repeatability was assessed by recording the signal of nine successive film preparations and the results are shown in Fig. SI-8C and D (ESI†), while the storage stability was evaluated by recording the DPV signal of the prepare electrodes once per week during five weeks (Fig. SI-8E and F, ESI†) respectively for Ag2S@NH2-MIL-125(Ti)/PANI/GCE and Bi2S3@NH2-MIL-125(Ti)/PANI/GCE. The results show that the prepared sensors have good reproducibility (recovery of 98.51 ± 0.95 and 95.76 ± 2.10), repeatability (recovery of 100.05 ± 0.08 and 96.56 ± 1.76), and stability (recovery of 97.27 ± 0.11 and 99.20 ± 0.003) respectively for Ag2S@- and Bi2S3@.
| Electrode | Analyte | UA detected (μM) | Spiked (μM) | Found (μM) | Recovery | RSD (%) |
|---|---|---|---|---|---|---|
| Recovery = found/(spiked + detected) × 100; RSD = relative standard deviation from the three spiked; ND = non determined. | ||||||
| Ag2S@NH2-MIL-125(Ti)/PANI/GCE | US1 | 1.37 | 2 | 3.23 | 95.85 | 1.45 |
| 4 | 5.20 | 96.78 | ||||
| 6 | 7.29 | 98.70 | ||||
| US2 | 1.03 | 2 | 3.17 | 104.35 | 4.03 | |
| 4 | 5.07 | 100.66 | ||||
| 6 | 6.77 | 96.30 | ||||
| Bi2S3@/NH2-MIL-125(Ti)/PANI/GCE | US1 | 0.85 | 2 | 2.89 | 101.44 | 3.49 |
| 4 | 4.63 | 95.44 | ||||
| 6 | 6.53 | 95.36 | ||||
| US2 | 0.68 | 2 | 2.57 | 95.71 | 3.33 | |
| 4 | 4.72 | 100.75 | ||||
| 6 | 6.81 | 102.01 | ||||
4. Conclusion
The aim of this study was to develop and compare the capacity of two core–shell sensors based on metal–organic frameworks (MOFs) and polyaniline (PANI) for the determination of a pathological analyte, uric acid (UA), in aqueous solution and urine samples. Accordingly, two sensors have been developed by preparing two composites of core–shells@MOF and PANi with 5% gelatin as the binder. After their immobilization on the glassy carbon electrode (GCE), Ag2S@NH2-MIL-125(Ti)/PANI/GCE and Bi2S3@/NH2-MIL-125(Ti)/PANI/GCE were then obtained as working electrodes. Prior to that, the individual and composite materials were characterized using physico-chemical and electrochemical techniques, showing the success of the synthesis with resulting good porosities and crystallinities, large specific surface areas, good thermal stabilities, low charge transfer resistance, etc. The fabricated sensors exhibited high sensitivity toward the electro-oxidation of UA over a calibration range from 0 to 16 μM, leading to higher sensitivities and limits of detection (LODs). The sensors showed good reproducibility, repeatability, stability, excellent selectivity, and were applied to analyze two human urine samples after dilution and spiking. The sensors were able to detect UA in urine samples even after 200 times of dilution. Finally, through the entire work, the sensor Ag2S@NH2-MIL-125(Ti)/PANI/GCE shows more promising results for the development of point-of-care devices than the sensor Bi2S3@/NH2-MIL-125(Ti)/PANI/GCE with a few exceptions in certain parameters.Author contributions
Gullit Deffo: conceptualization, formal analysis, methodology, investigation, writing original draft. Cyrille Ghislain Fotsop: S conceptualization, synthesis, characterizations, editing. Marcel Cédric Deussi Ngaha: methodology, editing, review. Sengor Gabou Fogang: formal analysis, investigation. Lionnel Averie Vomo: methodology, investigation. Bibiane Wandji Nkuigoua: methodology, investigation. Akenmo Shella: methodology, investigation. Alex Vincent Somba: review, editing. Thierry Flavien Nde Tene: review, editing. Ida Kouam Tchummegne: review, editing. Evangéline Njanja: review, validation, supervision. Ignas Kenfack Tonlé: validation, supervision. Panchanan Puzari: methodology, review, editing, validation. Emmanuel Ngameni: supervision, project administration.Conflicts of interest
There are no conflicts to declare.Acknowledgements
Dr Gullit DEFFO thanks DBT-TWAS for the fellowship DBT-TWAS Sandwich Postgraduate Fellowship (2019, FR number: 3240313785) and the contribution of the Alexander von Humboldt Foundation (AvH), the German Ministry for Economic Cooperation and Development (BMZ) and the African-German Network of Excellence in Science (AGNES, 2023). Mr Cyrille G. Fotsop thanks the German Academic Exchange Service (DAAD) for their financial support (FR number: 57588366). The authors also thank the volunteers who provided the urine samples for analysis.References
- Y. Dai and C. C. Liu, Recent Advances on Electrochemical Biosensing Strategies toward Universal Point-of-Care Systems, Angew. Chem., 2019, 58, 12355–12368 CrossRef CAS PubMed.
- J. Wang, Electrochemical Biosensors: Towards Point-of-Care cancer diagnostics, Biosens. Bioelectron., 2006, 21, 1887–1892 CrossRef CAS PubMed.
- A. S. John and C. P. Price, Existing and Emerging Technologies for Point-of-Care Testing, Clin. Biochem., 2014, 35, 155–167 Search PubMed.
- L. Fraisse, M. C. Bonnet, J. P. de Farcy, C. Agut, D. Dersigny and A. Bayol, A colorimetric 96-well microtiter plate assay for the determination of urate oxidase activity and its kinetic parameters, Anal. Biochem., 2002, 309, 173–179 CrossRef CAS PubMed.
- D. Jin, M. H. Seo, B. T. Huy, Q. T. Pham, M. L. Conte, D. Thangadurai and Y. I. Lee, Quantitative determination of Uric Acid Using CdTe Nanoparticles as Fluorescence Probes, Biosens. Bioelectron., 2016, 77, 359–365 CrossRef CAS PubMed.
- X. Dai, X. Fang, C. Zhang, R. Xu and B. Xu, Determination of serum uric acid using high-performance liquid chromatography (HPLC)/isotope dilution mass spectrometry (ID-MS) as a candidate reference method, J. Chromatogr. B: Anal. Technol. Biomed. Life Sci., 2007, 857, 287–295 CrossRef CAS PubMed.
- Q. Li, S. Wei, D. Wu, C. Wen and J. Zhou, Urinary Metabolomics Study of Patients with Gout Using Gas Chromatography-Mass Spectrometry, BioMed Res. Int., 2018, 2018, 1–10 Search PubMed.
- S. K. Maji, A. K. Mandal, K. T. Nguyen, P. Borah and Y. Zhao, Cancer cell detection and therapeutics using peroxidase-active nanohybrid of gold nanoparticle-loaded mesoporous silica-coated graphene, ACS Appl. Mater. Interfaces, 2015, 7, 9807–9816 CrossRef CAS PubMed.
- S. Zhao, J. Wang, F. Ye and Y. M. Liu, Determination of Uric Acid in Human Urine and Serum by Capillary Electrophoresis with Chemiluminescence Detection, Anal. Biochem., 2008, 378, 127–131 CrossRef CAS PubMed.
- S. R. Maxwell, H. Thomason, D. Sandler, C. Leguen, M. A. Baxter, G. H. Thorpe, A. F. Jones and A. H. Barnett, Antioxidant Status in Patients with Uncomplicated Insulin-Dependent and Non-Insulin-Dependent Diabetes Mellitus, Eur. J. Clin. Invest., 1997, 27, 484–490 CrossRef CAS PubMed.
- B. N. Ames, R. Cathcart, E. Schwiers and P. Hochstein, Uric Acid Provides an Antioxidant Defense in Humans against Oxidant- and Radical-Caused Aging and Cancer: A Hypothesis, Proc. Natl. Acad. Sci. U. S. A., 1981, 78, 6858–6862 CrossRef CAS PubMed.
- J. Liu, C. Xu, L. Ying, S. Zang, Z. Zhuang, H. Lv, W. Yang, Y. Luo, X. Ma, L. Wang, Y. Xun, D. Ye and J. Shi, Relationship of Serum Uric Acid Level with Non-Alcoholic Fatty Liver Disease and Its Inflammation Progression in Non-Obese Adults, Hepatol. Res., 2017, 47, E104–E112 CAS.
- M. T. Pellecchia, R. Savastano, M. Moccia, M. Picillo, P. Siano, R. Erro, A. Vallelunga, M. Amboni, C. Vitale, G. Santangelo and P. Barone, Lower Serum Uric Acid Is Associated with Mild Cognitive Impairment in Early Parkinson's Disease: A 4-Year Follow-up Study, J. Neural Transm., 2016, 123, 1399–1402 CrossRef CAS PubMed.
- Y. Kubota, M. McAdams-DeMarco and A. R. Folsom, Serum Uric Acid, Gout, and Venous Thromboembolism: The Atherosclerosis Risk in Communities Study, Thromb. Res., 2016, 144, 144–148 CrossRef CAS PubMed.
- K. Arora, M. Tomar and V. Gupta, Highly sensitive and selective uric acid biosensor based on RF sputtered NiO thin flm, Biosens. Bioelectron., 2011, 30, 333–336 CrossRef CAS PubMed.
- W. L. Nyhan, The recognition of Lesch-Nyhan syndrome as an inborn error of purine metabolism, J. Inherited Metab. Dis., 1997, 20, 171–178 CrossRef CAS PubMed.
- F. C. Martin, J. T. Suarez, H. G. Acosta, C. Aparicio, M. L. J. Roldan, B. Stiburkova, K. Ichida, M. A. M. Gomez, M. H. Goni, M. C. H. Barquero, V. Inigo, R. Enrique, E. C. Lanus, V. M. G. Nieto and R. T. Group, URAT1 and GLUT9 Mutations in Spanish Patients with Renal Hypouricemia, Clin. Chim. Acta, 2018, 481, 83–89 CrossRef PubMed.
- D. M. Vidanapathirana, S. Jayasena, E. Jasinge and B. Stiburkova, A Heterozygous Variant in the SLC22A12gene in a Sri Lanka Family Associated with Mild Renal Hypouricemia, BMC Pediatr., 2018, 18, 1–5 CrossRef PubMed.
- K. Kunpatee, S. Traipop, O. Chailapakul and S. Chuanuwatanakul, Simultaneous determination of ascorbic acid, dopamine, and uric acid using graphene quantum dots/ionic liquid modified screen-printed carbon electrode, Sens. Actuators, B, 2020, 314, 128059 CrossRef CAS.
- S. Reddy, B. E. K. Swamya and H. Jayadevappa, CuO nanoparticle sensor for the electrochemical determination of dopamine CuO nanoparticle sensor for the electrochemical determination of dopamine, Electrochim. Acta, 2012, 61, 78–86 CrossRef CAS.
- J. Huang, Y. Liu, H. Hou and T. You, Simultaneous Electrochemical determination of dopamine, uric acid and ascorbic acid using palladium nanoparticle -loaded carbon nanofiber modified electrode, Biosens. Bioelectron., 2008, 24, 632–637 CrossRef CAS PubMed.
- G. Deffo, R. Hazarika, M. C. D. Ngaha, M. Basumatary, S. Kalita, N. Hussain, E. Njanja, P. Puzari and E. Ngameni, Ultra-sensitive uric acid second generation biosensor based on chemical immobilization of uricase on functionalized multiwall carbon nanotube grafted palm oil fiber in the presence of ferrocene mediator, Anal. Methods, 2023, 15, 2456–2466 RSC.
- Y. Wu, P. Deng, Y. Tian, J. Feng, J. Xiao, J. Li, J. Liu, G. Li and Q. He, Simultaneous and sensitive determination of ascorbic acid, dopamine and uric acid via an electrochemical sensor based on PVP-graphene composite, J. Nanobiotechnol., 2020, 18, 1–13 CrossRef PubMed.
- Y. Wei, Y. Liu, Z. Xu, S. Wang, B. Chen, D. Zhang and Y. Fang, Simultaneous Detection of Ascorbic Acid, Dopamine, and Uric Acid Using a Novel Electrochemical Sensor Based on Palladium Nanoparticles/Reduced Graphene Oxide Nanocomposite, Int. J. Anal. Chem., 2020, 2020, 1–13 CrossRef PubMed.
- J. Feng, Q. Li, J. Cai, T. Yang, J. Chen and X. Hou, Electrochemical detection mechanism of dopamine and uric acid on titanium nitride-reduced graphene oxide composite with and without ascorbic acid, Sens. Actuators, B, 2019, 298, 126872 CrossRef CAS.
- L. Wang, R. Yang, L. Qu and P. B. Harrington, Electrostatic repulsion strategy for high-sensitive and selective determination of dopamine in the presence of uric acid and ascorbic acid, Talanta, 2020, 210, 120626 CrossRef CAS PubMed.
- S. Feng, L. Yu, M. Yan, J. Ye, J. Huang and X. Yang, Holey nitrogen-doped graphene aerogel for simultaneously electrochemical determination of ascorbic acid, dopamine and uric acid, Talanta, 2021, 224, 121851 CrossRef CAS PubMed.
- G. A. Tığ, Development of electrochemical sensor for detection of ascorbic acid, dopamine, uric acid and l-tryptophan based on Ag nanoparticles and poly(L-arginine)-graphene oxide composite, J. Electroanal. Chem., 2017, 807, 19–28 CrossRef.
- T. A. Hassan, V. K. Rangari and S. Jeelani, Value-Added Biopolymer Nanocomposites from Waste EggshellBased CaCO3 Nanoparticles as Fillers, ACS Sustainable Chem. Eng., 2014, 2, 706–717 CrossRef CAS.
- Q. Ding, L. Cao, M. Liu, H. Lin and D. P. Yang, Au nanoparticle-loaded eggshell for electrochemical detection of nitrite, RSC Adv., 2021, 11, 4112–4117 RSC.
- S. F. D'Souza, J. Kumar, S. K. Jha and B. S. Kubal, Immobilization of the urease on eggshell membrane and its application in biosensor, Mater. Sci. Eng., 2013, 33, 850–854 CrossRef PubMed.
- G. Deffo, M. Basumatary, N. Hussain, R. Hazarika, S. Kalita, E. Njanja and P. Puzari, Eggshell nano-CaCO3 decorated PANi/rGO composite for sensitive determination of ascorbic acid dopamine and uric acid in human blood serum and urine, Mater. Today Commun., 2022, 33, 104357 CrossRef CAS.
- D. Botta, I. Enculescu, C. Balan and V. C. Diculescu, Integrated architectures of electrodes and flexible porous substrates for point-of-care testing, Curr. Opin. Electrochem., 2023, 42, 101418 CrossRef CAS.
- X. Liao, H. Fu, T. Yan and J. Lei, Electroactive metal–organic framework composites: design and biosensing applications, Biosens. Bioelectron., 2019, 146, 111743 CrossRef CAS PubMed.
- B. Zhang, J. Zhang, X. Tan, D. Shao, J. Shi, L. Zheng, J. Zhang, G. Yang and B. Han, MIL-125-NH2@TiO2 Core−Shell Particles Produced by a Post-Solvothermal Route for High-Performance Photocatalytic H2 Production, ACS Appl. Mater. Interfaces, 2018, 10, 16418–16423 CrossRef CAS PubMed.
- R. T. Massah, T. J. M. M. Ntep, E. Njanja, S. L. Z. Jiokeng, J. Liang, C. Janiak and I. K. Tonle, A metal–organic framework-based amperometric sensor for the sensitive determination of sulfite ions in the presence of ascorbic acid, Microchem. J., 2021, 169, 106569 CrossRef.
- S. Zhao, Y. Wang, J. Dong, C. T. He, H. Yin, P. An, K. Zhao, X. Zhang, C. Gao, L. Zhang, J. Lv, J. Wang, J. Zhang, A. M. Khattak, N. A. Khan, Z. Wei, J. Zhang, S. Liu, H. Zhao and Z. Tang, Ultrathin Metal–Organic Framework Nanosheets for Electrocatalytic Oxygen Evolution, Nat. Energy, 2016, 1, 16184 CrossRef CAS.
- Q. Yang, Q. Xu and H. L. Jiang, Metal–Organic Frameworks Meet Metal Nanoparticles: Synergistic Effect for Enhanced Catalysis, Chem. Soc. Rev., 2017, 46, 4774–4808 RSC.
- K. E. DeKrafft, C. Wang and W. B. Lin, Metal–Organic Framework Templated Synthesis of Fe2O3/TiO2 Nanocomposite for Hydrogen Production, Adv. Mater., 2012, 24, 2014–2018 CrossRef CAS PubMed.
- R. V. Jagadeesh, K. Murugesan, A. S. Alshammari, H. Neumann, M. M. Pohl, J. Radnik and M. Beller, MOF-Derived Cobalt Nanoparticles Catalyze A General Synthesis of Amines, Science, 2017, 358, 326–332 CrossRef CAS PubMed.
- Y. Zhang1, J. Song, Q. Pan, X. Zhang, W. Shao, X. Zhang and C. J. Quan, and Li, An Au@NH2-MIL-125(Ti)-based multifunctional platform for colorimetric detections of biomolecules and Hg2+, J. Mater. Chem. B, 2020, 8, 114 RSC.
- Y. Bao, J. Song, Y. Mao, D. Han, F. Yang, L. Niu and A. Ivaska, Graphene Oxide-Templated Polyaniline Microsheets toward Simultaneous Electrochemical Determination of AA/DA/UA, Electroanalysis, 2011, 23, 878–884 CrossRef CAS.
- M. Sohail, Y.-N. Yun, E. Lee, S. K. Kim, K. Cho, J.-N. Kim, T. W. Kim, J.-H. Moon and H. Kim, MIL-125(Ti) with S-Shaped water Isotherms for adsorption Heat Transformation, Cryst. Growth Des., 2017, 17, 1208–1213 CrossRef CAS.
- M. Z. Hussain, M. Bahri, W. R. Heinz, Q. Jia, O. Ersen, T. Kratky, R. A. Fischer, Y. Zhu and Y. Xia, An in situ investigation of the thermal decomposition of metal–organic framework NH2-MIL-125(Ti), Microporous Mesoporous Mater., 2021, 316, 110957 CrossRef CAS.
- X. Zhang, Z. Chen, Y. Luo, X. Han, Q. Jiang, T. Zhou, H. Yang and J. Hu, Construction of NH2-MIL-125(Ti)/CdS Z-scheme heterojunction for efficient photocatalytic H2 evolution, J. Hazard. Mater., 2021, 405, 124128 CrossRef CAS PubMed.
- H. Zhao, Z. Xing, S. Su, S. Song, Z. Li and W. Zhou, Gear-shaped mesoporous NH2-MIL-53(Al)/CdS P-N heterojunctions as efficient visible-light-driven photocatalysts, Appl. Catal., B, 2021, 291, 120106 CrossRef CAS.
- J. Stejskal and R. G. Gilbert, Polyaniline. preparation of a conducting polymer, Pure Appl. Chem., 2002, 74, 857–867 CrossRef CAS.
- M. Karabacak, M. Cinar, Z. Unal and M. Kurt, FT-IR, UV spectroscopic and DFT quantum chemical study on the molecular conformation, vibrational and electronic transitions of 2-aminoterephthalic acid, J. Mol. Struct., 2010, 982, 22–27 CrossRef CAS.
- M. Oveisi, M. A. Asli and N. M. Mahmoodi, MIL-TI metal–organic frameworks (MOFs) nanomaterials as superior adsorbents: Synthesis and ultrasound-aided dye adsorption from multicomponent wastewater systems, J. Hazard. Mater., 2018, 347, 123–140 CrossRef CAS PubMed.
- T. K. Patil and M. I. Talele, Comparative study of semicoductors bismuth iodate, bismuth triiodide and bismuth trisulphide crystals, Adv. Appl. Sci. Res., 2012, 3, 1702–1708 CAS.
- R. Zamiri, H. A. Ahangar, A. Zakaria, G. Zamiri, M. Shabani, B. Singh and J. M. F. Ferreira, The structural and optical constants of Ag2S semiconductor nanostructure in the Far-Infrared, Chem. Cent. J., 2015, 9, 1–6 CrossRef CAS PubMed.
- J. Qiu, L. Yang, M. Li and J. Yao, Metal nanoparticles decorated MIL-125-NH2 and MIL-125 for efficient photocatalysis, Mater. Res. Bull., 2019, 112, 297–306 CrossRef CAS.
- K. L. T. Nguena, C. G. Fotsop, S. B. L. Ngomade, A. K. Tamo, C. A. Madu, F. I. Ezema and E. E. Oguzie, Mathematical modeling approach for the green synthesis of high-performance nanoporous zeolites Na-X optimized for water vapor sorption, Mater. Today Commun., 2023, 37, 107406 CrossRef CAS.
- S. B. L. Ngomade, C. G. Fotsop, K. L. T. Nguena, I. K. Tchummegne, M. L. T. Ngueteu, A. K. Tamo, G. Ndifor-Angwafor Nche and S. G. Anagho, Catalytic performances of CeO2@SBA-15 as nanostructured material for biodiesel production from Podocarpus falcatus oil, Chem. Eng. Res. Des., 2023, 194, 789–800 CrossRef CAS.
- A. V. Somba, E. Njanja, G. Deffo, C. G. Fotsop, K. Y. Tajeu, A. F. T. Njiemou, F. Eya’ane Meva and T. Kamgaing, Evaluation of Silver Nanoparticles Based on Fresh Cocoa Pods (Theobroma Cacao) Extracts as New Potential Electrode Material, J. Chem., 2023, 14, 6447994 Search PubMed.
- S. Kim, J. Kim, H. Kim, Y. H. Cho and W. S. Ahn, Adsorption/catalytic properties of MIL-125 and NH2-MIL-125, Catal. Today, 2013, 204, 85–93 CrossRef CAS.
- G. Deffo, R. C. T. Temgoua, S. F. Mbokou, E. Njanja, I. K. Tonlé and E. Ngameni, A sensitive voltammetric analysis and detection of Alizarin Red S onto a glassy carbon electrode modified by an organosmectite, Sens. Int., 2021, 2, 100126 CrossRef.
- G. Deffo, R. C. T. Temgoua, K. Y. Tajeu, E. Njanja, G. Doungmo, I. K. Tonle and E. Ngameni, Signal amplification by electropolymerization of alizarin red S for improved diuron detection at organosmectite modified glassy carbon electrode, J. Chin. Chem. Soc., 2021, 1–10 Search PubMed.
- C. Zhang, Z. Xiao, T. Qin and Z. Yang, Mechanism and kinetics of uric acid adsorption on nanosized hydroxyapatite coating, J. Saudi Chem. Soc., 2019, 23, 249–253 CrossRef CAS.
- S. G. Fogang, G. Deffo, L. S. Guenang, R. C. T. Temgoua, E. Njanja, I. K. Tonlé, A. Bhaumik and E. Ngameni, Nafion/Multiwalled Carbon Nanotubes/Mesoporous Silica Composite Modified Glassy Carbon Electrode for the Simultaneous Electrochemical Determination of Indigo Carmine and Carbendazim by Differential Pulse Voltammetry, Anal. Lett., 2023, 1–17 CrossRef.
- L. Yang, D. Liu, J. Huang and T. You, Simultaneous determination of dopamine, ascorbic acid and uric acidat electrochemically reduced graphene oxide modified electrode, Sens. Actuators, B, 2014, 193, 166–172 CrossRef CAS.
- C. Wang, J. Du, H. Wang, C. Zou, F. Jiang, P. Yang and Y. Du, A facile electrochemical sensor based on reduced graphene oxide and Au nanoplates modified glassy carbon electrode for simultaneous detection of ascorbic acid, dopamine and uric acid, Sens. Actuators, B, 2014, 204, 302–309 CrossRef CAS.
- D. Han, T. Han, C. Shan, A. Ivaska and L. Niua, Simultaneous Determination of Ascorbic Acid, Dopamine and Uric Acid with Chitosan-Graphene Modified Electrode, Electroanalysis, 2010, 22, 2001–2008 CrossRef CAS.
- L. Fu, A. Wang, G. Lai, W. Su, F. Malherbe, J. Yu, C.-T. Lin and A. Yu, Defects regulating of graphene ink for electrochemical determination of ascorbic acid, dopamine and uric acid, Talanta, 2018, 180, 248–253 CrossRef CAS PubMed.
- X. Ouyang, L. Luo, Y. Ding, B. Liu, D. Xu and A. Huang, Simultaneous determination of uric acid, dopamine and ascorbic acid based on poly(bromocresol green) modified glassy carbon electrode, J. Electroanal. Chem., 2015, 748, 1–7 CrossRef CAS.
- Q. Zhu, J. Bao, D. Huo, M. Yang, H. Wu, C. Hou, Y. Zhao, X. Luo and H. Fa, 3DGH-Fc based electrochemical sensor for the simultaneous determination of ascorbic acid, dopamine and uric acid, J. Electroanal. Chem., 2017, 799, 459–467 CrossRef CAS.
- Y. Bao, J. Song, Y. Mao, D. Han, F. Yang, L. Niu and A. Ivaska, Graphene Oxide-Templated Polyaniline Microsheets toward Simultaneous Electrochemical Determination of AA/DA/UA, Electroanalysis, 2011, 23, 878–884 CrossRef CAS.
- T. S. Thanh, P. T. Qui, N. T. T. Tu, T. T. T. Toan, T. T. B. Hoa, L. V. T. Son, D. M. Nguyen, T. N. Tuyen and D. Q. Khieu, Electrochemical Determination of Uric Acid in Urine by Using Zeolite Imidazolate Framework-11 Modified Electrode, J. Nanomater., 2021, 2021, 1–13 CrossRef.
- Z. Hadi and K. h Ghanbari, A novel electrochemical sensor for determination of uric acid in the presence of ascorbic acid and dopamine based on a carbon paste electrode modified with an electrochemically reduced para-nitrobenzoic acid/graphene oxide nanocomposite, New J. Chem., 2022, 46, 12941–12951 RSC.
Footnote |
| † Electronic supplementary information (ESI) available. See DOI: https://doi.org/10.1039/d3ma01182h |
| This journal is © The Royal Society of Chemistry 2024 |

