 Open Access Article
First-principles study of superionic Na9+xSnxM3−xS12 (M = P, Sb)†
Anastassia
Sorkin
and
Stefan
Adams
 *
*
Department of Materials Science and Engineering, National University of Singapore, Singapore 117575. E-mail: mseasn@nus.edu.sg
First published on 20th April 2020
Abstract
Inspired by the fast lithium superionic conductor Li10GeP2S12, a new class of quaternary fast sodium-ion conductors, Na9+xSnxP3−xS12, has recently been identified. Among these, Na11Sn2PS12 was the fastest sodium ion-conducting sulphide in spite of its moderately low migration barriers. The isostructural Na+-ion electrolytes Na9+xSnxSb3−xS12 found soon thereafter combined only slightly lower ionic conductivity with excellent air stability and processability in aqueous solutions. Here we apply density functional theory to comprehensively study the stability and homogeneity range of these disordered Na+ ion conductors: For Na9+xSnxP3−xS12 we explored the composition range 1.75 ≤ x ≤ 2.25 as well as x = 1 (Na10SnP2S12), x = 0 (Na3PS4) and x = 3 (Na4SnS4). For Na9+xSnxSb3−xS12 we extended the range of calculations to x = 0, 1, 3, and 1.625 ≤ x ≤ 2.375. In both cases we find that the lowest energy composition is the stoichiometric phase with x = 2 and clarify that these compositions are also stable against decomposition into Na4SnS4 and Na3PS4 (or Na3SbS4). Our ab initio molecular dynamics (AIMD) simulations show that despite the exceptionally high local mobility of Na on Na6 sites, the negligible Na6 concentration in the stable lowest energy structure rules out a previously supposed key role of Na6 in ionic conductivity at room temperature. On the other hand, an onset of PS4 (but not SnS4) orientational disorder is observed above 500 K in our high temperature AIMD studies and characterised by analysing van Hove correlation functions. This orientational disorder affects the relative Na site energies enabling Na6 site occupancy and lowers the barriers for Na+ migration and. As soon as the orientational disorder allows for a significant Na6 occupancy, it also significantly contributes to the Na+ ion transport.
1. Introduction
Solid-state Li ion conductors have been studied intensely over the past decades.1–14 In particular, Li10GeP2S12 (LGPS) (space group: P42/nmc) discovered by the Kanno group in 20113–6 reached a room-temperature conductivity of 12 mS cm−1 and halide doping was reported to double the conductivity of this structure type soon thereafter.11 However, while solid-state Li-based batteries overcome the safety issue of conventional Li-ion batteries a wider market penetration of Li-based batteries is hampered by their high cost. Na-based solid state batteries are considered as a promising alternative to their lithium-based analogues because of huge cost advantages related not only to the abundance of sodium but also to the possibility to replace the costly copper current collectors required in Li-based batteries.13–23While at the early stages of solid state ionics fast Na+ ion conducting oxide ceramics such as β′′-alumina24 and the so-called NaSICONs with structures related to Na3Zr2(SiO4)2(PO4) dominated research on Na+ solid electrolytes,25,26 more recently fast Na-ion conducting sulphides have attracted great attention15–17,27 because of their potential to combine record fast ion transport with processing advantages over oxides such as lower sintering temperature and easier densification. The first fast Na+-ion conducting sulphide, c-Na3PS4 was discovered in 2012 when a conductivity of 0.5 mS cm−1 was reached.16,17,28 While the role of the tetragonal-to-cubic phase transition in Na3PS4 is still under debate,29 the conductivity of Na3PS4 and was progressively enhanced up to 2.5 mS cm−1 by MP′ (M = Si, Ge, Sn) doping27,30 creating mobile excess Na, by halide doping ClS′ creating Na vacancies,31,32 and more recently further to 3.4 mS cm−1 by quenching from high temperatures that might lead to both Na–P antisite doping33 and PS4 orientational disorder. In nominally undoped phases, conductivity was enhanced by isovalent AsP substitution utilizing the mixed immobile ion strategy (cf. 1.5 mS cm−1 achieved in Na3P0.62As0.38S4).34 Partial or complete replacement of sulphur by the softer selenium led to an enhanced conductivity of 1.2 mS cm−1.23,35
Interest in exploring the related Na3SbS4 as solid electrolyte originates not only from its similarly fast ion transport in nominally pure (1 mS cm−1) or analogously doped states,36–38 but also from its stability against hydrolysis, which enables scalable low cost solution processing. It should be noted that after the completion of this study a considerably higher ionic conductivity of 32 mS cm−1 has just been reported in highly W-doped Na3SbS4.39,40 Despite the structural similarities to Na3SbS4, tetragonal Na4SnS4 (space group P![[4 with combining macron]](https://www.rsc.org/images/entities/char_0034_0304.gif) 21c) is practically insulating with an ionic conductivity <10−4 mS cm−1.41
21c) is practically insulating with an ionic conductivity <10−4 mS cm−1.41
Inspired by the then record high conductivity of LGPS3 and the related Li10MP2S12 family of compounds (M = Ge, Si, Sn)7–11 the existence of isostructural Na10MP2S12 (M = Si, Ge, Sn) was predicted by first-principle calculations as metastable phases with the same tetragonal space group P42/nmc adopted by LGPS. The room temperature conductivity of Na10GeP2S12 was initially predicted by Kandagal et al. to be 4.7 mS cm−1,42i.e. higher than that of other any fast Na-ion conducting solid electrolyte used in practical high-temperature Na–S batteries. Richards et al.43 reaffirmed the prediction of LGPS-like Na10GeP2S12 and expanded it to Na10MP2S12 phases with M = Si or Sn. Their ab initio molecular dynamics (AIMD) simulations suggested the phases to be essentially one-dimensional ion conductors forming chains of NaS4 tetrahedra linked along the c-axis providing facile mobility. From their high temperature simulations in the temperature range 1300–600 K they extrapolated to predicted room temperature conductivities of 0.9 (M = Sn), 3.5 (M = Ge) or 10 mS cm−1 (M = Si). In the same paper these authors reported the synthesis of a tetragonal phase then identified as Na10SnP2S12,43 though they found unquantified “small amounts” of P2S5 and Na3PS4 as impurities besides the expected tetragonal phase. This implies that the Sn![[thin space (1/6-em)]](https://www.rsc.org/images/entities/char_2009.gif) :
:![[thin space (1/6-em)]](https://www.rsc.org/images/entities/char_2009.gif) P ratio in the main phase should be larger than 1
P ratio in the main phase should be larger than 1![[thin space (1/6-em)]](https://www.rsc.org/images/entities/char_2009.gif) :
:![[thin space (1/6-em)]](https://www.rsc.org/images/entities/char_2009.gif) 2. Their material exhibited an experimental conductivity of 0.4 mS cm−1, an order of magnitude smaller than predicted. When Tsuji et al. in 2017 synthesized Na10GeP2S12,44 they found the room temperature structure of the crystalline component to differ from the prediction and its overall room temperature Na+ ionic conductivity (0.012 mS cm−1) to be about 300 times lower than expected.
2. Their material exhibited an experimental conductivity of 0.4 mS cm−1, an order of magnitude smaller than predicted. When Tsuji et al. in 2017 synthesized Na10GeP2S12,44 they found the room temperature structure of the crystalline component to differ from the prediction and its overall room temperature Na+ ionic conductivity (0.012 mS cm−1) to be about 300 times lower than expected.
In 2017, both the Nazar group45 and a team led by Dehnen and Roling involving one of us46 independently produced and analysed a new solid electrolyte, Na11Sn2PS12 (NSPS), by varying the Na3PS4 and Na4SnS4 precursor content to achieve phase-pure products. NSPS crystallizes in the distinct tetragonal space group I41/acd with Na+ ions distributed over six types of Na sites (see Fig. 1). Within weeks, a non-stoichiometric variant was reported by Yu et al.47 The observed ionic conductivities, their activation energies as well as the refined Na distributions differed considerably among the first reports. According to ref. 46 NSPS possesses a room temperature Na+ ion conductivity of 3.7 mS cm−1, which exceeds that of all previously known sulphide-based Na+ ion conductors. This high ionic conductivity is unanimously attributed to the presence of a large number of intrinsic Na+ vacancies and a large variety of three-dimensional Na-ion conduction pathways, but details of the predicted pathways differed among the reports. Density Functional Theory (DFT) based ab initio studies on NSPS also exhibited surprising disagreement: while Liu et al.48 suggested Na11Sn2PS12 to be unstable against decomposition into Na3PS4 and Na4SnS4 with a substantial energy of 14.5 meV per atom above the hull, Yu et al.47 as well as later Oh et al.49 reported Na11Sn2PS12 to be thermodynamically stable against this decomposition.
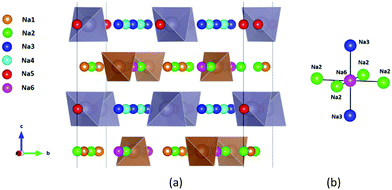 | ||
| Fig. 1 Distribution of Na sites in the structure of Na11Sn2PS12: (a) overview of Na site distribution in one half of the unit cell projected approximately on the b–c plane. Grey (brown) tetrahedra represent SnS4 (PS4), coloured spheres the partially occupied Na sites (Na1 (16f) orange, Na2 (32g) green, Na3 (16d) dark blue, Na4 (16c) light blue, Na5 (16e) red and Na6 (8b)). The naming of the Na sites follows ref. 46. (b) Detail of the structure model highlighting the local Na sites adjacent to the low occupancy site Na6. This cluster of Na sites will be referred to as the (Na2)4(Na3)2Na6 site cluster below, while the 3 Na sites Na1, Na4 and Na5 not involved in the cluster will be referred to as “matrix sites”. | ||
Again within weeks after the first NSPS papers Heo et al.41 reported the synthesis of analogous phases Na4−xSn1−xSbxS4 (0.02 ≤ x ≤ 0.33, corresponding to the composition range Na11.94Sn1.94Sb0.06S12 to Na11Sn2Sb1S12) crystallizing in the same space group I41/acd so that Na11Sn2PS12 and Na11Sn2SbS12 should effectively be isostructural. However, at higher Sb contents (x = 0.4, 0.5), a significant amount of also fast ion-conducting Na3SbS4 was observed as a secondary phase. The authors found the conductivity to increases with the Sb content x up to a maximum value of 0.30 mS cm−1 with an activation energy of 0.39 eV at x = 0.40 (though this value may be biased by the Na3SbS4 impurity). By increasing the annealing temperature to 550 °C they could further optimize the conductivity of a nearly phase-pure sample of x = 0.25 (corresponding to Na11.25Sn2.25Sb0.75S12) to 0.51 mS cm−1. Later Ramos et al.50 reported a room temperature ionic conductivity of 0.56 mS cm−1 for Na11Sn2SbS12, considerably lower than that of Na11Sn2PS12, which the authors attributed to the effect of a reduced population of the Na6 site on the overall Na+ ion mobility. They also experimentally explored the possibility to further increase the Na vacancy concentration by varying the Sn/Sb ratio in Na11Sn2SbS12 to form Na11−xSn2−xSb1+xS12 (x = 0.2, 0.25, 0.5). Their Sb rich samples however contained Na3SbS4 as an impurity, so that (in agreement with Heo et al.41) they suggest that the presumed homogeneity range should be limited to Na11Sn2SbS12 on the Sb-rich side. Moreover, the phase-impure Sb-rich samples exhibited lower ionic conductivities.
The corresponding selenide solid electrolyte, Na11.1Sn2.1P0.9Se12, first synthesized in 2018 by Duchardt et al.51 shows virtually the same room temperature Na+ ion conductivity (3.0 mS cm−1) as NSPS but with a considerably lower activation energy of 0.30 eV. The structure determination of the selenide phase also revealed that besides the Sn/P disorder of the prepared slightly off-stoichiometric sample, there is substantial rotational disorder of the PSe4 (but not the SnSe4) tetrahedra. Bond valence site energy models clarified that the resulting different local structures alter the ion transport pathways. Zhang et al. confirmed the disorder for both their nominally stoichiometric Na11Sn2PS12 and Na11Sn2PSe12 samples by diffraction studies.52 While from the structural studies it was not clear whether the rotational disorder is static or dynamic, the same authors conclude from their high temperature AIMD simulations that the disorder is dynamic (analogous to what had been proposed for Li10GeP2S12 before5) and constitutes a paddle-wheel mechanism, i.e. a dynamic coupling of cation hops to PS4 anion rotations.52,53 Yu et al.54 suggested on the basis of bonding energy models as well as DFT-based phonon- and ab initio molecular dynamics (AIMD) calculations that the enhanced conductivity in stoichiometric Na11Sn2PSe12 is to be attributed to the lower bonding energy of Na+ ion with the surrounding anions and a supposed increased disorder relative to NSPS. In the meanwhile our group has synthesized Na11Sn2PSe12 also by a mechanochemical method,55 which should be more scalable than the previously reported syntheses in sealed ampoules,51,54 and demonstrated its use in the first high power sodium selenium all solid state batteries.
The DFT study by Oh et al.49 affirmed earlier predictions43 that substituting Sn by Ge or Si should result in similarly stable phases Na11Ge2PS12 and Na11Si2PS12, but in contrast to the earlier AIMD study found that the substitution would severely impede Na+ diffusion. The room temperature Na+ ion conductivity is predicted to decrease from 2.4 mS cm−1 for M = Sn to 0.6 mS cm−1 for M = Ge and 0.3 mS cm−1 for M = Si, which the authors mainly attributed to the shrinking on the unit cell size. Some mixed immobile cation Sn–Si-analogues of NSPS have been published recently but only preliminarily characterized:56 among these, Na4Sn0.67Si0.33S4 adopts the same space group I41/acd as NSPS. Na3.75[Sn0.67Si0.33]0.75P0.25S4 and exhibits a conductivity of 1.6 mS cm−1. Literature data on ionic conductivity, activation energy of the Na+ and Li+-ion conducting thiophosphate-related solid electrolytes are summarised in Table 1.
| Compound | σ 298K (mS cm−1) | E A (eV) | Data type | Ref. |
|---|---|---|---|---|
| a Structure not reported. | ||||
| Li10GeP2S12 | 12.0 | 0.25 | Exp. | 3 |
| Na3PS4 | 0.46 | 0.28 | Exp. | 16 |
| Na3PSe4 | 1.16 | 0.21 | Exp. | 23 |
| Na3SbS4 | 3.0 | 0.25 | Exp. | 38 |
| Na2.88Sb0.88W0.12S4 | 32.0 | 0.22 | Exp. | 39 |
| Na4SnS4 | <10−4 | — | Exp. | 41 |
| Na10GeP2S12 | 4.70 | 0.20 | Ab initio | 42 |
| 3.50 | 0.27 | Ab initio | 43 | |
| 0.012 | 0.46 | Exp.a | 44 | |
| Na10SnP2S12 | 0.94 | 0.32 | Ab initio | 43 |
| 0.40 | 0.36 | Exp. | 43 | |
| Na11Sn2PS12 | 3.70 | 0.39 | Exp. | 46 |
| 1.40 | 0.25 | Exp. | 45 | |
| 2.40 | 0.20 | Ab initio | 45 | |
| 2.10 | — | Ab initio | 48 | |
| 0.67 | 0.31 | Exp. | 47 | |
| — | 0.27–0.33 | Ab initio | 47 | |
| 2.4 | 0.25 | Ab initio | 49 | |
| 3.7 | 0.26 | Ab initio | This work | |
| Na10.8Sn1.8Sb1.2S4 | 0.30 | 0.39 | Exp. | 41 |
| Na11Sn2SbS12 | 0.56 | 0.34 | Ab initio | 50 |
| Na11Ge2PS12 | 4.7 | — | Ab initio | 48 |
| 0.6 | 0.30 | Ab initio | 49 | |
| Na11Si2PS12 | 0.3 | 0.32 | Ab initio | 49 |
| Na4(Sn2/3Si1/3)S4 | 0.0123 | 0.56 | Exp. | 56 |
| Na3.8(Sn2/3Si1/3)0.8P0.2S4 | 0.31 | 0.32 | Exp. | 56 |
| Na3.75(Sn2/3Si1/3)3/4P1/4S4 | 1.6 | 0.26 | Exp. | 56 |
| Na3.7(Sn2/3Si1/3)0.7P0.3S4 | 0.71 | 0.29 | Exp. | 56 |
| Na11.1Sn2.1P0.9Se12 | 3.0 | 0.30 | Exp. | 51 |
| Na11Sn2P1Se12 | 2.15 | 0.28 | Exp. | 54 |
| Na11Sn2P1Se12 | 1.0 | — | Exp. | 55 |
From the studies above there is still substantial disagreement regarding (1) the detailed stoichiometry and stability of the phase of highest Na+ ion conductivity, (2) the achievable room temperature conductivity and the associated activation energy, (3) the occurrence of polyanion reorientations, (4) the distribution of Na ions over the six reported Na sites, and (5) the relevance of these Na sites (especially of Na6) and of tetrahedral reorientations for the ion transport mechanism. The aim of this work is therefore to clarify these points starting from static and dynamic DFT calculations of the relative stability of the phases Na9+xSnxM3−xS12 and Na9+xSnxSb3−xS12 (M = P, Sb) covering the composition range 1.75 ≤ x ≤ 2.25 as well as the LGPS-analogue composition x = 1 and the distribution of Na+ ions therein. We will show that the lowest energy configuration of Na ions for each compound in the series can be derived systematically from the distribution for an adjacent composition by mutual substitution of Sn and P or Sb atoms. We will look into how the dynamic Na distribution and polyanion orientation in ab initio molecular dynamics simulations for the stoichiometric phases deviates from the energy-minimized equilibrium structures and how this affects the characteristics of the Na+ ion diffusion.
2. Computational methods
All DFT-based first-principles calculations in this work were performed by the Vienna Ab initio Simulation Package (VASP 5.3.3).57,58 According to previous experimental crystal data45–47,49 we built local structure models of Na11Sn2PS12 and Na11Sn2SbS12 containing 208 atoms, where the immobile substructures obey the I41/acd space group symmetry: 16 Sn atoms were placed in the 16e Wyckoff sites, 8 P (or Sb) atoms were places in 8a sites, 96 S atoms were placed in three 32g sites in such a way that they formed SnS4 and PS4 (SbS4) tetrahedra which delimit wide Na+ ion channels along the c axis and within the ab planes. The Na atoms occupy 88 out of 104 positions from 16f (Na1), 32g (Na2), 16d (Na3), 16c (Na4), 16e (Na5) and 8b (Na6) sites (following the Na site naming convention introduced in ref. 46). Further details on the computational methods are summarised in the ESI.† Note that the reported occupancy of the 8b site (Na6) is rather low for both Na11Sn2PS12 (experimental site occupancy factors of 0.1247 to 0.2250 at room temperature; 0.16546 at 100 K) and Na11Sn2SbS12 (0.07650 at room temperature), while the site is reported to be 74% occupied in the Se-analogue Na11.1Sn2.1P0.9Se12.51 Ramos et al. concludes that Na6 sites only slightly contribute to Na+ ion diffusion “but provide an accessible parking spot for the major sodium conduction pathway”.50 The experimentally observed occupancy of the Na2 and Na3 crossover sites is higher in Na11Sn2SbS12 than in Na11Sn2PS12 due to a redistribution of sodium atoms from Na6 interstitials onto these Na2 and Na3 sites, which has been linked to the reduced conductivity of Na11Sn2SbS12. In contrast DFT simulations by Oh et al.49 suggest that the Na6 site occupancy for Na11Sn2PS12 should be almost zero even at 700–800 K and that the effect of an incorporation of additional sodium vacancy/interstitial between Na6 and Na2/Na3 sites on the ionic conductivity should be negligible.To determine the ground state configuration of partially occupied Na sites, we optimised and calculated the energies of about 200 trial configurations out of the 2.7 × 10¹⁸ possible ways to place the 88 Na on 104 sites in each of the two studied Na88Sn16M8S96 phases (or still 1.3 × 10¹¹ possibilities if only the 96 sites Na1 to Na5 are considered) with an accuracy of 10−3 eV between two relaxation steps. The consecutive choice of trial structures for the non-stoichiometric variants followed a learning curve that was optimised based on the stabilization procedures observed in previous trial structures. Then, ten structures each with the lowest electrostatic energies were selected for further relaxation using DFT with accuracy of 10−4 eV between two relaxation steps. In contrast, Yu et al.47 employed a primitive cell containing 44 Na on 52 sites reducing the number of possible distributions to 7.5 × 10⁸ (or 1.9 × 10⁶ considering only Na1 to Na5) and relied on the USPEX code59 to predict one trial configuration that was then optimised. Liu et al.48 used the conventional cell, but predetermined Na site occupancies (not considering the Na6 site) to generate 40![[thin space (1/6-em)]](https://www.rsc.org/images/entities/char_2009.gif) 000 trial structures that were ranked by electrostatic repulsion using the pymatgen code60 before conducting detailed refinements of 20 candidate structures proposed by the code.
000 trial structures that were ranked by electrostatic repulsion using the pymatgen code60 before conducting detailed refinements of 20 candidate structures proposed by the code.
Canonical (NVT) ab initio molecular dynamics (AIMD) calculations of Na11Sn2MS12 (M = P, Sb) were performed at 100, 300, 600, 800, 1000, 1200 and 1400 K with a time step of 2 fs (for 100, 300, 600 and 800 K) or 1 fs (at 1000, 1200 and 1400 K) and a total simulation time of 80 ps. Na+ migration pathways are also analysed by our bond valence site energy (BVSE) approach.61 Details of the approaches are given in the ESI.†
3. Results
3.1. Na distribution in Na11Sn2MS12 (M = P, Sb)
Despite the inevitably limited number of Na11Sn2PS12 trial configurations that can be examined at DFT level, we found a distribution of Na and Na vacancies that is significantly lower in energy than the previously suggested low-energy configuration by Yu et al.47 The newly identified lowest energy configuration contains 8 vacancies on the Na2 (32g) sites and 8 vacancies on the thus completely unoccupied Na6 (8b) site, while the configuration proposed by Yu et al. contains 4 vacancies on Na2 (32g) sites, 4 vacancies on Na3 (16d) sites and again 8 vacancies on Na6 (8b). The latter configuration ranked second lowest in energy in our optimizations irrespective of whether we used PBE62,63 or PBEsol64 functionals. These two low-energy configurations are sketched in Fig. 2. The energy barrier against decomposition into Na3PS4 and Na4SnS4 was −3.30 meV per atom for the lowest energy Na11Sn2PS12 configuration when using the PBE functional (relaxed volume 25.048 Å3 per atom), while the energy of the relaxed structure analogous to the results from Yu et al. was −2.92 meV per atom (whereas these authors reported −1.906 meV per atom from a coarser relaxation). In the conventional unit cell the structure proposed by Yu et al.47 assumes space group Cc, while our lowest energy configuration adopts space group P43, which explains why it cannot be observed in minimizations of the smaller primitive unit cell.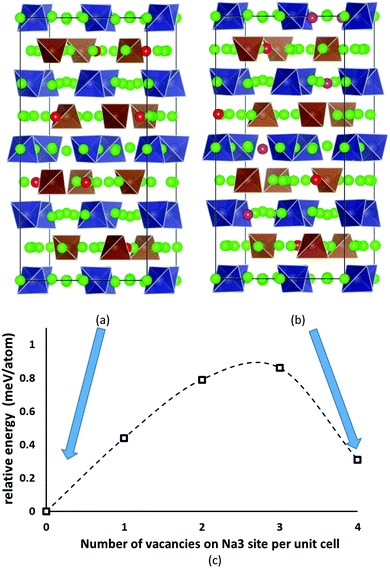 | ||
| Fig. 2 The two lowest energy configurations for Na11Sn2PS12: (a) the lowest energy configuration containing 8 vacancies on Na2 (32g) sites, (b) the second-lowest energy configuration with the Na/vacancy distribution previously reported by Yu et al.47 containing four vacancies on Na2 (32g) sites and four on Na3 (16d) sites. Grey (brown) tetrahedra represent SnS4 (PS4), green spheres occupied Na sites, while Na2 (Na3) vacancies are marked in red (magenta). (c) Energy profile for the lowest energy interconversion between these two configurations. | ||
The analysis of the Na site distributions led to a classification of the 6 site types into two groups. Sites Na2 and Na3 form octahedral (Na2)4(Na3)2Na6 clusters around the typically vacant Na6 site, while the remaining three Na site types Na1, Na4 and Na5 are referred to as the matrix sites (cf.Fig. 1). Most of the trial configurations containing in total 0–2 vacancies at the “matrix” sites Na1, Na4 and Na5 with all the remaining 6–8 vacancies located on “cluster” sites Na2 or Na3 (plus 8 vacant Na6 sites), are also stable against dissociation into the ternary phases as long as the vacant Na sites are separated by at least one occupied site along the path. The lowest energy configurations with seven Na2 vacancies plus one vacancy at a different Na equilibrium site were −2. 79 meV per atom for the additional vacancy at Na3, −2.66 meV per atom at Na5, −2.20 meV per atom at Na4, and −1.81 meV per atom for a vacancy at Na1. Converting the two low energy configurations of Fig. 2 into each other requires to overcome an energy barrier of 0.86 meV per atom (or 0.18 eV per unit cell) for the lowest energy configuration with five vacancies at Na2 and three 3 vacancies on Na3 (cf.Fig. 2c).
For the energy-minimization of Na11Sn2SbS12 we started from the same configurations as for Na11Sn2PS12 with substitution of Sb for P. The lowest energy configuration of vacancies was found by the same way as for Na11Sn2PS12.
Despite of the fact that the crystallographic XRD data for Na11.25Sn2.25Sb0.75S1241 find a lower occupancy of the Na4 (16c) site, our minimizations yielded as the lowest energy configuration of Na11Sn2SbS12 again the one analogous to the lowest energy configuration of Na11Sn2PS12 containing 8 vacancies on Na2 (32g) sites (cf.Fig. 2). In this case the energy of decomposition of the sample calculated with PBE potential was −3.23 meV per atom with a relaxed volume of 26.84 Å3 per atom. Note that for Na11Sn2SbS12 the PBEsol decomposition energy is still 3.80 meV per atom above the hull. Further details of the minimum energy configurations including corresponding cif files are available in the ESI.†
3.2. Na distribution in LGPS-like Na10SnM2S12
Initial configuration for Na10SnP2S12 were chosen to be analogous to the structure of LGPS (space group P42/nmc).5,6 The 9.650 × 9.650 × 13.660 Å3 simulation cell contained 50 atoms. Among the three distinct Sn/P distributions compatible with the experimentally observed Sn/P disorder, we maintained the arrangement found by Richards et al. to yield the lowest energy structures in their study.43 20 Na atoms were distributed on the 32 possible sites (16 Na1 (16h), 4 Na2 (4d), 8 Na3 (8f) and 4 Na4 (4c)). We examined about 50 configurations of Na vacancies. The sample that after optimization had the lowest energy contained 8 Na1, 4 Na2, 6 Na3 and 2 Na4 atoms. This Na10SnP2S12 structure was found to be metastable with a decomposition energy of 7.9 meV per atom above the hull. The optimized structure is shown in Fig. 3. A corresponding cif file is available from the ESI.† Again, the optimised configuration found in this work is considerably lower in energy than the ones reported previously.43,47 Likewise, the Na and Sn/Sb distributions in the lowest energy configuration of Na10SnSb2S12 are analogous to the one discussed above for Na10SnP2S12. The dissociation energy of the corresponding configuration of Na10SnSb2S12 (3.94 meV per atom) is, however, only about half that of the M = P case.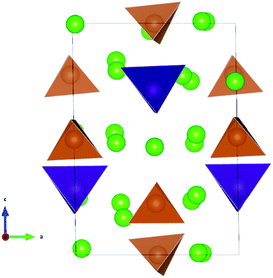 | ||
| Fig. 3 The lowest energy configuration of Na10SnP2S12. Purple (brown) tetrahedra represent SnS4 (PS4); green spheres indicate occupied Na sites. | ||
3.3. Effect of stoichiometry deviations on phase stability
For Na9+xSnxP3−xS12 stoichiometries from 1.80 ≤ x ≤ 2.11 were reported experimentally in the structure type of Na11Sn2PS12,46,47 but it remained unclear whether these refined compositions from XRD data represent an uncertainty in the experimental structure determination or a real homogeneity range. To clarify the energetic effects of stoichiometry deviations, we optimized structures for a wide range of compositions around the stable stoichiometric quaternary phases.To build the trial structures of Na9+xSnxP3−xS12 and Na9+xSnxSb3−xS12 at 1.75 ≤ x ≤ 2 we consecutively substituted Sn to P (Sb) atoms in our two lowest energy configurations of Na11Sn2PS12 and Na11Sn2SbS12: in order to generate Na10.875Sn1.875P1.125S12 (Na10.875Sn1.875Sb1.125S12) we start from choosing a random Sn atom, substitute it by P (Sb) and then we replace one random Na atom by a vacancy. We optimized the distinct configurations. In the process of this optimisation, the displacement of atoms was typically small and the replaced atoms essentially remained close to their initial sites. Once the lowest energy configuration for Na10.875Sn1.875P1.125S12 (Na10.875Sn1.875Sb1.125S12) was identified by the above procedure, it served as the starting point for generating Na10.75Sn1.75P1.25S12 (Na10.75Sn1.75Sb1.25S12), where again we replaced a further Sn by P (Sb) and another Na atoms by a vacancy. In the lowest energy configurations the new vacancies consistently appeared on Na2 or Na3 sites only. When starting from the lowest energy NSPS configuration with 8 Na2 vacancies, the lowest energy configurations for both Na10.875Sn1.875M1.125S12 and Na10.75Sn1.75M1.25S12 contain the additional vacancies consistently on Na3 sites; when starting from the configuration with 4 Na2 and 4 Na3 vacancies the lowest energy configurations for lower x values had the extra vacancy on Na2 sites.
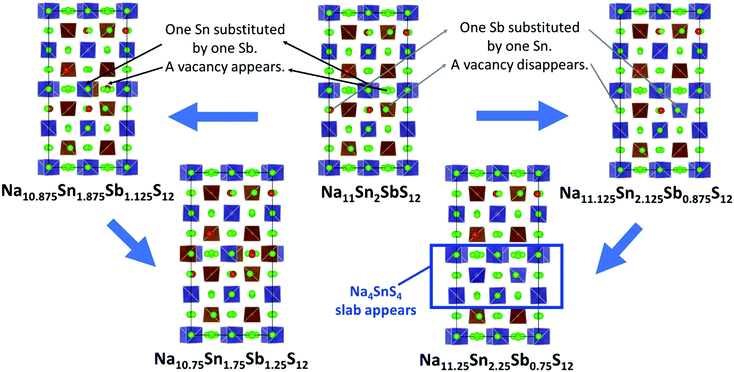
The structures of Na9+xSnxP3−xS12 and Na9+xSnxSb3−xS12 with 2 ≤ x ≤ 2.25 were constructed likewise progressively from the two lowest energy configurations of Na11Sn2MS12 (M = P, Sb) via replacing of P (Sb) atoms to Sn and adding Na atoms. In the first step we substitute a random P (Sb) by Sn and fill a random vacancy to identify the lowest energy configurations of the corresponding Na11.125Sn2.125M0.875S12. Note that the lowest energy configuration of Na11Sn2PS12 and Na11Sn2SbS12 contained vacancies in Na2 (32g) sites only, so the added Na for higher values of x were inevitably placed on Na2 sites as well. When starting from the second-lowest energy configuration containing 4 vacancies each on the Na2 and Na3 sites, therefore Na could be added to these two site types only.
The lowest energy configuration for Na11.125Sn2.125M0.875S12 contained vacancies on Na2 (32g) sites only (so Na can only be added to the Na2 site). When adding Na to the alternative NSPS configuration containing also Na3 vacancies, the lowest energy configuration kept the same number of Na2 vacancies filling up the Na3 site, but was more than 1 meV per atom higher in energy than Na11.125Sn2.125M0.875S12 containing vacancies on Na2 only. Then we tried substitutions of an additional P (Sb) atom by Sn followed by placing a Na atom on one of the vacant Na sites in order to create the Na11.25Sn2.25M0.75S12 configurations as visualized in Fig. 4. Each sample was geometry optimized.
It appears noteworthy that the lowest energy configuration of Na11.25Sn2.25Sb0.75S12 (0.43 meV per atom above the hull) was obtained when both substituted Sn atoms were close to each other and adjacent Na vacancies were filled by Na+ to maintain local electroneutrality. This effectively creates a small “epitaxial” slab of Na4SnS4 within Na11.25Sn2.25Sb0.75S12 (cf.Fig. 4). In contrast to the case of M = P (1.31 meV per atom above the hull), where the substituted Sn atoms in our lowest energy configuration appeared far from each other.
The convex hulls for Na9+xSnxP3−xS12 and Na9+xSnxSb3−xS12 based on our calculations using PBE potentials are shown in Fig. 5. These calculations clarify that both Na9+xSnxP3−xS12 and Na9+xSnxSb3−xS12 are stable against decomposition into the ternary phases throughout the tested composition ranges. For Na9+xSnxP3−xS12 the chosen composition range 1.75 ≤ x ≤ 2.25 indicates a continuous destabilisation of the phases with increasing deviation from the structurally stable composition Na9+xSnxP3−xS12. For Na9+xSnxSb3−xS12 this trend is not so obvious over the same composition range and especially the lowest energy configuration with x = 1.75 exhibited an energy of only 0.16 meV per atom above the hull (cf.Fig. 5(b)). Therefore, we extended the studied composition range for the Sb compounds to 1.625 ≤ x ≤ 2.375. Our results clarify that all nonstoichiometric compositions around the stoichiometric Na11Sn2MS12 phase are slightly metastable against the decomposition into the stoichiometric quaternary phase with x = 2 and Na3PS4 (Na3SbS4) for x < 2 or Na4SnS4 for x > 2. However, the LGPS-like phases Na10SnP2S12 and Na10SnSb2S12 (x = 1) are metastable with a significantly higher decomposition energy than the compositions closer to x = 2. When comparing the LGPS-like phases with M = P and M = Sb, the latter has a somewhat lower energy and might be easier to synthesize.
 | ||
| Fig. 5 The convex hulls for (a) Na9+xSnxP3−xS12 at x = 0, x = 1, 1.75 ≤ x ≤ 2.25 and x = 3 as well as (b) Na9+xSnxSb3−xS12 at x = 0, x = 1, 1.625 ≤ x ≤ 2.375 and x = 3. | ||
The moderate increase in energy with increasing x as well as the observed possibility for intergrowth of Na4SnS4-like layers or clusters within Na9+xSnxSb3−xS12 for x ≥ 2.25 (cf.Fig. 4) might explain the experimental observation by Heo et al. of apparently single phase products throughout the composition range 2 ≤ x ≤ 2.94.41 The fact that the highest conductivity in the Na9+xSnxSb3−xS12 system has so far been observed for x = 2.25 might indicate that the existence of slabs with different Na (and hence vacancy) concentrations within the phase is slightly favourable for the overall ionic conductivity. The fact that such an intergrowth of Na9+xSnxP3−xS12 with Na3PS4-like slabs is not observed in our simulations conversely explains why the experimentally noted homogeneity range for Na9+xSnxP3−xS12 is narrower and more symmetrical around x = 2. On the other hand, our results suggest that it should also be possible to extend the homogeneity range further to values of x slightly below 2 for both compounds, which has not yet been confirmed experimentally for M = Sb.
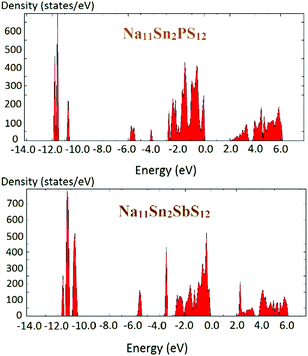
The density of states of the samples Na11Sn2PS12 and Na11Sn2SbS12 is shown in Fig. 6 based (like the preceding literature data) on DFT data using the PBE functional. It should be noted that these are known to underestimate the real bandgap and should thus be only taken as a rough orientation point and for comparison among chemically similar structures studied with the same functional. The band gap found for Na11Sn2PS12 is 1.95 eV, which is large enough to provide a satisfactory dominance of ionic conductivity over electronic conductivity in order to use the compounds as solid electrolytes. The band gap is slightly larger than the 1.80 eV reported previously by Liu et al. for their rather unstable configuration,48 which may be attributed to the difference in the Na ion distributions of the two structures. For Na11Sn2SbS12 the band gap is 2.0 eV.
3.4. Effect of stoichiometry deviations on phase stability
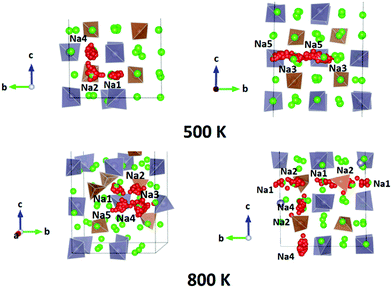
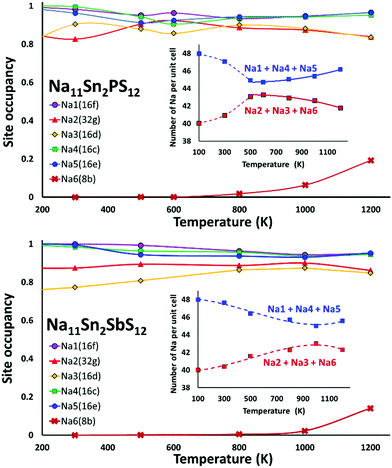
We performed AIMD simulations of Na11Sn2PS12 and Na11Sn2SbS12 with canonical ensembles at 100, 300, 500, 600, 800, 1000, 1200 and 1400 K over 80 ps. Details of the AIMD method can be found in the ESI.† Typical trajectories of Na+ ion diffusion in NSPS are sketched in Fig. 7. In most cases they involve jumps between the (Na2)4(Na3)2Na6 clusters of vacancy-rich sites and the interconnecting matrix sites (Na1, Na4, Na5) with lower vacancy concentration.Fig. 8 shows the temperature dependence of the average occupancy of the different Na sites during the simulation over the temperature range 300 K to 1200 K. At 1400 K the automatic assignment of Na atoms to their sites became less reliable, while at 100 K the number of observed hops was small; so these data are not included. The occupancies of Na2 and Na3 sites remain in the range 0.8–0.9 with a more significant decrease only above 800 K, while the occupancies of Na1, Na4 and Na5 sites are in the range 0.93–0.98. Na6 site is very rarely occupied. More details of the Na rearrangement become obvious when we investigate the distribution of Na between isolated vacancy-rich (Na2)4(Na3)2Na6 clusters and the interconnecting vacancy-poor matrix sites Na1, Na4 and Na5. As seen from the insets in Fig. 8 there seems to be a phase transition at T ≈ 500–600 K. The occupancies of both site types for lower temperatures approach each other, which may be interpreted as an entropic effect. For temperatures ≥600 K, the already lower occupancy of the (Na2)4(Na3)2Na6 cluster sites slightly decreases further with increasing temperature, while the occupancy of the already highly occupied matrix sites Na1, Na4, and Na5 increases further with rising temperature. This must be due to a change in the relative site enthalpies as also seen from the onset of Na6 occupancy. In contrast, for M = Sb the equilibration of site occupancies with increasing temperature continues up to about 1000 K and the Na6 occupancy remains somewhat lower.
In line with the previous DFT studies, but differing from the experimental diffraction data, we find that the Na6 site remains unoccupied in the stable state near room temperature. We note that a significant occupancy sets in with the apparent phase transition in the overall Na site distribution revealed in Fig. 8. Up to 1200 K the occupancy then gradually rises to 0.196 for M = P (and further to ca. 0.33 for T = 1400 K), while for M = Sb a significant Na6 occupancy sets in only at T > 800 K and reaches only 0.14 at 1200 K.
When comparing the characteristics of the Na sites, it should be noted that all the equilibrium sites Na1 to Na5 have a 6-fold coordination, while the “interstitial” Na6 site corresponds to a less favourable 8-fold coordination. Bond valence site energy calculations suggest that Na6 corresponds to a shallow cluster of local site energy minima depending on the occupancy of the surrounding Na2 and Na3 sites so that the Na configuration should rather be described as 6 + 2. The “cluster” sites Na2 and Na3 with the lower occupancy near room temperature are those sites where the nearest high-valent cation is P5+ while the matrix sites Na1, Na4 and Na5 have Sn4+ as their nearest high-valent cation neighbour. Hence, it may be assumed that local electroneutrality is the main driving force for the observed differences in occupancy between the two groups of equilibrium sites at low temperatures.
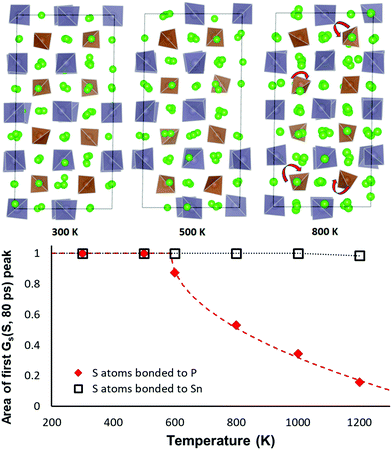
As sketched in Fig. 9 the orientation of the PS4 and SnS4 tetrahedra in NSPS remains essentially unchanged up to 500 K. Above 500 K the PS4 tetrahedra become rotationally disordered, while the SnS4 tetrahedra remain orientationally ordered up to 1000 K. Hence, it may be concluded that the phase transition visible in the Na site occupancy trends in Fig. 8 is correlated to the rotational disorder of the PS4 groups: the rotations tend to favour a higher occupancy of the Na2–Na3–Na6 site clusters. In our simulations of Na11Sn2SbS12 a reorientation of the larger SbS4 sets in only around 1000 K.
The same transition is seen from an analysis of the van Hove correlation functions in the AIMD trajectories for Na11Sn2PS12. An overview of the time- and temperature dependent correlation function curves is shown in the ESI,† Fig. S1 and S2. Fig. 9 reveals that the temperature-dependence of the first peak in the self-part of the van Hove correlation function GS over a fixed period (here 80 ps) may be taken as the order parameter for the orientational order-transition. The of the self-part of the van Hove correlation function represents the probability density function for an atom that is at the origin at the zero point of the time scale to be at a certain distance r a time interval t later. Hence the area Arel under the first peak near r = 0 refers to the fraction atoms that continue to vibrate around an unchanged equilibrium position and the decrease of the peak intensity represents the fraction of atoms that leave their site (here by the tetrahedral rotations seen in Fig. 9). For the S atoms of SnS4 groups we therefrom find that the orientation of the SnS4 remains unchanged up to at least 1000 K, while the fraction of PS4 groups in unchanged orientation rapidly drops at elevated temperatures. The data can be least-squares fitted according to the function
| Arel(T > T0) = 1 − const. × (T − T0)0.5 | (1) |
We also analysed the number of effective jumps leading to diffusion differentiating hops that persist over more than one time step from the otherwise dominating local forward–backward jumps. (i.e. jumps where Na ion hops to another site and in the next hop returns to its initial site). If we eliminate these forward–backward hops that do not contribute to long-range diffusion, the simulation showed that diffusion occurs with almost equal rate in all three dimensions at all studied temperatures, involving all the occupied sites (see Table 2 and Fig. S3 in the ESI†).
| 100 K | 300 K | 500 K | 600 K | 800 K | 1000 K | 1200 K | |
|---|---|---|---|---|---|---|---|
| Na1–Na2 | 0 | 3 | 26 | 29 | 103 | 177 | 376 |
| 0 | 7 | 66 | 83 | 232 | 406 | 885 | |
| Na2–Na1 | 0 | 3 | 30 | 32 | 101 | 178 | 374 |
| 0 | 7 | 71 | 86 | 231 | 408 | 883 | |
| Na2–Na4 | 0 | 0 | 12 | 18 | 52 | 100 | 182 |
| 0 | 2 | 27 | 34 | 112 | 235 | 446 | |
| Na4–Na2 | 0 | 0 | 13 | 18 | 54 | 104 | 175 |
| 0 | 2 | 28 | 34 | 115 | 239 | 440 | |
| Na2–Na5 | 0 | 2 | 19 | 22 | 50 | 82 | 170 |
| 0 | 6 | 45 | 53 | 117 | 184 | 389 | |
| Na5–Na2 | 0 | 1 | 19 | 22 | 50 | 78 | 177 |
| 0 | 5 | 45 | 53 | 117 | 179 | 396 | |
| Na3–Na4 | 0 | 2 | 12 | 38 | 50 | 97 | 191 |
| 2 | 4 | 38 | 100 | 115 | 222 | 445 | |
| Na4–Na3 | 0 | 2 | 15 | 38 | 49 | 90 | 199 |
| 2 | 4 | 41 | 100 | 114 | 215 | 452 | |
| Na3–Na5 | 0 | 4 | 30 | 44 | 52 | 100 | 194 |
| 2 | 13 | 82 | 113 | 126 | 245 | 417 | |
| Na5–Na3 | 0 | 6 | 34 | 44 | 53 | 106 | 190 |
| 2 | 15 | 86 | 113 | 127 | 252 | 413 | |
| Na2–Na6 | 0 | 0 | 0 | 0 | 15 | 66 | 169 |
| 0 | 0 | 2 | 2 | 45 | 158 | 384 | |
| Na6–Na2 | — | — | 0 | 0 | 12 | 66 | 172 |
| 2 | 2 | 42 | 158 | 387 | |||
| Na3–Na6 | 0 | 0 | 0 | 0 | 4 | 25 | 84 |
| 0 | 0 | 0 | 3 | 12 | 56 | 197 | |
| Na6–Na3 | — | — | 0 | 0 | 7 | 25 | 79 |
| 0 | 3 | 15 | 56 | 192 |
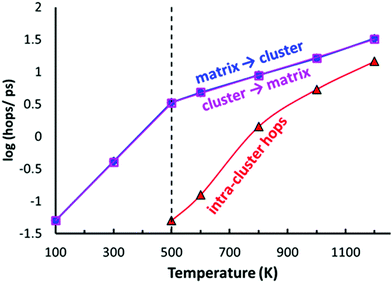
As shown in Fig. 10, the typical hops at low temperatures, where the PS4 tetrahedra remain orientationally ordered, involve exchanges between the vacancy-rich cluster sites Na2 or Na3, and the nearly fully occupied interconnecting matrix sites Na1, Na4 or Na5. The number of these hops grows at a slower rate above 500 K, while at the same temperature the number of rearrangements via Na6 within the vacancy-rich site cluster (Na2)4(Na3)2Na6 quickly catches up.
While at temperatures far above 500 K the PS4 reorientation should be dynamic allowing for the paddle-wheel mechanism,53 where as proposed by Zhang et al.52 it is assumed that the Na+ are propelled by the rotating PS4, our new finding of the intermediate temperature phase transition means that we have to expect the actual orientational distribution to be locked in at room temperature and thus to depend on the thermal history of the sample. Different states of frozen-in disorder as a consequence of different thermal histories of the samples might (along with undetected stoichiometry variations) thus be the main reason for the significant differences in the reported migration barriers and conductivities for NSPS from different laboratories. This also entails that at any remaining rotational disorder at room temperature can enhance the Na+ ionic motion only according to the percolation model, by opening up lower migration barrier pathways without a dynamic coupling between Na+ ion and PS4 group motion.
In terms of local mobility, Na on Na6 are clearly the most mobile ions at all temperatures. Na6 can hardly be considered a site at low temperatures (at 500–600 K the average residence time of a Na6 is only about 80 fs), while at higher temperatures the mobility of Na ions on the Na6 site decreases to about 5 times the one of Na3 at 1200 K (emphasizing again that the changes in occupancy correspond to an enthalpic effect). While the Na6 ions become less mobile with increasing temperature, the Na ions on all the other sites show a normal thermally activated behaviour rendering the ions more mobile with increasing temperature. The activation energy for the mobility increase is 0.30–0.31 eV for the “cluster sites” Na2 and Na3, while the corresponding values for the interconnecting “matrix sites” Na1, Na4 and Na5 range from 0.24 eV to 0.27 eV. These minor differences in local mobility lead to a transition from ions on the matrix site Na5 to ions on the cluster site Na3 being the most mobile ion with increasing temperature (when excluding Na6).
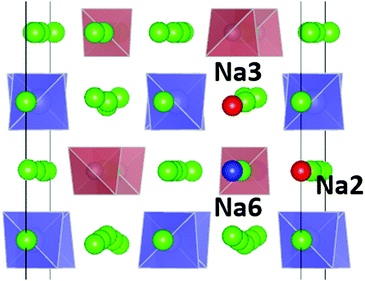
For the PS4-ordered low-temperature phase the minute number of occupied Na6 sites means that there will be no significant influence of Na6 on the long-range diffusion process. We see no signs that, as speculated by Ramos et al.50 act as a “parking” spot for Na to increase the vacancy population along the major diffusion channels. Once the PS4 groups are orientationally disordered (in a static or dynamic way), this leads as mentioned above to a decrease in the occupancy of the cluster sites Na2 and Na3. As the Na6 site can only be occupied if out of the neighbouring 4 Na2 and 2 Na3 sites two are vacant, the Na6 occupancy is for T ≥ 500 K linearly related to the average number of vacancies per (Na2)4(Na3)2 environment (cf. Fig. S4 in the ESI†). A snapshot of a configuration where the Na6 site is occupied at 800 K is presented in Fig. 11. In this case, the Na6 site does participate in ionic diffusion via connecting neighbouring Na2 and Na3 sites.
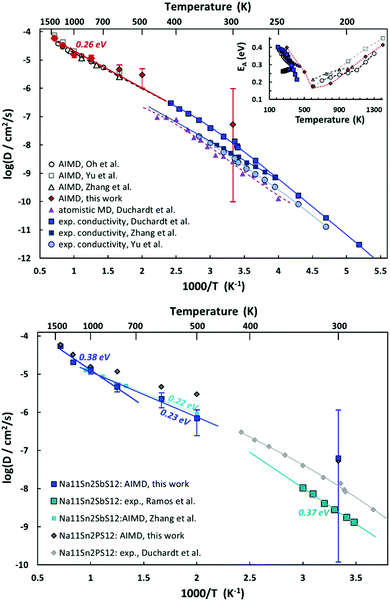
AIMD simulations allow us to estimate activation energy EA as well as absolute values of the Na+ diffusion coefficient or ionic conductivity σ in Na11Sn2PS12 and Na11Sn2SbS12. Fig. 10 combines the Arrhenius plots derived from our AIMD simulations and compares them to other AIMD and empirical MD simulations in literature as well as the available experimental conductivity data. Despite the wide variety of reported activation energies, it can be seen from the top graph of Fig. 12 that the extrapolation from our high temperature AIMD simulations nearly perfectly matches the experimental data from our previous work46 and the inset suggests that activation energies EA (from polynomial fits to the available experimental and AIMD data) exhibit a notable temperature dependence with a minimum close to the supposed phase transition temperature. Experimental data for the temperature range around room temperature suggest that the activation energy tends to decrease with increasing temperature, while high temperature AIMD data suggest that in the orientationally disordered high temperature phase the activation energy increases again with increasing temperature. While the uncertainty of the underlying polynomial fits is inevitably high, the consistent trend from nearly all the available studies sheds new light on the nature of ion transport in these phases. The unusually low activation energy found in ref. 45 might thus point to a quenched sample that retains the characteristics of the disordered high temperature phase down to room temperature (see also next section).
As seen from the bottom graph of Fig. 12 we find, in accordance with experimental findings,50 that the conductivity of Na11Sn2SbS12 is slightly lower than that of Na11Sn2PS12 at all elevated temperatures and statistically undistinguishable from the rather imprecise room temperature results. Again, the AIMD simulations closely match the earlier study by Zhang et al.52 for their narrower temperature range. Our results suggest that the change in activation energy for ion transport in Na11Sn2SbS12 occurs only around 1000 K, making less likely that frozen-in SbS4 disorder would be relevant for the transport around room temperature.
3.5. Migration paths in PS4-disordered NSPS
Our bond valence site energy (BVSE) approach61 is a simple empirical way to estimate Na+ migration pathways in solid electrolytes. Here we employ the approach to analyse the migration pathways in local structure models from DFT-generated relaxed local structure models with different Na vacancy distributions as well as PS4 tetrahedral reorientations that have been generated by “quenching”, i.e. geometry-optimization from the results of the AIMD simulations at different temperatures. Examples of structure models and resulting energy landscape for the mobile Na+ are given in the ESI.†Fig. 13 shows the effect of the PS4 orientational disorder on the migration barriers in Na11Sn2PS12 as estimated using the empirical BVSE pathway approach applied to the relaxed DFT local structure models. In semi-quantitative agreement with the data derived from experimental conductivity and AIMD simulations (cf. inset in Fig. 12), the migration barriers show a marked decrease with the onset of PS4 disorder. The structure models quenched from the high temperature AIMD simulations also retain a slightly larger unit cell volume (by 0.8–2.6%), but we found only a weak correlation between the added free volume and the lowered migration barrier. Applying the same BVSE approach to the average crystal structures (available from temperature range 100–373 K only) supports the hypothesis that most experimental crystal structures retain not only the more disordered Na distribution but also the lower migration barriers of the high temperature PS4-disordered phase also around room temperature. Examples of the quenched configurations and the corresponding energy landscapes for the Na ions are shown in the ESI,† Fig. S5–S8. As there is no sign of dynamic PS4 reorientations at room temperature, it has to be expected that in this case the lower experimental activation energies are due to a “frozen-in” static orientational disorder.
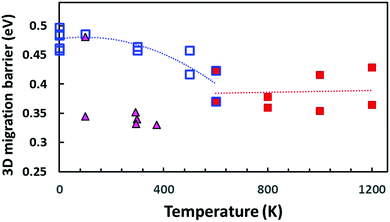 | ||
| Fig. 13 Comparison of BVSE-predicted migration barriers for three-dimensionally percolating Na+ ion migration pathways in NSPS. Squares indicate DFT structure models generated from the AIMD simulation trajectories at different temperatures (open blue squares refer to models from AIMD runs at T ≤ 600 K or static energy minimizations; filled red squares to structure models derived from the outcome of high temperature AIMD simulations at T ≥ 600 K, where the literature for the PS4 orientational disorder sets in). Filled triangles indicate migration barriers derived by the same approach from the spatially averaged crystal structure models available in the literature.45,46 | ||
4. Conclusions
In summary, our computer simulations show that anion-ordered Na11Sn2PS12 and Na11Sn2SbS12 are stable against decomposition into the ternary sulphides. While we found a previously unreported lowest energy configuration, numerous distinct local structures for a given Na content have similar energies. It means that experimentally observed structures consist of a mixture of Na distributions. Likewise, the lowest energy configurations of Na9+xSnxM3−xS12 covering the composition range 1.75 ≤ x ≤ 2.25 for M = P and the range 1.625 ≤ x ≤ 2.375 for M = Sb remain close to the convex hull, i.e. a certain homogeneity range should be experimentally accessible. The extremely wide apparent homogeneity range reported for Sn-rich Na9+xSnxSb3−xS12 may, however, rather be due to an undetected epitaxial intergrowth of Na9+xSnxSb3−xS12 with a closely related phase of Na4SnS4. LGPS-like hypothetical Na10SnP2S12 is rather unstable and probably inaccessible, while the also metastable LGPS-like Na10SnSb2S12 with a considerably lower dissociation energy might be accessible.Both Na11Sn2PS12 and Na11Sn2SbS12 have DFT band gaps of 1.95–2 eV suitable for use as electrolyte. Our AIMD simulations confirm that the sodium diffusion in both Na11Sn2MS12 phases is nearly isotropic, with a room temperature ionic conductivity of ca. 3.7 mS cm−1 for the case of M = P. Details of the Na distribution and ion transport properties will be strongly affected by an order–disorder phase transition. At temperatures exceeding ca. 580 K the PS4 tetrahedra in the stoichiometric phases (but not the SnS4 or the SbS4 tetrahedra) become orientationally disordered. This will particularly affect the site energies and occupancies of the Na site cluster (Na2)4(Na3)2Na6 surrounded by the reorienting PS4 groups. This onset of orientational disorder is clearly seen form the van Hove correlation functions for both Na and S atoms (cf.Fig. 9, Fig. S1 and S2, ESI†), as well as from the reversal of trends in the temperature dependence of the Na site distribution (Fig. 8): while in the orientationally ordered low temperature phase the Na6 site occupancy is negligible, and the five equilibrium sites are responsible for the isotropic ionic conductivity, orientational disorder increases the Na6 occupancy. As the Na2 and Na3 site occupancies decrease with increasing temperature, the central Na6 site of the cluster becomes more accessible. Once the Na6 becomes accessible, we find that it also actively participates in the ion transport, ruling out the proposal by Ramos et al.50 that Na6 should just act as a “parking spot” for Na. In the contrary, the local mobility is highest for Na on Na6.
In consequence, the activation energy of for Na-ion conduction also shows a clear temperature dependence. The activation energy goes through a minimum just above the transition temperature (cf. inset in Fig. 12). Dynamic disorder in the sense of the paddle-wheel effect52,53 should exist only above the transition temperature and might be most effective in lowering the activation energy for ion migration just above the transition temperature. For the experimentally more relevant temperature range around room temperature, it has to be expected that, depending on the cooling rate (and a likely dependence of the transition temperature on stoichiometry deviations), different degrees of orientational disorder of the PS4 groups will be retained in metastable form at room temperature and will alter the energy landscape for Na ions. This explains not only the experimentally observed varying Na6 site occupancy but also the significant spread in reported activation energies in the low temperature range.
Conflicts of interest
There are no conflicts to declare.Acknowledgements
Financial support to S. A. in the frame of the NUS “Centre for Energy Research”, the MoE Tier 1 grant R284000173114 and the RSB fellowship for A. S. are gratefully acknowledged. The computational work for this article was partially performed on resources of the National Supercomputing Centre, Singapore (https://www.nscc.sg).Notes and references
- R. Kanno and M. Murayama, J. Electrochem. Soc., 2001, 148, A742–A746 CrossRef CAS
.
- H. Yamane, M. Shibata, Y. Shimane, T. Junke, Y. Seino, S. Adams, K. Minami, A. Hayashi and M. Tatsumisago, Solid State Ionics, 2007, 178, 1163–1167 CrossRef CAS
.
- N. Kamaya, K. Homma, Y. Yamakawa, M. Hirayama, R. Kanno, M. Yonemura, T. Kamiyama, Y. Kato, S. Hama, K. Kawamoto and A. Mitsui, Nat. Mater., 2011, 10, 682–686 CrossRef CAS PubMed
.
- Y. Mo, S. P. Ong and G. Ceder, Chem. Mater., 2011, 24, 15–17 CrossRef
.
- S. Adams and R. P. Rao, J. Mater. Chem., 2012, 22, 7687–7691 RSC
.
- A. Kuhn, J. Köhler and B. V. Lotsch, Phys. Chem. Chem. Phys., 2013, 15, 11620–11622 RSC
.
- P. Bron, S. Johansson, K. Zick, J. Schmedt auf der Günne, S. Dehnen and B. Roling, J. Am. Chem. Soc., 2013, 135, 15694–15697 CrossRef CAS PubMed
.
- A. Kuhn, O. Gerbig, C. Zhu, F. Falkenberg, J. Maier and B. V. Lotsch, Phys. Chem. Chem. Phys., 2014, 16, 14669–14674 RSC
.
- Y. Wang, W. D. Richards, S. P. Ong, L. J. Miara, J. C. Kim, Y. Mo and G. Ceder, Nat. Mater., 2015, 14, 1026–1032 CrossRef CAS PubMed
.
- K. Takada, Acta Mater., 2013, 61, 759–770 CrossRef CAS
.
- Y. Kato, S. Hori, T. Saito, K. Suzuki, M. Hirayama, A. Mitsui, M. Yonemura, H. Iba and R. Kanno, Nat. Energy, 2016, 1, 16030 CrossRef CAS
.
- C. Dietrich, M. Sadowski, S. Sicolo, D. A. Weber, S. J. Sedlmaier, K. S. Weldert, S. Indris, K. Able, J. Janek and W. G. Zeier, Chem. Mater., 2016, 28, 8764–8773 CrossRef CAS
.
- A. Manthiram, X. Yu and S. Wang, Nat. Rev. Mater., 2017, 2, 16103 CrossRef CAS
.
- B. L. Ellis and L. F. Nazar, Curr. Opin. Solid State Mater. Sci., 2012, 16, 168–177 CrossRef CAS
.
- V. Palomares, P. Serras, I. Villaluenga, K. B. Hueso, J. Carretero-González and T. Rojo, Energy Environ. Sci., 2012, 5, 5884–5901 RSC
.
- A. Hayashi, K. Noi, A. Sakuda and M. Tatsumisago, Nat. Commun., 2012, 3, 856 CrossRef PubMed
.
- M. Tatsumisago and A. Hayashi, Int. J. Appl. Glass Sci., 2014, 5, 226–235 CrossRef CAS
.
- H. Pan, Y.-S. Hu and L. Chen, Energy Environ. Sci., 2013, 6, 2338–2360 RSC
.
- M. D. Slater, D. Kim, E. Lee and C. S. Johnson, Adv. Funct. Mater., 2013, 23, 947–958 CrossRef CAS
.
- N. Yabuuchi, K. Kubota, M. Dahbi and S. Komaba, Chem. Rev., 2014, 114, 11636–11682 CrossRef CAS PubMed
.
- A. Ponrouch, D. Monti, A. Boschin, B. Steen, P. Johansson and M. R. Palacin, J. Mater. Chem. A, 2015, 3, 22–42 RSC
.
- D. Kundu, E. Talaie, V. Duffort and L. F. Nazar, Angew. Chem., Int. Ed., 2015, 54, 3431–3448 CrossRef CAS PubMed
.
- L. Zhang, K. Yang, J. Mi, L. Lu, L. Zhao, L. Wang, Y. Li and H. Zeng, Adv. Energy Mater., 2015, 5, 1501294 CrossRef
.
- J. R. Kummer, Prog. Solid State Chem., 1972, 7, 141–175 CrossRef CAS
.
- J. B. Goodenough, H. Y.-P. Hong and J. A. Kafalas, Mater. Res. Bull., 1976, 11, 203–220 CrossRef CAS
.
- Y. Deng, C. Eames, L. H. Nguyen, O. Pecher, K. J. Griffith, M. Courty, B. Fleutot, J. N. Chotard, C. P. Grey, M. S. Islam and C. Masquelier, Chem. Mater., 2018, 30, 2618–2630 CrossRef CAS
.
- N. Tanibata, K. Noi, A. Hayashi and M. Tatsumisago, RSC Adv., 2014, 4, 17120–17123 RSC
.
- M. Jansen and U. Henseler, J. Solid State Chem., 1992, 99, 110–119 CrossRef CAS
.
- T. Krauskopf, S. P. Culver and W. G. Zeier, Inorg. Chem., 2018, 57, 4739–4744 CrossRef CAS PubMed
.
- R. Prasada Rao, H. Chen, L. L. Wong and S. Adams, J. Mater. Chem. A, 2017, 5, 3377–3388 RSC
.
- I.-H. Chu, C. S. Kompella, H. Nguyen, Z. Zhu, S. Hy, Z. Deng, Y. S. Meng and S. P. Ong, Sci. Rep., 2016, 6, 33733 CrossRef CAS PubMed
.
- N. J. J. de Klerk and M. Wagemaker, Chem. Mater., 2016, 28, 3122–3130 CrossRef CAS
.
- S. Takeuchi, K. Suzuki, M. Hirayama and R. Kanno, J. Solid State Chem., 2018, 265, 353–358 CrossRef CAS
.
- Z. Yu, S.-L. Shang, J.-H. Seo, D. Wang, X. Luo, Q. Huang, S. Chen, J. Lu, X. Li, Z. K. Liu and D. Wang, Adv. Mater., 2017, 29, 1605561 CrossRef PubMed
.
- S.-H. Bo, Y. Wang and G. Ceder, J. Mater. Chem. A, 2016, 4, 9044–9053 RSC
.
- A. Banerjee, K. H. Park, J. W. Heo, Y. J. Nam, C. K. Moon, S. M. Oh, S.-T. Hong and Y. S. Jung, Angew. Chem., Int. Ed., 2016, 55, 9634–9638 CrossRef CAS PubMed
.
- H. Wang, Y. Chen, Z. D. Hood, G. Sahu, A. S. Pandian, J. K. Keum, K. An and C. Liang, Angew. Chem., Int. Ed., 2016, 55, 8551–8555 CrossRef CAS PubMed
.
- L. Zhang, D. Zhang, K. Yang, X. Yan, L. Wang, J. Mi, B. Xu and Y. Li, Adv. Sci., 2016, 3, 1600089 CrossRef PubMed
.
- A. Hayashi, N. Masuzawa, S. Yubuchi, F. Tsuji, C. Hotehama, A. Sakuda and M. Tatsumisago, Nat. Commun., 2019, 10, 5266 CrossRef CAS PubMed
.
- S. Yubuchi, A. Ito, N. Masuzawa, A. Sakuda, A. Hayashi and M. Tatsumisago, J. Mater. Chem. A, 2020, 8, 1947–1954, 10.1039/C9TA02246E
.
- J. W. Heo, A. Banerjee, K. H. Park, Y. S. Jung and S.-T. Hong, Adv. Energy Mater., 2018, 1, 1702716 CrossRef
.
- V. S. Kandagal, M. D. Bharadwaj and U. W. Waghmare, J. Mater. Chem., 2015, 3, 12992–12999 RSC
.
- W. D. Richards, T. Tsujimura, L. J. Miara, Y. Wang, J. C. Kim, S. P. Ong, I. Uechi, N. Suzuki and G. Ceder, Nat. Commun., 2016, 7, 11009 CrossRef CAS PubMed
.
- F. Tsuji, N. Tanibata, A. Sakuda, A. Hayashi and M. Tatsumisago, Chem. Lett., 2017, 47, 13–15 CrossRef
.
- Z. Zhang, E. Ramos, F. Lalère, A. Assoud, K. Kaup, P. Hartman and L. F. Nazar, Energy Environ. Sci., 2018, 11, 87–93 RSC
.
- M. Duchardt, U. Ruschewitz, S. Adams, S. Dehnen and B. Roling, Angew. Chem., Int. Ed., 2018, 57, 1351–1355 CrossRef CAS PubMed
.
- Z. Yu, S.-L. Shang, Y. Gao, D. Wang, X. Li, Z.-K. Liu and D. Wang, Nano Energy, 2018, 47, 325–330 CrossRef CAS
.
- J. Liu, Z. Lu, M. B. Effata and F. Ciuccia, J. Power Sources, 2019, 409, 94–101 CrossRef CAS
.
- K. Oh, D. Chang, I. Park, K. Yoon and K. Kang, Chem. Mater., 2018, 31, 6066–6075 CrossRef
.
- E. P. Ramos, Z. Zhang, A. Assoud, K. Kaup, F. Lalère and L. F. Nazar, Chem. Mater., 2018, 30, 7413–7417 CrossRef CAS
.
- M. Duchardt, S. Neuberger, U. Ruschewitz, T. Krauskopf, W. G. Zeier, J. Schmedt auf der Günne, S. Adams, B. Roling and S. Dehnen, Chem. Mater., 2018, 30, 4134–4139 CrossRef CAS
.
- Z. Zhang, P.-N. Roy, H. Li, M. Avdeev and L. F. Nazar, J. Am. Chem. Soc., 2019, 141, 19360–19372 CrossRef CAS PubMed
.
- A. Lundén, Solid State Commun., 1988, 65, 1237–1240 CrossRef
.
- Z. Yu, S.-L. Shang, D. Wang, Y. C. Li, H. P. Yennawar, G. Li, H. T. Huang, Y. Gao, T. E. Mallouk, Z.-K. Liu and D. Wang, Energy Storage Mater., 2019, 17, 70–77 CrossRef
.
- R. Prasada Rao, X. Zhang, K. C. Phuah and S. Adams, J. Mater. Chem. A, 2019, 7, 20790–20798 RSC
.
- H. Jia, Y. Sun, Z. Zhang, L. Peng, T. An and J. Xie, Energy Storage Mater., 2019, 23, 508–513 CrossRef
.
- G. Kresse and J. Furthmüller, Phys. Rev. B: Condens. Matter Mater. Phys., 1996, 54, 11169 CrossRef CAS PubMed
.
- G. Kresse and J. Furthmüller, Comput. Mater. Sci., 1996, 6, 15–50 CrossRef CAS
.
- C. W. Glass, A. R. Oganov and N. Hansen, Comput. Phys. Commun., 2006, 175, 713–720 CrossRef CAS
.
- S. P. Ong, W. D. Richards, A. Jain, G. Hautier, M. Kocher, S. Cholia, D. Gunter, V. L. Chevrier, K. A. Persson and G. Ceder, Comput. Mater. Sci., 2016, 68, 314–319 CrossRef
.
- H. Chen, L. L. Wong and S. Adams, Acta Crystallogr., Sect. B: Struct. Sci., Cryst. Eng. Mater., 2019, 75, 18–33 CrossRef CAS
.
- P. E. Blöchl, Phys. Rev. B: Condens. Matter Mater. Phys., 1994, 50, 17953 CrossRef PubMed
.
- J. P. Perdew, K. Burke and M. Ernzerhof, Phys. Rev. Lett., 1996, 77, 3865–3868 CrossRef CAS PubMed
.
- J. P. Perdew, A. Ruzsinszky, G. I. Csonka, O. A. Vydrov, G. A. Scuseria, L. A. Constantin, X. Zhou and K. Burke, Phys. Rev. Lett., 2008, 100, 136406 CrossRef PubMed
.
Footnote |
| † Electronic supplementary information (ESI) available: Details of computational methods, details of initial atomic configuration derived from XRD data, volumes per atom and decomposition energies from this work compared to results from previous simulations and experimental studies, data on the effects of the phase transition in the PS4 tetrahedral orientation on structure and migration energy barriers, cif files containing final coordinates of (i) the lowest energy samples of Na10SnM2S12 and Na11Sn2SbS12 (M = P, Sb) as well as several off-stoichiometric Na9+xSnxM3−xS12 compositions and AIMD snapshots. See DOI: 10.1039/d0ma00177e |
| This journal is © The Royal Society of Chemistry 2020 |

