 Open Access Article
Impurity removal with highly selective and efficient methods and the recycling of transition metals from spent lithium-ion batteries†
Fangwei Peng‡
ac,
Deying Mu‡ad,
Ruhong Lia,
Yuanlong Liua,
Yuanpeng Jia,
Changsong Dai *a and
Fei Ding*b
aMIIT Key Laboratory of Critical Materials Technology for New Energy Conversion and Storage, School of Chemistry and Chemical Engineering, Harbin Institute of Technology, Harbin 150001, P. R. China. E-mail: changsd@hit.edu.cn
bScience and Technology on Power Sources Laboratory, Tianjin Institute of Power Sources, Tianjin 300384, P. R. China
cShanghai Electrochemical Energy Devices Research Center, Department of Chemical Engineering, Shanghai Jiao Tong University, Shanghai 200240, P. R. China
dDepartment of Environmental Engineering, Harbin Institute of Commerce, Harbin 150076, P. R. China
First published on 16th July 2019
Abstract
The use of lithium-ion batteries (LIBs) is skyrocketing since they are widely applied in portable consumer devices and electric vehicles. However, at the end of their lifetime, large amount of spent LIBs will result in a negative environmental impact and aggravate the problem of resource shortage without proper disposal. Therefore, recycling is an effective solution, which will be enforced in the near future. Herein, the purification, recovery and reuse of transition metals from spent LIBs were thoroughly studied. First, the target impurities in a solution were effectively removed individually. Iron(III) and aluminum(III) impurities were removed by adjusting the pH value, whereas copper(II) was purified using highly selective electrodeposition technology and solvent extraction. Second, Ni0.41Co0.21Mn0.38(OH)2 was co-precipitated by adjusting the pH value of the purified metal solution, containing nickel(II), cobalt(II) and manganese(II) ions to 11 with NaOH and a proper amount of NH3·H2O. The comprehensive loss in nickel(II), cobalt(II) and manganese(II) was only 0.37% in the purification and co-precipitation procedures. Finally, LiNi0.41Co0.21Mn0.38O2 (marked as LNCM-R) synthesized with the recycled materials was tested and compared with LiNi0.41Co0.21Mn0.38O2 (marked as LNCM-N) synthesized with new materials as the control group. The XRD, SEM and TEM results indicate that both samples have the same structure and morphology. Furthermore, the charge–discharge tests, initial dQ/dV curves, EIS and GITT results indicate a similar electrochemical performance of the LNCM-R and LNCM-N samples. The purification and recycling strategies in our research have high efficiency and comparatively low cost, which provide great guidance for the industrial recycling of spent Li-ion batteries.
Introduction
Multifarious electronic devices, such as mobile phones, laptops, video cameras and other modern life appliances, use lithium ion batteries (LIBs) as their power source, taking advantage of the excellent features of LIBs, including high energy density, long storage life, low self-discharge rate, light weight, no memory effect and wide operating temperature range.1–3 They have become even more important now because of their usage in electric vehicles and power storage devices.4 The number of LIBs is dramatically increasing with the occurrence of hybrid electric vehicles (HEVs) and will further explode with the wide application of plug-in hybrid electric vehicles (PHEVs) and pure electric vehicles (EVs).5 The production of commercial LIBs reached 100 GW h in 2015, and global markets will be close to $32 billion by 2020.6 Furthermore, the production and consumption of LIBs are expected to increase steadily in forthcoming years. The stricter emission standard of CO2 for automobile manufacturers is one of the driving forces for the increasing usage of LIBs in the vehicle market.7 Owing to the limited cycle life of LIBs, large quantities of solid LIB waste are being generated every year. Spent LIBs will not only contaminate the environment if they are not disposed properly, but also waste precious resources if not recovered or reused. Therefore, it is inevitable to recover the highly valuable metals from spent LIBs.8–10In recent years, the recycling of LIBs has attracted great attention. LiCoO2 is the first-generation cathode material of LIBs; thus, the recycling of LIBs with LiCoO2 cathode active materials has been widely studied.11–14 However, nowadays, a wide variety of lithium compounds are used as cathode materials, such as LiMn2O4, LiNixMnyCo(1−x−y)O2, and LiFePO4. The most expensive portion of a battery is the cathode material, and the composition of cathode materials changes greatly with the development of new technologies to pursue low cost and high energy density. In general, cathode materials, such as copper and steel, account for about 90% of the total intrinsic value of LIBs.15
Recent recycling processes of spent LIBs were reviewed by Ordoñez et al.2 Currently, many approaches have been used to recover valuable metals from spent LIBs, such as electrochemical,16–19 hydrometallurgical20–22 and bioleaching23–25 methods. From the perspective of human health and the environment, the hydrometallurgical process is a favorable method for recycling metals from spent LIBs compared with pyrometallurgical processes because of its advantages, such as high recovery yield, low energy consumption, no air emissions and full recycling of valuable metals with high purity.26,27 It is well-known that valuable metals, such as nickel, cobalt, manganese, aluminum and copper, in spent LIBs can be leached using acids, such as hydrochloric acid and sulfuric acid, with proper amounts of hydrogen peroxide. However, the top technical obstacle to recycle spent LIBs is that nickel, cobalt and manganese are difficult to separate from the leaching solution with both low energy consumption and high purity.28,29 Some sophisticated technologies aimed at solving this have been presented due to their high economic value. Wang et al.30 adopted a method to separate valuable metals, including nickel, cobalt, manganese and lithium, from the leaching solution. Eventually, manganese hydroxide, nickel hydroxide, cobalt hydroxide and lithium carbonate were recovered as raw materials. It is complicated and expensive to recover nickel, cobalt and manganese. In addition, Nayl et al.31 reported the removal of impurities, such as iron(III), copper(II) and aluminum(III), using 20% Acorga M5640 in kerosene. Using a mass of an organic solvent to extract impurities will generate high cost and even pollute the environment without proper disposal. Moreover, Eric et al.15 increased the pH value to 6.47 to remove over 99% of the impurities. Meanwhile, over 90% of manganese and nickel ions and over 80% of cobalt ions remained in solution. This method is simple and low-cost, but the impurities cannot be removed completely, even with the loss of nickel, cobalt and manganese. Celante et al.32 and Scott et al.33 removed copper with high efficiency by electrodeposition, but the copper impurity could not be removed completely.
In this study, spent lithium-ion batteries were leached into solution after pretreatment. In order to purify the solution, the iron(III) and aluminum(III) impurities were removed by increasing the pH value. Then, most of the copper(II) ions were removed using electrodeposition technology with high selectivity, and the rest was removed by the solvent extraction method. These treatments ensured that the impurities could be completely removed separately with a low cost and mild environmental impact, and simultaneously, the loss of nickel, cobalt and manganese was very low. After purification, the mixed solution with Ni, Co and Mn was precipitated and then, the new LNCM cathode material was re-synthesized. The physical properties and electrochemical performances of the recycled cathode material were evaluated through a newly assembled cell with fresh new materials as the control group.
Experimental
Leaching metal elements from spent LIBs
In order to recycle the transition metal elements, the process of leaching metal elements into solution from spent LIBs was performed before the adoption of hydrometallurgy. Spent electric vehicle batteries with LiNixMnyCo(1−x−y)O2 as the cathode material and the capacity of 28 A h were obtained from Coslight Group. First, the spent LIBs were discharged with the residual voltage below 2.0 V, and then the batteries were split manually under protection. Second, the shredded cathode and anode electrodes of a certain size and some steel shell were added to 2.5 mol L−1 sodium hydroxide solution to dissolve aluminum and separate the cathode and anode materials from the electrodes. The specific operations were as follows: after reacting at room temperature for 15 min, the mixture was moved into a thermostat water bath, stirred at 70 °C for 2 h and filtered. Third, the filtered residue, including the active and graphite materials was added to 2.5 mol L−1 sulfuric acid with proper amounts of commercial hydrogen peroxide (30%). This solution was stirred at 70 °C for 2 h and then filtered. The concentrations of iron, aluminum, copper, nickel, cobalt and manganese in the solution were measured via inductively coupled plasma optical emission spectrometry (ICP-OES). From the first generation of spent LiCoO2 batteries, researchers have paid more attention to valuable metals of Li and Co. Our group also did lots of related research on the recovery and recycling of Li.34,35 As the recovery technique of lithium is already quite mature and also not our close concern, herein, we did not focus on it. In general, the dissolved Li+ was precipitated by adding sodium carbonate and forming lithium carbonate as the raw material for synthesizing new cathode materials.Removal of iron(III), aluminum(III) and copper(II) impurities
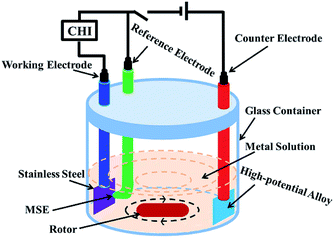
First, the pH of the leaching solution was increased to 3.5 with NaOH solution to selectively remove iron(III) impurity. In order to decrease the loss of nickel(II), cobalt(II) and manganese(II), the aluminum(III) impurity was removed by increasing the pH value to 5.25 using NH3·H2O as the pH buffer solution. Then, different pH buffer solutions, including sodium acetate solution, sodium bicarbonate solution, ammonium bicarbonate solution, ammonia and sodium hydroxide solution, were used to determine the best solution. Finally, the pH value and buffer solution concentration were optimized.In the experiment for removing copper(III) impurity, a high-potential alloy electrode was used as the anode with the oxygen evolution reaction. Stainless steel was used as the cathode with the reduction of copper(II) to copper. A mercurous sulfate electrode (MSE) was used as the reference electrode, the standard electrode potential of which was 0.616 V versus the standard hydrogen electrode (SHE) at 25 °C. A CHI660e electrochemical workstation was used as the power and control system. The electroplating solution was the metal solution with proper magnetic stirring in the electroplating bath. A schematic of the concrete electrodeposition equipment is illustrated in Fig. 1. Given a suitable current by the CHI660e and setting the stopping potential to −0.61 V vs. MSE, the system was automatically disconnected when the electrode potential polarized to the hydrogen evolution potential. Further, the current was manually adjusted to continue the program until the current was too low to reduce copper(II) efficiently.
Finally, the pH of the metal solution was adjusted to 3 after electrodeposition. Then, the same volume of N902 organic extractant was added to the metal solution, the concentration of which was 5%, 15%, 25%, 35% and 45%, respectively. These mixtures were shaken for about 5 min, and then left to stand until they were layered. The metal solutions were separated from the mixtures. All the metal solution samples were quantitatively analyzed via inductively coupled plasma optical emission spectrometry (ICP-OES).
Recycling nickel(II), cobalt(II) and manganese(II)
The pH values of the metal solutions after removing the impurities were adjusted to 10, 10.5, 11, 11.5, 12, 12.5 and 13 by slowly adding 2 mol L−1 sodium hydroxide solution with the proper amount of ammonia in a sealed glass container. Simultaneously, nitrogen, as protective gas, was pumped into the sealed glass container and the solution was stirred rapidly. The solution was stirred continuously for about 5 h until the solution pH reached the target value. Finally, the concentrations of nickel(II), cobalt(II) and manganese(II) were tested in the filtrate after filtering the solution.The metal solution before impurity removal and the filtrate after coprecipitation were analyzed via inductively coupled plasma optical emission spectrometry (ICP-OES) to calculate the loss rates and comprehensive loss rates of nickel, cobalt and manganese.
Synthesis of LiNi0.41Co0.21Mn0.38O2
The precipitated Ni0.41Co0.21Mn0.38(OH)2 from the recycled material was used as the precursor to synthesize LiNi0.41Co0.21Mn0.38O2. Moreover, CoSO4·7H2O, NiSO4·6H2O and MnSO4·H2O as raw materials were used to synthesize the precursor Ni0.41Co0.21Mn0.38(OH)2 in the same way. These two types of precursors were mixed with LiOH in a molar ratio of 1![[thin space (1/6-em)]](https://www.rsc.org/images/entities/char_2009.gif) :
:![[thin space (1/6-em)]](https://www.rsc.org/images/entities/char_2009.gif) 1.05 each, and then ground for 7 h in a planetary ball mill. The pellets were then sintered at 850 °C for 20 h in air, and the temperature was raised at a rate of 5 °C min−1 from room temperature. The reaction products were ground into a powder using a mortar and pestle. Finally, the sample synthesized by the recycled material was marked as LNCM-R and that synthesized using the new material was labeled as LNCM-N.
1.05 each, and then ground for 7 h in a planetary ball mill. The pellets were then sintered at 850 °C for 20 h in air, and the temperature was raised at a rate of 5 °C min−1 from room temperature. The reaction products were ground into a powder using a mortar and pestle. Finally, the sample synthesized by the recycled material was marked as LNCM-R and that synthesized using the new material was labeled as LNCM-N.
Physicochemical characterization
The pH value was tested using an Lei-ci PHS-3C-type pH meter. The amount of metal elements in the solution was analyzed using inductively coupled plasma optical emission spectrometry (ICP-OES). The crystal structure of LiNi0.41Co0.21Mn0.38O2 was characterized by X-ray diffraction (XRD) using a D/max-γβ X′ pert diffractometer (Rigaku, Japan) with a Cu-Kα radiation source. The morphologies of the samples were determined using a scanning electron microscope (SEM, HITACHI, S-4700). The microstructure characteristics of the samples synthesized with recycled material were observed using a high-resolution transmission electron microscope (HR-TEM, JEOL JEM-2010) working at an accelerating voltage of 200 kV, and their lattice structures were identified using the selected area electron diffraction (SAED) technique.Electrochemical evaluation
The electrochemical performances of the samples were measured using galvanostatic cycling. First, two electrode CR2032-type coin cells were assembled using LNCM-R and LNCM-N as the cathodes. Metallic lithium foil was used as the anode and Celgard-2320 membrane as the separator. The electrolyte was 1 mol L−1 LiPF6 dissolved in ethylene carbonate (EC), dimethyl carbonate (DMC) and diethyl carbonate (DEC) at a volumetric ratio of 1![[thin space (1/6-em)]](https://www.rsc.org/images/entities/char_2009.gif) :
:![[thin space (1/6-em)]](https://www.rsc.org/images/entities/char_2009.gif) 1
1![[thin space (1/6-em)]](https://www.rsc.org/images/entities/char_2009.gif) :
:![[thin space (1/6-em)]](https://www.rsc.org/images/entities/char_2009.gif) 1. Galvanostatic charge and discharge experiments were performed using an 8-channel battery analyzer (Neware, China) with a constant current density in the voltage range of 3.0–4.3 V. The theoretical capacities of all the cathode materials were 160 mA h g−1 (i.e., a current density of 160 mA g−1 corresponding to 1.0C). The assembled cells were tested for 100 cycles at the current density of 0.2C to analyze their cycling performance after being activated for 3 cycles at the current density of 0.1C. A CHI660e electrochemical analyzer (Chenhua, China) was used to perform electrochemical impedance spectroscopy (EIS) on the different cathodes in the frequency range of 100 to 0.01 kHz. The kinetics of lithium ion extraction/insertion in the coin cells were measured using the galvanostatic intermittent titration technique (GITT). For the GITT measurement, the constant current was set as 0.1C for a given time period (10 min), followed by an open-circuit stand for a specified time interval (40 min) to approach a near-equilibrium state. The sequence was repeated until the target voltage was reached. All experiments were performed at a temperature of 25 ± 0.5 °C.
1. Galvanostatic charge and discharge experiments were performed using an 8-channel battery analyzer (Neware, China) with a constant current density in the voltage range of 3.0–4.3 V. The theoretical capacities of all the cathode materials were 160 mA h g−1 (i.e., a current density of 160 mA g−1 corresponding to 1.0C). The assembled cells were tested for 100 cycles at the current density of 0.2C to analyze their cycling performance after being activated for 3 cycles at the current density of 0.1C. A CHI660e electrochemical analyzer (Chenhua, China) was used to perform electrochemical impedance spectroscopy (EIS) on the different cathodes in the frequency range of 100 to 0.01 kHz. The kinetics of lithium ion extraction/insertion in the coin cells were measured using the galvanostatic intermittent titration technique (GITT). For the GITT measurement, the constant current was set as 0.1C for a given time period (10 min), followed by an open-circuit stand for a specified time interval (40 min) to approach a near-equilibrium state. The sequence was repeated until the target voltage was reached. All experiments were performed at a temperature of 25 ± 0.5 °C.
Results and discussion
Leaching metal elements of spent lithium-ion batteries, removing iron(III) and aluminum(III) impurities, choosing pH buffer and optimizing the pH value of the buffer
The concentrations of aluminum(III), copper(II), iron(III), nickel(II), cobalt(II) and manganese(II) in the leaching metal solution were measured and the molar ratio of nickel(II), cobalt(II) and manganese(II) was calculated. The results showed that the molar ratio of nickel(II), cobalt(II) and manganese(II) was 4.14![[thin space (1/6-em)]](https://www.rsc.org/images/entities/char_2009.gif) :
:![[thin space (1/6-em)]](https://www.rsc.org/images/entities/char_2009.gif) 2.09
2.09![[thin space (1/6-em)]](https://www.rsc.org/images/entities/char_2009.gif) :
:![[thin space (1/6-em)]](https://www.rsc.org/images/entities/char_2009.gif) 3.77.
3.77.
The standards of aluminum, iron and copper impurities for the recycled products and samples in the metal solution are given in Table 1.
| Impurity | Copper (ppm) | Iron (ppm) | Aluminum (ppm) |
|---|---|---|---|
| Standard of purification | 50 | 100 | 150 |
| Purified value of sample | 1.1 | 2.3 | 3.4 |
The pH values corresponding to the initial and the complete precipitation of different metal ions in solution and the solubility product of Fe(OH)3, Al(OH)3, Cu(OH)2, Ni(OH)2, Co(OH)2 and Mn(OH)2 are shown in Table 2. The data illustrate that the precipitation of iron(III) and aluminum(III) was not affected by the presence of other metals. The solubility product of Fe(OH)3 is 4.0 × 10−38, which is quite small compared with that of the others. Therefore, iron(III) is precipitated completely in theory when the pH value increases to 4.1. The pH value for the complete precipitation for aluminum(III) is 5.2, while the pH values for the initial precipitation of nickel(II), cobalt(II) and manganese(II) are close to or even higher than 6.7. There is a big gap between them. Consequently, the impurity removal of iron(III) and aluminum(III) has high selectivity. In fact, nickel(II), cobalt(II) and manganese(II) do not begin to precipitate until the end of copper(II), iron(III) and aluminum(III) precipitation. Therefore, removing iron(III) and aluminum(III) by adjusting the pH value of metal solution was adopted in this experiment.
| Hydroxide | pH of initial precipitation | pH of complete precipitation | pH of initial dissolution | Solubility product |
|---|---|---|---|---|
| Cu(OH)2 | 4.4 | 6.4 | — | 2.2 × 10⁻²⁰ |
| Al(OH)3 | 3.3–4 | 5.2 | 7.8 | 1.3 × 10⁻³³ |
| Fe(OH)3 | 1.5–2.3 | 4.1 | — | 4.0 × 10−38 |
| Co(OH)2 | 6.8–7.6 | 8.7–9.2 | 14.1 | 1.1 × 10⁻¹⁵ |
| Ni(OH)2 | 6.7–7.7 | 8.9–9.5 | — | 2.0 × 10⁻¹⁵ |
| Mn(OH)2 | 7.8–8.8 | 9.8–10.4 | 14 | 1.9 × 10⁻¹³ |
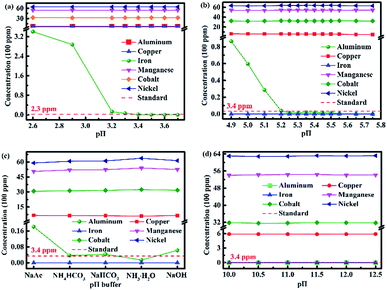
Fig. 2a shows the change in the concentrations of metal ions in the solution during the removal of the iron(III) impurity by adjusting the pH value of the leaching solution. As can be seen, the concentration of iron(III) ion in the solution became lower and lower with the increase in the pH value. The concentration of iron(III) ions decreased to 1.2 ppm when the pH value was adjusted to 3.4, which was lower than the standard of iron(III) content (2.3 ppm) in the sample. The concentration of iron(III) ion was much lower and even down to zero when the pH value was greater than 3.5, while the concentrations of the other five types of metal ions did not change even when the pH value was 3.7.
The iron(III) impurity was removed from metal solution selectively by adjusting the pH value of the metal solution. The same experimental scheme was used to remove aluminum(III) in the metal solution, and the result is displayed in Fig. 2b. Analogously, the concentrations of aluminum(III) and copper(II) ions became lower and lower with the increase in pH value, but the change was not obvious for the copper(II) ions. When the pH value of the solution increased to 5.25, the concentration of aluminum(III) ions decreased to 1.4 ppm, which was lower than the standard of aluminum(III) content (3.4 ppm) in the sample. When the pH value of the solution was between 5.25 and 5.50, the concentration of aluminum(III) ions remained at about 1 ppm. There were no aluminum(III) ions in the solution when the pH value increased to 5.65. Furthermore, the concentrations of nickel(II), cobalt(II) and manganese(II) ions hardly decreased. As presented in Table 2, the solubility product of Al(OH)3 is 1.3 × 10⁻³³, which is much less than that of Co(OH)2, Ni(OH)2 and Mn(OH)2. The pH value for the complete precipitation of aluminum(III) is theoretically 5.2, which is less than those for the initial precipitation of nickel(II), cobalt(II) and manganese(II). Hence, the experimental scheme for the removal of the aluminum(III) ions in the solution is feasible by increasing the pH value to 5.25.
The iron(III) and aluminum(III) impurities could be removed selectively by increasing the pH value of the metal solution. Different pH buffers were used to adjust the pH values of the solutions further, with the purpose of choosing the best pH buffer. The experimental result is presented in Fig. 2c. There was no iron(III) ions in the solution after using the five pH buffers to adjust the pH values of the solutions. In the case of aluminum(III) ion removal, NH3·H2O was the best pH buffer because by only using NH3·H2O, the concentration met the standard of the aluminum(III) content (3.4 ppm) with the lowest value. Moreover, the residual contents of nickel(II), cobalt(II) and manganese(II) ions were the most when NH3·H2O was used as the pH buffer. Thus, the best pH buffer was NH3·H2O.
NH3·H2O was selected as the best pH buffer. The pH influence of NH3·H2O was investigated further, and the result is shown in Fig. 2d. As can be seen from Fig. 2d, the concentrations of nickel(II), cobalt(II) and manganese(II) ions were almost equivalent when NH3·H2O with different pH values was used as the pH buffer. All the concentrations of aluminum(III) ion were lower than the standard of aluminum(III) content (3.4 ppm), and all the concentrations of iron(III) ion were zero while using NH3·H2O of different pH values. Therefore, the pH value of NH3·H2O was identified to have no effect.
Removing copper(II) impurity
As can be seen in Tables 2 and S1,† the pH value that copper(II) finally precipitates is close to that of nickel(II) and cobalt(II). Nickel and cobalt elements precipitated with trace amounts of copper(II) that remained in solution. It can be considered that the copper(II) ions cannot be selectively removed by adjusting the solution pH. Table S2† shows the possible reduction reactions in the metal solution and their standard electrode potentials versus the standard hydrogen electrode (SHE) and mercurous sulfate electrode (MSE). The standard electrode potential when copper(II) is reduced to copper is higher than the hydrogen evolution potential, and the standard electrode potentials when nickel(II), cobalt(II) and manganese(II) are reduced to nickel, cobalt and manganese, respectively, are lower than the hydrogen evolution potential. Hence, copper element can be removed by constantly controlling the electrode potential to be higher than the hydrogen evolution potential in the solution.Fig. 3a shows the Pourbaix diagram of copper in aqueous solution. When the pH value of the solution was adjusted to less than 5, a suitable current density was given and then the stopping potential of −0.61 V vs. MSE (0 V vs. SHE) was set, and the electrodeposition of copper was performed directly from copper(II) to copper. Moreover, the pH value of the deposition solution, which was closely related to the direct reduction, decrease due to the oxygen evolution reaction in the anode. Therefore, a massive amount of copper(II) ions can be removed with high selectivity theoretically. The concentration of copper(II) ions before and after electrodeposition dramatically changed. The concentration of copper(II) ions after electrodeposition decreased from 682.4 ppm to 6.1 ppm (as shown in Table S3†), which was more than the standard of copper(II) content (1.1 ppm) in the sample because the diffusion velocity of copper(II) in the solution was slower than that of electronic in the external circuit. Copper(II) ions could be removed completely in theory when the stirring speed of electroplating solution was fast enough. However, the concentration of nickel(II), cobalt(II) and manganese(II) remained stable within the margin of error. Therefore, electrodeposition technology is a highly selective method to remove copper(II) impurity.
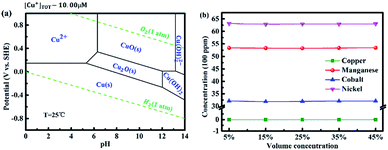 | ||
| Fig. 3 (a) Pourbaix diagram of copper in aqueous solutions.32 (b) Concentrations of metal ions in the solution after removing copper(II) ions by solvent extraction. | ||
The remaining copper(II) ions were removed by solvent extraction. The result of removing copper(II) ions by solvent extraction with different volume concentrations of N902 is shown in Fig. 3b. All the concentrations of copper(II) ions after removing the copper(II) impurities by solvent extraction with different volume concentrations of N902 were zero, which were lower than the standard of copper(II) content (1.1 ppm). In addition, there was barely any change in the concentrations of nickel(II), cobalt(II) and manganese(II) ions with different volume concentrations of N902, as shown in Table S4.† Thus, it can be considered that solvent extraction had no influence of on the removal of copper(II) ions, even when the saturation of N902 was greater than the content of copper(II) ions in the solution.
Nickel(II), cobalt(II), and manganese(II) recycling and physical properties of the as-synthesized LiNi0.41Co0.21Mn0.38O2
After removing all the impurities, the nickel(II), cobalt(II) and manganese(II) ions were recovered by adjusting the pH value, and the result is displayed in Fig. 4. The concentrations of metal elements in the filtrate became low initially, and then slightly higher because of the amphoteric compound changing with the pH value increasing from 10 to 13. When the pH value was 10, the concentrations of the metal ions were still high, especially for the concentration of manganese(II) ions, which was 260.5 ppm. When the pH value increased to 11, the concentrations of metal ions were the lowest. The concentrations of nickel(II), cobalt(II) and manganese(II) ions were 0.1, 0.1 and 0.2 ppm, respectively. Thus, it can be concluded that nickel(II), cobalt(II) and manganese(II) ions in the filtrate were recovered completely within the margin of error. The concentrations of metal ions were still very low when the pH value ranged from 11 to 12.5. The concentrations of metal ions began to become high when the pH value was 13 because of the amphoteric compound. Therefore, 11 was the best pH value to recover nickel(II), cobalt(II) and manganese(II) ions in the solution. This result is consistent with the optimal value in the literature.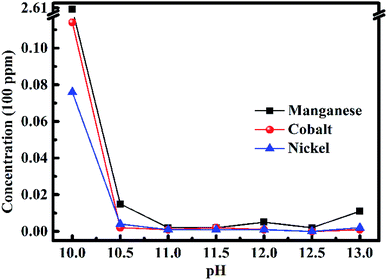 | ||
| Fig. 4 Concentrations of metal ions in the filtrate after recycling nickel(II), cobalt(II) and manganese(II) ions by adjusting the pH value of the solution. | ||
The loss rates and comprehensive loss rate of nickel, cobalt and manganese elements after removing the impurities and recycling nickel, cobalt and manganese elements are given in Table 3. The loss rates of manganese, cobalt and nickel elements were 0.39%, 0.25% and 0.42% for the recycled samples, respectively. Also, its comprehensive loss rate was just 0.37%. All the contents of impurities in the recycled samples were lower than the standards of impurity content.
| Element | Aluminum | Copper | Iron | Manganese | Cobalt | Nickel |
|---|---|---|---|---|---|---|
| Concentration before removing impurities (ppm) | 613.5 | 697.9 | 587.9 | 5426 | 3234 | 6376 |
| Molar ratio | — | — | — | 3.77 | 2.09 | 4.14 |
| Concentration in recycled sample (ppm) | 0.8 | 0 | 0 | 5405 | 3226 | 6349 |
| Loss rate (%) | — | — | — | 0.39 | 0.25 | 0.42 |
| Comprehensive loss rate (%) | — | — | — | 0.37 | ||
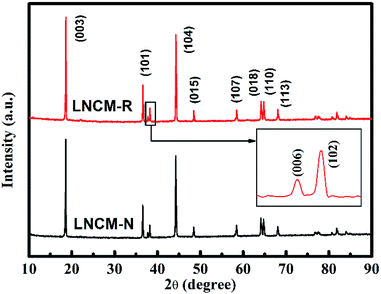
The X-ray diffraction patterns of the LNCM-R and LNCM-N samples are presented in Fig. 5, which show that both samples have a greatly layered structure without any impurity reflections. The main diffraction peaks can be indexed to the hexagonal phase α-NaFeO2-type structure with the space group of R![[3 with combining macron]](https://www.rsc.org/images/entities/char_0033_0304.gif) m. Evident splitting (006)/(102) and (108)/(110) reflections can be seen in the XRD patterns, which indicate well-defined layered structures for both samples.36 The lattice parameters were calculated from the refinement of the XRD data, which are shown in Table 4. The intensity ratio of I(003)/I(104) is inversely proportional to the cationic mixing degree of the layered structure.37,38 The high intensity ratios of I(003)/I(104) were larger than 1.2 for LNCM-N and LNCM-R, which implies that both LNCM-N and LNCM-R have a low cationic mixing degree39 and ordered layer structure. Moreover, the ratios of c/a for both the samples were larger than 4.899, which confirm the layered structure based on the study by Ngala et al.40 They reported that the c/a ratio of the lattice parameter is a direct measurement for the deviation of the lattice from an ideal cubic close-packed lattice. Since the ideal cubic close-packed lattice has a c/a ratio of 4.899, for larger c/a samples (Table 4), the ratios are larger than 4.960. Similarly, both of them have a well-ordered layered structure.
m. Evident splitting (006)/(102) and (108)/(110) reflections can be seen in the XRD patterns, which indicate well-defined layered structures for both samples.36 The lattice parameters were calculated from the refinement of the XRD data, which are shown in Table 4. The intensity ratio of I(003)/I(104) is inversely proportional to the cationic mixing degree of the layered structure.37,38 The high intensity ratios of I(003)/I(104) were larger than 1.2 for LNCM-N and LNCM-R, which implies that both LNCM-N and LNCM-R have a low cationic mixing degree39 and ordered layer structure. Moreover, the ratios of c/a for both the samples were larger than 4.899, which confirm the layered structure based on the study by Ngala et al.40 They reported that the c/a ratio of the lattice parameter is a direct measurement for the deviation of the lattice from an ideal cubic close-packed lattice. Since the ideal cubic close-packed lattice has a c/a ratio of 4.899, for larger c/a samples (Table 4), the ratios are larger than 4.960. Similarly, both of them have a well-ordered layered structure.
| Sample | a (Å) | c (Å) | c/a | V (Å3) | I(003)/I(104) |
|---|---|---|---|---|---|
| LNCM-N | 2.896 | 14.375 | 4.964 | 104.42 | 1.229 |
| LNCM-R | 2.890 | 14.341 | 4.962 | 103.72 | 1.213 |
Different morphologies and particle distribution of the as-synthesized materials have various influences on the electrochemical performance of cathode materials. The SEM images of the as-synthesized LNCM-R and LNCM-N samples are shown in Fig. 6a and b, respectively. There are no distinct morphology differences between these two samples from the SEM observation. Smooth surfaces with well-distributed particles are shown in both samples and the particles of these two samples are smaller than 500 nm. Both the LNCM-R and LNCM-N samples were agglomerated and had irregular shapes, which were contributed by the limitation of the co-precipitation conditions and the synthesis technology, such as the surface reactions during the calcination process at a high temperature or the high surface free energy of the nanoparticles.41 Our goal was to find out the differences in the cathode materials synthesized using the recovered and pristine materials under the same conditions. The agglomeration is not due to the defects or impurities of the recovered materials. We think that this result can justify our purpose for comparison and make it acceptable.
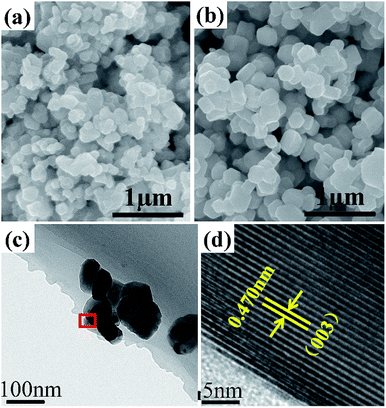 | ||
| Fig. 6 SEM images of the as-synthesized samples: (a) LNCM-R and (b) LNCM-N. (c) TEM and (d) HRTEM images of the LNCM-R sample. | ||
To thoroughly research the crystal morphology and crystallinity of the layered cathode material synthesized using the recycled material, the LNCM-R sample was investigated via transmission electron microscopy (TEM) and high-resolution transmission electron microscopy (HRTEM). Fig. 6c shows the typical low-magnification transmission electron microscopy (TEM) image of the as-synthesized cathode material. LNCM-R was an agglomeration of irregular shaped particles with an average size of 150–250 nm. As shown in the HRTEM image of LNCM-R in Fig. 6d, its interface displays a typical layered structure with an interplanar spacing of 0.470 nm, which corresponds to both the R![[3 with combining macron]](https://www.rsc.org/images/entities/char_0033_0304.gif) m (003) planes and/or C2/m (001) planes.42
m (003) planes and/or C2/m (001) planes.42
Electrochemical performance
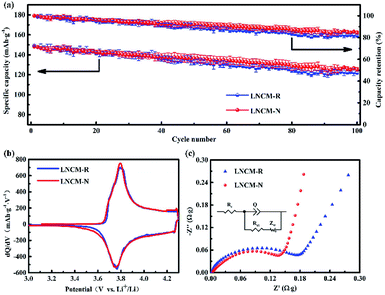
Fig. 7a shows the average cycling performances and capacity retentions with variances in the LNCM-R and LNCM-N samples between 3.0 and 4.3 V at 0.2C. For the LNCM-R sample, a relatively slow average capacity decay from 149.0 mA h g−1 to 122.4 mA h g−1 was observed within 100 cycles, which corresponds to a relatively low average capacity retention of 82.1% after 100 cycles. In comparison, the LNCM-N sample delivered an average discharge capacity of 148.3 mA h g−1 at the 1st cycle and 126.5 mA h g−1 at the 100th cycle with an average capacity retention of 85.3%. As can be seen, there is no noticeable difference between the samples in their average discharge capacities and cycle performances.The initial differential capacities versus voltage (dQ/dV) curves of the layered materials are shown in Fig. 7b. The initial dQ/dV curves of the LNCM-R and LNCM-N samples are almost the same, and they show distinct oxidation peaks at approximately 3.82 V, which can be attributed to the oxidation of Ni2+ and Co3+ to Ni4+ and Co4+ ions in the layered material, respectively. Furthermore, the reduction peaks of the two samples at about 3.76 V, corresponding to the reduction of Ni4+ and Co4+ to Ni2+ and Co3+ ions were observed in the initial discharge process. The potential differences between the oxidation and reduction peaks usually represent the kinetics of the redox reaction, in particular the diffusion ability of lithium ions during the electrochemical process. A smaller potential difference between the oxidation and the reduction peaks corresponds to better ion diffusion. It can be seen from the cyclic voltammetry curves that the potential differences between the oxidation and reduction peaks for the LNCM-R and LNCM-N samples were less than 1 V, which indicates that the corresponding electrodes of the LNCM-R and LNCM-N samples have great ion diffusion ability.
To better understand the differences in the electrochemical properties between the LNCM-R and LNCM-N samples, the electrochemical impedance spectra (EIS) of the as-synthesized electrodes were measured at an open-circuit voltage in the frequency range from 100 kHz to 10 MHz. As presented in Fig. 7c, the EIS of both samples showed a semicircle in the high frequency region and a line in the low frequency region. The semicircle in the high frequency region is assigned to the charge transfer reaction (Rct) between the electrolyte and the electrodes, and the line in the low frequency region is attributed to the Warburg resistance (Zw), which is related to the Li ion diffusion in the bulk material.43 The charge-transfer impedances (Rct) calculated from the Nyquist plots are 0.198 Ω g and 0.176 Ω g for the LNCM-R and LNCM-N materials, respectively. The charge-transfer impedances (Rct) of LNCM-R is slightly larger than that of LNCM-N.
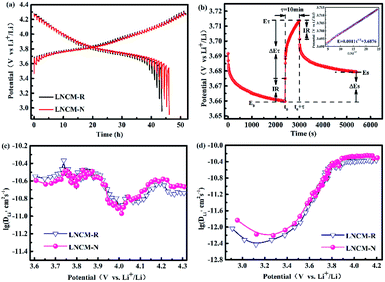
In order to further understand the kinetic behavior, which depends mostly on the de/intercalation of lithium ions, the galvanostatic intermittent titration technique (GITT) as an effective measurement was used to research the difference in the Li-ion diffusion coefficient (DLi+) of the LNCM-R and LNCM-N samples.44,45 The experimental GITT curves of LNCM-R and LNCM-N for the first electrochemical cycle is shown in Fig. 8a. As the GITT test was applied, the cell was charged and discharged by getting a trigger at a constant current density of 0.1C for 10 min and released by stopping the current for 40 min to reach a near equilibrium state (Es) in the voltage range of 3.0–4.3 V (vs. Li+/Li). This setting was repeated until the final potential ceiling was reached.46 The voltage gap between the end position of each charging and that of releasing is defined as the overpotential.47
The overpotential can be treated as a determining factor of kinetic performance: the larger the overpotential, the more sluggish the Li+ diffusion (in this case).44
Fig. 8b illustrates the current pulse vs. voltage profile for a single titration. To calculate the lithium-ion diffusion coefficient, the following equation was adopted based on the Fick's second law of diffusion and a series of assumptions and simplifications:48
 | (1) |
 shows a straight line behavior during titration (as shown by the inset graph in Fig. 8b), eqn (1) can be further simplified as:50
 | (2) |
The calculated DLi+ values of the LNCM-R and LNCM-N samples during the charge and discharge process are shown in Fig. 8c and d, respectively. The curves of the samples in charge and discharge are almost equivalent, i.e., the DLi+ values of the LNCM-R and LNCM-N samples during charge and discharge are nearly equivalent. The DLi+ values for the LNCM-R and LNCM-N samples during the charge process are in the range of 10−11 to 10−10.3 cm2 s−1, and the DLi+ values for the LNCM-R and LNCM-N samples during discharge process are in the range of 10−12.5 to 10−10.2 cm2 s−1. This indicates that the LNCM-R and LNCM-N materials exhibit similar electrochemical performances due to the similar lithium-ion diffusion coefficient of the two materials.
Conclusions
In this study, iron(III), aluminum(III) and copper(II) impurities were successfully removed and the concentrations of impurities in the recycled metal solutions were lower than the standard. Iron(III) impurity was removed successfully by adjusting the pH value of the metal solution to 3.5; increasing the solution pH value to 5.25 resulted in the removal of aluminum(III) impurity; plenty of copper(II) ions were removed by electrodeposition technology with high selectivity, and the remaining copper(II) ions were removed by solvent extraction. In addition, the experimental results demonstrated that the best pH buffer is NH3·H2O. After removing all the impurities, nickel(II), cobalt(II) and manganese(II) ions were completely recovered by increasing the pH value to 11 with the loss rates of 0.39% (for manganese), 0.25% (for cobalt) and 0.42% (for nickel). The comprehensive loss rate was just 0.37%. To evaluate the recycled material, the LNCM-R and LNCM-N samples for LiNi0.41Co0.21Mn0.38O2 were synthesized. The physical properties and electrochemical performances of both samples were measured. XRD, SEM, TEM and HRTEM indicated that both samples had similar physical properties. The charge–discharge tests, initial dQ/dV curves, EIS and GITT of the re-synthesized LiNi0.41Co0.21Mn0.38O2 were almost as good as that of the freshly synthesized material. Therefore, the recycled material has similar properties as the new material, which can be used as a raw material to synthesize electrode material.Conflicts of interest
There are no conflicts to declare.Acknowledgements
This work was finally supported by the foundation of National Key Laboratory (6142808020117C01), P. R. China and the University Nursing Program for Young Scholars with Creative Talents in Heilongjiang Province (UNPYSCT-2018138).Notes and references
- M. Shuva and A. Kurny, Am. J. Mater. Sci. Technol., 2013, 1, 8–12 Search PubMed.
- J. O. Ez, E. J. Gago and A. Girard, Renewable Sustainable Energy Rev., 2016, 60, 195–205 CrossRef.
- L. Yang, Y. Xi and G. Xi, Ceram. Interfaces, 2015, 41, 11498–11503 CrossRef CAS.
- V. Etacheri, R. Marom, R. Elazari, G. Salitra and D. Aurbach, Energy Environ. Sci., 2011, 4, 3243 RSC.
- L. Li, L. Zhai, X. Zhang, J. Lu, R. Chen, F. Wu and K. Amine, J. Power Sources, 2014, 262, 380–385 CrossRef CAS.
- M. R. Palacin and A. de Guibert, Science, 2016, 351, 1253292 CrossRef CAS PubMed.
- J. M. Tarascon and M. Armand, Nature, 2008, 451, 652–657 CrossRef.
- L. Sun and K. Qiu, J. Hazard. Mater., 2011, 194, 378–384 CrossRef CAS.
- M. Freitas, E. M. Garcia and V. G. Celante, J. Appl. Electrochem., 2009, 39, 601–607 CrossRef CAS.
- M. A. Rabah, F. E. Farghaly and M. A. Motaleb, Waste Manage., 2008, 28, 1159–1167 CrossRef CAS.
- L. Ma, Z. Nie, X. Xi and X. Han, Hydrometallurgy, 2013, 136, 1–7 CrossRef CAS.
- L. Sun and K. Qiu, Waste Manage., 2012, 32, 1575–1582 CrossRef CAS.
- L. Li, R. Chen, F. Sun, F. Wu and J. Liu, Hydrometallurgy, 2011, 108, 220–225 CrossRef CAS.
- J. Xu, H. R. Thomas, R. W. Francis, K. R. Lum and J. Wang, J. Power Sources, 2008, 177, 512–527 CrossRef CAS.
- E. Gratz, Q. Sa, D. Apelian and Y. Wang, J. Power Sources, 2014, 262, 255–262 CrossRef CAS.
- B. Swain, J. Jeong, J. Lee, G. Lee and J. Sohn, J. Power Sources, 2007, 167, 536–544 CrossRef CAS.
- M. Freitas, E. M. Garcia and V. G. Celante, J. Appl. Electrochem., 2009, 39, 601–607 CrossRef CAS.
- E. M. Garcia, H. A. Tar Co, T. Matencio, R. Z. Domingues, J. A. F. Dos Santos, R. V. Ferreira, E. Loren On, D. Q. Lima and M. B. J. G. de Freitas, J. Appl. Electrochem., 2012, 42, 361–366 CrossRef CAS.
- E. M. Garcia, J. S. Santos, E. C. Pereira and M. Freitas, J. Power Sources, 2008, 185, 549–553 CrossRef CAS.
- L. Li, J. Ge, F. Wu, R. Chen and S. Chen, J. Hazard. Mater., 2010, 176, 288–293 CrossRef CAS.
- S. M. Shin, N. H. Kim, J. S. Sohn, D. H. Yang and Y. H. Kim, Hydrometallurgy, 2005, 79, 172–181 CrossRef CAS.
- D. P. Mantuano, G. Dorella, R. C. A. Elias and M. B. Mansur, J. Power Sources, 2006, 159, 1510–1518 CrossRef CAS.
- D. Mishra, D. J. Kim, D. E. Ralph, J. G. Ahn and Y. H. Rhee, Waste Manage., 2008, 28, 333–338 CrossRef CAS.
- B. Xin, D. Zhang, X. Zhang, Y. Xia, F. Wu, S. Chen and L. Li, Bioresour. Technol., 2009, 100, 6163–6169 CrossRef CAS.
- K. Yoo, S. M. Shin, D. H. Yang and J. S. Sohn, Miner. Eng., 2010, 23, 219–224 CrossRef CAS.
- L. Li, W. Qu, X. Zhang, J. Lu, R. Chen, F. Wu and K. Amine, J. Power Sources, 2015, 282, 544–551 CrossRef CAS.
- J. Li, G. Wang and Z. Xu, J. Hazard. Mater., 2016, 302, 97–104 CrossRef CAS.
- R. C. Wang, Y. C. Lin and S. H. Wu, Hydrometallurgy, 2009, 99, 194–201 CrossRef CAS.
- A. Chagnes and B. Pospiech, J. Chem. Technol. Biotechnol., 2013, 88, 1191–1199 CrossRef CAS.
- R. C. Wang, Y. C. Lin and S. H. Wu, Hydrometallurgy, 2009, 99, 194–201 CrossRef CAS.
- A. A. Nayl, M. M. Hamed and S. E. Rizk, J. Taiwan Inst. Chem. Eng., 2015, 55, 119–125 CrossRef CAS.
- V. G. Celante and M. B. J. G. Freitas, J. Appl. Electrochem., 2010, 40, 233–239 CrossRef CAS.
- K. Scott, X. Chen, J. W. Atkinson, M. Todd and R. D. Armstrong, Resour., Conserv. Recycl., 1997, 20, 43–55 CrossRef.
- R. Zheng, Y. Liu, Q. Ma, D. Mu, L. Ruhong and C. Dai, Rare Met. Mater. Eng., 2018, 47, 344–350 Search PubMed.
- R. Zheng, L. Zhao, W. Wang, Y. Liu, Q. Ma, D. Mu, R. Li and C. Dai, RSC Adv., 2016, 6, 43613–43625 RSC.
- Z. Lu, L. Y. Beaulieu, R. A. Donaberger and A. J. R. Dahn, J. Electrochem. Soc., 2002, 149, A778–A791 CrossRef CAS.
- M. Wang, Y. Chen, F. Wu and Y. Su, Electrochim. Acta, 2010, 55, 8815–8820 CrossRef CAS.
- Y. Choi, S. Pyun and S. Moon, Solid State Ionics, 1996, 89, 43–52 CrossRef CAS.
- P. Thounthong, S. Rael and B. Davat, J. Power Sources, 2006, 158, 806–814 CrossRef CAS.
- J. K. Ngala, N. A. Chernova, M. Ma, M. Mamak, P. Y. Zavalij and M. S. Whittingham, J. Mater. Chem., 2004, 14, 214–220 RSC.
- L. Ban, Y. Yin, W. Zhuang, H. Lu, Z. Wang and S. Lu, Electrochim. Acta, 2015, 180, 218–226 CrossRef CAS.
- M. M. Thackeray, S. Kang, C. S. Johnson, J. T. Vaughey, R. Benedek and S. A. Hackney, J. Mater. Chem., 2007, 17, 3112–3125 RSC.
- C. Yang, Q. Zhang, W. Ding, J. Zang, M. Lei, M. Zheng and Q. Dong, J. Mater. Chem. A, 2015, 3, 7554–7559 RSC.
- C. Shen, S. Shen, F. Fu, C. Shi, H. Zhang, M. J. Pierre, H. Su, Q. Wang, B. Xu, L. Huang, J. Li and S. Sun, J. Mater. Chem. A, 2015, 3, 12220–12229 RSC.
- K. M. Shaju, G. V. S. Rao and B. V. R. Chowdari, J. Electrochem. Soc., 2004, 151, A1324–A1332 CrossRef CAS.
- X. Yu, Y. Lyu, L. Gu, H. Wu, S. M. Bak, Y. Zhou, K. Amine, S. N. Ehrlich, H. Li, K. W. Nam and X. Q. Yang, Adv. Energy Mater., 2014, 4, 11 Search PubMed.
- J. Sun, K. Tang, X. Yu, J. Hu, H. Li and X. Huang, Solid State Ionics, 2008, 179, 2390–2395 CrossRef CAS.
- J. Zheng, W. Shi, M. Gu, J. Xiao, P. Zuo, C. Wang and J. Zhang, J. Electrochem. Soc., 2013, 160, A2212–A2219 CrossRef CAS.
- Y. Wang, X. Bie, K. Nikolowski, H. Ehrenberg, F. Du, M. Hinterstein, C. Wang, G. Chen and Y. Wei, J. Phys. Chem. C, 2013, 117, 3279–3286 CAS.
- K. M. Shaju, G. V. S. Rao and B. V. R. Chowdari, Electrochim. Acta, 2003, 48, 2691–2703 CrossRef CAS.
Footnotes |
| † Electronic supplementary information (ESI) available. See DOI: 10.1039/c9ra02331c |
| ‡ F. Peng and D. Mu contributed equally to this work. |
| This journal is © The Royal Society of Chemistry 2019 |

