
 Open Access Article
 This Open Access Article is licensed under a
 Creative Commons Attribution 3.0 Unported Licence
A feasibility study of a leaky waveguide aptasensor for thrombin
Nasser A.
Alamrani
a,
Gillian M.
Greenway
 a,
Nicole
Pamme
a,
Nicholas J.
Goddard
b and
Ruchi
Gupta
*c
a,
Nicole
Pamme
a,
Nicholas J.
Goddard
b and
Ruchi
Gupta
*c
aDepartment of Chemistry and Biochemistry, University of Hull, Hull, HU6 7RX, UK. E-mail: n.a.alamrani@2014.hull.ac.uk; g.m.greenway@hull.ac.uk; n.pamme@hull.ac.uk; Tel: +44 (0) 1482 465027 Tel: +44 (0)148 246 6355
bProcess Instruments (UK) Ltd, March Street, Burnley, BB12 0BT, UK. E-mail: nick.goddard1@outlook.com; Tel: +44 (0)128 242 2835
cSchool of Chemistry, University of Birmingham, Birmingham, B15 2TT, UK. E-mail: r.gupta@bham.ac.uk; Tel: +44 (0)121 414 6119
First published on 6th September 2019
Abstract
This proof-of-principle study demonstrates the feasibility of a leaky waveguide (LW) aptasensor, where aptamers were immobilised in a mesoporous chitosan waveguiding film for the detection of thrombin. This work has demonstrated that aptamers immobilised in hydrogels retain their affinity and selectivity towards their target and thus can be used as bioreceptors. The use of antibodies as bioreceptors for sensing thrombin is not viable because it is a serine protease, which will cleave the antibodies. Currently used assays based on clotting time and chromogenic/fluorogenic substrates have limited potential for thrombin measurement in whole blood. Using the initial binding rate over the first 5 min, the limit of detection of our LW aptasensor for thrombin was ∼22 nM. The sensor was tested with spiked serum samples, giving a reading of 46.1 ± 4.6 nM for a sample containing 50 nM thrombin. Our proposed sensor combines the robustness and low cost of aptamers as molecular recognition elements with the simple fabrication process of the chitosan-based leaky waveguide, making LW aptasensors highly attractive for applications in point-of-care diagnostics and healthcare monitoring.
Introduction
Clotting based assays are widely used to estimate the concentration of thrombin, but can give misleading results because of the complex nature of the coagulation cascade involving multiple species.1 Alternatively, commercial assays measure thrombin generation using either chromogenic or fluorogenic substrates that are colourless or non-fluorescent until cleaved by the protein.2 Chromogenic assays suffer from the disadvantage that a fibrin formation inhibitor is required to prevent the turbidity associated with fibrin formation affecting the results. The fluorogenic assays do not require fibrin inhibition, but suffer from the inner filter effect, where fluorescence emission is reabsorbed by other free fluorophores. The commercial assays require sample sizes between 40 and 135 μL of plasma and cannot use whole blood because the absorption of haemoglobin overlaps that of the p-nitroaniline released by the chromogenic substrate and also that of the 7-amino-4-methylcoumarin released from the fluorogenic substrate. Several of these limitations may be overcome by biosensors with integrated microfluidics sample delivery that rely on measuring a change in parameters such as refractive index as a result of binding of analyte to bioreceptors in direct physical contact with an optical transducer. For example, evanescent field-based optical biosensors are unaffected by fibrin formation as the resulting clot tends to retract from the surface and thus becomes undetectable. Optical biosensors can also work at wavelengths where haemoglobin has low absorption, and can thus potentially be used with whole blood. One such biosensor is based on leaky waveguides (LWs)3–7 or Hydrogel Optical Waveguides (HOWs).8–10 In LWs, light is confined by phenomena other than total internal reflection (TIR) at either one or both of the waveguide interface(s). The resonance angle of LWs is visualised either by depositing a metal layer or immobilising a suitable dye in the waveguide or fabricating strips of waveguides.3–7 The resonance angle is determined by the effective refractive index of the waveguide, which may change as a result of binding of the analyte to bioreceptors immobilised in the waveguide, forming the biosensing mechanism.Thrombin is a serine protease which will cleave antibodies used as bioreceptors for sensing this protein, and hence immunoassays are performed for the inactive thrombin/anti-thrombin complex.11,12 Aptamers are also beneficial over antibodies because they offer several practical benefits including higher stability, lower cost, purely synthetic production, invariant properties and simpler chemical modifications.13–15 New aptamers against virtually any targets may be identified rapidly using techniques such as systematic evolution of ligands by exponential enrichment (SELEX),16,17 which is an in vitro selection method reducing animal use in the development of bioreceptors. Many different types of thrombin aptasensor have been described,18–24 including optical, electrochemical, potentiometric, gravimetric and capacitive transduction schemes. Some of these have demonstrated sub-pM limits of detection, but mostly in clean buffered samples. For example, Chen et al.24 recently described a capacitive aptasensor for thrombin that used a section of a gold-coated CD-ROM as the active electrode and could achieve a LOD of 10 pM in 50% serum with an assay time of 1 h, although the sensor preparation required 17 h. A fiber optic aptasensor based on interference between two optical modes is reported to have a LOD of 100 nM.25 In another study, four electrode method was used to measure the impedance changes of nanoporous alumina membrane to determine thrombin with a LOD of 10 pM in 500 μM of human serum albumin.26 In this case, the sensor preparation time was 13 h and the assay time was 30 min. Another aptasensor where a liquid crystal (LC) film was sandwiched between glass substrates coated with a surface coupling agent and thrombin-binding aptamer (TBA) has also been demonstrated. The binding of thrombin to TBA changes the alignment of LCs, which can be visualised as a change in light intensity using cross polarisers.27 The orientation of LCs is very sensitive to changes on surface of the glass substrates, which may be introduced as a result of factors (e.g. adsorption of organic molecules) other than the binding of thrombin to TBA. This in turn reduces the device-to-device reproducibility. Alternatively, aptamers have been used as crosslinkers to make hydrogels where the transduction principle is hydrogel swelling/shrinking or formation/dissolution on binding the target.28–31 The LOD of these aptasensors based on target-responsive hydrogels is typically sub-micromolar. These latter types of aptasensor are generally designed for visual readout.
We recently reported a LW comprising of mesoporous chitosan films, which were spin coated following which the drying time was controlled before rehydration.32 Mesoporous LWs allow macromolecules including proteins to diffuse into the waveguide, maximizing their interaction with the optical mode and thus potentially increasing sensitivity by a factor of ∼9 compared to non-porous waveguides. The focus of this work is to investigate the feasibility of aptamers to serve as bioreceptors when immobilised in the 3D network of a chitosan LW. The dissociation constants (KD) of aptamer-target complex immobilised on solid surfaces are reported to be different to the values observed in free solution.33–37 Limited information is, however, available on how well the 3D structure of aptamers, which imparts them the ability to sense specific targets and influences KD, is preserved on immobilising at two points when used as crosslinkers or at a single-point in the volume of hydrogels. Aptamers selectively bind to their targets through hydrogen bonding and electrostatic and hydrophobic interactions, which may be altered by the local microenvironment of the hydrogels. We used a well characterised 15-mer thrombin-binding aptamer (TBA) and commonly used immobilisation chemistry based on streptavidin–biotin in combination with glutaraldehyde as a model system to investigate if the aptamer exhibits the affinity and selectivity toward its target in buffer and serum when immobilised in a mesoporous chitosan LW.
Experimental
Chemicals and materials
1 mm thick microscope glass slides were purchased from VWR (Leicestershire, UK). Decon 90 was purchased from Fisher (Loughborough, UK). Ethanol, chitosan (75–85% deacetylated), 0.1 M acetic acid, reactive blue 4 (RB4), (4-(2-hydroxyethyl)-1-piperazineethanesulfonic acid) (HEPES), sodium chloride (NaCl), magnesium chloride (MgCl2), potassium chloride (KCl), calcium chloride dihydrate (CaCl2·2H2O), glutaraldehyde (GA) solution (25% (v![[thin space (1/6-em)]](https://www.rsc.org/images/entities/char_2009.gif) :v) in H2O, Grade I), streptavidin, bovine serum albumin (BSA), biotin-BSA and human serum were bought from Sigma-Aldrich (Gillingham, UK). The oligonucleotides – oligo 1 (non-specific aptamer, 5′-biotin (C6)-ACT TCA GTG AGT TGT CCC ACG GTC GGC GAG TCG GTG GTA G-3′) and oligo 2 (TBA, 5′-biotinTEG-TTT TTG GTT GGT GTG GTT GG-3′) used in this work were bought from Integrated DNA Technologies (Leuven, Belgium).
:v) in H2O, Grade I), streptavidin, bovine serum albumin (BSA), biotin-BSA and human serum were bought from Sigma-Aldrich (Gillingham, UK). The oligonucleotides – oligo 1 (non-specific aptamer, 5′-biotin (C6)-ACT TCA GTG AGT TGT CCC ACG GTC GGC GAG TCG GTG GTA G-3′) and oligo 2 (TBA, 5′-biotinTEG-TTT TTG GTT GGT GTG GTT GG-3′) used in this work were bought from Integrated DNA Technologies (Leuven, Belgium).
LW fabrication
Glass slides were cut into ∼25.4 × 25.4 mm squares and cleaned in Decon 90, water and ethanol for 30 min each in an ultrasonic bath. The chitosan waveguide was fabricated by spin coating a 1% (w/v) polymer solution in 0.1 M acetic acid at 900 rpm, drying for 3 min, followed by overnight incubation with HEPES buffer (100 mM, pH 7.4) and subsequent treatment with 100 μM RB4 dye for 5 min.Immobilisation method
Solutions were either pumped at 118 μL min−1 with a peristaltic pump (Minipuls® 3, Gilson, Bedfordshire, UK) or manually injected into the flow channel using a micropipette. GA and streptavidin was prepared in 100 mM HEPES buffer, pH 7.4. All other solutions were prepared in a binding buffer containing 100 mM HEPES with salts (100 mM NaCl, 5 mM KCl, 2 mM MgCl2 and 1 mM CaCl2, pH 7.4).The chitosan waveguide was reacted with 0.2% (v:v) GA for 1 h followed by a buffer wash. Subsequently, ∼20 μL of 83 μM streptavidin was injected into the flow channel and allowed to react for 2 h. After HEPES and binding buffer washes, 75 μM BSA and 150 nM biotin-BSA were introduced to verify that free aldehydes had been reacted with streptavidin. Binding buffer washes were performed between each solution.
Varying concentrations of oligo 2 were applied to the chitosan waveguides with covalently attached streptavidin. A buffer wash was then performed and the shift in resonance angle to 100 nM thrombin, which was flowed over the LW for 3 h, was measured to determine the optimum concentration of the oligonucelotide.
Sensing using the LW aptasensor
Upon optimising the immobilisation conditions, a calibration curve was determined by real-time monitoring of the resonance angle for thrombin of concentrations between 0 nM and 1 μM. The calibration curve was used to estimate the LOD of the aptasensor and concentration of thrombin in spiked serum samples. Each concentration of thrombin was applied on a separate waveguide and repeated three times using different chitosan waveguides. A control experiment was conducted by using a non-specific sequence (oligo 1) followed by 1 μM thrombin with buffer washes after each stage. The cross-reactivity of oligo 2 to BSA was also determined. Finally, a commercially available serum sample was diluted with buffer in the ratio of 1:9. The resulting 10% (v:v) serum sample was spiked with 50 nM thrombin and analysed using the LW aptasensor.
Instrumentation
The instrumentation used to test the porosity of hydrogels and performance of waveguide biosensors has been previously described.4–6 Briefly, a BK7 equilateral prism (Qioptic Photonics, Denbighshire, UK) was used to couple light in and out of the hydrogel waveguide (Fig. 1). The light source and the detector were mounted on rails connected to goniometers to allow radial and angular freedom respectively (Fig. 1(b)). The light source was a 650 nm resonant cavity LED (RCLED) (PR65-F1P0T, Roithner LaserTechnik, Vienna, Austria). The output of the RCLED was collimated and subsequently expanded to 25 mm diameter then passed through a 63 mm focal length cylindrical lens to form a wedge beam to probe the LW with a range of angles of incidence simultaneously. The output was recorded using a 10.55 Mpixel CMOS camera (UI-1492LE, IDS Imaging, Obersulm, Germany), which allowed a 4.59 mm wide section of the LW to be imaged.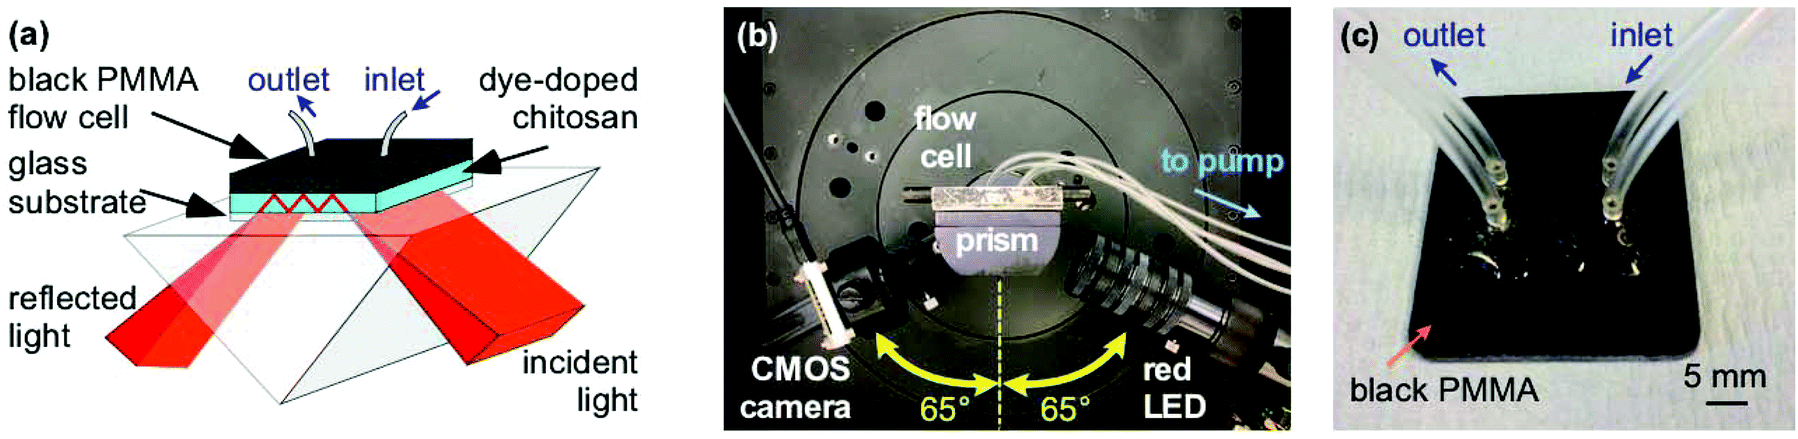 | ||
| Fig. 1 (a) Schematic and (b) photo of optical setup with microfluidic flow cell showing the red LED light source and CMOS camera for detection set up at 65° with respect to normal to the base of the prism. (c) Photo of PMMA flow cell with inlet and outlet tubing. | ||
The flow cell was CNC machined from 3 mm thick black PMMA forming two recessed cavities each 3 mm wide, 14 mm long and 0.2 mm deep and surrounded by a groove 1 mm wide and 0.75 mm deep in which was mounted an O-ring (Fig. 1(c)). The plate was placed on the LW biosensor and held in place using an aluminium plate.
The refractive index of the solutions was measured using an Abbé refractometer (Hilger & Watts, UK) with an accuracy of ±1 × 10⁻⁴ RIU.
Results and discussion
Preliminary studies
Leaky waveguides confine light by TIR at the waveguide–cover interface and by Fresnel reflection at the waveguide–substrate interface. To achieve this, the waveguide real refractive index must be intermediate between those of the substrate (higher index) and cover layer (lower index). Because the reflection coefficient at the waveguide–substrate interface is less than unity, light will leak from a mode in the waveguide. This process is reversible, allowing light to be coupled into the waveguide at an angle where the propagation constants in the waveguide and substrate match. This condition is called a waveguide resonance, and the angle at which it occurs is a resonance angle. A LW may exhibit multiple modes, and hence multiple resonance angles, where the transverse resonance condition is met. We have derived the mode equation and the reflectivity at resonance angles elsewhere, and shown that the mode index must lie between the real refractive indices of the substrate and cover layer.4 In the absence of losses by absorption or scattering, the reflectivity of a LW above the critical angle, where the resonance angles occur, is unity. This means that to observe waveguide modes we need to introduce a mechanism to change the reflectivity of the LW for each waveguide mode. A simple way to do this is to introduce loss into the waveguide by immobilizing a dye that absorbs strongly at the wavelength used. In the work reported here, the wavelength was 650 nm and the dye reactive blue 4 was used to introduce loss. The introduction of the dye causes the reflectivity to decrease from unity around the resonance angle(s). In this case, the waveguide was sufficiently thin that only a single mode could propagate, leading to a single dip in reflectivity.The resonance angle in the substrate is given by:
 | (1) |
 | (2) |
The resonance angle was tracked using the dip in reflectivity introduced by the RB4 dye immobilised in the waveguide, which changes angle as the effective index of the waveguide changes as a result of binding of species to chitosan. From the depth of the reflectivity dip, the concentration of RB4 in the waveguide was estimated to be ∼3 mM, which amounts to about 5% of the free amines. Because of the difficulty of measuring the thickness of a wet chitosan film, we have previously used transfer matrix modelling along with simplex optimization to estimate both the thickness and real refractive index of the film.32 For a film dried for 3 minutes before rehydration, as used in this work, the thickness was 1.54 μm and refractive index 1.3451, while the total refractive index sensitivity was 122.6° RIU−1 and the evanescent field sensitivity was 25.2° RIU−1. Using these parameters, the refractive index sensitivity (RIS) of the mesoporous chitosan leaky waveguide is theoretically ∼5 times higher than a non-porous waveguide of the same refractive index, but experimentally for 400 kDa PEG was found to be ∼9 times higher.32 This is because the mesoporous waveguide allows species to diffuse into the waveguide where the majority of the optical mode is confined, while the non-porous waveguide only allows interaction with the small fraction of the light in the evanescent field above the waveguide.
The chitosan waveguide was flushed with an excess of GA, which is a very reactive cross-linker. Thus, the free amines in chitosan were readily converted to aldehyde groups, as verified by a shift of ∼0.43° in the resonance angle (Fig. 2). GA tends to self-polymerise resulting in a continuous drift in the resonance angle and the reaction was terminated by a HEPES buffer wash after ∼1 h. A shift of ∼1.21° in the resonance angle was observed after 2 h reaction between 83 μM streptavidin and GA activated waveguide followed by a HEPES buffer wash. Modelling of a streptavidin monolayer of thickness 4.55 nm and refractive index 1.469539 on the surface of a chitosan waveguide of thickness 1.54 μm and refractive index 1.345132 gave a resonance angle shift of only 0.042°, much lower than the observed shift of ∼1.21°, indicating that the streptavidin was not just immobilised on the surface of the waveguide but throughout the bulk. Similarly, the resonance angle change when binding the oligos to streptavidin was consistent with their presence throughout the bulk of the hydrogel. The slight increase in the resonance angle on switching from HEPES to binding buffer was attributed to the higher refractive index of the latter than former. The change in the resonance angle because of buffer washes after streptavidin immobilisation was minimal suggesting that the protein was covalently bound to the waveguide. In comparison, electrostatic interaction between streptavidin and pristine chitosan LW only resulted in a shift of ∼0.21° in the resonance angle after buffer washes (inset (i) in Fig. 2). Inset (ii) in Fig. 2 also shows that the change in the resonance angle as a result of BSA following streptavidin immobilisation and buffer wash was minimal suggesting that a majority of free aldehydes were used up during streptavidin immobilisation. Additionally, biotin-BSA resulted in a shift of ∼0.49° after a buffer wash, implying that the binding sites were available in the immobilised streptavidin.
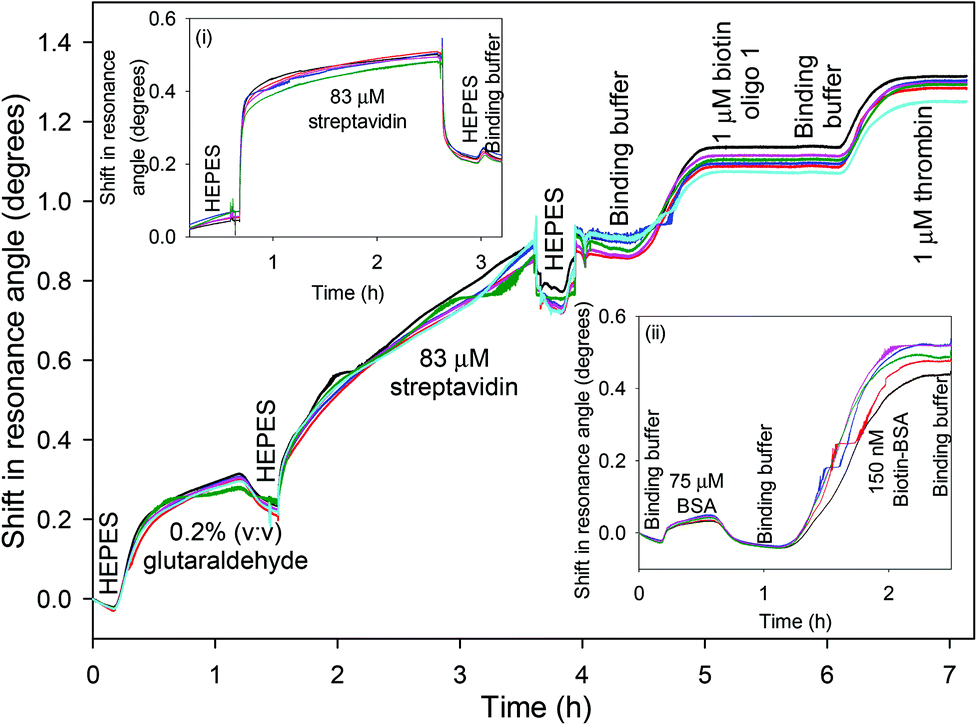 | ||
| Fig. 2 Shift in resonance angle for GA and streptavidin (insets (i) and (ii) show the response to the immobilisation of streptavidin via electrostatic interactions and effect of BSA and biotin-BSA on chitosan LW with covalently attached streptavidin respectively). | ||
Fig. 3(a) shows the scaled response of the LW when different concentrations of oligo 2 were bound to the streptavidin immobilised in the chitosan waveguide. The response to the aptamer was scaled by taking the ratio of the shifts caused by the aptamer and streptavidin to account for chip-to-chip variations. Similarly, the thrombin response was scaled by taking the ratio of the shifts caused by thrombin and aptamer. As shown in Fig. 3(a), the resonance angle and hence the amount of the aptamer bound to the waveguide increased as the concentration of oligo 2 was changed from 0.1 μM to 1 μM. The change in the amount of the bound aptamer was, however, significantly lower on increasing the concentration of oligo 2 from 1 μM to 2 μM. Fig. 3(b) shows that the response of the LW to thrombin was highest for the chitosan waveguide prepared using 2 μM oligo 2, although only slightly higher than the response at 1 μM. For this reason, 1 μM oligo was used for subsequent work. Additionally, Fig. 3(b) illustrates that the LW response for 100 nM thrombin reached an equilibrium after ∼3 h for oligo 2 concentrations higher than 0.5 μM. The equilibrium response time increased as the concentration of analyte decreased, and is a characteristic of all types of biosensors where the transport is by diffusion.40 Such a slow response time is not ideal for practical applications, but this limitation can be addressed by using either an initial rate of response or active sample transport or combination of both. Changes in the bulk index when switching from buffer to sample can be significantly reduced by internal referencing using a stacked waveguide sensor where one waveguide layer responds to the analyte and the other acts as a reference.41
 | ||
| Fig. 3 Scaled response of the LW for (a) aptamer and (b) thrombin incubated for different times on the LW prepared using different concentrations of oligo 2 and 100 nM thrombin was used. | ||
Analysis of TBA and its target
The chitosan waveguide was activated using 0.2% (v:v) GA, 83 μM streptavidin and 1 μM aptamer for all subsequent studies. The shift in resonance angle versus time for different concentrations of thrombin is provided in Fig. 4. The initial rate of the LW response was calculated by fitting the shift in resonance angle for each concentration of thrombin over the first three hours to a straight line and determining its slope and correlation coefficient. It was found that the highest correlation (highest linearity) occurred at between 3 and 6 minutes. For this reason, the initial rate at 5 minutes was chosen, with the result shown in the inset in Fig. 4. The relationship between the rate of change of resonance angle (dθ/dt, deg min−1) versus thrombin concentration (cth, nM) is given by dθ/dt = 1.49 × 10⁻⁵ × cth − 3.96 × 10⁻⁵ with r2 of 0.989. Based on this, the LOD of the LW aptasensor for thrombin was estimated to be ∼22 nM. The LOD is the thrombin concentration corresponding to the yintercept plus 3 times the standard deviation on the yintercept. The LW aptasensor was shown to be suitable to measure the concentration of thrombin up to 1 μM. The dynamic range is limited by a combination of factors including dissociation contact between TBA and thrombin and total number of TBA immobilised in the chitosan waveguide.
 | ||
| Fig. 4 Shift in resonance angle versus time for different concentrations of thrombin (inset shows the initial rate over the first 5 min versus thrombin concentration). | ||
The LOD of LW for thrombin can be improved by three orders of magnitude using integrated isoelectric focusing at a pH step as shown by us recently.42 The preconcentration of analytes before detection not only improves the LOD, but also reduces the assay time. LW is a completely dielectric structure and hence its integration with electrokinetic sample processing is much easier than other label-free biosensors with continuous metal layers such as surface plasmon resonance (SPR) and metal-clad leaky waveguide (MCLW). Additionally, we have developed a photofunctionalisable hydrogel43 where amine groups can be selectively freed using widely available 405 nm light sources. These freed amines groups can then be reacted with aptamers with selectivity towards different analytes and LW biosensor can be operated in imaging mode for multiplexed sensing. This implies that the multiplexed analysis is much easier to implement using LW aptasensor than point based biosensors such as field effect transistors (FETs), quartz crystal microbalance (QCM) and whispering gallery mode (WGM) resonators. Although electrochemical biosensors have been reported to provide a LOD of 10 pM, this was at the expense of an assay time of 30 min to 1 h.
Fig. 5(a) and (b) show the response of the LW sensors functionalised with oligo 2 and oligo 1 respectively to 1 μM thrombin. The sensor functionalised with oligo 2 showed a persistent shift of ∼0.2°, while the sensor with oligo 1 showed a transient shift of ∼0.04° which rapidly returned to baseline. Fig. 5(c) shows the response of the LW functionalised with oligo 2 to 100 nM to thrombin and BSA. The resonance angle shift was significantly higher for thrombin than BSA when the two protein solutions were flowed over the LW sensor, and the BSA shift returned to baseline after a buffer wash. This shows that BSA was weakly non-specifically adsorbed, and hence confirms that the aptamer is selective towards thrombin and has minimal cross-reactivity towards BSA.
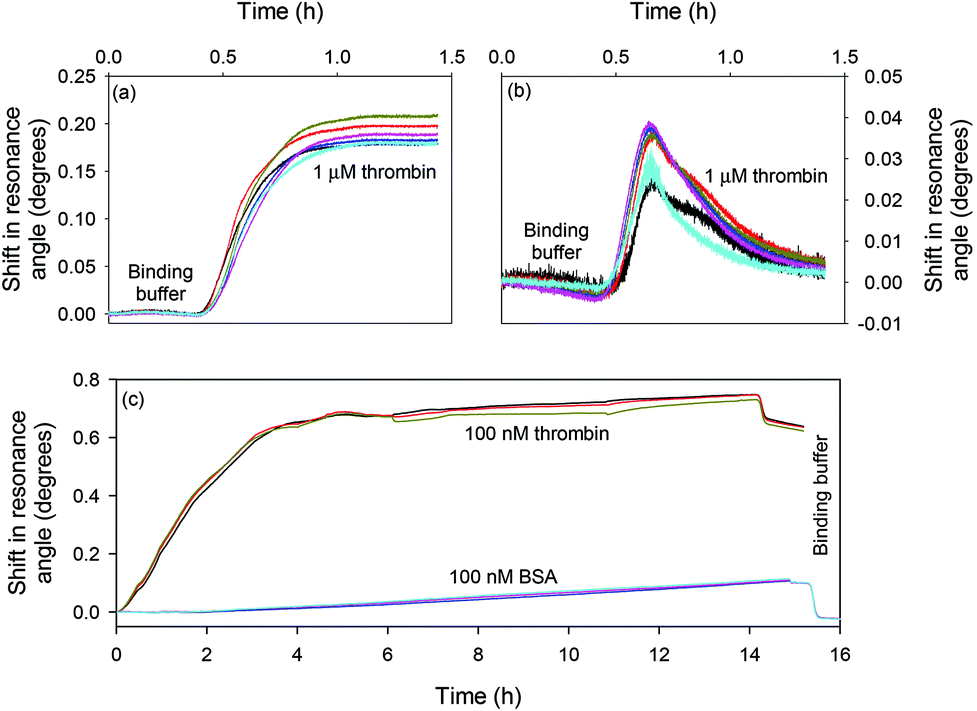 | ||
| Fig. 5 Shift in resonance angle versus time for a LW functionalised with (a) oligo 2 and (b) oligo 1 and reacted with 1 μM thrombin and (c) oligo 2 and reacted with 100 nM thrombin and BSA. | ||
Analysis of thrombin in spiked serum
The LW aptasensor was also tested with a serum sample diluted to 10% and spiked with 50 nM thrombin (as shown in Fig. 6). Initially, unspiked diluted serum was passed over the sensor for two hours, followed by diluted serum spiked with 50 nM thrombin. An initial rapid change in resonance angle was observed with the unspiked serum as a result of the change in bulk refractive index of the solution. The spiked sample showed a much slower change in resonance angle as thrombin bound to the aptamer. Taking the initial rate over the first five minutes of 6.46 × 10⁻⁴ degrees per min and using the calibration curve from the inset in Fig. 4, the thrombin concentration in the spiked serum was estimated to be 46.1 ± 4.6 nM at the 95% confidence level.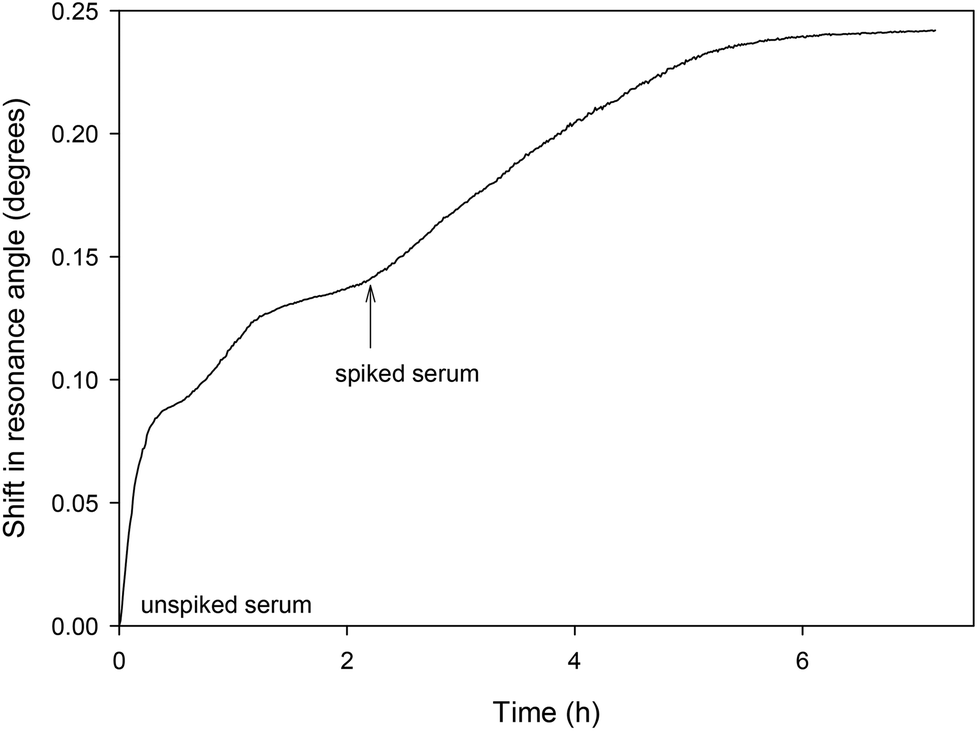 | ||
| Fig. 6 Shift in resonance angle versus time for a LW sensor functionalised with oligo 2 and reacted with serum diluted to 10% and spiked with 50 nM thrombin. | ||
To further improve the potential of LW biosensor for PoC analysis, we have been developing a 3D printed instrument with dimensions and weight of ∼16 × 13 × 11 cm and ∼800 g respectively. Future work will focus on testing the LW aptasensor using the portable 3D printed instrument to facilitate PoC analysis.
Conclusions
An aptasensor based on a leaky waveguide (LW) has been demonstrated for the first time using the serine protease thrombin, for which antibodies have limited applicability as bioreceptors. There is limited information on the effects of immobilising aptamers in hydrogels, which this work has addressed using TBA/thrombin as a model system. The TBA was immobilised in the entire volume of a mesoporous waveguide made of chitosan. The aptamer's affinity for thrombin was confirmed and there was no cross-reactivity towards BSA. Using the initial binding rate over the first 5 min, the limit of detection of the LW aptasensor for thrombin was ∼22 nM. Using the calibration established in buffer, the concentration in a serum sample spiked with 50 nM thrombin was determined to be 46.1 ± 4.6 nM. The LW aptasensor is an advance over currently used clotting and chromogenic/fluorogenic assays because it is less susceptible to interferences in serum and whole blood. The LW aptasensor is easy to fabricate using solution processing methods and the read-out instrumentation comprised of affordable and off the shelf components. This ease of fabrication lends itself to low cost single use sensors, although device to device reproducibility would have to be investigated. The use of aptamers opens up the possibility of long shelf life dry storage of sensors with rapid rehydration at the point of use.Conflicts of interest
There are no conflicts of interest.Acknowledgements
Nasser A. Alamrani acknowledges the University of Tabuk (Saudi Arabia) for supporting his PhD scholarship.References
- A. Tripodi, V. Chantarangkul and P. M. Mannucci, Br. J. Haematol., 2009, 147, 77–82 CrossRef PubMed.
- J. Kintigh, P. Monagle and V. Ignjatovic, Res. Pract. Thromb. Haemostasis, 2018, 2, 42–48 CrossRef CAS PubMed.
- R. Gupta and N. J. Goddard, Analyst, 2013, 138, 1803–1811 RSC.
- R. Gupta and N. J. Goddard, Sens. Actuators, B, 2017, 244, 549–558 CrossRef CAS.
- R. Gupta and N. J. Goddard, Analyst, 2017, 142, 169–176 RSC.
- R. Gupta and N. J. Goddard, Sens. Actuators, B, 2016, 237, 1066–1075 CrossRef CAS.
- R. Gupta, B. Bastani, N. J. Goddard and B. Grieve, Analyst, 2013, 138, 307–314 RSC.
- Q. W. Zhang, Y. Wang, A. Mateescu, K. Sergelen, A. Kibrom, U. Jonas, T. X. Wei and J. Dostalek, Talanta, 2013, 104, 149–154 CrossRef CAS PubMed.
- Y. Wang, C. J. Huang, U. Jonas, T. X. Wei, J. Dostalek and W. Knoll, Biosens. Bioelectron., 2010, 25, 1663–1668 CrossRef CAS PubMed.
- J. Li, X. Yu, A. Herberg and D. Kuckling, Macromol. Rapid Commun., 2018, 39, 1800674 Search PubMed.
- M. D. Rand, J. B. Lock, C. vantVeer, D. P. Gaffney and K. G. Mann, Blood, 1996, 88, 3432–3445 CAS.
- M. A. Shuman and P. W. Majerus, J. Clin. Invest., 1976, 58, 98–1100 CrossRef PubMed.
- S. D. Jayasena, Clin. Chem., 1999, 45, 1628–1650 CAS.
- S. P. Song, L. H. Wang, J. Li, J. L. Zhao and C. H. Fan, TrAC, Trends Anal. Chem., 2008, 27, 108–117 CrossRef CAS.
- S. Y. Toh, M. Citartan, S. C. B. Gopinath and T. H. Tang, Biosens. Bioelectron., 2015, 64, 392–403 CrossRef CAS PubMed.
- C. Tuerk and L. Gold, Science, 1990, 249, 505–510 CrossRef CAS PubMed.
- A. D. Ellington and J. W. Szostak, Nature, 1990, 346, 818–822 CrossRef CAS PubMed.
- C. C. Ong, S. C. B. Gopinath, L. W. X. Rebecca, V. Perumal, T. Lakshmipriya and M. S. M. Saheed, Int. J. Biol. Macromol., 2018, 116, 765–773 CrossRef CAS PubMed.
- L. Wen, L. P. Qiu, Y. X. Wu, X. X. Hu and X. B. Zhang, Sensors, 2017, 17, 1736 CrossRef PubMed.
- M. Terracciano, I. Rea, N. Borbone, R. Moretta, G. Oliviero, G. Piccialli and L. De Stefano, Molecules, 2019, 24, 2216 CrossRef PubMed.
- Y. L. Sun, Y. H. Wang, J. B. Li, C. F. Ding, Y. N. Lin, W. Y. Sun and C. N. Luo, Talanta, 2017, 174, 809–818 CrossRef CAS PubMed.
- G. Bayramoglu, V. C. Ozalp, M. Oztekin, U. Guler, B. Salih and M. Y. Arica, Talanta, 2019, 191, 59–66 CrossRef CAS PubMed.
- Y. Q. Yu, H. Y. Zhang, Y. Q. Chai, R. Yuan and Y. Zhuo, Biosens. Bioelectron., 2016, 85, 8–15 CrossRef CAS PubMed.
- H. J. Chen, R. L. C. Chen, B. C. Hsieh, H. Y. Hsiao, Y. Kung, Y. T. Hou and T. J. Cheng, Biosens. Bioelectron., 2019, 131, 53–59 CrossRef CAS PubMed.
- D. D. Sun, L. P. Sun, T. Guo and B. O. Guan, J. Lightwave Technol., 2019, 37, 2756–2761 Search PubMed.
- A. Gosai, B. S. H. Yeah, M. Nilsen-Hamilton and P. Shrotriya, Biosens. Bioelectron., 2019, 126, 88–95 CrossRef CAS PubMed.
- H. Kim, Z. F. An and C. H. Jang, Microchem. J., 2018, 141, 71–79 CrossRef CAS.
- S. W. Bae, J. S. Lee, V. M. Harms and W. L. Murphy, Macromol. Biosci., 2019, 19, 1800353 CrossRef PubMed.
- Z. Zhu, C. C. Wu, H. P. Liu, Y. Zou, X. L. Zhang, H. Z. Kang, C. J. Yang and W. H. Tan, Angew. Chem., Int. Ed., 2010, 49, 1052–1056 CrossRef CAS PubMed.
- X. J. He, B. Weiz and Y. L. Mi, Chem. Commun., 2010, 46, 6308–6310 RSC.
- X. Q. Wang and X. G. Wang, Chem. Commun., 2013, 49, 5957–5959 RSC.
- R. Gupta, N. Alamrani, G. M. Greenway, N. Pamme and N. J. Goddard, Anal. Chem., 2019, 91, 7366–7372 CrossRef CAS PubMed.
- C. Daniel, Y. Roupioz, D. Gasparutto, T. Livache and A. Buhot, PLoS One, 2013, 8, 75419 CrossRef PubMed.
- S. Balamurugan, A. Obubuafo, S. A. Soper and D. A. Spivak, Anal. Bioanal. Chem., 2008, 390, 1009–1021 CrossRef CAS PubMed.
- J. G. Walter, O. Kokpinar, K. Friehs, F. Stahl and T. Scheper, Anal. Chem., 2008, 80, 7372–7378 CrossRef CAS PubMed.
- V. Ostatna, H. Vaisocherova, J. Homola and T. Hianik, Anal. Bioanal. Chem., 2008, 391, 1861–1869 CrossRef CAS PubMed.
- R. J. White, N. Phares, A. A. Lubin, Y. Xiao and K. W. Plaxco, Langmuir, 2008, 24, 10513–10518 CrossRef CAS PubMed.
- J. Chilwell and I. Hodgkinson, J. Opt. Soc. Am. A, 1984, 1, 742–753 CrossRef.
- R. Reiter, H. Motschmann and W. Knoll, Langmuir, 1993, 9, 2430–2435 CrossRef CAS.
- M. J. Eddowes, Biosensors, 1987, 3, 1–15 CrossRef CAS PubMed.
- R. Gupta and N. J. Goddard, A novel optical biosensor with internal referencing, Freiburg, Germany, 2013 Search PubMed.
- N. J. Goddard and R. Gupta, Sens. Actuators, B, 2019, 127063 CrossRef CAS.
- A. K. Pal, E. Labella, N. J. Goddard and R. Gupta, Macromol. Chem. Phys., 2019, 220, 1900228 CrossRef.
| This journal is © The Royal Society of Chemistry 2019 |