In vitro study of a pH-sensitive multifunctional doxorubicin–gold nanoparticle system: therapeutic effect and surface enhanced Raman scattering
Kate Y. J. Leeb,
Yiqing Wang*ab and
Shuming Nie*ab
aDepartment of Biomedical Engineering, Nanjing University, 1110 Science Building, 22 Hankou Road, Nanjing, Jiangsu, China 210009. E-mail: wangyiqing@nju.edu.cn; Tel: +86-25-83593263
bDepartments of Biomedical Engineering, Emory University and Georgia Institute of Technology, 1760 Haygood Drive, Room E116, Atlanta, Georgia, USA 30322. E-mail: snie@emory.edu; Tel: +1-404-712-8595
First published on 21st July 2015
Abstract
We report the development and characterization of a multifunctional drug delivery system (Au–dox–PEG) for the treatment and SERS spectroscopic detection of tumors. Doxorubicin, a therapeutic agent and a SERS tag, was chemically conjugated to gold nanoparticles via a pH-sensitive hydrazone linker, and then PEG was added to develop Au–dox–PEG. The doxorubicin occupied a maximum of 20% of the total surface area of the gold nanoparticles which resulted in colloidal stability. SERS spectra were measured for non-aggregated Au–dox–PEG using near-infrared wavelength radiation, and the doxorubicin release was time and pH dependent. Consistency in the release profile and in vitro cell viability results supports the efficacy of the Au–dox–PEG system. Thus, the development of the Au–dox–PEG multifunctional system raises exciting opportunities for the simultaneous spectroscopic detection and therapy of tumors in the future.
Introduction
Cancer nanotechnology has gained a great amount of interest in recent years.1–8 Adopting a size scale equivalent for biological molecules, nanometer-scale particles (5–100 nm in diameter) possess a large surface area for modification with targeting ligands, anticancer agents, imaging agents, and other small molecules. Due to the small size, there is an increased uptake of the nanoparticles by cells,9 ultimately improving the availability of the particular agent. Recently, semiconductor quantum dots5,10–12 and iron oxides13–15 have been used to detect and image tumor cells for diagnostics, whereas polymer based nanoparticles6,7,16 have been used for the treatment of cancer. Normally, tumors are characterized by a leaky vasculature and defective lymphatic drainage that results in an enhanced permeability and retention (EPR) effect.17 The EPR effect prolongs the nanoparticle residence time and also selectively “traps” nanoparticles for an improved efficacy of the therapeutic or imaging agents.Here, we report the development and characterization of a multifunctional nanoparticle consisting of PEGylated colloidal gold and an anticancer agent. The multifunctional delivery system demonstrated a therapeutic effect on tumor cells along with in vitro spectroscopic detection based on surface enhanced Raman scattering (SERS). The idea of using gold nanoparticles as carriers for drug delivery is recent.18–20 Gold nanoparticles confer several advantages such as biocompatibility21 and size-tunability (synthesizing various sizes).22 Furthermore, the chemical properties are easily altered by attaching various ligands for surface modification. Finally, due to their unique optical properties, the Raman signal from adsorbed reporter molecules can be increased up to 1014 or 1015 orders of magnitude, allowing single molecular level spectroscopic detection.1,23,24 This phenomenon, well known as SERS, is an ultra-sensitive analytical method. SERS provides the characterization and spectroscopic detection of reporter molecules and further allows for the dynamic monitoring of small chemical changes which occur at the interfaces of the gold nanoparticles.23,25
Qian, X.26 et al. reported a successful in vivo tumor detection system through SERS obtained from targeted PEGylated gold nanoparticles with a Raman tag (malachite green isothiocyanate). For our system, the Raman tag was replaced by doxorubicin, which served a dual function of being a chemotherapeutic agent and a SERS reporter molecule. This eliminated the necessity of adding any other SERS tag, with the sole presence of doxorubicin resulting in an increased loading efficiency of the chemotherapeutic agent onto the gold surface.
Doxorubicin, an anthracycline derivative, is a commonly used chemotherapeutic agent for various malignancies such as solid tumors of the breast, esophagus, liver, and soft-tissue sarcoma.27 Despite its high anti-tumor activity, doxorubicin presents side effects by not only inducing tumor cell death but by also affecting normal, healthy cells, leading especially to irreversible cardiotoxicity.28,29 Furthermore, doxorubicin exhibits poor water solubility and a narrow therapeutic index so that it is difficult to significantly increase the dosage at the target sites.30 To overcome these side effects along with the addition of the SERS spectroscopic detective function, doxorubicin conjugate systems have been developed: doxorubicin was modified with pH-sensitive hydrazone linkers and attached to gold nanoparticles. The hydrazone linker, PDPH, was also chosen due to its pH sensitivity. The hydrazone bond is stable under neutral pH conditions, but it is cleaved under mild acidic (pH < 5) conditions, resembling the endosomal and lysosomal environments. Furthermore, a hydrazone linker provides a thiol group for the adsorption of doxorubicin onto the gold nanoparticle surface. To increase the biocompatibility and stability of the gold colloids, the resulting doxorubicin–gold conjugates were coated with PEG. This self-assembled, biocompatible model system was characterized by various techniques and the SERS signal was measured. The PEGylated drug–gold system was stable in salt solutions (0.5 M NaCl solution and 1× phosphate buffered saline) and released doxorubicin in a pH and time dependent manner. Also, the resulting drug–gold model system not only demonstrated a SERS signal but also had a similar cytotoxicity effect on tumor cells compared to an equivalent concentration of free doxorubicin. Thus, this multifunctional system raises exciting opportunities for the simultaneous spectroscopic detection and therapy of tumors in the future.
Materials and methods
Materials
Results and discussion
Characterization of the doxorubicin–gold nanoparticle system
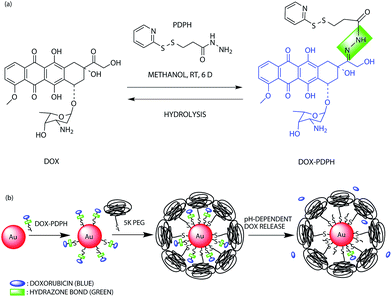
The doxorubicin–PDPH conjugate (dox–PDPH) was synthesized in methanol (Fig. 1(a)). The PDPH acts as a linker and introduces thiol functional groups to ensure the adsorption of doxorubicin onto the gold surface. Doxorubicin itself contains an amine group, but it has been reported that the bond between gold and a thiol group (∼50 kcal mol−1)32–34 is much stronger than the bond between gold and an amine group (3–6 kcal mol−1).34 The PDPH linker also contains an acid-sensitive hydrazone bond that releases chemically bound doxorubicin under slightly acidic conditions of pH ∼ 5,31,35 which resembles intracellular endosomal and lysosomal pH conditions. The doxorubicin–PDPH conjugate was water-soluble and was stable when stored at 4 °C in dimethyl sulfoxide.The concentration of dox–PDPH and of the gold nanoparticles was quantified by UV-vis spectroscopy. For dox–PDPH, a standard curve at 495 nm was created. The 60 nm gold nanoparticles had a maximum absorption peak at 531 nm and the Beer–Lambert law was used to calculate the concentration of the gold nanoparticles (extinction coefficient of 3.531 × 10¹⁰ M−1 cm−1). The UV-vis spectrum of the dox–PDPH–gold nanoparticles resembled the spectrum of the pure gold nanoparticles, and so fluorescence spectroscopy was used to further assist the analysis.
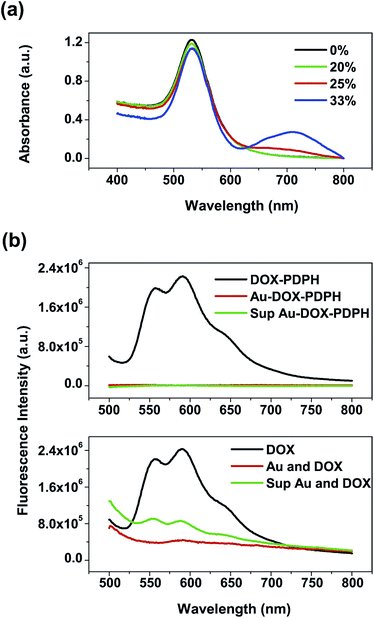
The adsorption of dox–PDPH onto gold nanoparticles was studied via UV-vis and fluorescence spectroscopy. Similar to the method used by Cheng, Y. et al., by considering a planar geometry for dox–PDPH on the gold surface and the inherent chemical bond lengths of the system, it was found that a single dox–PDPH molecule has a theoretical footprint of ∼1.08 nm2. Thus, a single 60 nm gold nanoparticle can hold 10![[thin space (1/6-em)]](https://www.rsc.org/images/entities/char_2009.gif) 513 dox–PDPH molecules for complete surface coverage. However, the experimental findings indicate that a 60 nm gold nanoparticle can only hold a maximum of ∼2147 dox–PDPH molecules and still be colloidally stable. This is equivalent to coating 20% of the available surface area (∼0.1 wt%) of a 60 nm gold nanoparticle. It was found that increasing the surface area coverage to 25% and furthermore to 33% resulted in aggregation of the gold nanoparticles, as indicated by a slight bump in the red-wavelength region of the UV-vis spectra (Fig. 2(a)). Thus, there is a concentration dependence of the doxorubicin coating in that dox–PDPH can occupy a maximum of 20% of the total surface area of a 60 nm gold nanoparticle. The resulting dox–PDPH–gold nanoparticle system (Au–dox) was soluble in water and was stable without any aggregation.
513 dox–PDPH molecules for complete surface coverage. However, the experimental findings indicate that a 60 nm gold nanoparticle can only hold a maximum of ∼2147 dox–PDPH molecules and still be colloidally stable. This is equivalent to coating 20% of the available surface area (∼0.1 wt%) of a 60 nm gold nanoparticle. It was found that increasing the surface area coverage to 25% and furthermore to 33% resulted in aggregation of the gold nanoparticles, as indicated by a slight bump in the red-wavelength region of the UV-vis spectra (Fig. 2(a)). Thus, there is a concentration dependence of the doxorubicin coating in that dox–PDPH can occupy a maximum of 20% of the total surface area of a 60 nm gold nanoparticle. The resulting dox–PDPH–gold nanoparticle system (Au–dox) was soluble in water and was stable without any aggregation.
Fluorescence spectra were used to further verify the adsorption of dox–PDPH onto gold. When dox–PDPH was conjugated to the gold nanoparticles in water, it was quenched on the gold surface (Fig. 2(b)). Previous studies also report the quenching of fluorescent dyes on metallic particles when they are chemisorbed onto the surface.36–38 Furthermore, fluorescence quenching on a metallic surface is observed for distances of a few nanometers,39,40 which suggests a close proximity of the doxorubicin to the gold surface from short PDPH linkers.
When Au–dox was centrifuged, the supernatant (sup) did not contain any free doxorubicin (Fig. 2(b)). In contrast, when the equivalent concentration of pure doxorubicin was added to the same amount of gold nanoparticles in water, the fluorescence spectra (Fig. 2(b)) indicate that the doxorubicin was partially quenched and that free doxorubicin was detected in the supernatant. Thus, this indicates that dox–PDPH is completely bound onto the gold surface. A measurable change in the fluorescence intensity resulted from the dynamic displacement of the adsorbed citrate on gold nanoparticles by dox–PDPH. We believe that dox–PDPH formed a covalent bond with the gold surface via the thiol groups from the PDPH linkers, or was chemisorbed, whereas the pure doxorubicin was loosely bound onto the gold surface through weak electrostatic interactions between the positively-charged amine group of doxorubicin and the negatively-charged gold nanoparticle, or was physisorbed.41
Characterization of the PEGylated doxorubicin–PDPH–gold nanoparticle system
PEG is commonly used in biomedical applications to increase solubility in water and to enhance the biocompatibility of nanoparticles. PEG provides colloidal stability for the Au–dox system in that PEG protects the gold nanoparticles from physiological conditions and prevents aggregation.42,43 PEG also serves as a protective barrier for the bound dox–PDPH on the gold surface. Furthermore, PEG reduces the adsorption of cellular proteins and increases the circulation time of nanoparticles.44To find the optimum PEG density for colloidal gold stability, DLS and zeta potential measurements were used. After subtracting the gold surface area (20%) occupied by dox–PDPH, the freely available surface area was coated with various concentrations of PEG. As we increased the PEG concentration, the saturation point was reached for both the DLS and zeta potential measurements (Table 1).
For the DLS measurements, Au–dox–PEG kept increasing in size until it reached ∼75 nm. As more PEG was added to Au–dox, the PEG initially binds in a mushroom conformation and then changes its conformation to a brush mode for full coverage.45,46 Mushroom mode is characterized by a low surface grafting density and the polymers tend to “lie” close to the surface so that multiple points of a single polymer are covering the surface. On the other hand, the brush conformation is characterized by a high surface grafting density and the polymers tend to “stand up” so that each polymer is attached by a single point on the surface. Thus, as the conformation changes from mushroom to brush modes, the nanoparticle size will increase and the size will stop increasing when all the anchoring sites on the gold surface are saturated. For the zeta potential measurements, Au–dox–PEG became more positive in charge as more PEG was added to the system. PEG has a neutral charge and gold nanoparticles have a negative charge. As more PEG is added to Au–dox, the negative charge of the gold nanoparticles is shielded and offset by more of the neutral charge of PEG. Both the DLS and zeta potential measurements agreed the saturation PEG value to be between 100% and 150% coverage of the freely available surface area. This saturation PEG value resulted in a PEG footprint of ∼0.35 nm2, which is consistent with the literature footprint value.47 This also supports our dox–PDPH footprint, indicating that it is a good approximation for the 60 nm gold nanoparticles. Centrifuging Au–dox–PEG did not affect the values of DLS and zeta potential. The findings of the DLS and zeta potential measurements were supported by a salt stability test which showed that fully PEGylated Au–dox–PEG was stable in a 1× PBS and 0.5 M NaCl solution (data not shown).
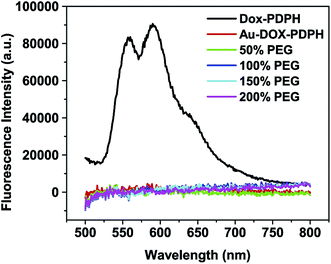
Besides the Au–dox–PEG colloidal stability, we wanted to ensure that the bound dox–PDPH was not affected by the addition of PEG. After conjugating dox–PDPH onto gold, various concentrations of PEG were added to the Au–dox and then fluorescence measurements were taken. The fluorescence spectra (Fig. 3) indicate that the addition of PEG, especially an excess amount of PEG, did not affect the bound dox–PDPH and there was no detectable replacement of the bound dox–PDPH. The Au–dox–PEG fluorescence spectra overlap with the Au–dox fluorescence spectrum.
If there was any replacement of the bound dox–PDPH, there would be an increase in the fluorescence intensity due to the presence of free doxorubicin in the Au–dox–PEG solution. As seen in Fig. 2(b), when free doxorubicin is present in the mixture of gold nanoparticles, the fluorescence of the free doxorubicin is not completely quenched by the gold. Thus, an increase in the concentration of free doxorubicin in solution will result in an increase in the overall fluorescence intensity.
Surface enhanced Raman scattering (SERS) and doxorubicin
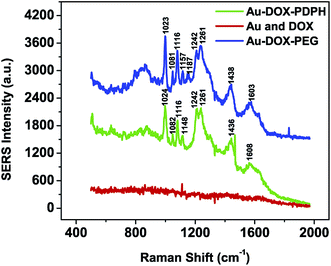
When 20% of the gold surface was covered by dox–PDPH, a SERS signal was present for both Au–dox and Au–dox–PEG (Fig. 4). The doxorubicin SERS spectrum was characterized by major peaks at 1242, 1261, 1438, and 1603 cm−1 for the Au–dox–PEG system, where the Raman shift (cm−1) values were consistent with those in previous studies.48,49 However, when the equivalent concentration of free doxorubicin was added to the gold nanoparticles, no SERS signal was present. Thus, in contrast to physisorbed free doxorubicin, only covalently tethered dox–PDPH exhibits SERS for non-aggregated gold nanoparticles. SERS is also distance dependent so that SERS is only present when a SERS tag is placed within a few nanometers of a metallic surface.50,51 For Au–dox, the doxorubicin is conjugated via a PDPH linker (<1 nm) to the gold surface, which is well within the specification to exhibit SERS.It is important to note that the doxorubicin SERS spectra (Fig. 4) resulted from colloidally stable singlets of Au–dox and Au–dox–PEG. Furthermore, the doxorubicin was covalently bound to the gold surface via an acid-sensitive linker, thus resulting in fluorescence quenching. Previous research has demonstrated the SERS effect for a mixture of free, unmodified doxorubicin and aggregated metallic sols or films.48,52–54 The metallic sols were aggregated by salts or DNA complexation and the metallic surfaces were modified to trap doxorubicin, inducing SERS.
The ability to induce SERS for Au–dox–PEG provides several advantages. First, doxorubicin itself can serve as a SERS tag for the spectroscopic detection of tumors. SERS utilizes the intrinsic SERS of a bound molecule, mostly with delocalized pi electrons, on a metallic particle and it does not require any labeling.25 The Au–dox–PEG SERS spectroscopy was performed with a 785 nm laser, allowing a near-infrared (NIR) window of detection for the SERS tag for reduced in vivo background noise.55 Combining the enhanced permeability and retention (EPR) effect of tumor cells and a NIR window of detection, Au–dox–PEG has the potential to spectroscopically locate tumor cells. Second, in conjunction with UV-vis and fluorescence spectra, the SERS spectrum of Au–dox–PEG provides an additional piece of evidence to support the chemisorption of dox–PDPH onto the gold surface. Third, the SERS spectrum of Au–dox–PEG can be used for real-time monitoring of doxorubicin release. As shown in Fig. 4, non-covalently bound free doxorubicin does not exhibit SERS. This indicates that when the hydrazone bond from PDPH is cleaved to release doxorubicin into the surroundings, there will be a decrease in the SERS intensity over time.
pH dependent release study of doxorubicin
Fig. 5 shows the pH-dependent release profile of doxorubicin linked via the hydrazone bond of PDPH. For Au–dox, ∼80% and ∼20% of the bound doxorubicin were released at pH 4 and pH 7.4 in 24 hours, respectively. More doxorubicin was released over time, especially for pH 4 conditions, which led to four times more doxorubicin having been released at the end of 96 hours for pH 4 conditions compared to that of neutral conditions. Previous studies have also reported the increased hydrolysis of hydrazone bonds and the rapid release of doxorubicin in acidic conditions compared to neutral conditions.31,56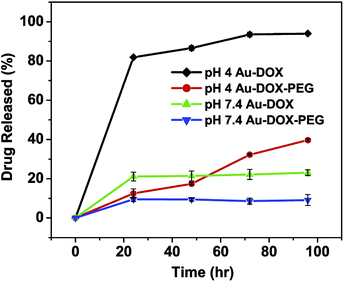 | ||
| Fig. 5 pH-dependent doxorubicin release from Au–dox and Au–dox–PEG under acidic (pH = 4) and neutral conditions (pH = 7.4) over time (24, 48, 72 and 96 h). | ||
The Au–dox–PEG system also demonstrated the pH-triggered release of doxorubicin, but there was delayed release kinetics compared to Au–dox. The release profiles for pH 4 and pH 7.4 conditions were similar up to 24 h; however, at 48 h, there was a difference in the release profiles in that ∼17% and ∼9% of the bound doxorubicin were released at pH 4 and pH 7.4, respectively. At the end of 96 h, approximately four times more doxorubicin was released at the acidic pH compared to the neutral pH for Au–dox–PEG. There are two possible reasons for the delayed release of the doxorubicin: (1) is due to the diffusion barrier created by the PEG coating and (2) is due to the interactions between the polymer and the drug. The PEG chains interact with one another so that the complex is formed amongst PEG chains linked by hydrogen bonding.57 As the polymer chain length increases and more inter-polymer complexes are formed, the release rate of the drug is decreased. Also, the complexation affects the PEG conformation, giving polymer coils which provide an additional diffusion barrier for a more tortuous path for drug release.57,58 Because PEG is a hydrophilic polymer, as the hydrophobicity of the drug increases, the diffusion rate of the drug decreases.
There are several reasons why the hydrolysis of the hydrazone bonds under acidic conditions was responsible for the doxorubicin release. First, dox–PDPH was completely bound onto the gold surface (Fig. 2(b) and 3) unlike the pure doxorubicin which was mixed with gold nanoparticles. In order to observe fluorescence in the supernatant, the quenched doxorubicin on the gold surface must be cleaved away from the gold surface. Bound doxorubicin could be released via the cleavage of hydrazone bonds or the Au–S bond of the PDPH linker. However, the latter is highly unlikely due to the strong Au–S bond energy.32–34 Second, there was a highly pH-dependent drug release meaning that the doxorubicin was released at a faster rate (a four fold increase) in a pH 4 buffer than in a pH 7.4 buffer. Although the increased aqueous solubility of doxorubicin in acidic pH may contribute to doxorubicin release, the change in pH from neutral to acidic for a pH-insensitive system (micelles containing only pure doxorubicin) did not significantly increase the release rate of the drug.59–61 Thus, the hydrolysis of the hydrazone bonds is responsible for the release of the doxorubicin into the surroundings.
The pH-dependent Au–dox–PEG is an optimal system for minimizing the drug release during circulation and maximizing the drug release under the mildly acidic conditions of endosomal or lysosomal vesicles.
In vitro drug delivery study
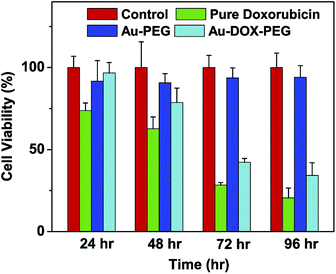
A MTT assay with a Tu686 cell line was used to study the anticancer efficacy of the Au–dox–PEG system. The cell viability was inversely related to the doxorubicin activity in that the absence or minimal efficacy of doxorubicin resulted in an increased cell survival. The cell viability for each group (pure doxorubicin, Au–PEG, and Au–dox–PEG) was compared to the control group which was free of doxorubicin. Initially, the pure doxorubicin had higher anticancer efficacy compared to Au–dox–PEG. Fig. 6 shows that the pure doxorubicin had an immediate effect during the initial 24 hour period where ∼74% of the cells were alive compared to the control. There was a gradual cell viability decrease for the pure doxorubicin treated cells so that about 21% of the cells survived at the end of the 96 hour period.According to Fig. 6, Au–dox–PEG had minimal efficacy up until 48 hours when approximately 80% of the cells had survived. Beyond 48 hours, there was a significant decrease in the cell viability for the Au–dox–PEG treated cells. Interestingly, the in vitro cell viability results were consistent with the data obtained from the release profiles (Fig. 5), indicating that 48 hours is a critical time point for the doxorubicin release from Au–dox–PEG. This time delay is advantageous for extending the in vivo circulation time of drug delivery systems in the future. Furthermore, compared to the control, the cell rounding and decrease in cell density were apparent under the microscope (data not shown) at the 48 hour time point. At the end of the 96 hour period, ∼34% of cells survived with the Au–dox–PEG treatment.
Compared to the pure doxorubicin 96 hour toxicity (∼21% cell viability), the slightly lower toxicity of Au–dox–PEG could have resulted from the slow release of the doxorubicin from within the PEG shell and the different cellular localization of the Au–dox–PEG system compared to the pure drug. However, Au–dox–PEG has the potential to significantly increase the drug accumulation and dosage at target sites by the EPR effect, eventually increasing the anticancer efficacy compared to the pure drug.
To eliminate any uncertainty stemming from gold nanoparticle toxicity itself, we used PEGylated gold nanoparticles (Au–PEG), free of doxorubicin, as another control. When the equivalent gold concentration for Au–PEG was used to treat the cells, Au–PEG had minimal toxicity on the Tu686 cells and had an average of 93% cell viability throughout the 96 hour incubation period.
Overall, Au–dox–PEG is an effective drug delivery system. Even though Au–dox–PEG has a slower release rate of doxorubicin, the gold nanoparticles will successfully deliver doxorubicin to cells to release it under acidic conditions. Au–dox–PEG’s anticancer efficacy caught up with that of pure doxorubicin after 48 hours and we observed a sustained release of doxorubicin over time.
Conclusions
Here, we have shown the feasibility of developing and characterizing a pH-sensitive multifunctional drug–gold delivery system for the treatment and SERS spectroscopic detection of tumors. The multifunctional delivery system, comprising of poly(ethylene glycol), doxorubicin, a pH-sensitive linker, and gold nanoparticles (Au–dox–PEG), successfully delivered an anticancer agent to tumor cells and displayed surface enhanced Raman scattering (SERS) for spectroscopic detection. Doxorubicin, modified with a pH-sensitive hydrazone linker and attached to gold nanoparticles, served as the therapeutic agent and the spectroscopic detection agent. There was a concentration dependence of the doxorubicin binding to the gold surface in that doxorubicin can occupy a maximum of 20% of the total surface area of a gold nanoparticle. SERS spectroscopy was performed for the non-aggregated Au–dox–PEG using near-infrared wavelength radiation. Also, Au–dox–PEG displayed pH and time dependent release of doxorubicin. The decrease in pH to acidic conditions resulted in an increased release of the doxorubicin compared to neutral conditions. It took approximately 48 hours to see a significant anticancer efficacy of Au–dox–PEG. Consistency with the release profile and the in vitro cell viability results supports the therapeutic efficacy of Au–dox–PEG. The anticancer efficacy of Au–dox–PEG caught up with that of pure doxorubicin after 48 hours when we observed the controlled release of doxorubicin over time. Thus, the development of Au–dox–PEG multifunctional nanoparticles raises exciting opportunities for the simultaneous spectroscopic detection and therapy of tumors in the future.Acknowledgements
We thank Dr Xianghong Peng for providing the Tu686 cells. We also thank Dr Xiaohua Huang for helping us with SERS measurements. We thank Jianquan Wang for text editing work. This work was supported by funds provided by GAANN fellowship and grant from the NCI Centers of Cancer Nanotechnology Excellence (CCNE) Program (U54CA119338). Y. Wang gratefully acknowledges the ‘Jiangsu Specially-Appointed Professor’ Award and start-up funding provided by Nanjing University.Notes and references
- S. M. Nie and S. R. Emory, Science, 1997, 275, 1102–1106 CrossRef CAS PubMed
.
- F. Alexis, E. M. Pridgen, R. Langer and O. C. Farokhzad, Handb. Exp. Pharmacol., 2010, 55–86 CAS
.
- N. L. Rosi and C. A. Mirkin, Chem. Rev., 2005, 105, 1547–1562 CrossRef CAS PubMed
.
- Y. W. C. Cao, R. C. Jin and C. A. Mirkin, Science, 2002, 297(5586), 1536–1540 CrossRef CAS PubMed
.
- X. H. Gao, Y. Y. Cui, R. M. Levenson, L. W. K. Chung and S. M. Nie, Nat. Biotechnol., 2004, 22(8), 969–976 CrossRef CAS PubMed
.
- V. P. Torchilin, Pharm. Res., 2007, 24(1), 1–16 CrossRef CAS PubMed
.
- R. Duncan, Nat. Rev. Cancer, 2006, 6(9), 688–701 CrossRef CAS PubMed
.
- X. M. Qian, X. H. Peng, D. O. Ansari, Q. Yin-Goen, G. Z. Chen, D. M. Shin, L. Yang, A. N. Young, M. D. Wang and S. M. Nie, Nat. Biotechnol., 2008, 26(1), 83–90 CrossRef CAS PubMed
.
- O. C. Farokhzad, S. Y. Jon, A. Khadelmhosseini, T. N. T. Tran, D. A. LaVan and R. Langer, Cancer Res., 2004, 64(21), 7668–7672 CrossRef CAS PubMed
.
- Y. Xing, Q. Chaudry, C. Shen, K. Y. Kong, H. E. Zhau, L. Wchung, J. A. Petros, R. M. O’Regan, M. V. Yezhelyev, J. W. Simons, M. D. Wang and S. Nie, Nat. Protoc., 2007, 2(5), 1152–1165 CrossRef CAS PubMed
.
- X. Y. Wu, H. J. Liu, J. Q. Liu, K. N. Haley, J. A. Treadway, J. P. Larson, N. F. Ge, F. Peale and M. P. Bruchez, Nat. Biotechnol., 2003, 21(1), 41–46 CrossRef CAS PubMed
.
- M. N. Rhyner, A. M. Smith, X. H. Gao, H. Mao, L. L. Yang and S. M. Nie, Nanomedicine, 2006, 1(2), 209–217 CrossRef CAS PubMed
.
- X. H. Peng, X. M. Qian, H. Mao, A. Y. Wang, Z. Chen, S. M. Nie and D. M. Shin, Int. J. Nanomed., 2008, 3(3), 311–321 CAS
.
- M. G. Harisinghani, J. Barentsz, P. F. Hahn, W. M. Deserno, S. Tabatabaei, C. H. van de Kaa, J. de la Rosette and R. Weissleder, N. Engl. J. Med., 2003, 348, 2491–2499 CrossRef PubMed
.
- J. R. McCarthy, K. A. Kelly, E. Y. Sun and R. Weissleder, Nanomedicine, 2007, 2(2), 153–167 CrossRef CAS PubMed
.
- E. M. Pridgen, R. Langer and O. C. Farokhzad, Nanomedicine, 2007, 2(5), 669–680 CrossRef CAS PubMed
.
- H. Maeda, J. Wu, T. Sawa, Y. Matsumura and K. Hori, J. Controlled Release, 2000, 65(1–2), 271–284 CrossRef CAS
.
- G. F. Paciotti, L. Myer, D. Weinreich, D. Goia, N. Pavel, R. E. McLaughlin and L. Tamarkin, Drug Delivery, 2004, 11(3), 169–183 CrossRef CAS PubMed
.
- Y. Cheng, A. C. Samia, J. D. Meyers, I. Panagopoulos, B. W. Fei and C. Burda, J. Am. Chem. Soc., 2008, 130(32), 10643–10647 CrossRef CAS PubMed
.
- J. D. Gibson, B. P. Khanal and E. R. Zubarev, J. Am. Chem. Soc., 2007, 129(37), 11653–11661 CrossRef CAS PubMed
.
- E. E. Connor, J. Mwamuka, A. Gole, C. J. Murphy and M. D. Wyatt, Small, 2005, 1(3), 325–327 CrossRef CAS PubMed
.
- M. C. Daniel and D. Astruc, Chem. Rev., 2004, 104(1), 293–346 CrossRef CAS PubMed
.
- K. Kneipp, H. Kneipp, I. Itzkan, R. R. Dasari and M. S. Feld, Chem. Rev., 1999, 99(10), 2957–2976 CrossRef CAS PubMed
.
- A. Campion and P. Kambhampati, Chem. Soc. Rev., 1998, 27(4), 241–250 RSC
.
- K. Kneipp, H. Kneipp, I. Itzkan, R. R. Dasari and M. S. Feld, J. Phys.: Condens. Matter, 2002, 14(18), R597–R624 CrossRef CAS
.
- X. Qian, X. H. Peng, D. O. Ansari, Q. Yin-Goen, G. Z. Chen, D. M. Shin, L. Yang, A. N. Young, M. D. Wang and S. Nie, Nat. Biotechnol., 2008, 26, 83–90 CrossRef CAS PubMed
.
- D. A. Gewirtz, Biochem. Pharmacol., 1999, 57(7), 727–741 CrossRef CAS
.
- H. G. Keizer, H. M. Pinedo, G. J. Schuurhuis and H. Joenje, Pharmacol. Ther., 1990, 47(2), 219–231 CrossRef CAS
.
- R. C. Young, R. F. Ozols and C. E. Myers, N. Engl. J. Med., 1981, 305(3), 139–153 CrossRef CAS PubMed
.
- H. Y. Fan and A. K. Dash, Int. J. Pharm., 2001, 213(1–2), 103–116 CrossRef CAS
.
- R. S. Greenfield, T. Kaneko, A. Daues, M. A. Edson, K. A. Fitzgerald, L. J. Olech, J. A. Grattan, G. L. Spitalny and G. R. Braslawsky, Cancer Res., 1990, 50(20), 6600–6607 CAS
.
- B. K. Pong, J. Y. Lee and B. L. Trout, Langmuir, 2005, 21(25), 11599–11603 CrossRef CAS PubMed
.
- J. C. Love, L. A. Estroff, J. K. Kriebel, R. G. Nuzzo and G. M. Whitesides, Chem. Rev., 2005, 105(4), 1103–1169 CrossRef CAS PubMed
.
- R. D. Felice, J. Chem. Phys., 2004, 120(10), 4906–4914 CrossRef PubMed
.
- T. Kaneko, D. Willner, I. Monkovic, J. O. Knipe, G. R. Braslawsky, R. S. Greenfield and D. M. Vyas, Bioconjugate Chem., 1991, 2(3), 133–141 CrossRef CAS
.
- B. I. Ipe, K. G. Thomas, S. Barazzouk, S. Hotchandani and P. V. Kamat, J. Phys. Chem. B, 2002, 106(1), 18–21 CrossRef CAS
.
- M. Montalti, L. Prodi, N. Zaccheroni and G. Battistini, Langmuir, 2004, 20(18), 7884–7886 CrossRef CAS PubMed
.
- J. Hu, J. Zhang, F. Liu, K. Kittredge, J. K. Whitesell and M. A. Fox, J. Am. Chem. Soc., 2001, 123(7), 1464–1470 CrossRef CAS
.
- J. Zhang, J. K. Whitesell and M. A. Fox, Chem. Mater., 2001, 13(7), 2323–2331 CrossRef CAS
.
- P. Anger, P. Bharadwaj and L. Novotny, Phys. Rev. Lett., 2006, 96(11), 113002 CrossRef
.
- W. R. Glomm, J. Dispersion Sci. Technol., 2005, 26(3), 389–414 CrossRef CAS PubMed
.
- R. B. Greenwald, Y. H. Choe, J. McGuire and C. D. Conover, Adv. Drug Delivery Rev., 2003, 55(2), 217–250 CrossRef CAS
.
- Y. Liu, M. K. Shipton, J. Ryan, E. D. Kaufman, S. Franzen and D. L. Feldheim, Anal. Chem., 2007, 79(6), 2221–2229 CrossRef CAS PubMed
.
- G. F. Paciotti, D. G. I. Kingston and L. Tamarkin, Drug Dev. Res., 2006, 67(1), 47–54 CrossRef CAS PubMed
.
- D. Marsh, R. Bartucci and L. Sportelli, Biochim. Biophys. Acta, Biomembr., 2003, 1615(1–2), 33–59 CrossRef CAS
.
- J. B. Schlenoff, M. Li and H. Ly, J. Am. Chem. Soc., 1995, 117(50), 12528–12536 CrossRef CAS
.
- W. P. Wuelfing, S. M. Gross, D. T. Miles and R. W. Murray, J. Am. Chem. Soc., 1998, 120(48), 12696–12697 CrossRef CAS
.
- A. Beljebbar, G. D. Sockalingum, J. F. Angiboust and M. Manfait, Spectrochim. Acta, Part A, 1995, 51(12), 2083–2090 CrossRef
.
- I. R. Nabiev, H. Morjani and M. Manfait, Eur. Biophys. J., 1991, 19(6), 311–316 CrossRef CAS
.
- M. Tsen and L. Sun, Anal. Chim. Acta, 1995, 307(2–3), 33–340 Search PubMed
.
- Q. Ye, J. X. Fang and L. Sun, J. Phys. Chem. B, 1997, 101(41), 8221–8224 CrossRef CAS
.
- A. Loren, C. Eliasson, M. Josefson, K. Murty, M. Kall, J. Abrahamsson and K. Abrahamsson, J. Raman Spectrosc., 2001, 32(11), 971–974 CrossRef CAS PubMed
.
- N. Strekal, A. German, G. Gachko, A. Maskevich and S. Maskevich, J. Mol. Struct., 2001, 563–564, 183–191 CrossRef CAS
.
- Q. Yan, W. Priebe, J. B. Chaires and R. S. Czernuszewicz, Biospectroscopy, 1997, 3(4), 307–316 CrossRef CAS
.
- K. Sokolov, M. Follen, J. Aaron, I. Pavlova, A. Malpica, R. Lotan and R. Richards-Kortum, Cancer Res., 2003, 63(9), 1999–2004 CAS
.
- D. Willner, P. A. Trail, S. J. Hofstead, H. D. King, S. J. Lasch, G. R. Braslawsky, R. S. Greenfield, T. Kaneko and R. A. Firestone, Bioconjugate Chem., 1993, 4(6), 521–527 CrossRef CAS
.
- T. Ozeki, H. Yuasa and Y. Kanaya, J. Controlled Release, 1999, 58(1), 87–95 CrossRef CAS
.
- P. J. Costanzo, N. Dan, K. S. Lancaster, C. B. Lebrilla and T. E. Patten, Macromolecules, 2008, 41(4), 1570–1576 CrossRef CAS
.
- K. Kataoka, T. Matsumoto, M. Yokoyama, T. Okano, Y. Sakurai, S. Fukushima, K. Okamoto and G. S. Kwon, in Doxorubicin-loaded poly(ethylene glycol)-poly(beta-benzyl-l-aspartate) copolymer micelles: their pharmaceutical characteristics and biological significance, 5th Symposium on Controlled Drug Delivery, Noordwijk Aan Zee, Netherlands, 1998, pp. 143–153 Search PubMed
.
- E. R. Gillies and J. M. Frechet, Bioconjugate Chem., 2005, 16(2), 361–368 CrossRef CAS PubMed
.
- Z. Jia, L. Wong, T. P. Davis and V. Bulmus, Biomacromolecules, 2008, 9(11), 3106–3113 CrossRef CAS PubMed
.
| This journal is © The Royal Society of Chemistry 2015 |

