Evolution of India's PM2.5 pollution between 1998 and 2020 using global reanalysis fields coupled with satellite observations and fuel consumption patterns†
Abstract
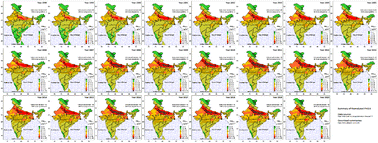
General practice is to rely on ambient monitoring data for reporting and regulatory applications in air quality management. Based on data collated for 2021, Delhi ranked the most polluted capital city, and another 62 Indian cities are in the top 100 most polluted cities list (https://www.iqair.com). This path limits the scrutiny and evaluation only to the cities with a monitoring station, neglecting a large section of non-urban areas. In this paper, we present a summary of evolution of PM2.5 pollution in India between 1998 and 2020, using reanalysed ground-level PM2.5 concentrations estimated by combining satellite AOD retrievals with chemical transport model results from a GEOS-Chem-CEDS system, and subsequently calibrated to on-ground observations. Between 1998 and 2020, India's annual average PM2.5 values steadily increased across the country, Delhi remained the most polluted state in all the years, and total population complying with the annual ambient standard of 40 μg m−3 dropped from 60.5% to 28.4%. According to the GBD-MAPS program, 81% of PM2.5 pollution in India is sourced to fuel (coal, petrol, diesel, gas, biomass, and waste) combustion that supports daily activities in the fields of personal transport, freight transport, electricity generation, industrial manufacturing, cooking, heating, construction, road dust resuspension, and waste burning. We overlayed the pollution trend with fuel consumption and activity patterns to further explain this evolution. While the 2 month COVID-19 lockdown period in 2020 provides evidence to argue that the only way to achieve “clean air” is by (a) cutting emissions at all the sources and (b) cutting emissions regionally, some hard decisions are required to enable and sustain larger reductions across sectors to reach not only the national ambient standard, but also the WHO guideline of 5 μg m−3.


 Please wait while we load your content...