Achroma: a software strategy for analysing (a-)typical mass-spectrometric data
Abstract
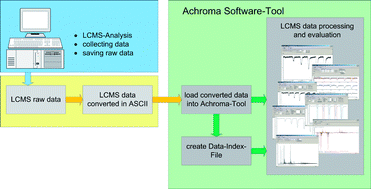
Today, (bio-)analytical researchers use various software tools for improving data analysis and the evaluation of their experimental results. Bioinformaticians typically program these software tools; however, analysts and bioinformaticians have distinct views on these data. Achroma is a software tool for the analysis of spectrometric data; it is our hope that explaining the software strategy and the working modules behind Achroma may give analysts a better understanding of how (bio-)informaticians work out software solutions, thus facilitating the interaction between these two expert groups. Achroma is based on a model-view-controller (MVC) software architecture. Furthermore, Achroma has a modular structure and each module has its own MVC architecture. Typically, each module delivers just one specific function to the user. Finally, every module is embedded within Achroma as a small “stand alone” software application. Analytically, Achroma software is a tool to handle typical and untypical mass spectrometric data. Achroma was originally programmed to circumvent problems with mass spectrometric vendor software in the analysis of data from new experimental strategies. Specifically, existing software enables the data analysis from continuous-flow mixing systems monitoring enzyme–


 Please wait while we load your content...