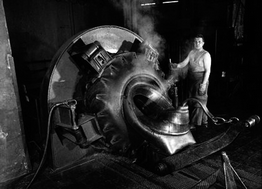
The objective of this study was to compare measured concentrations of rubber process dust and rubber fume originating from different sources in the British rubber manufacturing industry. Almost 8000 exposure measurements were obtained from industry-based survey results collected by the British Rubber Manufacturers' Association (BRMA), and covering the years 1977 to 2002, and from a series of small surveys contained in the Health and Safety Executive's (HSE) National Exposure Database (HSE-NEDB) from 1980 to 2002. The analysis investigated temporal trends in the exposure concentrations and the underlying main factors responsible for these changes. Analyses were carried out using hierarchical linear mixed effects models. Average personal exposures to rubber process dust and rubber fumes were respectively a factor 2 and 4 higher for the HSE-NEDB data when compared to data originating from the industry (BRMA data). Personal exposure to rubber process dust decreased on average by 4.1% (95% CI 4.7–3.6) annually for the BRMA data and slightly less at 2.3% (95% CI 5.2–0.7%) per annum for the HSE-NEDB data. Personal exposure to rubber fume also showed a downward temporal trend of 2.9% (95% CI 3.6–2.3%) and 4.8% (95% CI 7.4–2.1%) annually for the BRMA and HSE-NEDB data, respectively. These trends differed considerably between departments. No major changes in the estimated temporal trends in exposure concentrations were observed after including the presence of local exhaust ventilation in the models for any department in the BRMA and HSE-NEDB datasets. Lack of information on the quality and status of the local exhaust ventilation is the most likely explanation for this. In conclusion, even though there were relatively similar downward time trends in both rubber process dust and fume concentrations in both datasets, the source of exposure data was an important determinant of average exposure concentrations present in the British rubber manufacturing industry. Lack of detailed auxiliary information on company size, reason for sampling, measurement strategy and other potentially important determinants of exposure prevented an explanation for the observed differences in exposure level.

You have access to this article
 Please wait while we load your content...
Something went wrong. Try again?


 Please wait while we load your content...