DOI:
10.1039/D5TA09080F
(Paper)
J. Mater. Chem. A, 2026,
14, 10246-10264
Theoretical evaluation of pristine, single B- and N-doped, and BN co-doped graphenylene as metal-free cathode catalysts for nonaqueous Li–O2 batteries
Received
8th November 2025
, Accepted 7th January 2026
First published on 5th February 2026
Abstract
Rechargeable non-aqueous lithium–oxygen (Li–O2) batteries, owing to their high specific capacity and energy density, are among the most promising next-generation energy storage systems. However, their practical application is hindered by sluggish electrochemical kinetics and high charge/discharge overpotentials, highlighting the need for novel catalysts. In this study, first-principles calculations were employed to theoretically investigate the catalytic potential of pristine, B-doped, N-doped, and BN co-doped graphenylene (GP) nanosheets as metal-free cathode electrocatalysts. Optimized geometries along two nucleation pathways (leading to Li4O4 and Li4O2) and free energy profiles were computed to elucidate mechanisms and predict final discharge products, revealing that Li4O4 formation is thermodynamically favored in all structures. Charge/discharge voltages lie within a safe range preventing electrolyte decomposition. Among the catalysts, B-BNGP exhibits enhanced stability compared to the other configurations and graphene, with the lowest discharge/charge overpotentials (0.280 and 0.293 V), making it the most efficient cathodic catalyst for the ORR/OER. Adsorption patterns in the rate-determining step (RDS) serve as overpotential descriptors, while reduced adsorption energy correlates with lower overpotential. Using B-BNGP as a reference, activation barriers for catalytic decomposition of Li2O2 and Li4O4 were 1.627 and 1.769 eV, respectively, significantly lower than that for Li2O2 decomposition on graphene (2.06 eV), yielding a 1.9 × 10⁷-fold increase in the reaction rate. Additionally, B-BNGP can mitigate the tendency toward Li2CO3 formation and dimethyl sulfoxide (DMSO) electrolyte decomposition, thereby enhancing cycling reversibility. Electronic structure analysis confirms the conductivity of these structures, highlighting GP-based nanosheets as promising bifunctional cathodic electrocatalysts for non-aqueous Li–O2 batteries.
1. Introduction
The depletion of energy resources and environmental concerns caused by fossil fuel consumption have accelerated the development of clean technologies such as electric vehicles and Li-ion batteries (LIBs). However, the relatively low theoretical energy density of LIBs (387 Wh kg−1), compared to gasoline (12200 Wh kg−1) and diesel (13762 Wh kg−1), remains a key obstacle to the large-scale commercialization of electric vehicles.1,2 Therefore, the development of storage systems with enhanced electrochemical performance is essential. Among emerging energy storage technologies, non-aqueous rechargeable Li–O2 batteries, introduced by Abraham and Jiang in 1996, are regarded as highly promising next-generation systems.3 Their operating voltage of 2.96 V and a theoretical energy density of 11680 Wh kg−1 approach those of fossil fuels and exceed those of LIBs by nearly tenfold.1,4–8 The exceptionally high energy density is mainly due to the use of Li, the lightest metal, as the anode and the availability of oxygen from the atmosphere as a cathodic reactant, which facilitates Li-ion uptake. The overall electrochemical reaction during the discharge process of non-aqueous Li–O2 batteries is described as 2Li + O2 ↔ Li2O2.9 Despite their promising energy density, the commercialization of Li–O2 batteries still faces critical challenges, including low discharge capacity, poor electrolyte stability, high overpotentials, and short cycle life. These limitations are mainly attributed to the sluggish kinetics of the oxygen reduction (ORR) and oxygen evolution (OER) at the cathode during the discharge/charge processes and are regarded as key performance-limiting factors.4,10–12 Therefore, exploring cathode catalysts with high conductivity and porosity is essential. Moreover, a catalyst that preferentially promotes Li2O2 formation over Li2O is beneficial for cycling stability.13,14
To date, various electrocatalysts including noble metals,15,16 transition metal oxides,17–20 carbides,21 and both carbon22–24 and non-carbon-based 2D nanomaterials13,25–30 have been proposed. Among them, metal-free electrocatalysts, especially carbon-based structures, are regarded as promising cathodic catalysts due to their stability, high porosity and surface area, good conductivity, natural abundance, and low weight and cost.31,32 Graphene, the most well-known carbon material, has been extensively studied in Li–O2 batteries, and studies have shown that defect engineering and doping can effectively enhance its catalytic performance.33–35 For example, in experimental studies on N-doped graphene nanostructures as cathodes for non-aqueous Li–O2 batteries, Li et al.36 reported ∼2.5 times higher performance than pristine graphene, Wu et al.37 observed activity comparable to that of Pt-based cathodes, and Zhao et al.38 designed 3D porous N-doped graphene aerogels (NPGAs) that enhanced catalytic performance by providing high specific capacity and long cycle stability. Besides experiments, DFT calculations are an effective tool for predicting suitable electrocatalysts in Li–O2 batteries.39 Nørskov et al.40,41 used a computational hydrogen electrode model and DFT to provide the first theoretical analysis of cathodic reactions in non-aqueous Li–O2 batteries, examining the ORR pathway and identifying the likely origin of discharge overpotential via free energy calculations of intermediates. Ren et al.42,43 studied the catalytic performance of graphene doped with heteroatoms such as B, N, Al, Si, and P, showing that B incorporation reduces the OER energy barrier. Similarly, Jiang et al.44 reported that B-doped graphene exhibits the lowest overpotentials for both the ORR and OER, making it an efficient catalyst for non-aqueous Li–O2 batteries. N-containing sites in carbon structures enhance oxygen species adsorption and improve ORR kinetics in non-aqueous Li–O2 batteries.16 Jing and Zhou45 demonstrated that among various N-doped configurations, pyridinic N plays the key role in Li2O2 nucleation. Moreover, Yi et al.46 reported that N-doped carbon nanotubes (NCNTs) facilitate the initial stages of the charge/discharge cycle by improving LixO2y species adsorption compared to pristine CNTs.
Recent experimental studies have shown that co-doping heteroatoms such as B and N into carbon structures significantly enhances ORR activity.47,48 Zhao et al.49 attributed this improvement to the synergistic effect between electron-donating N regions and electron-withdrawing B sites. Similarly, Zhang et al.50 reported that B/N co-doped porous graphene achieved high discharge capacity (15![[thin space (1/6-em)]](https://www.rsc.org/images/entities/char_2009.gif) 340 mAh g−1) and long-term cycling stability (over 117 cycles) in Li–O2 batteries. In theoretical work, Yao et al.51 demonstrated that B/N co-doped graphene with Stone–Wales defects exhibits the lowest overpotentials for the ORR and OER, making it an efficient catalyst for non-aqueous Li–O2 batteries. Despite its high conductivity, graphene shows limited efficiency in oxygen species adsorption and conversion due to low porosity and few active sites. Therefore, the development of carbon structures beyond graphene, with lower overpotentials, is essential to enhance the performance of non-aqueous Li–O2 batteries.52–54
340 mAh g−1) and long-term cycling stability (over 117 cycles) in Li–O2 batteries. In theoretical work, Yao et al.51 demonstrated that B/N co-doped graphene with Stone–Wales defects exhibits the lowest overpotentials for the ORR and OER, making it an efficient catalyst for non-aqueous Li–O2 batteries. Despite its high conductivity, graphene shows limited efficiency in oxygen species adsorption and conversion due to low porosity and few active sites. Therefore, the development of carbon structures beyond graphene, with lower overpotentials, is essential to enhance the performance of non-aqueous Li–O2 batteries.52–54
Graphenylene (GP), a 2D allotrope of carbon atoms with sp2 hybridization, consists of a periodic network of 4-, 6-, and 12-membered rings with well-defined pores of approximately 3.2 Å in diameter and was first proposed by Balaban and co-workers.55,56 This structure is built from cyclohexatriene units featuring two distinct C–C bond types within 6-membered rings and has attracted attention due to its unique topology and high thermodynamic stability. Theoretical studies by Brunto et al.57 revealed that dehydrogenation of porous graphene can lead to the formation of GP. More recently, GP has been successfully synthesized via dehydration and polymerization of 1,3,5-trihydroxybenzene.58 GP exhibits a direct and narrow band gap (∼0.025 eV), and its electronic charge density distribution differs from that of conventional carbon structures such as graphene, which can influence its interactions with adsorbed species and reaction intermediates.56,57,59,60 Owing to its high specific surface area, ordered network architecture, and distinctive electronic characteristics, GP has been proposed as a promising platform for various applications, including gas adsorption and separation,61–64 H2 storage,56,65 and metal-ion batteries.66,67 In this context, the combination of these features is expected to give rise to distinct catalytic behaviors, rendering GP a suitable candidate for electrocatalytic applications. However, to date, no experimental or theoretical study has investigated the use of GP as a cathodic catalyst in Li–O2 batteries, leaving its catalytic behavior largely unexplored.
In this study, we theoretically evaluate, for the first time, the electrocatalytic performance of pristine, B-doped, N-doped, and BN co-doped GP configurations toward the ORR/OER in non-aqueous Li–O2 batteries using DFT-D2 calculations. Here, the intrinsic properties of the cathode catalysts and external effects such as Li metal corrosion and air electrode polarization that occur in real systems are not considered. Following structural optimization and stability checks, two possible pathways for Li2O2 formation are considered. We calculated adsorption energies and thermodynamic free energy changes during discharge/charge processes to identify final products and predict overpotentials. To elucidate the reaction mechanisms, we analyzed RDS diagrams, Hirshfeld charge distributions, and electronic properties. Li2CO3 formation as a side product and the activation barriers for discharge product decomposition are examined using the LST/QST method. Finally, the implicit solvation model is employed to study the stability of B-BNGP in DMSO and its impact on the electrolyte decomposition. Our findings provide new insights for the rational design of emerging carbon-based cathode catalysts for Li–O2 batteries.
2. Computational details
All calculations were performed using DFT with spin polarization, employing the DMol3 module within the Materials Studio software.68 The generalized gradient approximation (GGA) with the Perdew–Burke–Ernzerhof (PBE) functional was applied to describe exchange–correlation effects,69 and van der Waals interactions were included via the Grimme DFT-D2 empirical correction.70 The double numerical plus polarization (DNP) basis set was also employed, offering an accuracy comparable to that of the 6-31G** basis set.71,72 A 2 × 2 supercell of GP was modeled to explore the adsorption behavior, with a vacuum spacing of 20 Å applied perpendicular to the plane to avoid interlayer interactions between periodic images. In all calculations, a global orbital cutoff radius of 5.4 Å, and the values of 10−5 Ha, 0.002 Ha Å−1, and 0.005 Å were set to energy tolerance accuracy, maximum force, and maximum displacement, respectively. The Brillouin zone was sampled using a 6 × 6 × 1 Monkhorst–Pack k-point mesh for structural optimization, and a denser 10 × 10 × 1 mesh was used for electronic property calculations. Ab initio molecular dynamics (AIMD) simulations were carried out in the NVT ensemble at 300 K to assess the dynamic stability of B-BNGP in DMSO electrolyte, employing the implicit solvation COSMO73 model with a dielectric constant of 46.7. Also, the catalytic performance during charging was assessed by calculating the energy barrier using the LST/QST74 method. Considering that DFT calculations consistently overestimate the binding energy of the O2 molecule,75 its energy was calculated using the following correction formula:where EO2 and EO2-DFT are the corrected energy and the DFT calculated energy of isolated O2 molecules, respectively. ECV (0.86 eV) is the correction value for the static energy of O2 molecules,30,51 derived from the experimental O2 binding energy (5.12 eV).14,43,51,76 The impact of this correction on the formation of free energy and potential for a representative structure is summarized in Table S9. To estimate the thermodynamic stability of the structures, the standard formation energies (Ef) were calculated as follows:| | | Ef = Ecatalysts − c × µc − b × µB − n × µN | (2) |
where Ecatalysts represents the total DFT energy of the catalysts. Parameters c, b, and n represent the total number of C, B, and N atoms in the structures, respectively, and µC, µB, and µN denote the corresponding chemical potentials of C (from graphene), B (in the bulk phase), and N (in the gas phase). To evaluate the binding strength of LixO2y (x = 0–4, y = 0–2) intermediates on the substrate, the adsorption energies were calculated as follows:| | | Eads(LixO2y) = ELixO2y* − E* − xELi − yEO2 | (3) |
where ELixO2y* and E* represent the total energies of the complex of LixO2y-substrate and the pristine substrate, respectively. ELi and EO2 denote the energies of a Li atom in the bulk phase (bcc structure) and an isolated O2 molecule (triplet as the ground state), respectively. A negative value of Eads indicates that the adsorption process is exothermic. The consecutive adsorption energy (ΔEads) for a new Li or O2, which are respectively added to structures Li(x−1)O2y* and LixO2(y−1)*, is defined as follows:| | | ΔEads(Li) = ELixO2y* − ELi(x−1)O2y* − ELi | (4) |
| | | ΔEads(O2) = ELixO2y* − ELixO2(y−1)* − EO2 | (5) |
The electrochemical reaction mechanism in Li–O2 batteries, involving coupled electron-ion transfer, can be interpreted in terms of thermodynamic free energy.77 Here, the Gibbs free energy change (ΔG) for each step was evaluated using the following:
| | | ΔG = E − E0 + ΔNO2 × µO2 + ΔNLi(µLi − eU) + ΔEZPE − TΔS | (6) |
where Δ
G represents the Gibbs free energy difference between two consecutive steps.
E and
E0 denote the DFT calculated total energies of the system corresponding to a specific reaction step and the initial step, respectively. Δ
N corresponds to the number of Li atoms and O
2 molecules adsorbed/desorbed in each step.
µO2 and
µLi represent the chemical potentials of an isolated O
2 in the gas phase and Li atom in the bulk phase, respectively. The term -
eU accounts for the influence of the applied potential on the participating electrons. Δ
EZPE and Δ
S refer to the changes in zero-point vibrational energy and entropy at 298.15 K, obtained from frequency calculations. The entropy of O
2 was taken from the NIST database.
78 For solid-phase species, entropy, pressure, and volume contributions to the free energy were neglected due to their negligible magnitude compared to the total energy.
13,20 The term
U = 0 in
eqn (6) represents the condition without an applied potential. To investigate the effect of voltage on the mechanism of electrochemical reactions, three different potentials, including the equilibrium potential (
Ueq), the discharge potential (
UDC), and the charge potential (
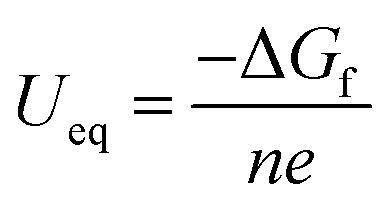
UC), were considered in this study. The equilibrium potential is calculated using the Nernst equation:
| |  | (7) |
where
n and
e represent the number of transferred electrons and the elementary charge, respectively. The standard formation energy (Δ
Gf) is calculated as follows:
| | | ΔGf = ELixO2y* − E* − xELi − yEO2 + ΔEZPE − TΔS | (8) |
where the parameters used were previously explained.
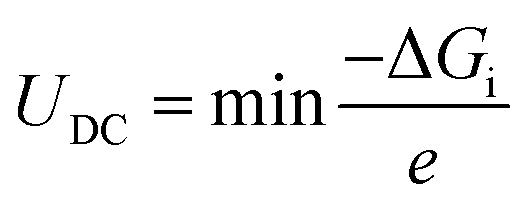
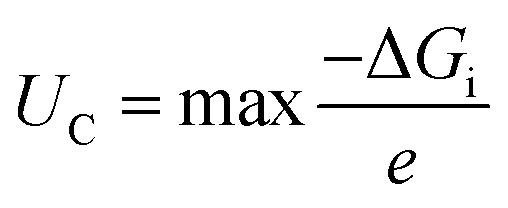
UDC (the maximum discharge voltage) and
UC (the minimum charge voltage) are defined using the following, respectively:
| | 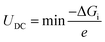 | (9) |
| | 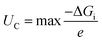 | (10) |
where Δ
Gi represents the Gibbs free energy change between consecutive steps along the discharge/charge pathways. To better understand the interactions between the adsorbed intermediates and the substrate, charge density difference (CDD) plots are obtained using the following equation:
| | | Δρads = ρLixO2y* − ρ* − ρLixO2y | (11) |
where
ρLixO2y*,
ρ*, and
ρLixO2y represent the charge densities of the complex of Li
xO
2y-substrate, the pristine substrate, and the isolated intermediate, respectively. Also, Hirshfeld charge
79 analysis was performed to quantify the charge transfer values.
3. Results and discussion
3.1. Geometry, stability and electronic properties of the pristine, B-doped, N-doped, and BN co-doped GP
In this study, the GP structure was modeled using a 2 × 2 supercell containing 48C atoms with sp2 hybridization. This structure possesses three types of pores with circular (12C), hexagonal (6C), and square (4C) geometries, as illustrated in Fig. 1. As shown in Fig. 1 and Table S1, the lattice parameters were determined (a = b = 6.758 Å). The C–C bond lengths B1, B2, and B3 are provided in Table 1. In the hexagonal pores, these values are 1.366 and 1.470 Å, with the average value matching the C–C bond length in graphene (1.42 Å). Our results are in good agreement with previous studies.57,59,62,66,80,81
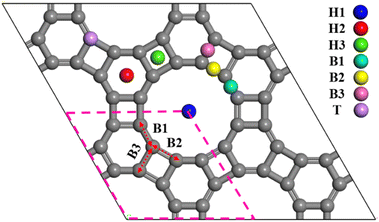 |
| | Fig. 1 The 2 × 2 supercell of GP, with the hexagonal unit cell containing 12C atoms outlined with a pink dashed line; red arrows indicate the bond lengths, and gray and colored spheres represent C atoms and potential adsorption sites. | |
Table 1 Bond lengths, formation energies (Ef), band gaps (Eg), and transferred Hirshfeld charges of B and N atoms (Q) in pristine, B-doped, N-doped, and BN co-doped structures
| System |
Bond length (Å) |
E
f (eV) |
E
g (eV) |
Q (|e|) |
| Pristine GP |
1.366 (C–C) |
0.630 |
0.030 |
0.00 |
| 1.471 (C–C) |
| 1.470 (C–C) |
| BGP |
1.514 (B–C) |
0.507 |
0.000 |
0.06 |
| NGP |
1.418 (N–C) |
0.163 |
0.000 |
−0.01 |
| B-BNGP |
1.401 (B–N) |
−0.916 |
0.188 |
0.12 (B) |
| −0.07 (N) |
| S1-BNGP |
1.511 (B–C) |
0.399 |
0.080 |
0.06 (B) |
| 1.419 (N–C) |
−0.02 (N) |
| S2-BNGP |
1.515 (B–C) |
0.275 |
0.243 |
0.07 (B) |
| 1.420 (N–C) |
−0.01 (N) |
We considered the pristine GP, B-doped GP (BGP), N-doped GP (NGP), and BN-co-doped GP nanosheets as metal-free cathode catalysts for non-aqueous Li–O2 batteries. Three different configurations of BN-co-doped GP contain B and N atoms in the hexagonal ring bonded together (B-BNGP), separated by one C atom (S1-BNGP) and separated by two C atoms (S2-BNGP). The most stable of these structures are presented in Fig. 2. The optimized lattice parameters for the BGP, NGP, and BN co-doped structures are 6.778, 6.743, and 6.768 Å, respectively (Fig. S1 and Table S1).
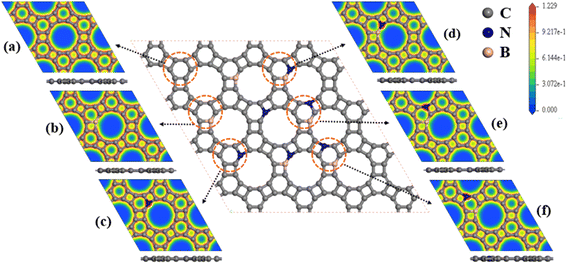 |
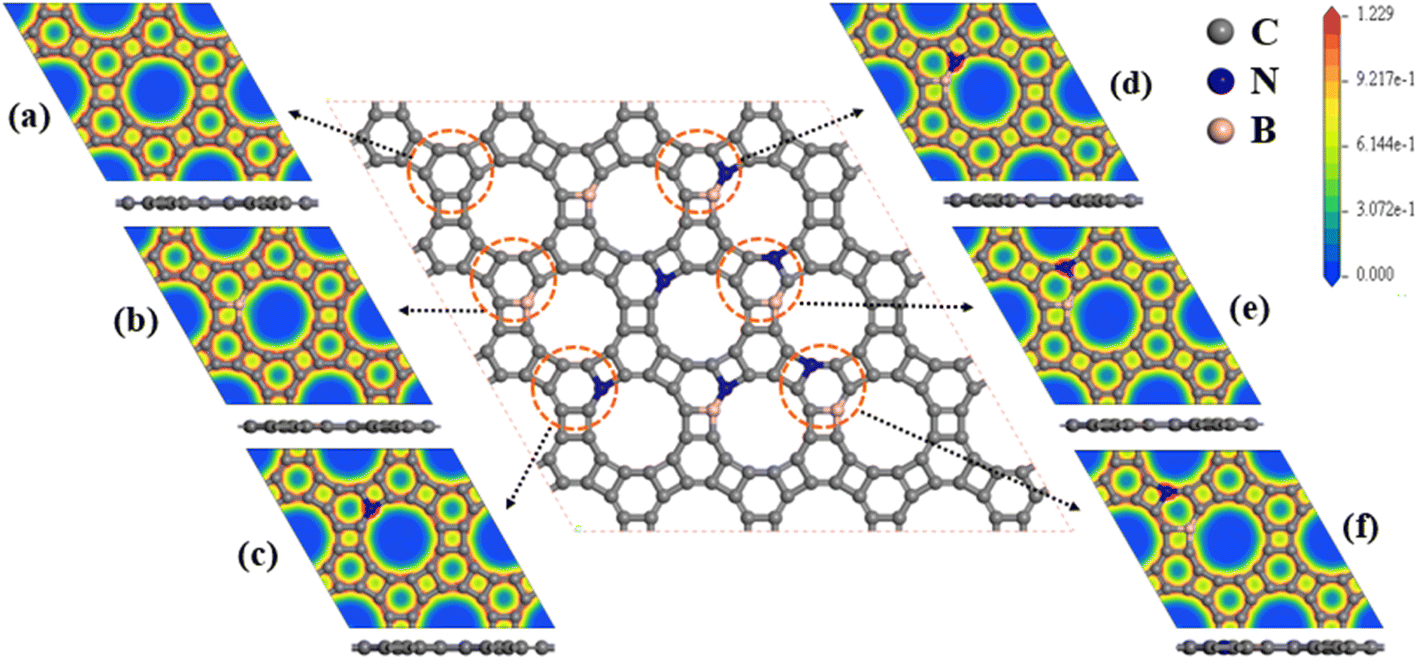
| | Fig. 2 Top and side views of the optimized structures and corresponding electron density contours for (a) pristine GP, (b) BGP, (c) NGP, (d) B-BNGP, (e) S1-BNGP, and (f) S2-BNGP. | |
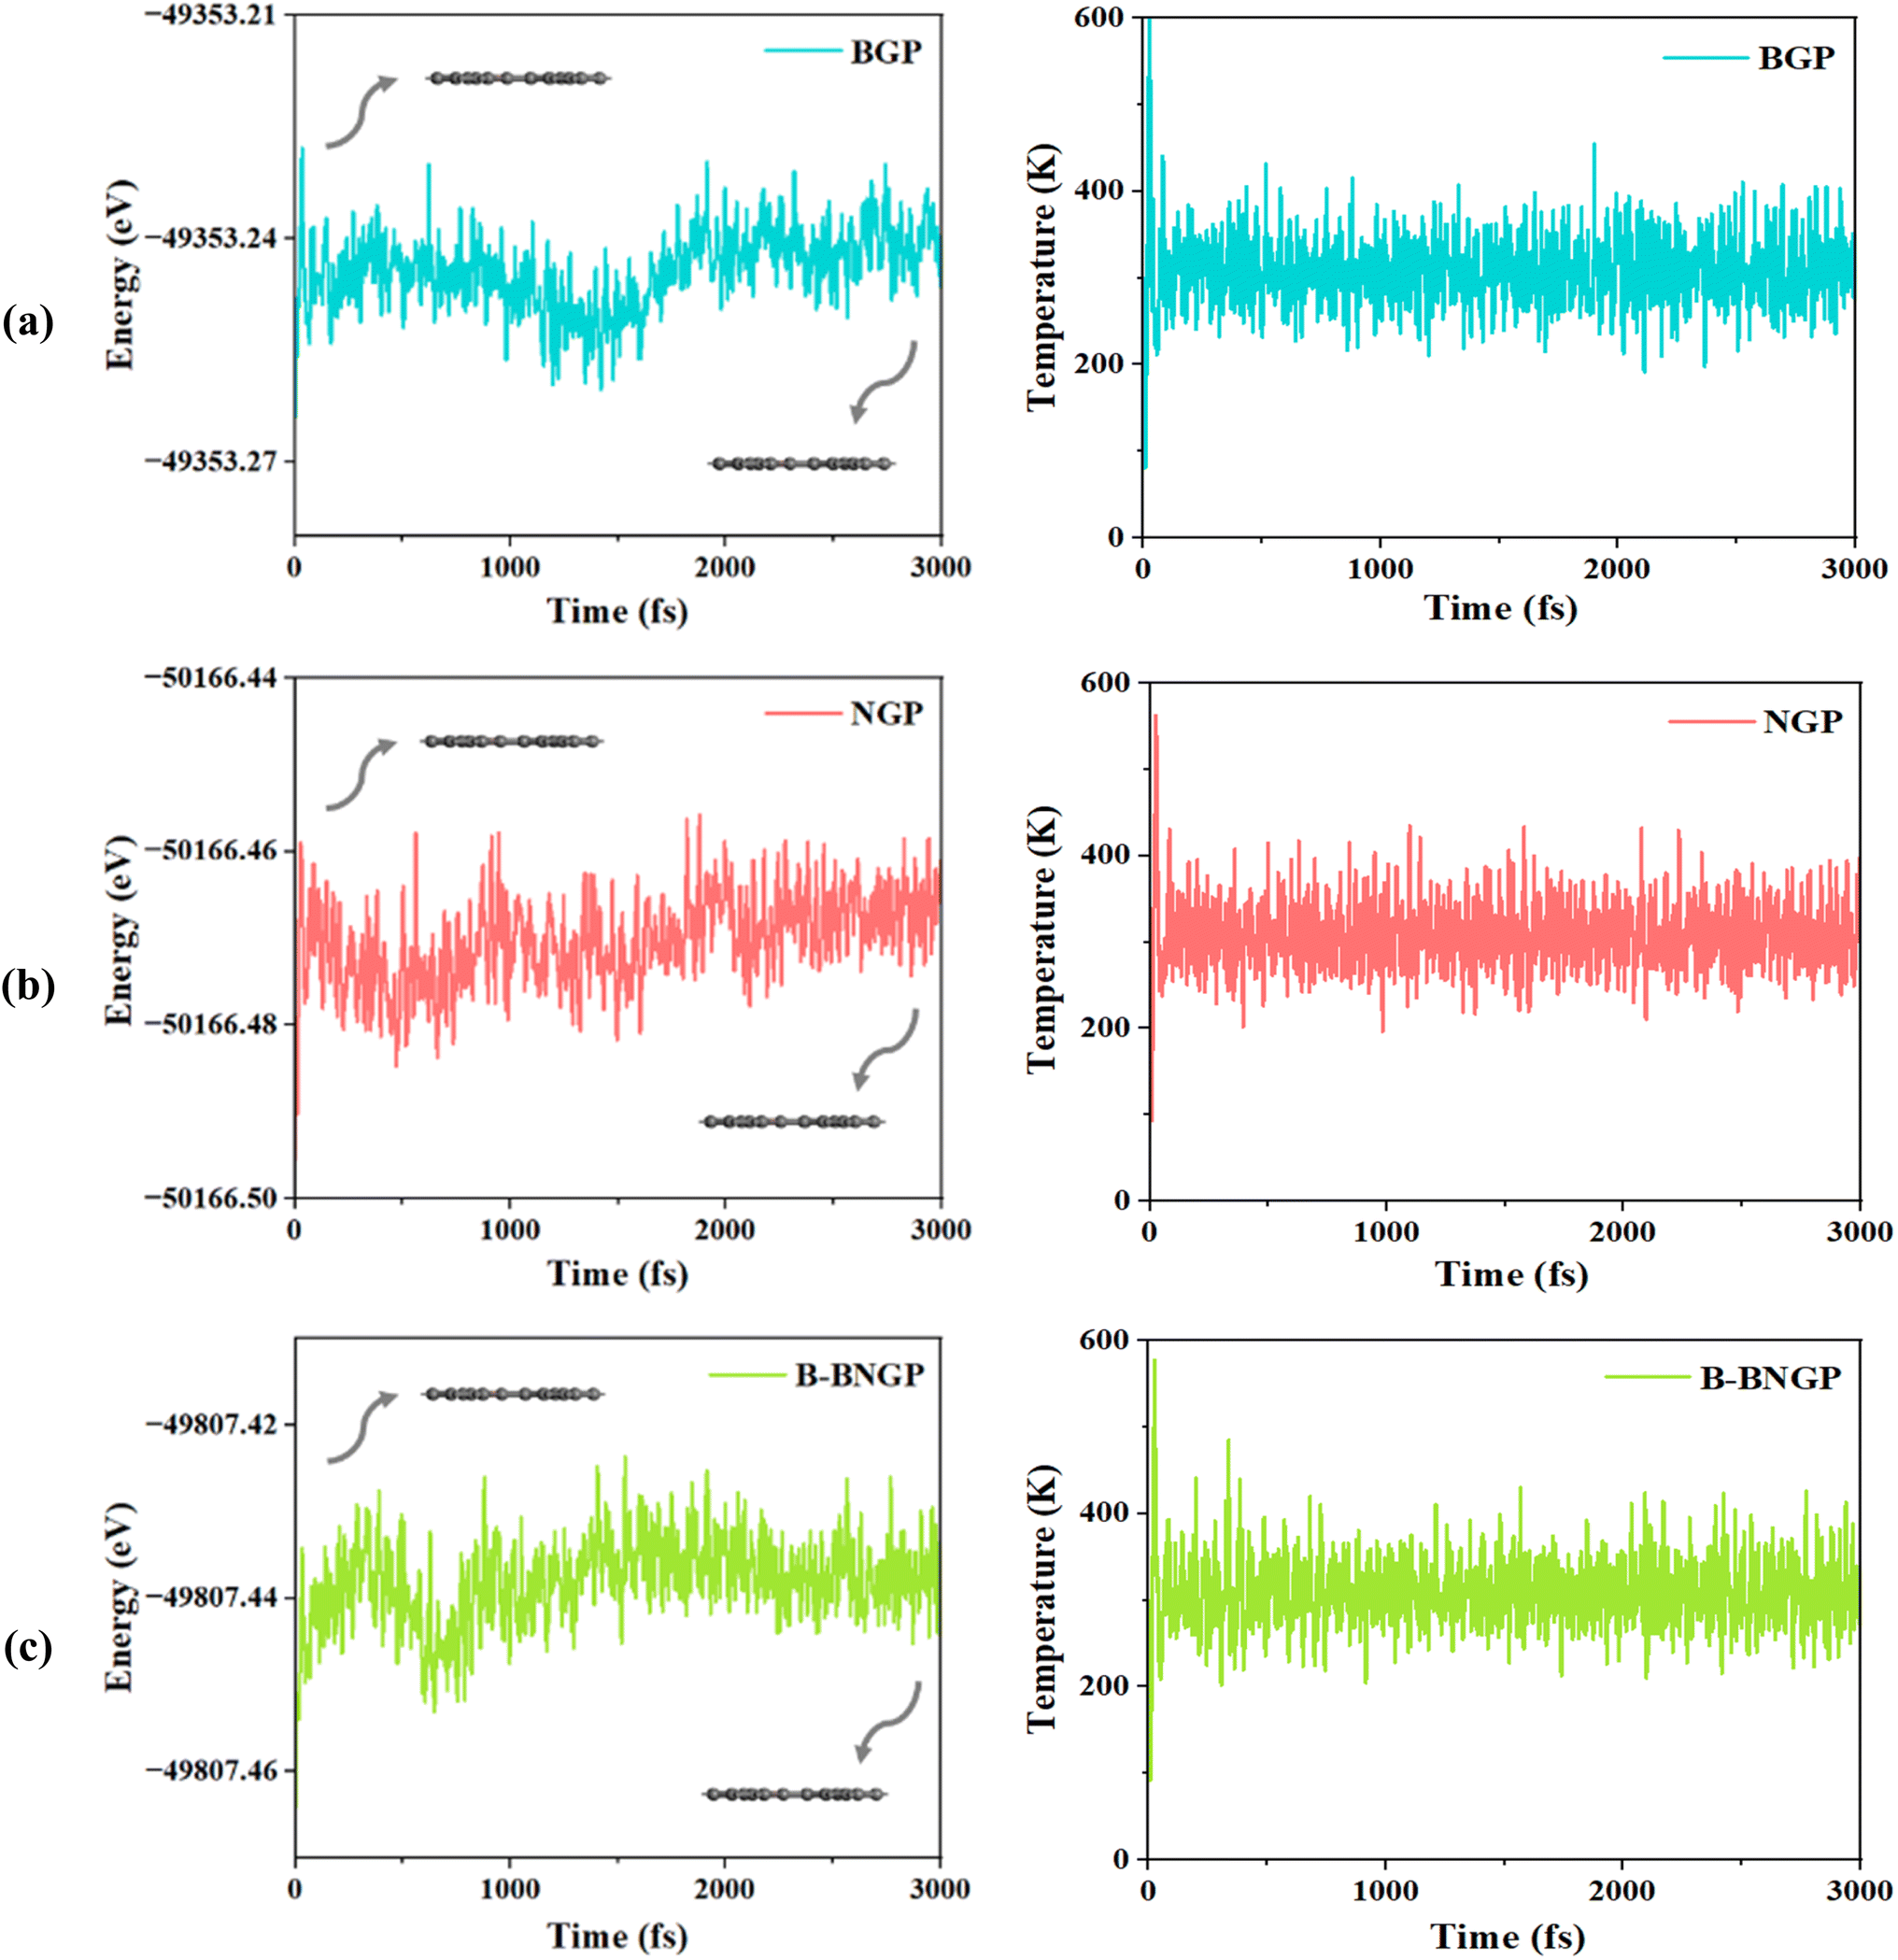
The calculated formation energies (eqn (2)) for the different GP configurations are presented in Table 1. Thermodynamically, pristine GP is about 0.63 eV per C atom less stable than graphene56 and nearly 0.14 eV per C atom more stable than graphdiyne.82 This level of stability, comparable to that of graphdiyne, confirms the feasibility of its synthesis, which has recently been demonstrated experimentally.58 Previous studies on graphene indicate that heteroatom doping with B, N, P, Si, Al, and S generally results in positive formation energies. Among single-doped systems, N- and B-doped graphene exhibit the lowest values, around 0.901 and 0.893 eV, respectively.43 Nevertheless, comparison of these values with the results of the present work indicates that doping on the GP substrate is thermodynamically more favorable. Notably, among all investigated substrates, the B-BNGP structure exhibits the lowest formation energy (−0.916 eV), indicating higher stability than graphene (ref. 44). This trend is consistent with previous reports on graphene, where B–N co-doping was found to be more stable than monoatomic doping,44,83 an effect commonly attributed to charge compensation between neighboring dopants. These results confirm the high stability of the co-doped structure and support its feasibility for Li–O2 battery applications. Pristine GP was previously synthesized, and its dynamic stability was confirmed in earlier studies.34,60,81 Accordingly, the dynamic stability of BGP, NGP, and the more stable BN co-doped (B-BNGP) structures was evaluated using AIMD simulations at 300 K for 3 ps. The fluctuations of total energy and temperature over time, as shown in Fig. 3, indicate that these structures retain their planar configuration under the simulation conditions and are dynamically and thermally stable.
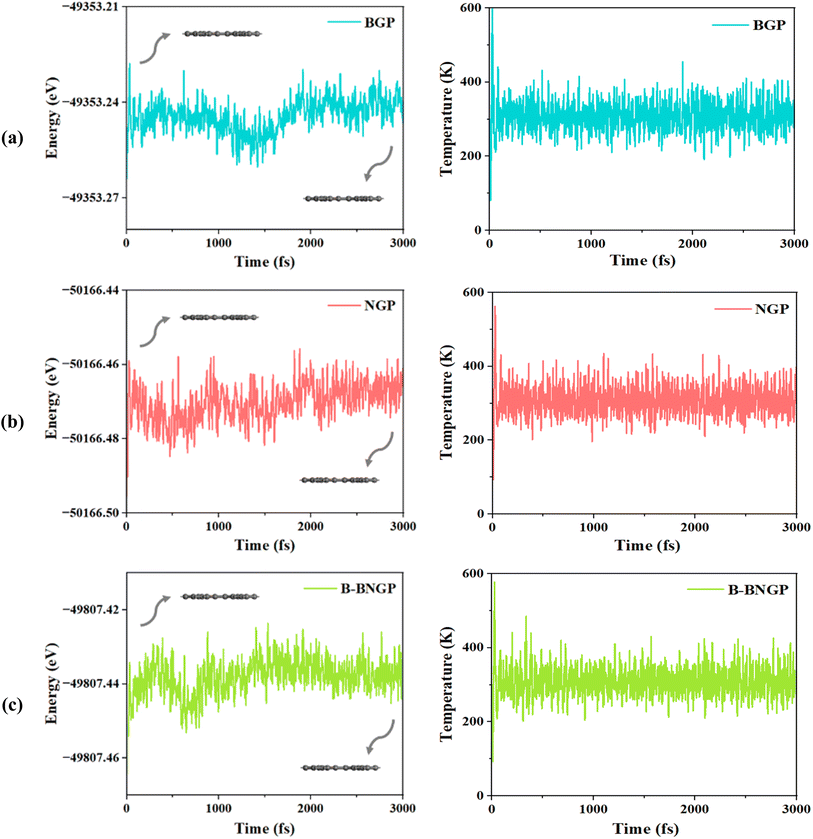 |
| | Fig. 3 Variations of energy and temperature convergence as a function of time during AIMD simulations of (a) BGP, (b) NGP, and (c) B-BNGP at 300 K with a time step of 3 ps. | |
Since catalytic reactions in the cathode of non-aqueous Li–O2 batteries involve electron transfer, understanding the substrate electronic properties, particularly electrical conductivity, is essential for elucidating mechanisms and enhancing catalytic efficiency. Accordingly, band structures of the pristine, B-doped, N-doped, and BN co-doped GP were evaluated (Fig. S2), and band gap values and Hirshfeld charge transfers are summarized in Table 1. Pristine GP with a narrow band gap of 0.030 eV near the Fermi level exhibits semi-conductivity behavior, which is consistent with previous studies.56,57,59,60,67 B doping and N doping introduce acceptor and donor species around the Fermi level, respectively, enhancing conductivity and active site accessibility, while BN co-doping combines these effects to yield a balanced electronic distribution that promotes catalytic performance. As shown in the band structure diagrams, there is full overlap between the spin-up and spin-down states that confirms the structures don't show spin polarization, and therefore they have no magnetic properties.
To elucidate the origin of the enhanced electronic properties and the role of heteroatom doping, the partial density of states (PDOS) of these structures was analyzed with orbital decomposition (Fig. S3). In pristine GP, the density of states at the Fermi level is limited and mainly arises from C2p orbitals, consistent with its semi-metallic character.56,60 B-doping induces the emergence of electron-accepting states with predominant B2p character near the Fermi level, accompanied by charge transfer from the C-framework to B centers and a moderate increase in the density of states. In contrast, N-doping introduces electron-donating states with dominant N2p contributions, leading to a stronger enhancement of the density of states and a more effective improvement in electronic conductivity compared to B-doping. Nevertheless, in single-atom doped systems, electronic modification is mainly influenced by one dominant effect. In simultaneous BN co-doping, the presence of complementary electron centers leads to a more balanced distribution of electronic states around the Fermi level and enhances the overlap of C2p, B2p, and N2p orbitals, thereby facilitating charge transfer. This simultaneous tuning of the electronic structure, relative to single atom doping, strengthens the synergistic effect of the active centers and consequently improves the catalytic performance. Studies have shown that the activation of neutral C π-electrons by graphene-based ORR catalysts plays a crucial role in enhancing the reaction efficiency.49 To examine the effect of structural doping on the electron distribution, the electron density contours of B-doped, N-doped, and BN co-doped GP structures were calculated. For pristine GP (Fig. 2a), the electron density is uniform and mainly localized around the rings and C–C bonds. Due to the difference in electronegativity among B, N, and C atoms, the insertion of heteroatoms into the pristine structure alters the electronic distribution. In the BGP (Fig. 2b), the electron-donating nature of B and the dispersion of electrons around it lead to the formation of a low electron-density region; in contrast, owing to the electron-withdrawing character of N and the accumulation of electrons around it, a high electron-density region is observed in the NGP structure (Fig. 2c). For BN co-doped structures (Fig. 2d–f), more active sites emerge around B and N atoms, with both high and low electron-density regions. Therefore, BGP, NGP, and particularly BN co-doped GP structures can enhance the catalytic performance by activating neutral π-electrons.
3.2. Adsorption mechanisms of LixO2y intermediates and ORR pathways on pristine, B-doped, N-doped, and BN co-doped GP
The electrochemical reactions during the discharge process (ORR) in non-aqueous Li–O2 batteries proceed via either a two-electron or a four-electron pathway, depending on the final product.13,77,84 Initially, O2 is electrochemically reduced to form lithium superoxide (LiO2) (eqn (12)). Due to thermodynamic instability, following further reduction of LiO2 species along the two-electron pathway, lithium peroxide (Li2O2) can be formed either via surface mechanisms (eqn (13) and (14)) or through a solution mechanism involving the disproportionation of LiO2 in the electrolyte phase (eqn (15)).84,85 Previous studies have shown that the solubility of LiO2 strongly depends on the electrolyte properties and its interactions with the surrounding environment and that its dispersion is generally limited in many non-aqueous electrolytes.13,86–88 Accordingly, this consideration was taken into account as a justification for not including the solution-mediated pathway in the present work. Moreover, existing reports focusing on surface mechanisms indicate that, compared to the surface disproportionation reaction (eqn (14)), the electrochemical reduction of LiO2 (eqn (13)) involves lower kinetic barriers and smaller Gibbs free energy changes.13,85,86,89,90 Based on these considerations, electrochemical reduction was considered the dominant surface mechanism for the formation of Li2O2 or (Li2O)2 in this study. As the reaction progresses, Li2O2 accumulates on the cathode surface, leading to the formation of crystalline Li4O4 (eqn (16)). In the four-electron pathway, Li oxide (Li2O) can be generated as a by-product through the reduction of Li2O2 (eqn (17)). In these equations, the asterisk (*) denotes the adsorbed species on the catalyst surface.| |  | (12) |
| |  | (13) |
| |  | (14) |
| | | LiO2(sol) + LiO2(sol) ⇌ Li2O2 + O2(sol) | (15) |
| |  | (16) |
| |  | (17) |
The efficient progression of ORR/OER processes in Li–O2 batteries requires effective adsorption and desorption of intermediates. At the beginning of the nucleation process, the formation of Li2O2 on the cathode surface starts with examining the adsorption behaviors of Li and O2 on the substrates. According to the results, the formation of Li2O2 can proceed through two distinct pathways:  or
or  . To thermodynamically investigate the nucleation process and the adsorption of Li or O2, seven distinct sites, shown in (Fig. 1), were considered. In addition, for O2 adsorption, horizontal (H) and vertical (V) orientations were examined. Only the results for the most stable configurations are presented in Fig. 4, and their corresponding adsorption data are shown in Table 2. Data for other adsorption sites are reported in Tables S3 and S4.
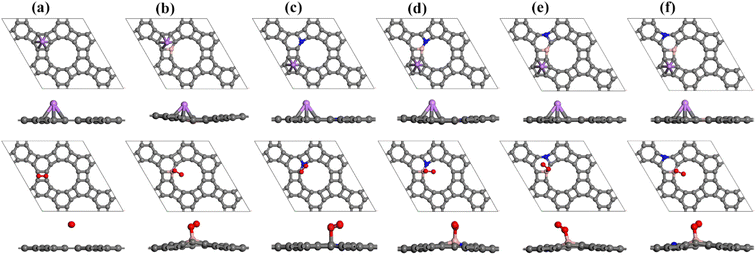 |
| | Fig. 4 Optimized configurations of Li (top) and O2 (bottom) adsorbed on (a) pristine GP, (b) BGP, (c) NGP, (d) B-BNGP, (e) S1-BNGP, and (f) S2-BNGP surfaces; C, B, N, Li, and O atoms are shown in gray, pink, blue, purple, and red, respectively. | |
Table 2 Adsorption energies (Eads) and diffusion barriers (Ebarrier) of Li atoms and O2 molecules on the pristine, B-doped, N-doped, and BN co-doped GP structures
|
|
Pristine GP |
BGP |
NGP |
B-BNGP |
S1-BNGP |
S2-BNGP |
|
E
ads (Li) (eV) |
−0.808 |
−1.292 |
−0.726 |
−0.848 |
−0.816 |
−0.724 |
|
E
ads (O2) (eV) |
−0.359 |
−0.860 |
−0.513 |
−0.752 |
−0.837 |
−0.822 |
|
E
barrier (Li) (eV) |
0.025 |
0.119 |
0.168 |
0.148 |
0.028 |
0.108 |
|
E
barrier (O2) (eV) |
0.005 |
0.001 |
0.004 |
0.080 |
0.001 |
0.023 |
Analysis of the most stable configurations reveals that in all structures, Li preferentially occupies the H2 site, exhibiting a negative adsorption energy. Meanwhile, the O2 molecule adopts a tilted orientation on the B atoms in the BGP and three BN co-doped configurations. In contrast, for pristine GP, O2 is weakly adsorbed in a horizontal configuration at the H3 site, while in NGP, it adsorbs at the B1 site with a tilted geometry. The adsorption of O2 on all substrates is characterized by a negative adsorption energy, which is consistent with previous studies.62,64,80 Comparison of the energy values indicates that in the initial nucleation stage, for pristine, BGP, NGP, and B-BNGP structures, the process begins with Li adsorption, whereas in S1-BNGP and S2-BNGP structures, adsorption starts with the O2. To evaluate the impact of ion and molecule diffusion on the electrochemical performance of Li–O2 batteries, the diffusion barriers of the Li and O2 on GP substrates were calculated. After optimizing various pathways, the most stable path with the lowest diffusion barrier for each structure was identified, and the results are presented in Table 2, Fig. S4 and S5. The trend of barrier energies for Li is pristine GP < S1-BNGP < S2-BNGP < BGP < B-BNGP < NGP. For O2, the barriers are very low, and its diffusion occurs in all structures with an activation energy significantly lower than that of Li. These values are consistent with previously reported data for GP and graphene.45,66,67 Therefore, GP surfaces provide an efficient environment for the mobility of active species. During this process, O2 remained undissociated. After the formation of Li2O2, the discharge reaction continues for the nucleation of LixO2y clusters.24 In the first step, the addition of some Li2O2 formula units leads to the formation of (Li2O2)n nanoclusters, which were simulated along the specified pathways:
Additionally, according to eqn (17), (Li2O)2 can be formed through the complete reduction of O22− to O2−:
Fig. 5 illustrates the most stable adsorption configurations of possible LixO2y intermediates during the discharge process, following the aforementioned reaction pathways, where the ΔEads for each newly added Li or O2 in LixO2y is indicated. Details regarding the distances of LixO2y intermediates from the substrate are provided in Table S5. Throughout the redox pathways, no significant structural changes are observed, and the structures remain stable, which could contribute to enhancing the cycle life of the battery. The adsorption configurations of LixO2y species on all structures are almost geometrically identical, except for the Li4O2, Li3O4, and Li4O4 species adsorbed on the S1-BNGP and S2-BNGP structures, which exhibited distinct geometries. In the case of the Li4O2 cluster, the addition of the fourth Li to the S1-BNGP and S2-BNGP structures leads to O2 molecule dissociation and the formation of a linear geometry. This behavior is attributed to the stronger Li–O interactions and the capability of these configurations to stabilize the dissociated oxygen species. Similarly, in Li3O4 and Li4O4, the addition of the third and fourth Li induces interactions that maintain the species at close distances to the substrate, resulting in the observation of a linear geometry in the molecule.
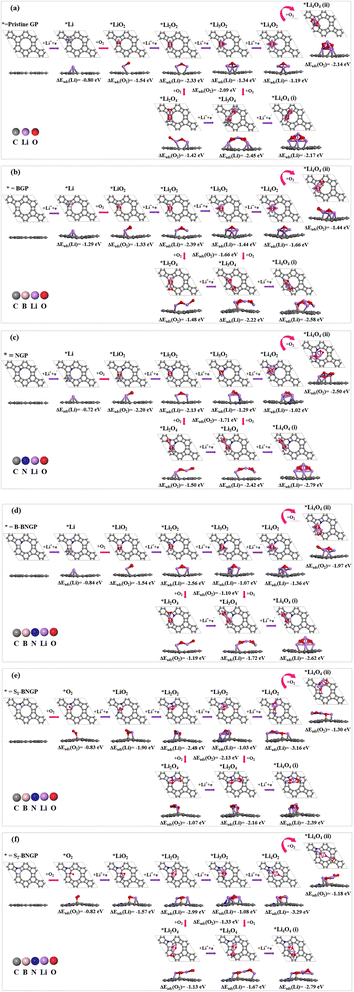 |
| | Fig. 5 The most stable configurations and corresponding adsorption energies of LixO2y intermediates adsorbed on (a) pristine GP, (b) BGP, (c) NGP, (d) B-BNGP, (e) S1-BNGP, and (f) S2-BNGP surfaces. | |
Considering the key role of adsorption energies of intermediates in determining catalytic activity, the adsorption energies of the most stable configurations for the main reaction intermediates are reported in Fig. 6a (details of other intermediates are in Table S6). The negative adsorption energy values across all pathways indicate the exothermic nature of the adsorption processes and the strong interactions between the intermediates and GP substrates. Additionally, increasing the size of the intermediates is accompanied by a continuous decrease in adsorption energy. Fig. 6b shows the total charges obtained from Hirshfeld analysis for the intermediates across all structures (details in Table S7). To determine the charge transfer direction in the ORR pathway, the atomic charges in Li oxides were compared. The results indicate that in LiO2 for pristine, NGP, S1-BNGP, and S2-BNGP, in Li2O4 for NGP, B-BNGP, S1-BNGP, and S2-BNGP, and in Li3O4 for pristine, NGP, and S1-BNGP, electrons are transferred from the GP surfaces to the molecules. In other cases, the molecules transfer electrons to the surface, thereby generating electric current in Li–O2 batteries.
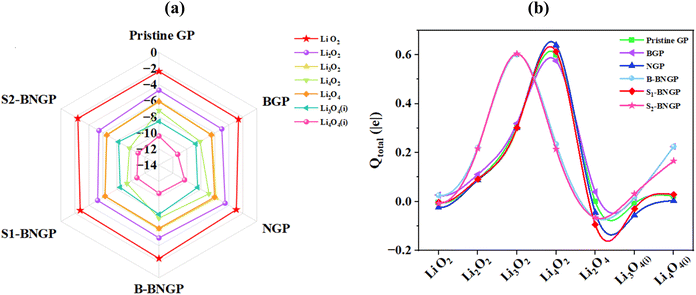 |
| | Fig. 6 (a) Adsorption energies (Eads, eV) and (b) variation of total Hirshfeld charge transferred (Qtotal) for LixO2y intermediates formed on pristine, B-doped, N-doped, and BN co-doped structures during the reduction process. | |
3.3. Gibbs free energy diagram and overpotentials
To theoretically predict the final discharge product and understand the ORR/OER potentials, Gibbs free energy profiles were prepared for each step of the reaction mechanism. The corresponding diagrams are presented in Fig. 7. Predicting the final discharge product requires evaluating the Gibbs free energy difference between the terminal steps of the reaction (Fig. 7a–f).13,28 As previously mentioned, after the formation of Li2O2, the discharge process can proceed via two distinct pathways, leading to the formation of Li4O2 and Li4O4.
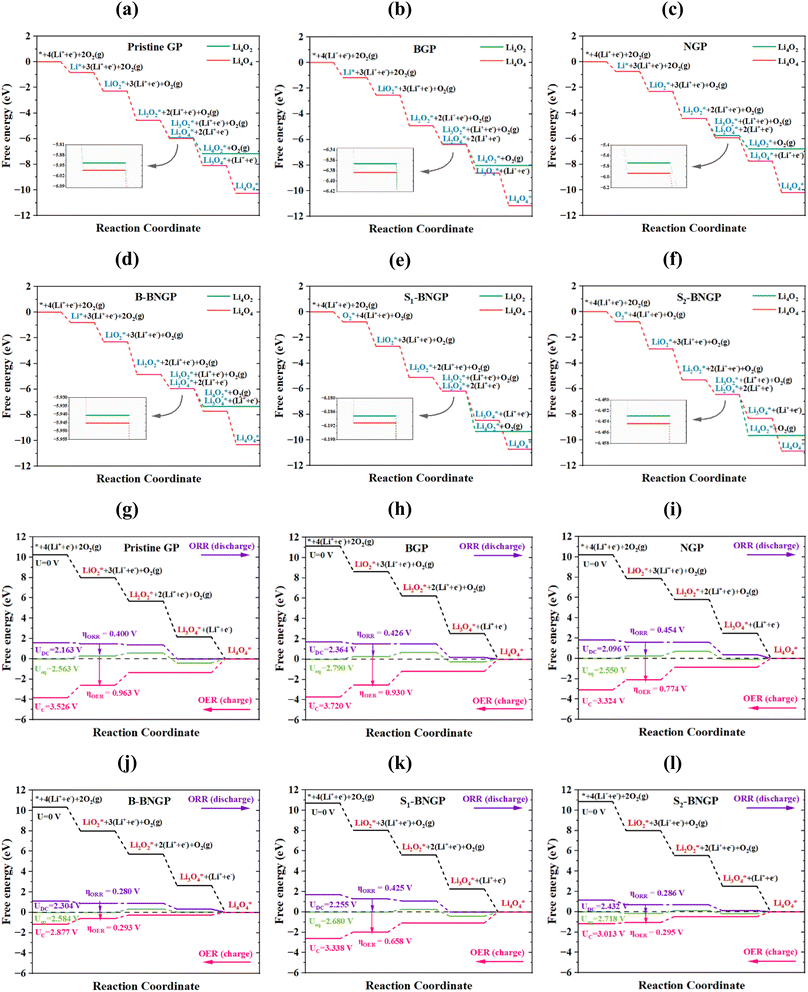 |
| | Fig. 7 The Gibbs free energy diagrams of Li4O2 and Li4O4 as final discharge products at zero potential (U = 0 V) (a–f), and the ORR/OER diagrams of Li4O4 at zero, discharge, equilibrium, and charge potentials (U0, UDC, Ueq, and UC) (g–l), for pristine GP, BGP, NGP, B-BNGP, S1-BNGP, and S2-BNGP structures. The green and red lines in (a–f) represent the formation of Li4O2 and Li4O4, respectively. | |
The Gibbs free energy reductions at this step for the first and second pathways were obtained as −1.369 and −1.420 eV for pristine GP, −1.459 and −1.476 eV for BGP, −1.328 and −1.519 eV for NGP, −1.099 and −1.104 eV for B-BNGP, −1.061 and −1.064 eV for S1-BNGP, and −1.128 and −1.130 eV for S2-BNGP, respectively. The Gibbs free energy differences between the two corresponding final products on these substrates were also calculated to be −3.095, −3.126, −3.412, −3.002, −1.393, and −1.199 eV, respectively. Despite the near Gibbs free energy reduction values for the two reaction pathways and the thermodynamic feasibility of forming both products, the results indicate that the pathway leading to Li4O4 formation in the final step exhibits a slightly more negative ΔG for all investigated substrates and can therefore be identified as the thermodynamically more favorable pathway. On the other hand, as shown in Fig. 6a and Table S6, Li4O4 species exhibit more negative adsorption energies than Li4O2 on all substrates, indicating stronger interactions and higher surface stability. Therefore, by simultaneously considering the thermodynamic preference of the reaction pathway and the surface adsorption stability of the final products, Li4O4 was selected as the representative discharge product for further reaction pathway analysis in this study. To examine the effect of electrode potential on the electrochemical reaction mechanism and the associated Gibbs free energy changes, the reaction pathways were subsequently reconstructed at U = 0, taking the selected discharge product as the reference (Fig. 7g–l). In this study, three different potentials were considered, including Ueq, UDC, and UC. Ueq occurs when the initial and final free energies are equal, and the ORR/OER proceed spontaneously (eqn (7)). UDC and UC represent, respectively, the maximum and minimum voltages at which all steps of the ORR and OER processes are energetically downhill (eqn (9) and (10)). Finally, to quantitatively describe battery performance, evaluate catalytic activity, and assess the cycle efficiency of the systems, the theoretical overpotential is defined as the difference between the operational potential and the Ueq. The overpotential during discharge/charge processes for the ORR (ηORR), the OER (ηOER), and the overall process (ηTOT) is obtained from eqn (18)–(20), respectively. A lower overpotential indicates higher catalytic activity.5
Fig. 7g–l indicate that in the ORR pathways, the rate-determining step for the pristine and S1-BNGP substrates is the formation of Li4O4, whereas for the BGP, NGP, B-BNGP, and S2-BNGP substrates, it is the formation of Li2O2. In the OER pathways, this step corresponds to the decomposition of Li3O4 for all substrates. As shown in Fig. 8a, the UDC values in the ORR pathways follow the trend NGP < pristine GP < S1-BNGP < B-BNGP < BGP < S2-BNGP, while the UC values in the OER pathways follow the trend B-BNGP < S2-BNGP < NGP < S1-BNGP < pristine GP < BGP (Table S8). The calculated discharge/charge voltages for all structures fall within the practical range of 2–4.5 V for Li–O2 batteries,29,51 preventing electrolyte decomposition during charging and meeting the functional requirements of a conventional Li–O2 battery by enhancing cycle stability. Details of the overpotentials are provided in Fig. 8b and Table S8. As observed, the ηORR values in the discharge pathways follow the trend B-BNGP < S2-BNGP < pristine GP < S1-BNGP < BGP < NGP, and the ηOER values in the charge pathways follow B-BNGP < S2-BNGP < S1-BNGP < NGP < BGP < pristine GP. All substrates exhibit discharge/charge overpotentials below 1 V,29,51 which prevents reaction sluggishness and indicates their adequate catalytic activity. Among them, S2-BNGP and particularly B-BNGP structures show superior electrocatalytic performance due to the lowest overpotentials in both pathways. Ultimately, B-BNGP, with extremely low values of 0.280 V (discharge) and 0.293 V (charge), is identified as the most active catalyst with high cycle efficiency for ORR/OER pathways in non-aqueous Li–O2 batteries.
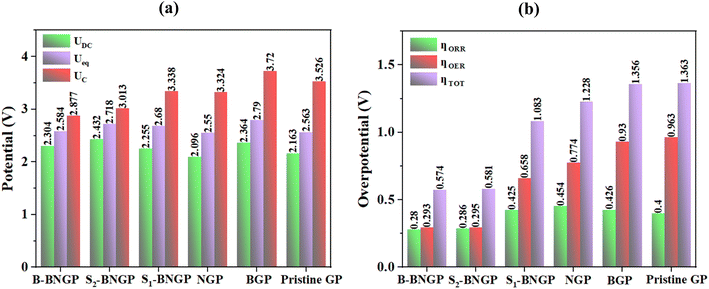 |
| | Fig. 8 Calculated (a) discharge, equilibrium, and charge potentials (UDC, Ueq, and UC) and (b) ORR, OER, and total overpotentials (ηORR/ηOER/ηTOT) for pristine, B-doped, N-doped, and BN co-doped structures. | |
To elucidate the origin of the low overpotentials in the S2-BNGP and B-BNGP structures, the adsorption behavior of the relevant intermediates was examined, and ηORR/ηOERversus the adsorption energies of the RDS species was plotted, as shown in Fig. 9. According to the findings of the previous section, in the ORR process, the RDS is the formation of Li2O2 for BGP, NGP, B-BNGP, and S2-BNGP and the formation of Li4O4 for pristine GP and S1-BNGP, such that the adsorption energies of LiO2 and Li3O4 on these catalysts are the key factors determining ηORR. In the OER process, the RDS for all structures is the decomposition of Li3O4, and the adsorption energy of this intermediate plays a decisive role in ηOER. Higher adsorption energies hinder the participation of intermediates in the subsequent reaction step, while weaker adsorption reduces their stability on the substrate; thus, both scenarios lead to increased overpotential.44,51 The negative slope and high correlation coefficient in Fig. 9a indicate that as the adsorption energy decreases, ηORR starts decreasing from NGP, reaching its minimum at S2-BNGP and then B-BNGP. In the pristine GP and S1-BNGP structures (Fig. 9b), due to the limited number of data points, accurate calculation of the slope, r, and R2 is not possible, and both points fall within a similar adsorption energy range with close overpotential values. Similarly, in the charge pathway (Fig. 9c), a strong linear relationship between the two parameters is observed, with lower Li3O4 adsorption energies correlating with lower ηOER. High R2 values (above 0.8) in both pathways indicate that the adsorption energies of intermediates can largely rationalize the electrochemical behavior of the systems by influencing the subsequent reaction step and reducing or increasing ηORR/ηOER.
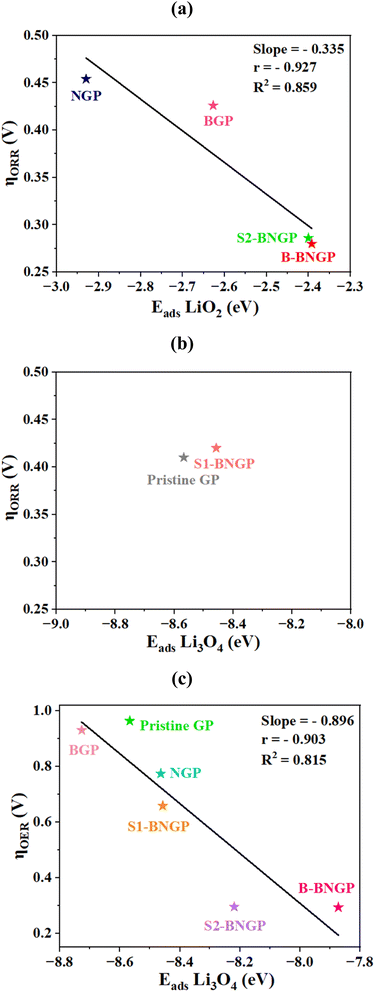 |
| | Fig. 9 The ORR overpotential (ηORR) as a function of the adsorption energy of (a) LiO2 and (b) Li3O4, and the OER overpotential (ηOER) as a function of the adsorption energy of (c) Li3O4. | |
3.4. Electronic analysis of intermediates
To better understand the electronic properties and charge transfer between the substrates and LixO2y clusters during the discharge reaction, PDOS and CDD plots were generated for the most probable pathway based on Hirshfeld charge analysis. The results for the reference B-BNGP are presented in Fig. 10, while the other structures are shown in Fig. S6 and S7. In the initial discharge stage, upon Li or O2 adsorption, pristine GP transitions from a semiconductor to a metallic state, with the Fermi level entering the conduction region, where the peaks near the Fermi level are primarily derived from C-2p orbitals and partially from N-2p orbitals (Fig. 10a–f). Along the reaction pathway Li/O2 → LiO2 → Li2O2 → Li2O4 → Li3O4 → Li4O4, the metallic behavior is maintained, and the enhanced conductivity is mainly contributed by electrons transferred from oxygen atoms. In all cases, the O-2p, C-2p, and N-2p peaks (with a minor contribution from Li-2s) cross the Fermi level, increasing the number of charge carriers. Further hybridization analysis indicates that this interaction strengthens from LiO2 toward more oxygen-rich phases (especially in Li2O2 and Li4O4) and is stronger in B-BNGP compared to the pristine substrate, single-doped, and non-adjacent co-doped structures. The spin-up and spin-down states are fully aligned, indicating non-magnetic behavior of the systems. The CDD maps in Fig. 10g–l also indicate that in all adsorption states, charge accumulation primarily occurs at the C–Li interface, while charge depletion on Li–O bonds reflects their weakening. Strong polarization in B-BNGP organizes the charge accumulation regions into continuous bridges between the LixO2y clusters and the C framework, which expand with increasing oxygen content. Consequently, GP-based structures can serve as promising cathode materials, enabling fast charge/discharge processes in Li–O2 batteries.
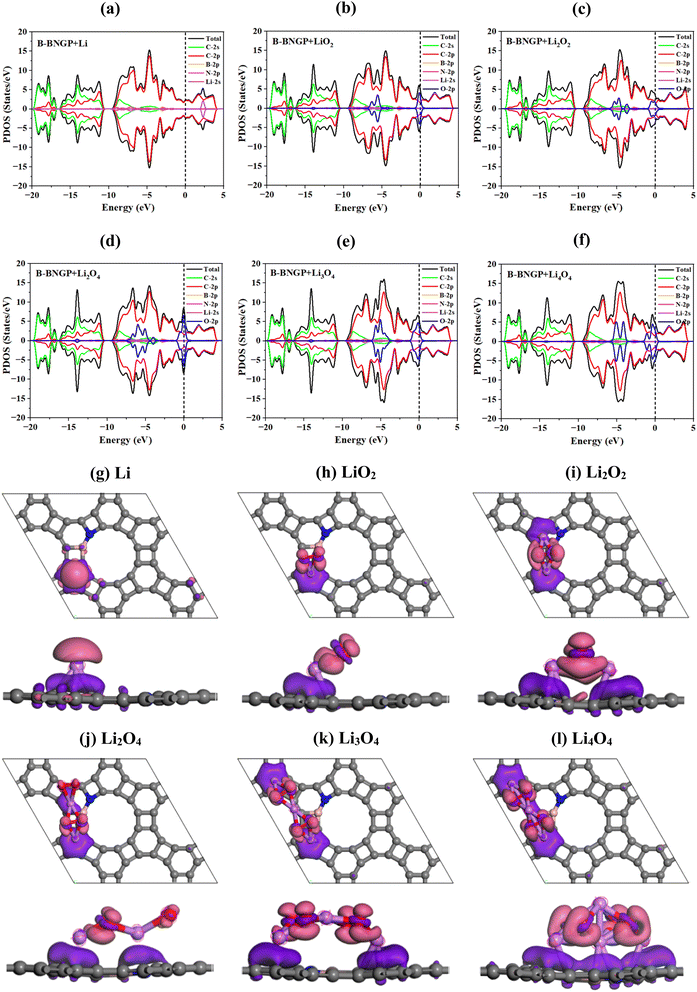 |
| | Fig. 10 (a–f) PDOS and (g–l) CDD images of Li, LiO2, Li2O2, Li2O4, Li3O4, and Li4O4 intermediates adsorbed on the B-BNGP structure; the Fermi level is indicated by a black dashed line at zero energy in (a–f); purple and pink regions represent charge accumulation and depletion, respectively (g–l). | |
3.5. Catalytic decomposition of Li2O2 and Li4O4 (OER pathway)
At the end of the charge process in Li–O2 batteries, the final discharge product decomposes into its atomic components. In aqueous electrolytes, redox mediators can facilitate this process. However, in non-aqueous electrolytes, experimental studies have shown that during discharge, Li–O bonds are broken, creating Li vacancies. This indicates that the presence of an active catalyst can play a key role in facilitating Li–O bond cleavage. Theoretical results further confirm that the initial Li vacancies in bulk Li2O2 are formed through decomposition. Therefore, employing a suitable catalyst that can lower the activation barriers, smooth the decomposition pathway, and accelerate the removal of discharged species becomes essential.13,91 To better understand the charging process and determine the minimum energy pathway and activation barriers, the energy required for Li removal from Li2O2 and the formation of LiO2 on the reference B-BNGP was evaluated using the LST/QST method.74 In this approach, the structures corresponding to the reactants (Li2O2 or Li4O4 on B-BNGP) and products (after Li migration, resulting in LiO2 or Li3O4) were first optimized separately. Using these optimized structures as the initial state (IS) and final state (FS), the reaction pathway was then calculated, allowing the identification of the intermediate geometries and the transition state (TS), from which the activation barrier profile was constructed. As shown in Fig. 11a and b, two decomposition pathways were considered for the Li2O2 cluster, in which the migration of one of the two Li atoms in the cluster was examined. In the first pathway, a Li atom located on one side of the cluster detaches from the structure and migrates toward a neighboring site in the upward direction of the cluster, whereas in the second pathway, the migration of the other Li atom located on the opposite side of the cluster toward a neighboring site in the opposite direction was investigated (for clarity, only the migration path of the detached Li atom is shown in the images). The results indicate that the activation barriers for the first and second pathways are 1.627 and 1.643 eV, respectively, which are significantly lower than the reported value for graphene (2.06 eV).13 Although the activation barriers of the two pathways are very close, the first pathway exhibits the lowest activation barrier for the decomposition process. Subsequently, the kinetic rate constant of B-BNGP, obtained from the Arrhenius equation (K ∼ exp (−Ea/KBT)), was 1.9 × 10⁷ times higher than that of graphene, where Ea, KB, and T denote the activation barrier, Boltzmann constant, and 300 K, respectively. Thus, B-BNGP demonstrates superior catalytic efficiency in Li–O bond cleavage compared to graphene.13
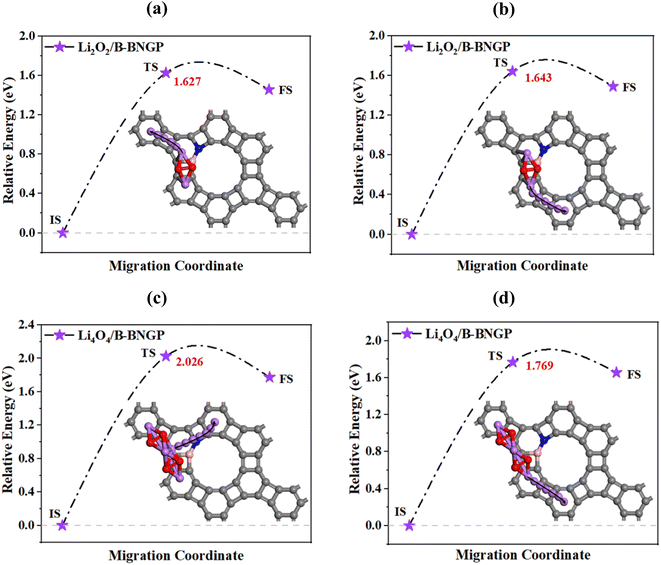 |
| | Fig. 11 Relative energy profiles (eV) for the dissociation of Li atoms from (a and b) Li2O2 and (c and d) Li4O4 clusters along different paths on the B-BNGP structure; IS, TS, and FS represent the initial, transition, and final states, respectively; C, B, N, Li, and O atoms are shown as gray, pink, blue, purple, and red spheres. | |
To investigate the effect of discharge product cluster size on the results, the activation barriers for Li removal from Li4O4 and the formation of Li3O4 on the reference B-BNGP were also calculated (Fig. 11c and d). For the Li4O4 cluster, two decomposition pathways were considered. In the first pathway, the migration of a Li atom located at the center of the cluster toward a neighboring site in the upper region of the cluster was examined. In the second pathway, the migration of a Li atom located at the edge of the cluster toward a neighboring site in the same direction was investigated. The results indicate that Li removal requires 2.026 and 1.769 eV for the first and second pathways, respectively. The lowest activation barrier corresponds to the second pathway, showing a reduction of 0.257 eV compared to the first pathway. This difference can be explained by the Hirshfeld charge analysis of the Li4O4 cluster, where edge Li atoms, due to their lower positive charge, interact more weakly with the surrounding environment, requiring less energy for removal. Therefore, the size of LixO2y clusters can directly influence the activation barrier of the decomposition process.
3.6. Stability characterization
Electrolyte stability during charge/discharge and the formation of Li2CO3 side products are key factors that can limit the long-term cyclability of Li–O2 batteries. Studies have shown that O–O bond cleavage in ORR intermediates can provide a pathway for the formation of CO3 groups.92 To theoretically investigate this phenomenon on GP-based catalysts, the growth of CO3 groups during the ORR process was examined on the surfaces of optimized structures along the most probable pathways (Fig. 5). The results indicate that throughout the growth process, no O–O bond breaking occurs and the structures remain stable, such that CO3 group formation is not feasible even in the presence of oxygen. However, non-aqueous Li–O2 batteries often operate in electrolyte environments containing molecules such as DMSO.93,94 To study the energy profiles and stability, B-BNGP was chosen as a reference system under DMSO electrolyte conditions, and its effect on electrolyte decomposition was investigated using an implicit solvation model. The adsorption energy of the solvent on the B-BNGP surface was calculated using the following formula:| | | Eads(solvent) = Etotal − Ecatalyst − Esolvent | (21) |
where Etotal, Ecatalyst, and Esolvent denote the total energy of DMSO adsorbed on B-BNGP, the energy of the pristine B-BNGP, and the energy of an isolated DMSO molecule in the cell, respectively. Comparison of the optimized configuration in the presence and absence of DMSO (Table 3) shows only minor energy differences.
Table 3 Calculated total energy of the B-BNGP nanosheet under solvent-free conditions (Etot), in DMSO (Etot-DMSO), and the adsorption energy of a DMSO molecule in horizontal (Eads-DMSO-H) and vertical (Eads-DMSO-V) orientations on the surface
| Surface |
E
tot (eV) |
E
tot-DMSO (eV) |
E
ads-DMSO-H (eV) |
E
ads-DMSO-V (eV) |
| B-BNGP |
−49809.290 |
−49809.346 |
−0.282 |
−0.189 |
The adsorption of DMSO in H and V orientations (Fig. 12a, b and Table 3) exhibits a distance of approximately 3 Å and near-zero adsorption energy, indicating weak physical interaction. Moreover, the DMSO molecule remains stable on these structures, indicating the absence of electrolyte decomposition. Hirshfeld charge analysis (Fig. 12a and b) also reveals only negligible charge transfer, confirming the lack of chemical interaction between the substrate and DMSO. Furthermore, AIMD simulations in the NVT ensemble at 300 K were performed for 5 ps to investigate the behavior of B-BNGP in a DMSO electrolyte environment. After 5 ps, B-BNGP remained stable, with no geometric reconstruction, bond cleavage, or decomposition of DMSO molecules observed in the structure (Fig. 12c). The fluctuations of total energy and temperature over time are presented in Fig. 12d. The total energy stabilizes around a constant value after initial transient fluctuations (2.01 ps), while the temperature remains nearly constant throughout the simulation. These results confirm the dynamic and thermal stability of B-BNGP and indicate a reduced propensity for electrolyte decomposition and carbonate formation on B-BNGP under the present theoretical framework.
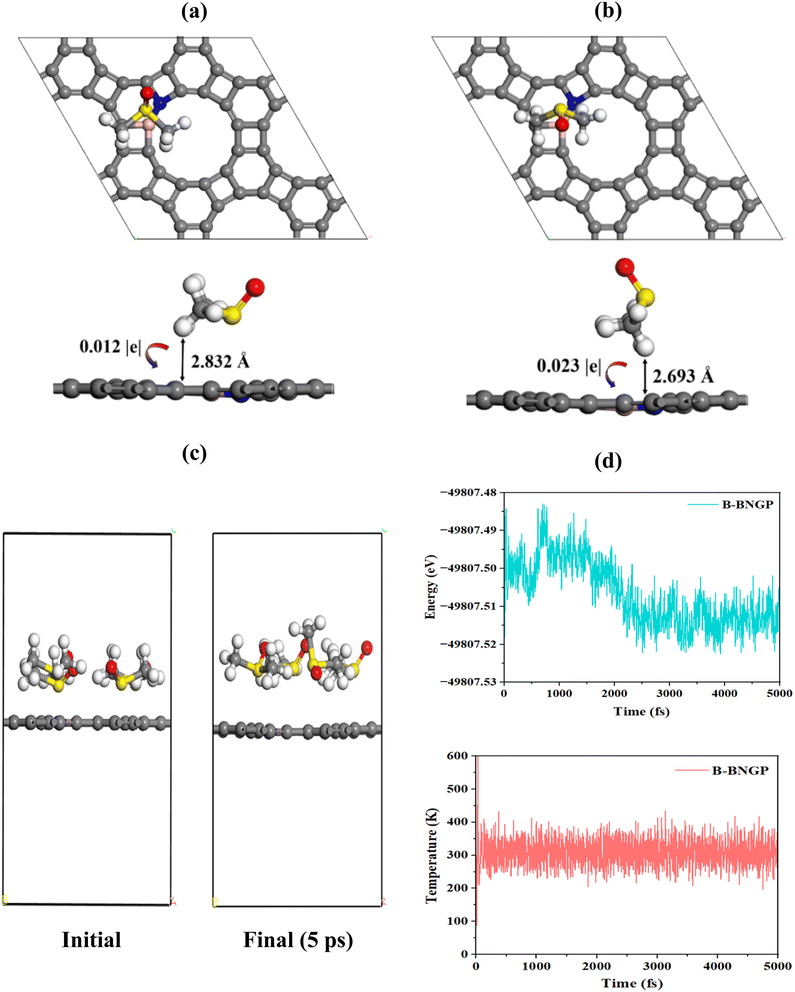 |
| | Fig. 12 Interaction of DMSO with B-BNGP: (a and b) optimized adsorption structures of the DMSO molecule in H and V orientations, with the transferred charge and shortest distance to the surface indicated by black arrows; (c) initial and final configurations from AIMD simulation of the B-BNGP structure, at 300 K and 5 ps under DMSO electrolyte conditions; (d) variations of energy and temperature convergence as a function of time. | |
3.7. Comparison to other catalysts
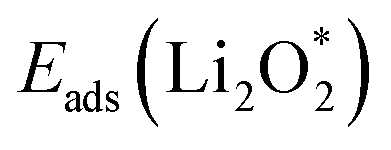
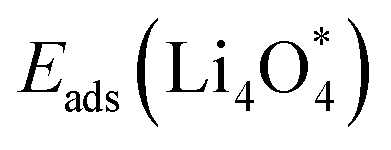
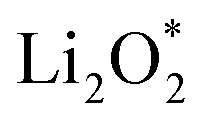
For an efficient catalyst, minimal charge/discharge overpotential, high capacity, and good ionic/electronic transport are essential. Overpotential reflects the reversible performance of the battery with the employed catalyst. This section provides a qualitative comparison of GP-based structures with other catalysts. Before comparing predicted overpotentials, the impact of computational parameters must be considered. Since there are no standardized guidelines for applied potential and k-mesh, the results in Table 4 should not be interpreted literally, as methodological differences may cause discrepancies. Previous studies indicate that due to current density dependence, electrolyte effects, and thermal vibrations, absolute discharge, charge, and overpotential values should not be directly compared to experiments and can only be considered as lower bounds.95Table 4 compares the adsorption energies of the final products  and
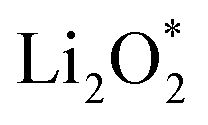
and  together with the calculated overpotentials obtained in this work with those reported for a range of representative catalysts in non-aqueous Li–O2 batteries, including high-surface-area 2D carbon materials such as graphene and modified graphene, biphenylene networks, and NC3-based structures and selected non-carbon 2D materials such as phosphorene. Among these systems, GP shares the closest similarity to graphene and biphenylene in terms of its fully sp2-hybridized carbon framework and 2D nature, while exhibiting distinct behavior arising from its intrinsic in-plane porosity and structural organization. Unlike graphene and most of its doped derivatives, which are inherently nonporous and rely primarily on defect engineering or heteroatom doping to induce catalytic activity, GP intrinsically possesses uniform and accessible pores. This feature enables direct and stable interactions with LixO2y intermediates and contributes to an appropriate tuning of adsorption energies and intermediate stability along the reaction pathway. In addition to these structural differences, GP is electronically distinct from many reported porous carbon substrates with larger band gaps, such as graphdiyne and graphyne. The presence of a narrow direct band gap in GP leads to a different electronic density distribution and allows for more effective electronic interactions with oxygen species and Li-containing compounds without the need for multihybridized or heterogeneous frameworks. Therefore, the favorable electrochemical performance of GP-based catalysts observed in Table 4 is not limited solely to the numerical reduction of the overpotential; rather, the negative adsorption energies of
  and
and  also indicate the adequate stability of the reaction species and fundamental differences in the structural and electronic nature of this substrate. The combination of these features enhances intermediate stability, facilitates Li/O2 transport, and lowers kinetic barriers in the ORR/OER processes, highlighting GP as a distinctive cathode platform for non-aqueous Li–O2 batteries.
Table 4 Comparison of adsorption energies (eV) and ORR/OER overpotentials (V) for various cathode catalysts reported in this work and the literature
| Catalyst |

|

|
η
ORR
|
η
OER
|
η
TOT
|
Reference |
| Pristine GP |
−4.691 |
−10.390 |
0.40 |
0.96 |
1.36 |
This work |
| BGP |
−5.018 |
−11.316 |
0.42 |
0.93 |
1.35 |
This work |
| NGP |
−4.537 |
−10.332 |
0.45 |
0.77 |
1.22 |
This work |
| B-BNGP |
−4.956 |
−10.492 |
0.28 |
0.29 |
0.57 |
This work |
| S1-BNGP |
−5.222 |
−10.848 |
0.42 |
0.65 |
1.08 |
This work |
| S2-BNGP |
−5.417 |
−11.018 |
0.28 |
0.29 |
0.58 |
This work |
| Graphene |
— |
— |
1.35 |
2.16 |
3.51 |
44
|
| Graphene |
−1.70 |
−1.98 |
1.25 |
— |
— |
45
|
| N-graphene |
— |
— |
1.97 |
1.60 |
3.57 |
44
|
| N-graphene |
−1.37 |
−2.04 |
0.89–1.66 |
— |
— |
45
|
| B-graphene |
— |
— |
1.28 |
1.26 |
2.54 |
44
|
| BN-graphene |
— |
— |
1.39–1.40 |
1.61–1.69 |
3–3.09 |
44
|
| SWG |
−1.04 |
−0.66 |
0.41 |
0.36 |
0.77 |
51
|
| N-SWG |
−2.51 |
−4.06 |
1.27 |
0.60 |
1.87 |
51
|
| B-SWG |
−2.74 |
−3.92 |
1.06 |
0.64 |
1.70 |
51
|
| BN-SWG |
−2.09 |
−1.74 |
0.23 |
0.29 |
0.52 |
51
|
| Biphenylene |
— |
— |
0.90 |
1.47 |
2.37 |
53
|
| B-biphenylene |
— |
— |
0.74 |
1.57 |
2.31 |
53
|
| N-biphenylene |
— |
— |
0.76 |
0.80 |
1.56 |
53
|
| NC3 |
−3.98 |
−9.13 |
0.37 |
0.95 |
1.32 |
32
|
| C2N |
−5.94 |
−11.67 |
0.36 |
0.64 |
1.00 |
96
|
| Phosphorene |
−3.66 |
−12.13 |
1.44 |
2.63 |
4.07 |
13
|
| SiSe2 |
−3.66 |
−8.14 |
0.46 |
0.39 |
0.85 |
29
|
| Si2Se2 |
−3.61 |
−8.67 |
0.65 |
0.64 |
1.29 |
29
|
4. Conclusions
In summary, first-principles calculations were performed to evaluate the catalytic potential of pristine GP, BGP, NGP, B-BNGP, S1-BNGP, and S2-BNGP nanosheets as metal-free cathode electrocatalysts in rechargeable non-aqueous Li–O2 batteries. Among these, B-BNGP, with the lowest formation energy (−0.916 eV), is the most stable structure, even more stable than graphene. Electron density maps indicate that simultaneous B and N co-doping enhances ORR/OER activity by increasing active sites and improving electronic distribution. Two nucleation pathways (leading to Li4O4 and Li4O2) and corresponding free energy diagrams were analyzed to elucidate the discharge/charge mechanism and final products, revealing Li4O4 as thermodynamically favored. Discharge/charge voltages lie within a safe range, preventing electrolyte decomposition. B-BNGP exhibits the lowest discharge/charge overpotentials (0.280 and 0.293 eV), making it the most efficient cathodic catalyst. Adsorption patterns in the RDS serve as overpotential descriptors, with lower adsorption energy correlating with reduced overpotentials. Electronic analysis shows improved conductivity after intermediate adsorption. Taking B-BNGP as the reference, the activation barriers for catalytic decomposition of Li2O2 and Li4O4 were 1.627 and 1.769 eV, respectively, compared to 2.06 eV for Li2O2 on graphene, yielding a 1.9 × 10⁷-fold increase in the reaction rate. Stability simulations in a DMSO environment indicate that B-BNGP can mitigate the tendency toward Li2CO3 formation and electrolyte degradation, thereby contributing to enhanced cycling durability. Overall, these results provide comprehensive insights for designing efficient dual-function metal-free cathode catalysts for the ORR/OER in non-aqueous Li–O2 batteries.
Author contributions
Sima Roshan: data curation, software, investigation, formal analysis, writing – original draft, visualization. Adel Reisi-Vanani: conceptualization, supervision, project administration, writing – review & editing.
Conflicts of interest
There are no conflicts of interest to declare.
Data availability
The data supporting this article have been included as part of the supplementary information (SI). Supplementary information is available. See DOI: https://doi.org/10.1039/d5ta09080f.
Acknowledgements
This work was supported by the University of Kashan (grant no. 1392058/1). The authors are grateful for this support.
References
- G. Girishkumar, B. McCloskey, A. C. Luntz, S. Swanson and W. Wilcke, J. Phys. Chem. Lett., 2010, 1, 2193–2203 Search PubMed.
- J. B. Goodenough and K.-S. Park, J. Am. Chem. Soc., 2013, 135, 1167–1176 Search PubMed.
- K. Abraham and Z. Jiang, J. Electrochem. Soc., 1996, 143, 1 CrossRef CAS.
- T. Ogasawara, A. Débart, M. Holzapfel, P. Novák and P. G. Bruce, J. Am. Chem. Soc., 2006, 128, 1390–1393 Search PubMed.
- W.-J. Kwak, Rosy, D. Sharon, C. Xia, H. Kim, L. R. Johnson, P. G. Bruce, L. F. Nazar, Y.-K. Sun, A. A. Frimer, M. Noked, S. A. Freunberger and D. Aurbach, Chem. Rev., 2020, 120, 6626–6683 Search PubMed.
- X. Zhao, F. Gu, Y. Wang, Z. Peng and J. Liu, ACS Appl. Mater. Interfaces, 2020, 12, 27166–27175 Search PubMed.
- Z. Wu, Y. Tian, H. Chen, L. Wang, S. Qian, T. Wu, S. Zhang and J. Lu, Chem. Soc. Rev., 2022, 51, 8045–8101 Search PubMed.
- Y. Zhou and S. Guo, eScience, 2023, 3, 100123 Search PubMed.
- N. Mahne, O. Fontaine, M. O. Thotiyl, M. Wilkening and S. A. Freunberger, Chem. Sci., 2017, 8, 6716–6729 RSC.
- J. Lu, L. Li, J.-B. Park, Y.-K. Sun, F. Wu and K. Amine, Chem. Rev., 2014, 114, 5611–5640 CrossRef CAS PubMed.
- T. Liu, J. P. Vivek, E. W. Zhao, J. Lei, N. Garcia-Araez and C. P. Grey, Chem. Rev., 2020, 120, 6558–6625 Search PubMed.
- C. Tan, D. Cao, L. Zheng, Y. Shen, L. Chen and Y. Chen, J. Am. Chem. Soc., 2022, 144, 807–815 Search PubMed.
- L. Kavalsky, S. Mukherjee and C. V. Singh, ACS Appl. Mater. Interfaces, 2018, 11, 499–510 CrossRef PubMed.
- M. D. Radin, J. F. Rodriguez, F. Tian and D. J. Siegel, J. Am. Chem. Soc., 2012, 134, 1093–1103 Search PubMed.
- Y.-C. Lu, Z. Xu, H. A. Gasteiger, S. Chen, K. Hamad-Schifferli and Y. Shao-Horn, J. Am. Chem. Soc., 2010, 132, 12170–12171 CrossRef CAS PubMed.
- Y.-C. Lu, H. A. Gasteiger and Y. Shao-Horn, J. Am. Chem. Soc., 2011, 133, 19048–19051 Search PubMed.
- S. Tong, M. Zheng, Y. Lu, Z. Lin, J. Li, X. Zhang, Y. Shi, P. He and H. Zhou, J. Mater. Chem. A, 2015, 3, 16177–16182 Search PubMed.
- Z. Liu, L. R. De Jesus, S. Banerjee and P. P. Mukherjee, ACS Appl. Mater. Interfaces, 2016, 8, 23028–23036 Search PubMed.
- L. Shi, T. Zhao, A. Xu and Z. Wei, ACS Catal., 2016, 6, 6285–6293 Search PubMed.
- J.-H. Li, J. Wu and Y.-X. Yu, J. Phys. Chem. C, 2020, 124, 9089–9098 Search PubMed.
- Y. Yang, J. Cui, J. Chen, J. Chen, Z. Tang, Q. Gao, Y. Zhang, Y. Sun and F. Xing, J. Phys. Chem. C, 2024, 128, 14621–14626 Search PubMed.
- Q. Li, R. Cao, J. Cho and G. Wu, Phys. Chem. Chem. Phys., 2014, 16, 13568–13582 Search PubMed.
- Q. Wu, S. Shen, R. Peng, B. Huang, Y. Dai and Y. Ma, J. Mater. Chem. A, 2021, 9, 16998–17005 Search PubMed.
- Z. Yin, L. Xiong and N. Q. Su, J. Chem. Theory Comput., 2024, 20, 8229–8236 Search PubMed.
- Y.-X. Yu, J. Phys. Chem. C, 2018, 123, 205–213 CrossRef.
- Y. Yang, M. Yao, X. Wang and H. Huang, J. Phys. Chem. C, 2019, 123, 17466–17471 Search PubMed.
- Y. Yang, J. Chen, J. Tang, F. Xing and M. Yao, J. Phys. Chem. C, 2021, 125, 21453–21459 Search PubMed.
- J. Wang, H. Wu, M. Pan, Z. Liu, L. Han, Z. Huang and H. Deng, Phys. Chem. Chem. Phys., 2023, 25, 15030–15039 Search PubMed.
- J. Wang, K. Zhang, M. Pan, Z. Liu and H. Deng, J. Phys. Chem. C, 2023, 127, 21033–21046 CrossRef CAS.
- J. Guo, Y. Yao, Y. Liu, L. Ma, J. Cao and X. Wei, Appl. Surf. Sci., 2025, 684, 161920 Search PubMed.
- D. Zhai, H.-H. Wang, J. Yang, K. C. Lau, K. Li, K. Amine and L. A. Curtiss, J. Am. Chem. Soc., 2013, 135, 15364–15372 CrossRef CAS PubMed.
- F. Zheng, H. Dong, Y. Ji and Y. Li, J. Power Sources, 2019, 436, 226845 CrossRef CAS.
- B. Sun, B. Wang, D. Su, L. Xiao, H. Ahn and G. Wang, Carbon, 2012, 50, 727–733 CrossRef CAS.
- J. Kang, J.-S. Yu and B. Han, J. Phys. Chem. Lett., 2016, 7, 2803–2808 Search PubMed.
- A. Mao, J. Li, J.-h. Li, H. Liu and C. Lian, J. Phys. Chem. Lett., 2024, 15, 5501–5509 Search PubMed.
- Y. Li, J. Wang, X. Li, D. Geng, M. N. Banis, R. Li and X. Sun, Electrochem. Commun., 2012, 18, 12–15 CrossRef CAS.
- G. Wu, N. H. Mack, W. Gao, S. Ma, R. Zhong, J. Han, J. K. Baldwin and P. Zelenay, ACS Nano, 2012, 6, 9764–9776 CrossRef CAS PubMed.
- C. Zhao, C. Yu, S. Liu, J. Yang, X. Fan, H. Huang and J. Qiu, Adv. Funct. Mater., 2015, 25, 6913–6920 CrossRef CAS.
- S. Ding, X. Yu, Z.-F. Ma and X. Yuan, J. Mater. Chem. A, 2021, 9, 8160–8194 RSC.
- J. S. Hummelshøj, J. Blomqvist, S. Datta, T. Vegge, J. Rossmeisl, K. S. Thygesen, A. C. Luntz, K. W. Jacobsen and J. K. Nørskov, J. Chem. Phys., 2010, 132, 071101 CrossRef PubMed.
- V. Viswanathan, K. S. Thygesen, J. S. Hummelshøj, J. K. Nørskov, G. Girishkumar, B. D. McCloskey and A. C. Luntz, J. Chem. Phys., 2011, 135, 214704 Search PubMed.
- X. Ren, J. Zhu, F. Du, J. Liu and W. Zhang, J. Phys. Chem. C, 2014, 118, 22412–22418 CrossRef CAS.
- X. Ren, B. Wang, J. Zhu, J. Liu, W. Zhang and Z. Wen, Phys. Chem. Chem. Phys., 2015, 17, 14605–14612 Search PubMed.
- H. R. Jiang, T. S. Zhao, L. Shi, P. Tan and L. An, J. Phys. Chem. C, 2016, 120, 6612–6618 Search PubMed.
- Y. Jing and Z. Zhou, ACS Catal., 2015, 5, 4309–4317 Search PubMed.
- X. Yi, X. Liu, R. Dou, Z. Wen and W. Zhou, J. Phys. Chem. C, 2021, 125, 22570–22580 CrossRef CAS.
- S. Wang, L. Zhang, Z. Xia, A. Roy, D. W. Chang, J. B. Baek and L. Dai, Angew. Chem., Int. Ed., 2012, 51, 4209–4212 CrossRef CAS PubMed.
- C. H. Choi, M. W. Chung, H. C. Kwon, S. H. Park and S. I. Woo, J. Mater. Chem. A, 2013, 1, 3694–3699 Search PubMed.
- Y. Zhao, L. Yang, S. Chen, X. Wang, Y. Ma, Q. Wu, Y. Jiang, W. Qian and Z. Hu, J. Am. Chem. Soc., 2013, 135, 1201–1204 CrossRef CAS PubMed.
- J. Zhang, X. Chen, Y. Lei, H. Lu, J. Xu, S. Wang, M. Yan, F. Xiao and J. Xu, Chem. Eng. J., 2022, 428, 131025 CrossRef CAS.
- Y. Yao, J. Cao, W. Yin, Q. Zhang, L. Yang and X. Wei, J. Phys. Chem. C, 2021, 125, 4363–4370 CrossRef CAS.
- X. Zhang, J. Tian, Y. Wang, S. Guo and Y. J. N. R. Li, Nano Res., 2024, 17, 3982–3987 Search PubMed.
- C. Guo, X. Zhang, Y. Wang and Y. Li, ChemPhysChem, 2023, 24, e202300531 Search PubMed.
- H. Dong, Y. Ji, T. Hou and Y. Li, Carbon, 2018, 126, 580–587 CrossRef CAS.
- A. Balaban, C. C. Rentia and E. Ciupitu, Rev. Roum. Chim., 1968, 13, 231–247 Search PubMed.
- Q. Song, B. Wang, K. Deng, X. Feng, M. Wagner, J. D. Gale, K. Müllen and L. Zhi, J. Mater. Chem. C, 2013, 1, 38–41 Search PubMed.
- G. Brunetto, P. Autreto, L. Machado, B. Santos, R. P. Dos Santos and D. S. Galvao, J. Phys. Chem. C, 2012, 116, 12810–12813 CrossRef CAS.
- Q.-S. Du, P.-D. Tang, H.-L. Huang, F.-L. Du, K. Huang, N.-Z. Xie, S.-Y. Long, Y.-M. Li, J.-S. Qiu and R.-B. Huang, Sci. Rep., 2017, 7, 40796 CrossRef CAS PubMed.
- W. Liu, M.-s. Miao and J.-y. Liu, RSC Adv., 2015, 5, 70766–70771 RSC.
- C. Zhang, C. Hou, Y. Lu, L. Zhao, H. Wu, H. Song, J. Rong, L. Yu and X. Yu, Phys. Chem. Chem. Phys., 2023, 25, 31301–31311 Search PubMed.
- M. Hankel and D. J. Searles, Phys. Chem. Chem. Phys., 2016, 18, 14205–14215 Search PubMed.
- T. Hussain, M. Hankel and D. J. Searles, J. Phys. Chem. C, 2017, 121, 14393–14400 CrossRef CAS.
- Y. Tang, W. Chen, H. Zhang, Z. Wang, D. Teng, Y. Cui, Z. Feng and X. Dai, Phys. Chem. Chem. Phys., 2020, 22, 16224–16235 Search PubMed.
-
N. F. Martins, G. S. L. Fabris, A. R. Albuquerque, R. Paupitz and J. R. Sambrano, Research Topics in Bioactivity, Environment and Energy, 2022, pp. 209–230 Search PubMed.
- K. Boezar, A. Reisi-Vanani and M. Dehkhodaei, Int. J. Hydrogen Energy, 2021, 46, 38370–38380 Search PubMed.
- Y.-X. Yu, J. Mater. Chem. A, 2013, 1, 13559 RSC.
- C. Xu and X. Luo, ACS Appl. Energy Mater., 2022, 5, 4970–4975 CrossRef CAS.
- B. Delley, J. Chem. Phys., 2000, 113, 7756–7764 CrossRef CAS.
- J. P. Perdew, K. Burke and M. Ernzerhof, Phys. Rev. Lett., 1996, 77, 3865 CrossRef CAS PubMed.
- S. Grimme, J. Comput. Chem., 2006, 27, 1787–1799 Search PubMed.
- B. Delley, Phys. Rev. B, 2002, 66, 155125 Search PubMed.
- X. Liu, Z. Wang, Y. Tian and J. Zhao, J. Phys. Chem. C, 2020, 124, 3722–3730 CrossRef CAS.
- A. Klamt and G. Schüürmann, J. Chem. Soc., Perkin Trans., 1993, 2, 799–805 RSC.
- N. Govind, M. Petersen, G. Fitzgerald, D. King-Smith and J. Andzelm, Comput. Mater. Sci., 2003, 28, 250–258 CrossRef CAS.
- L. Wang, T. Maxisch and G. Ceder, Phys. Rev. B, 2006, 73, 195107 Search PubMed.
- J. Zhu, X. Ren, J. Liu, W. Zhang and Z. Wen, ACS Catal., 2015, 5, 73–81 Search PubMed.
- J. S. Hummelshøj, A. C. Luntz and J. K. Nørskov, J. Chem. Phys., 2013, 138, 034703 Search PubMed.
-
W. M. Haynes, CRC Handbook of Chemistry and Physics, CRC press, 2016 Search PubMed.
- F. L. J. T. c. a. Hirshfeld, Theor. Chim. Acta, 1977, 44, 129–138 CrossRef CAS.
-
E. Hajialilou, A. Rezanezhad, M. B. Hanif and M. Motola, in Handbook of Functionalized Carbon Nanostructures, 2024, pp. 577–613 Search PubMed.
- L. F. Kremer and R. J. Baierle, Diamond Relat. Mater., 2024, 141, 110689 CrossRef CAS.
- G. Li, Y. Li, H. Liu, Y. Guo, Y. Li and D. Zhu, Chem. Commun., 2010, 46, 3256–3258 Search PubMed.
- H. Khalfoun, P. Hermet, L. Henrard and S. Latil, Phys. Rev. B: Condens. Matter Mater. Phys., 2010, 81, 193411 CrossRef.
- H.-D. Lim, B. Lee, Y. Bae, H. Park, Y. Ko, H. Kim, J. Kim and K. Kang, Chem. Soc. Rev., 2017, 46, 2873–2888 Search PubMed.
- Z. Lyu, Y. Zhou, W. Dai, X. Cui, M. Lai, L. Wang, F. Huo, W. Huang, Z. Hu and W. Chen, Chem. Soc. Rev., 2017, 46, 6046–6072 Search PubMed.
- D. Sharon, V. Etacheri, A. Garsuch, M. Afri, A. A. Frimer and D. Aurbach, J. Phys. Chem. Lett., 2013, 4, 127–131 Search PubMed.
- L. Johnson, C. Li, Z. Liu, Y. Chen, S. A. Freunberger, P. C. Ashok, B. B. Praveen, K. Dholakia, J.-M. Tarascon and P. G. Bruce, Nat. Chem., 2014, 6, 1091–1099 CrossRef CAS PubMed.
- A. Lee, D. Krishnamurthy and V. Viswanathan, ChemSusChem, 2018, 11, 1911–1918 CrossRef CAS PubMed.
- H.-K. Lim, H.-D. Lim, K.-Y. Park, D.-H. Seo, H. Gwon, J. Hong, W. A. Goddard III, H. Kim and K. Kang, J. Am. Chem. Soc., 2013, 135, 9733–9742 CrossRef CAS PubMed.
- D. G. Kwabi, M. Tułodziecki, N. Pour, D. M. Itkis, C. V. Thompson and Y. Shao-Horn, J. Phys. Chem. Lett., 2016, 7, 1204–1212 Search PubMed.
- S. Ganapathy, B. D. Adams, G. Stenou, M. S. Anastasaki, K. Goubitz, X.-F. Miao, L. F. Nazar and M. Wagemaker, J. Am. Chem. Soc., 2014, 136, 16335–16344 CrossRef CAS PubMed.
- H. R. Jiang, P. Tan, M. Liu, Y. K. Zeng and T. S. Zhao, J. Phys. Chem. C, 2016, 120, 18394–18402 CrossRef CAS.
- D. Xu, Z.-l. Wang, J.-j. Xu, L.-l. Zhang and X.-b. Zhang, Chem. Commun., 2012, 48, 6948–6950 RSC.
- B. D. Adams, R. Black, Z. Williams, R. Fernandes, M. Cuisinier, E. J. Berg, P. Novak, G. K. Murphy and L. F. Nazar, Adv. Energy Mater., 2015, 5, 1400867 Search PubMed.
- A. Kulkarni, S. Siahrostami, A. Patel and J. K. Nørskov, Chem. Rev., 2018, 118, 2302–2312 Search PubMed.
- P. Das, A. Ghosh, B. Goswami and P. Sarkar, J. Mater. Chem. A, 2025, 13, 6376–6384 Search PubMed.
|
| This journal is © The Royal Society of Chemistry 2026 |
Click here to see how this site uses Cookies. View our privacy policy here. 

 a and
Adel
Reisi-Vanani
a and
Adel
Reisi-Vanani






 or
or  . To thermodynamically investigate the nucleation process and the adsorption of Li or O2, seven distinct sites, shown in (Fig. 1), were considered. In addition, for O2 adsorption, horizontal (H) and vertical (V) orientations were examined. Only the results for the most stable configurations are presented in Fig. 4, and their corresponding adsorption data are shown in Table 2. Data for other adsorption sites are reported in Tables S3 and S4.





 and
and 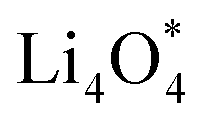 together with the calculated overpotentials obtained in this work with those reported for a range of representative catalysts in non-aqueous Li–O2 batteries, including high-surface-area 2D carbon materials such as graphene and modified graphene, biphenylene networks, and NC3-based structures and selected non-carbon 2D materials such as phosphorene. Among these systems, GP shares the closest similarity to graphene and biphenylene in terms of its fully sp2-hybridized carbon framework and 2D nature, while exhibiting distinct behavior arising from its intrinsic in-plane porosity and structural organization. Unlike graphene and most of its doped derivatives, which are inherently nonporous and rely primarily on defect engineering or heteroatom doping to induce catalytic activity, GP intrinsically possesses uniform and accessible pores. This feature enables direct and stable interactions with LixO2y intermediates and contributes to an appropriate tuning of adsorption energies and intermediate stability along the reaction pathway. In addition to these structural differences, GP is electronically distinct from many reported porous carbon substrates with larger band gaps, such as graphdiyne and graphyne. The presence of a narrow direct band gap in GP leads to a different electronic density distribution and allows for more effective electronic interactions with oxygen species and Li-containing compounds without the need for multihybridized or heterogeneous frameworks. Therefore, the favorable electrochemical performance of GP-based catalysts observed in Table 4 is not limited solely to the numerical reduction of the overpotential; rather, the negative adsorption energies of
  and
and 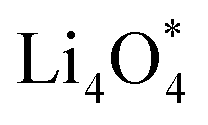 also indicate the adequate stability of the reaction species and fundamental differences in the structural and electronic nature of this substrate. The combination of these features enhances intermediate stability, facilitates Li/O2 transport, and lowers kinetic barriers in the ORR/OER processes, highlighting GP as a distinctive cathode platform for non-aqueous Li–O2 batteries.