DOI:
10.1039/D6RA02469F
(Paper)
RSC Adv., 2026,
16, 27701-27706
Unveiling the microstructures and electronic features of a trivalent chromium-doped yttrium oxide crystal: a first-principles study
Received
25th March 2026
, Accepted 3rd May 2026
First published on 22nd May 2026
Abstract
Transition-metal-doped yttrium oxide is highly efficient in generating light from the visible to near-infrared region with excellent physical stability. Thus, it is a significant activator in various solid-state laser materials. However, we still lack a first-principles study on the microstructures and electronic features of the complexes. To address this gap, here, we provide a detailed theoretical analysis of the Cr3+-doped Y2O3 (Y2O3:Cr) crystal. Based on the density functional theory combined CALYPSO structural search method, the stable structures of the Y2O3:Cr system are successfully identified, including the ground-state structure and the first four metastable isomers. A novel cage-like configuration of Y2O3:Cr is reported for the first time. The good agreement between the simulated and experimental X-ray diffraction patterns demonstrates the reliability of the structure. The results of the electronic band structure calculations reveal that the band gap of Y2O3:Cr decreases to 3.23 eV compared to that of pure Y2O3. This is caused by introducing the 3d states of the impurity Cr3+ ion in electronic density of states. By calculating the electron localization function (ELF), we find that the Cr–O bonds in the Y2O3:Cr crystal are conclusively ionic. These results could provide important information for understanding the microstructures of transition-metal-doped materials.
1 Introduction
New materials have gained widespread interest due to their unique structures and outstanding properties. Yttrium oxide (Y2O3) is an excellent optical host crystal with high density, corrosion resistance, melting point and refractive index.1–3 Y2O3 doped with metals exhibit high luminescence efficiency and excellent chemical and thermal stabilities, making it a prime candidate among oxide-based phosphors for many practical applications.4–7 Transition-metal-ion-doped Y2O3 semiconducting nanophosphors also possess wide band gaps, high dielectric constants, and optical isotropy. Since the first demonstration of a Y2O3:Cr laser in 1960, the Cr3+ ion has been recognized as a significant activator in solid-state laser materials.8 The incorporation of a Cr3+ ion into host Y2O3 nanophosphors influences their structure, morphology and optical properties.9 Currently, the Cr3+-doped Y2O3 (Y2O3:Cr) crystal has a wide range of applications in various fields. Recent studies have demonstrated quantum cutting (QC) down-conversion to Yb3+ infrared emission for light in the 230–500 nm range in Y2O3:Cr, offering potential for improved solar cell efficiency.10 In addition, Y2O3:Cr nanophosphors offer potential for the generation of artificial vertical daylight and for application in white light-emitting diodes (WLEDs).9
Kumar et al.9 investigated the photoluminescence (PL) of Y2O3:Cr3+ nanophosphors to verify their feasibility for application in WLEDs. Their analysis of the powder X-ray diffraction (PXRD) patterns revealed that with increasing Cr3+ concentrations (0.5–9 mol%), the diffraction peaks of Y2O3:Cr broadened and shifted to lower angles. This result indicated a morphological evolution in Y2O3:Cr (0.5 mol%) nanophosphors. As the Cr3+ concentration increased, the structures transitioned from core–shell structures to nanosheets, nanocones, agglomerated nanoflowers, nanoflowers and finally to nanospheres. In addition, two peaks were identified at 361 nm and 419 nm in the excitation spectra (360–420 nm), which could be attributed to the 6H15/2 → 4P7/2 and 6H15/2 → 4M21/2 transitions, respectively.9 Zhang et al.11 prepared transparent Y2O3:Cr (0–0.7 at%) ceramics by vacuum sintering. Based on XRD pattern analysis and the mean grain size dependence of mechanical parameters, they systematically studied how Cr3+ concentration affects sintering and mechanical properties. They found that relative density and grain size decreased in Y2O3 samples with increasing Cr3+ concentration.11 Wu et al.10 reported that doping Cr3+ introduces a broad visible-region photoluminescence excitation (PLE) band, demonstrating an efficient energy transfer (ET) from Cr3+ to the Pr3+/Yb3+ quantum cutting (QC) couple.10 Their results could enhance c-Si solar cell efficiency. These studies have shown a close relationship between microstructures and their optical properties. To the best of our knowledge, a comprehensive investigation on the structural evolution and electronic properties of Y2O3:Cr is still lacking.
In order to overcome this shortage, we carry out a systematic study on the stable structures and electronic features of the Y2O3:Cr crystal. The crystal structure analysis by particle swarm optimization (CALYPSO) method is used for identifying the ground state structure and many low-lying metastable isomers. The electronic properties of the ground state structure are analyzed in detail. The selected features consist of the structural characteristics and stabilities, electronic band structures, total and partial density of states, and electron localization functions of Y2O3:Cr.
2 Computational details
We employ the CALYPSO method for the crystal structure predictions of the Y2O3:Cr system.12–14 The CALYPSO method is well-established for predicting stable crystal structures by solely depending on chemical compositions. It has been successfully applied to a wide variety of crystal systems.15–17 The structural search methodology is described in detail in our earlier publications.18–20 In order to achieve a typical concentration of the impurity Cr3+ ions in the Y2O3 host crystal, the chemical composition is maintained at Cr![[thin space (1/6-em)]](https://www.rsc.org/images/entities/char_2009.gif) :Y:O = 1:31:48, and the unit cell contains up to 80 atoms. This effective concentration makes the comparative study between theoretical calculations and experimental results feasible. In the structural prediction, each prediction cycle includes 30 structures per generation, with some structures originating from the particle swarm operation and others being generated from random initialization. The evolutionary process runs for 40 generations until a structural convergence is achieved. Furthermore, the candidate's ground state structures are geometrically optimized. We performed ab initio structural relaxations and electronic property calculations based on density functional theory (DFT) using the Vienna ab initio simulation package (VASP), employing the Perdew–Burke–Ernzerhof (PBE) generalized gradient approximation (GGA) exchange–correlation functional.21–23 The projector-augmented wave (PAW) method is employed with the valence electron configurations of 3s23p63d54s1 for Cr, 4d15s2 for Y and 2s22p4 for O. To ensure that the enthalpy converges within 1 meV per atom, the plane-wave cutoff energy is set to 500 eV and fine Monkhorst–Pack k meshes are employed. Phonon dispersion curves are simulated by employing the supercell approach in the PHONOPY code.24 To elucidate the bonding nature, the VASP code is employed for calculating the electron localization function (ELF)25,26 of Y2O3:Cr, and the VESTA software is used to visualize the resulting structures along with ELF isosurfaces.27
:Y:O = 1:31:48, and the unit cell contains up to 80 atoms. This effective concentration makes the comparative study between theoretical calculations and experimental results feasible. In the structural prediction, each prediction cycle includes 30 structures per generation, with some structures originating from the particle swarm operation and others being generated from random initialization. The evolutionary process runs for 40 generations until a structural convergence is achieved. Furthermore, the candidate's ground state structures are geometrically optimized. We performed ab initio structural relaxations and electronic property calculations based on density functional theory (DFT) using the Vienna ab initio simulation package (VASP), employing the Perdew–Burke–Ernzerhof (PBE) generalized gradient approximation (GGA) exchange–correlation functional.21–23 The projector-augmented wave (PAW) method is employed with the valence electron configurations of 3s23p63d54s1 for Cr, 4d15s2 for Y and 2s22p4 for O. To ensure that the enthalpy converges within 1 meV per atom, the plane-wave cutoff energy is set to 500 eV and fine Monkhorst–Pack k meshes are employed. Phonon dispersion curves are simulated by employing the supercell approach in the PHONOPY code.24 To elucidate the bonding nature, the VASP code is employed for calculating the electron localization function (ELF)25,26 of Y2O3:Cr, and the VESTA software is used to visualize the resulting structures along with ELF isosurfaces.27
3 Results and discussion
3.1 Crystal structures
With the chemical composition ratio of 1:31:48 for Cr/Y/O, the lowest energy structure of Y2O3:Cr including 80 atoms is successfully identified. The obtained geometric structure of Y2O3:Cr is plotted in Fig. 1. As shown in Fig. 1, the lowest energy structure possesses a novel cage-like configuration. The Cr3+ impurity concentration is equal to 3.125%. Compared with pure Y2O3, the crystal structure of Y2O3:Cr shows no significant distortion in geometric configuration. This result can be attributed to the fact that Cr3+ occupies an interstitial site in the host crystal lattice. We can see from Fig. 1 that the central Cr3+ ion is surrounded by six O atoms, forming a local [CrO6]9− structure. All Cr–O bonds have the same length of 2.073 Å. The bond distances are similar to the lengths of Nd–O in Y2O3:Nd.28 Compared to the local structure of [YO6]9−, the [CrO6]9− complex shows shorter bond lengths in Cr–O than those of Y–O bonds. The atomic coordinates of the ground state structure are listed in Table 1. It is found that the Cr3+ ion in the ground-state structure takes the 1b Wyckoff site (0.5, 0.5, −0.5). The impurity Cr3+ ion occupies the central site of the crystal lattice, forming a nearly perfect cage-like configuration. This result indicates the stability of the host crystal doped with Cr3. The structural parameters of Y2O3:Cr are summarized in Table 2. It can be observed from Table 2 that the ground state structure of Y2O3:Cr belongs to the R3 space group with a lattice constant of 10.496 Å. It possesses larger lattice parameters than pure Y2O3,28 which could be attributed to the differences in bond lengths between Cr–O and Y–O. The incorporation of impurity ions may lead to a lattice expansion. Although the short Cr–O bonds could result in a contracted [CrO6]9− local structure, the other Y–O bonds in the Y2O3:Cr crystal lattice can be affected by the received crystal impact and impurity doping. On the one hand, Y2O3:Cr belongs to R3 space group with a lattice constant of 10.49 Å, while the pure Y2O3 belongs to the standardized Ia![[3 with combining macron]](https://www.rsc.org/images/entities/char_0033_0304.gif) space group with a lattice constant of 10.46 Å.28 The difference in the lattice constants between these two crystals is relatively small. It should be pointed out that the doping of Cr3+ leads to a slight change in the crystal symmetry, which could inevitably result in structural differences. On the other hand, the Y–O bond lengths in Y2O3:Cr are calculated to be around 2.35 Å. This result may lead to an expanded [YO6]9− complex and a larger crystal lattice. Similar results are found for the Nd:YAB and Tm:YAB systems.19,29
space group with a lattice constant of 10.46 Å.28 The difference in the lattice constants between these two crystals is relatively small. It should be pointed out that the doping of Cr3+ leads to a slight change in the crystal symmetry, which could inevitably result in structural differences. On the other hand, the Y–O bond lengths in Y2O3:Cr are calculated to be around 2.35 Å. This result may lead to an expanded [YO6]9− complex and a larger crystal lattice. Similar results are found for the Nd:YAB and Tm:YAB systems.19,29
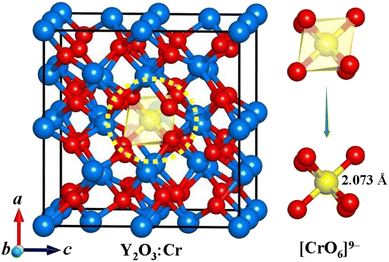 |
| | Fig. 1 Ground state structure of Y2O3:Cr. The red, blue and yellow spheres represent O, Y and Cr atoms, respectively. | |
Table 1 Coordinates of atoms for the ground state of Y2O3:Cr
| Crystal |
Atom |
x |
y |
z |
Wyckoff site symmetry |
| Y2O3:Cr |
Cr1 |
0.5 |
0.5 |
−0.5 |
1b |
| O1 |
−0.09885 |
0.64172 |
−0.12967 |
6f |
| O2 |
0.40224 |
1.13933 |
−0.62943 |
6f |
| O3 |
0.58396 |
0.3693 |
−0.62194 |
6f |
| O4 |
0.09837 |
0.85795 |
−0.12962 |
6f |
| O5 |
0.40249 |
0.85611 |
0.13025 |
6f |
| O6 |
−0.10221 |
0.35801 |
−0.37142 |
6f |
| O7 |
0.09897 |
1.14347 |
−0.37169 |
6f |
| O8 |
0.59669 |
0.64188 |
0.13209 |
6f |
| Y8 |
−0.25078 |
1.21883 |
0.00089 |
6f |
| Y9 |
−0.25216 |
0.77944 |
−0.49829 |
6f |
| Y10 |
0.25038 |
0.28239 |
−0.00158 |
6f |
| Y11 |
0.25527 |
0.71198 |
−0.49742 |
6f |
| Y1 |
0 |
0.5 |
0 |
3d |
| Y4 |
0.5 |
1 |
−0.5 |
3e |
| Y5 |
0 |
1 |
0 |
1a |
Table 2 Structural parameters, including a, b, c, and unit-cell volume, and relative energies for the ground state and metastable Y2O3:Cr
| |
Space group |
a (Å) |
b (Å) |
c (Å) |
V (Å3) |
ΔE (×10−3 eV) |
| Y2O3:Cr |
R3 |
10.49570 |
10.49570 |
10.49570 |
1156.2026 |
— |
| Isomer (a) |
R3 |
10.49560 |
10.49560 |
10.49560 |
1156.1695 |
0.113 |
| Isomer (b) |
P1 |
10.49561 |
10.49561 |
10.49561 |
1156.1730 |
0.146 |
| Isomer (c) |
P2 |
10.50970 |
10.48530 |
10.50170 |
1157.2463 |
0.409 |
| Isomer (d) |
P2 |
10.50970 |
10.48540 |
10.50170 |
1157.2573 |
0.410 |
Investigating the structural evolution is essential for obtaining a complete understanding of the system. Here, the first four metastable structures with low-lying energies are identified. The metastable isomers are shown in Fig. 2, which are labeled as (a), (b), (c) and (d) in the sequence of ascending energies. For isomer (a), the Cr3+ ion substitutes the Y3+ ions at eight vertex sites in the crystal lattice. This is different from the ground state structure. Table 2 summarizes the structural parameters and relative energies for these metastable structures. Notably, both isomer (a) and the ground state structure of Y2O3:Cr belong to the R3 space group. These two structures exhibit an extremely small energy difference. Although isomer (b) contains the same impurity concentration of Cr3+ ions as that in the ground state structure, it exhibits an obvious structural distortion. The Cr3+ ion takes the 1a Wyckoff site (0.75, 0.75, 025) instead of the central position. Isomer (b) crystallizes in the P2 space group. In isomer (c), the Cr3+ substitution site is similar to that of isomer (a). The energy of isomer (c) is higher than that of isomer (a) due to the different symmetric substituent positions in isomer (a). Isomers (d) and (c) crystallize in the same P2 space group with three distinct lattice parameters. As shown in Table 2, the unit cell volumes of these isomers could gradually increase with their energy.
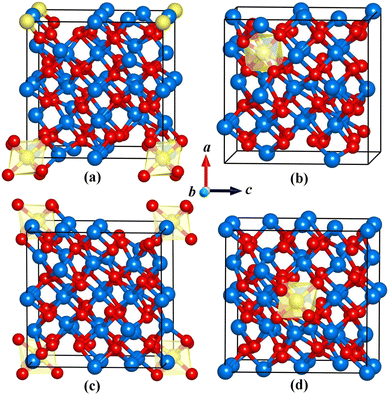 |
| | Fig. 2 Optimized structures of the metastable isomers (a), (b), (c) and (d) of Y2O3:Cr. | |
XRD analysis is widely used to explore crystal structures. To validate the reliability of the lowest energy structure we obtained, we calculated the XRD patterns and compared them with the experimental data.9 As shown in Fig. 3, the theoretical and experimental XRD patterns are in good agreement within 2θ = 15°–60°, particularly in terms of the positions and relative intensities of the main peaks. This result indicates the reliability of the obtained crystal structures and our calculation method. The observed variations in diffraction peak intensities may be attributed to the difference in concentrations between the theoretical model and the experimental sample. To assess the dynamical stability, the phonon spectrum of the ground state structure is calculated. If the phonon dispersion exhibits imaginary frequencies, a bad dynamical instability and potential phase transition are suggested. As shown in Fig. 4, the simulated phonon dispersion curves of Y2O3:Cr show no imaginary frequencies in the whole range, confirming that the obtained structure is dynamically stable.
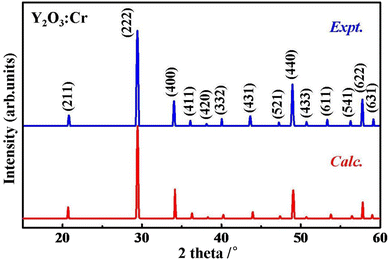 |
| | Fig. 3 Simulated XRD patterns of Y2O3:Cr compared with experimental data.9 | |
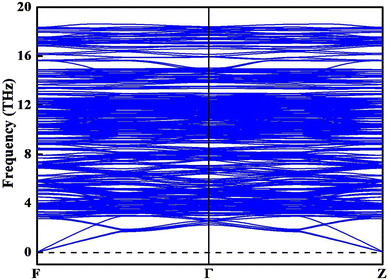 |
| | Fig. 4 Phonon dispersion spectrum of the ground state structure of Y2O3:Cr. | |
3.2 Electronic properties
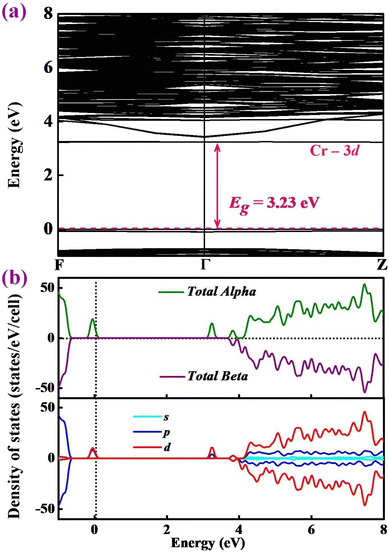
To gain deep insights into the electronic properties of Y2O3:Cr, the band structures of the ground state structure are calculated. Results are presented in Fig. 5. The Fermi energy level is represented by the dashed lines. As shown in Fig. 5(a), a direct band gap of 3.23 eV is identified, corresponding to the Γ point. This result is consistent with the previous report by Zhang et al.11 The introduction of the Cr3+ ion of Y2O3:Cr results in a small band gap compared to pure Y2O3.28 In order to provide insights into the contributions of the band structures, we further calculated the total and partial density of states (DOS) of Y2O3:Cr. The results are plotted in Fig. 5(b). It can be found that the valence bands from −1 to 0 eV are primarily derived from the p and d states. Specifically, the dominant states near the Fermi energy level are the d states. The conduction bands between 3 and 8 eV can be largely attributed to the d states. Fig. 5(b) reveals that the contributions of the p states are relatively weak while those of the s states are strong. It can be concluded that the reduction in band gap primarily originates from the doping of the Cr-3d states.
 |
| | Fig. 5 Calculated (a) band structure and (b) total and partial DOS of Y2O3:Cr. | |
In order to quantitatively analyze the bonding characters of the ground state structure, the electron localization functions (ELFs) are calculated. Fig. 6 shows the visualized ELF of Y2O3:Cr. It can be clearly seen from Fig. 6 that the ELF values span from 0 to 0.9, corresponding to the complete delocalization and high localization of electrons in the crystal. As shown in Fig. 6(b), the regions near the Y and Cr atoms exhibit the highest ELF values, approximately 0.9. This result indicates a strong electron localization in these regions. Furthermore, the ELF values in most interstitial regions are calculated to be 0 rather than 0.5, suggesting metal bonding characteristics. The likely reason for this phenomenon is the ionic bonding of both Y–O and Cr–O bonds in the crystal.
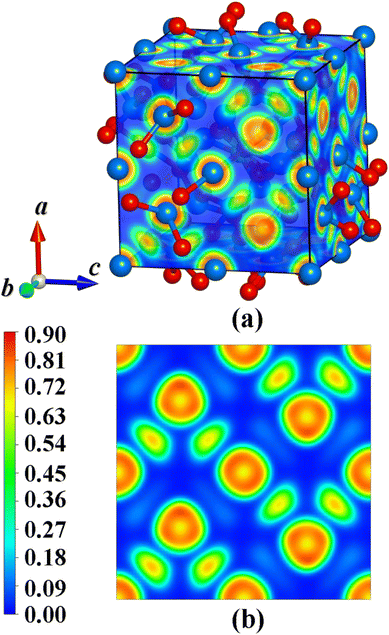 |
| | Fig. 6 Electron localization function of Y2O3:Cr: (a) the whole structure and (b) the 〈001〉 plane. | |
Bader charge analysis is a widely used theoretical method that partitions the total electron density of the system into atomic basins, making it possible to quantitatively calculate the atomic charges and charge transfer between different atoms. Herein, we determined the atomic charges of Y2O3:Cr using the Bader charge analysis. The results are summarized in Table 3. It can be clearly seen from Table 3 that the electrons transfer from the Cr and Y atoms to the O atoms. This is consistent with the metallic properties of the Cr and Y atoms. The average values of charge transfer for Cr, Y and O are calculated to be +1.62 e, +2.13 e and −1.41 e, respectively. The substantial charge transfer values indicate that both of the Cr–O and Y–O bonds in Y2O3:Cr possess ionic bond characteristics. This result is in good agreement with the analyses based on electron localization functions.
Table 3 Atomic charges of different species in Y2O3:Cr based on the Bader charge analysis
| Atom |
Charge transfer (e) |
Valence charge (e) |
Volume (Å3) |
| Cr |
1.620416 |
6 |
9.295789 |
| Y1 |
2.123285 |
11 |
13.133739 |
| Y7 |
2.126501 |
11 |
13.172546 |
| Y13 |
2.125893 |
11 |
13.093593 |
| Y19 |
2.121743 |
11 |
13.169201 |
| Y25 |
2.136991 |
11 |
13.149797 |
| Y28 |
2.135800 |
11 |
13.069505 |
| Y31 |
2.139882 |
11 |
13.053447 |
| O1 |
−1.416884 |
6 |
15.541156 |
| O3 |
−1.416882 |
6 |
15.541156 |
| O5 |
−1.416789 |
6 |
15.536472 |
| O7 |
−1.415096 |
6 |
15.196570 |
| O8 |
−1.415016 |
6 |
15.192556 |
| O9 |
−1.414927 |
6 |
15.187872 |
| O10 |
−1.415006 |
6 |
15.191886 |
| O11 |
−1.414927 |
6 |
15.187872 |
| O13 |
−1.338352 |
6 |
14.724186 |
| O19 |
−1.419831 |
6 |
15.481606 |
| O25 |
−1.419658 |
6 |
15.712445 |
| O31 |
−1.415312 |
6 |
15.543163 |
| O37 |
−1.419019 |
6 |
15.605389 |
| O43 |
−1.416526 |
6 |
15.499672 |
4 Conclusion
In conclusion, we conducted a comprehensive study on the microstructures and electronic features of Y2O3:Cr using the CALYPSO structure search method combined with first-principles calculations. We report a novel semiconducting phase for Y2O3:Cr, belonging to the R3 symmetry. The structure is a cage-like configuration with an impurity concentration of 3.125%. The Cr3+ ion occupies the central position of the crystal lattice, forming bonds with its six surrounding O atoms. The excellent agreement between the calculated and experimental XRD patterns validates the reliability of the ground state structure we obtained. The absence of imaginary frequencies in the phonon calculations confirms that the structure exhibits good dynamical stability. Band structure analysis shows that Y2O3:Cr exhibits a direct Γ-point bandgap of 3.23 eV, which indicates that Y2O3:Cr possesses semiconductor characteristics. The total and partial DOS analysis reveals that the introduction of a Cr3+ ion leads to the generation of semiconductor properties. We calculate the ELF of Y2O3:Cr and identify the ionic natures of both the Cr–O and Y–O bonds. It is hoped that these findings could provide valuable information for further investigations on transition-metal-doped host materials.
Conflicts of interest
The authors declare no known conflicts of interest.
Data availability
The data used in this manuscript are available on reasonable request.
Acknowledgements
This work was supported by the Natural Science Foundation Joint Fund of Hubei Province (Grant No. 2026AFC0734), Natural Science Foundation of Hubei Soliton Research Association (Grant No. 2025HBSRA03), Scientific Research Project of Jingchu University of Technology (Grant No. YY202401, YY202409), Program for Outstanding Young and Middle-Aged Scientific and Technological Innovation Teams in Universities of Hubei Province (Grant No. T2024029), and Educational Research Project of Hubei Higher Education Association (Grant No. 2022XD71).
References
- A. K. Elbadawy, et al., Multifunctional rGO/Y2O3@hydroxyapatite bioceramics: structural, optical, and biomedical properties, RSC Adv., 2026, 16, 5264–5280 RSC.
- M. B. Regina, et al., Molecular design and characterization of the PANI/yttrium oxide multifunctional nanocomposite material, Comput. Theor. Chem., 2024, 1241, 114904 CrossRef.
- L. Zhang, et al., Novel luminescent yttrium oxide nanosheets doped with Eu3+ and Tb3+, RSC Adv., 2014, 4, 17648–17652 RSC.
- C. V. Ramana, et al., Enhanced optical constants of nanocrystalline yttrium oxide thin films, Appl. Phys. Lett., 2011, 98, 031905 CrossRef.
- I. Muhammad, et al., Dye degradation and antimicrobial efficacy of cesium-doped Y2O3 nanostructures: in silico docking study, RSC Adv., 2024, 14, 30732–30742 RSC.
- B. Lacroix, F. Paumier and R. J. Gaboriaud, Crystal defects and related stress in Y2O3 thin films: Origin, modeling, and consequence on the stability of the C-type structure, Phys. Rev. B: Condens. Matter Mater. Phys., 2011, 84(1), 014104 CrossRef.
- Z. Zhao, et al., Sandwiched liquid-membrane electrodialysis: Lithium selective recovery from salt lake brines with high Mg/Li ratio, J. Membr. Sci., 2020, 596, 117685 CrossRef CAS.
- T. H. Maiman, Stimulated Optical Radiation in Ruby, Nature, 1960, 187(4736), 493–494 CrossRef.
- J. B. Prasanna Kumar, et al., Extraction of Y2O3:Cr3+ nanophosphor by eco-friendly approach and its suitability for white light-emitting diode applications, Luminescence, 2017, 32(3), 414–424 CrossRef CAS PubMed.
- X. Wu, et al., Broadband Cr3+/(Pr3+/Yb3+) quantum cutting down-conversion system doped in Y2O3/Y3Al5O12 heterostructure thin film, Thin Solid Films, 2016, 603, 353–358 CrossRef CAS.
- L. Zhang, J. Feng and W. Pan, Vacuum sintering of transparent Cr:Y2O3 ceramics, Ceram. Int., 2015, 41(7), 8755–8760 CrossRef CAS.
- Y. Wang, et al., Crystal structure prediction via particle-swarm optimization, Phys. Rev. B: Condens. Matter Mater. Phys., 2010, 82(9), 094116 CrossRef.
- Y. Wang, et al., CALYPSO: A method for crystal structure prediction, Comput. Phys. Commun., 2012, 183(10), 2063–2070 CrossRef CAS.
- J. Lv, et al., Predicted Novel High-Pressure Phases of Lithium, Phys. Rev. Lett., 2011, 106(1), 015503 CrossRef PubMed.
- J. Lv, et al., Particle-swarm structure prediction on clusters, J. Chem. Phys., 2012, 137(8), 084104 CrossRef PubMed.
- M. Zhang, et al., Superhard BC3 in Cubic Diamond Structure, Phys. Rev. Lett., 2015, 114(1), 015502 CrossRef CAS.
- C. Lu, M. Amsler and C. Chen, Unraveling the structure and bonding evolution of the newly discovered iron oxide FeO2, Phys. Rev. B, 2018, 98(5), 054102 CrossRef CAS.
- M. Ju, et al., Structural Evolutions and Crystal Field Characterizations of Tm-Doped YAlO3: New Theoretical Insights, ACS Appl. Mater. Interfaces, 2016, 8(44), 30422–30429 CrossRef CAS.
- M. Ju, et al., Theoretical investigation of the electronic structure and luminescence properties for NdxY1−xAl3(BO3)4 nonlinear laser crystal, J. Mater. Chem. C, 2017, 5(29), 7174–7181 RSC.
- M. Ju, et al., Deciphering the Microstructure and Energy-Level Splitting of Tm3+-Doped Yttrium Aluminum Garnet, Inorg. Chem., 2019, 58(2), 1058–1066 CrossRef CAS PubMed.
- G. Kresse and J. Furthmüller, Efficient iterative schemes for ab initio total-energy calculations using a plane-wave basis set, Phys. Rev. B: Condens. Matter Mater. Phys., 1996, 54(16), 11169–11186 CrossRef CAS PubMed.
- G. Kresse and J. Hafner, Ab initio molecular dynamics for liquid metals, Phys. Rev. B: Condens. Matter Mater. Phys., 1993, 47(1), 558–561 CrossRef CAS.
- J. P. Perdew, K. Burke and M. Ernzerhof, Generalized Gradient Approximation Made Simple, Phys. Rev. Lett., 1996, 77(18), 3865–3868 CrossRef CAS.
- A. Togo, F. Oba and I. Tanaka, First-principles calculations of the ferroelastic transition between rutile-type and CaCl2-SiO2 at high pressures, Phys. Rev. B: Condens. Matter Mater. Phys., 2008, 78(13), 134106 CrossRef.
- A. D. Becke and K. E. Edgecombe, A simple measure of electron localization in atomic and molecular systems, J. Chem. Phys., 1990, 92(9), 5397–5403 CrossRef CAS.
- A. Savin, et al., Electron Localization in Solid-State Structures of the Elements: the Diamond Structure, Angew Chem. Int. Ed. Engl., 1992, 31(2), 187–188 CrossRef.
- K. Momma and F. Izumi, VESTA 3 for three-dimensional visualization of crystal, volumetric and morphology data, J. Appl. Crystallogr., 2011, 44, 1272–1276 CrossRef CAS.
- M. Ju, et al., In-Depth Determination of the Microstructure and Energy Transition Mechanism for Nd3+-Doped Yttrium Oxide Laser Crystals, J. Phys. Chem. C, 2020, 124(3), 2113–2119 CrossRef CAS.
- M. Ju, et al., Determination of the microstructure, energy levels and magnetic dipole transition mechanism for Tm3+ doped yttrium aluminum borate, J. Mater. Chem. C, 2016, 4(10), 1988–1995 RSC.
|
| This journal is © The Royal Society of Chemistry 2026 |
Click here to see how this site uses Cookies. View our privacy policy here. 
 Open Access Article
 This Open Access Article is licensed under a Creative Commons Attribution-Non Commercial 3.0 Unported Licence
 a,
Zaifu Jianga,
Dingmei Zhanga,
Ruiqi Xiongb,
Meng Ju
a,
Zaifu Jianga,
Dingmei Zhanga,
Ruiqi Xiongb,
Meng Ju


