DOI:
10.1039/D5RA08274A
(Paper)
RSC Adv., 2026,
16, 3101-3110
Functionalized graphene quantum dots based non-enzymatic sensor for selective tyrosine detection
Received
28th October 2025
, Accepted 18th December 2025
First published on 14th January 2026
Abstract
Tyrosinemia is an inherited metabolic disorder that occurs due to the disruption in the breakdown of the amino acid ‘tyrosine’. Elevated levels of tyrosine cause liver failure, and neurological damage in newborns. Hence, rapid and accurate detection of tyrosine is essential for the timely management and diagnosis of this disorder. In this context, a non-enzymatic electrochemical sensor has been fabricated using Graphene Quantum Dots (GQDs) functionalized screen-printed carbon electrode for the detection of tyrosine. The different functional groups present on the surface provides efficient binding and recognition of tyrosine. The electrochemical signatures of the fabricated electrodes exhibited a sensitivity of 0.03 µA µM−1, detection limit of 0.102 µM, linear range of 5–60 µM, and quantification limit of 0.3094 µM. The selective nature of the sensor was confirmed in the presence of possible interfering amino acid species and the promising figure of merits may be tested to detect tyrosine in clinical samples.
Introduction
Inherited Metabolic Disorders (IMD), also known as inborn errors of metabolism, are caused by enzyme deficiency, which accumulates toxic metabolites in humans.1 Recent studies highlight that metabolic dysregulation and accumulation of toxic intermediates play a major role in disease progression, reinforcing the importance of identifying biomolecular markers associated with metabolic imbalance at an early stage.2 Among amino-acid disorders, tyrosinemia type I (1 in 100![[thin space (1/6-em)]](https://www.rsc.org/images/entities/char_2009.gif) 000 individuals), II (1 in 250000 individuals) and rare type III3 is caused by the degradation pathway of tyrosine (Tyr) with the deficiency of the enzyme tyrosine aminotransferase, which induces higher Tyr levels.4 Elevated levels of Tyr and its metabolites in human body cause liver failure in the acute form and hypophasphatemia rickets at an adolescent stage after few weeks of birth.5 Though, Tyr is a non-essential amino acid it is a precursor to neurotransmitters like dopamine and epinephrine. Small-molecule based biochemical monitoring have demonstrated that precise molecular detection is essential for improving diagnostic accuracy at an early stage.6 Recent biosensing strategies indicate that selective recognition of analytes combined with reliable transduction mechanisms is critical for accurate assessment of disease-related metabolic biomarkers in complex biological environments.7
000 individuals), II (1 in 250000 individuals) and rare type III3 is caused by the degradation pathway of tyrosine (Tyr) with the deficiency of the enzyme tyrosine aminotransferase, which induces higher Tyr levels.4 Elevated levels of Tyr and its metabolites in human body cause liver failure in the acute form and hypophasphatemia rickets at an adolescent stage after few weeks of birth.5 Though, Tyr is a non-essential amino acid it is a precursor to neurotransmitters like dopamine and epinephrine. Small-molecule based biochemical monitoring have demonstrated that precise molecular detection is essential for improving diagnostic accuracy at an early stage.6 Recent biosensing strategies indicate that selective recognition of analytes combined with reliable transduction mechanisms is critical for accurate assessment of disease-related metabolic biomarkers in complex biological environments.7
Although several analytical techniques such as fluorometry,8 High-performance liquid chromatography (HPLC),9 gas-ion-exchange chromatography (GC),10 capillary electrophoresis,11 surface-enhanced Raman scattering (SERS),12 enzyme-based methods13 were developed for Tyr detection, these detection techniques have challenges like high solvent consumption, volatility of analytes, limited sensitivity, and low quantification of analytes. To overcome these limitations, electrochemical detection provides a platform for rapid and accurate detection, as well as superior sensitivity, portability, ease of miniaturization, and device development opportunities. Nano-interfaces can greatly enhance the electrochemical sensor's performance through improved catalytic capabilities, enhanced electron transfer reactions between the electrode and the electrolyte.
Electrochemical biosensors are using recognition elements and catalytic interface to enhance performance through recent advances in sensor implementation. Supramolecular and host–guest-based sensor platforms allow greater selectivity and enhanced signal amplification, thus providing the ability to reliably identify a target in complex environments, like with biosamples.14 Similarly, molecular-imprinted polymers integrated with nanostructured materials provide highly specific binding cavities together with large active surface area, significantly with higher sensitivity for biologically relevant analytes.15 Beyond conventional bulk electrodes, wearable microfluidic electrochemical sensors with iron/titanium bimetallic oxide-doped porous carbon interfaces demonstrate the feasibility of non-invasive and continuous biomarker monitoring.16 Artificial enzyme mimics such as Cu–amino acid self-assembled nanozymes (Cu-Leu, Cu-Ile, Cu-Phe) with tunable laccase-like activity have also achieved ultrasensitive detection limits.17 Thus, electrochemical sensing interfaces that combine high selectivity, strong signal amplification, and device-level integrability are needed for metabolic biomarkers like Tyr. Within this context, screen-printed electrodes (SPCEs) have emerged as a disposable platform for electrochemical detection due to their low cost, reproducibility, and integrated into compact point of care systems. Various reported nanointerface modification includes N-COF@MWCNT-COOH/Tri-AgNPs,18 GO-chitosan SPCEs (5.86 µM LOD),19 ball-milled DS steel electrodes,20 adonitol-based chiral sensors21 and sustainable cork-LIG electrodes (3.75 µM LOD)22 for Tyr detection. While these advances demonstrate the flexibility of SPCEs, limitations remain in achieving consistent long-term stability, expanded active surface sites for higher sensitivity, and optimized charge-transfer kinetics to minimize overpotential during Tyr oxidation in complex matrices. Notably, the performance of SPCE-based Tyr sensors depends on the nature of the surface modification used to tailor the nano-interface for efficient Tyr oxidation. Graphene quantum dots (GQDs) have gained much attention owing to their biocompatibility, tunable size property, and better photostability, which can be used for bio-sensing applications, yet they tend to aggregate or degrade under prolonged storage, reducing their effectiveness for electrochemical sensing. Hence, the researchers have explored GQD-RuCl3, and GQD-β-cyclodextrin (β-CD)23–25 using ceramic electrodes and bulk electrodes for the electrochemical sensing, where the hydrophobic–hydrophilic properties of the ceramic electrode surface may cause a low interaction with aqueous solutions, potentially affecting the electrode's performance and limiting the charge-transfer kinetics. To address these challenges, functionalization of GQDs (f-GQDs) provides more active sites and improves electron transfer efficiency. The incorporation of oxygen and nitrogen containing groups onto the GQD surface enhances hydrophilicity, suppresses π–π aggregation between graphene domains, and generates abundant edge and defect sites that serve as catalytically active surface for analyte adsorption and rapid electron transfer. Thus, in this work f-GQDs have been used as an effective nano-interface on SPCE for Tyr detection.
2 Materials and methods
2.1 Chemicals
Citric acid (C6H8O7, MW; 192.12 g mol−1), sodium chloride (NaCl, MW: 58.44 g mol−1), purity of ≥ 99.5%, histamine (MW: 111.15 g mol−1), glutathione (MW: 307.32 g mol−1), arginine (MW: 174.20 g mol−1), valine (MW: 117.15 g mol−1), L-cysteine (MW: 121.16 g mol−1) were purchased from Sigma-Aldrich, India. Sodium Hydroxide pellets (NaOH, MW: 40.00 g mol−1), L-tyrosine (MW: 181.19), L-phenylalanine (MW: 165.19), about extra pure CHR, 99% were purchased from SRL Chemicals. Nitric acid of about 69% (HNO3, MW: 63.01 g mol−1), and sulphuric acid of about 98% pure (H2SO4, MW: 98.08 g mol−1) were purchased from Merck Specialties Private Limited, Mumbai. Ethanol was purchased from Krishna Pharma, Hyderabad.
2.2 Synthesis of GQDs and f-GQDs
The GQDs were synthesized from citric acid via the carbonization method. To undergo carbonization, 4 g of citric acid was heated to 200 °C on a hot plate. The colourless liquid turned pale yellow and finally changed into orange colour after half an hour, which indicates the formation of GQDs. To obtain GQDs, the final solution was mixed with 10 mg mL−1 of NaOH in a 100 mL volume while stirring at 1000 rpm. This solution was adjusted to pH 8.0 using NaOH, and the prepared GQDs solution was combined with ethanol at 1:3 ratio and centrifuged at 7000 rpm to remove extraneous components. Thus, the obtained solution was collected for further experiments.
The functionalization of GQDs was carried out using acid treatment with HNO3 and H2SO4 in a ratio of 1:3. This acid mixture was added to 10 mL deionized water, followed by the addition of 600 µL of GQDs, and ultrasonicated for 15 min. The mixture was then stirred at 600 rpm at 50 °C, for 15 min, followed by neutralization using NaOH. This functionalized GQDs solution was collected and used for electrochemical sensing.
2.3 Material characterization and electrochemical analysis
The structural, functional characteristics of the prepared materials were explored using a CuKα-radiated Bruker X-ray diffractometer with 1.5408 Å wavelength and, Fourier-Transform Infra-red spectrometer (FTIR) with a resolution of 8 cm−1 at wavelengths from 4000–400 cm−1. A Raman spectrometer was used to analyze the defects and carbon ratio in GQDs and f-GQDs. The surface morphology was studied using TEM analysis with FEI Tecnai G2 20 S-TWIN TEM D8 Focus instrument. The optical characteristics were investigated using Thermo Scientific (model: evolution 201), which has a scan speed of 400 nm min at the range of 800–190 nm. The surface analysis was determined by a model K-alpha X-ray Photoelectron Spectrometer (Thermo Scientific, USA).
Electrochemical measurements, such as Cyclic Voltammetry (CV) and Differential Pulse Voltammetry (DPV), were conducted using multi-potentiostat/galvanostat µStat 4000 (Metrohm DropSens) by Drop View 8400 software at room temperature. Electrochemical Impedance spectroscopy (EIS) was performed using Palmsens Sensit system, to calculate the charge transfer resistance and conductivity of the modified electrode. The experiment was conducted using DRP-110 Screen-printed carbon electrodes (SPCE), which were purchased from Metrohm India Private Limted, Ag as the reference electrode and carbon as working (dia-4 mm, modified with f-GQDs) and auxiliary electrodes, respectively. The modified electrode was dipped into 0.1 M NaCl for CV and DPV techniques were carried out at a potential range of −0.9 V to 0.9 V for varying concentrations of Tyr.
2.4 Fabrication of f-GQDs/SPCE
The modification of the SPCE working electrode surface with f-GQDs was performed using the drop-casting method. The surface of the SPCE was cleaned with DI water. The cleaned electrode surface was modified by drop-casting 3 µL of f-GQDs were modified onto the SPCE and dried in incandescent light for 15 min. The modified electrode was stored and used for electrochemical sensing studies. The electrochemical sensing performance of f-GQDs/SPCE was experimented using CV with 5 mM [Fe(CN)6]3−/4 in 0.1 M NaCl.
3 Results and discussions
3.1 Structural analysis
The XRD patterns for GQDS and f-GQDs are shown in Fig. 1(a). The XRD pattern of GQDs showed a broad, low-intense peaks at 21.31°, 32.84° pointing out their amorphous nature, carbonized, aromatic domain 26, which matched with JCPDS card no. 26–1080.27 The XRD pattern of f-GQDs (red curve) exhibited several sharp and intense diffraction peaks, most notably at 32.07° and 45.7°. These peaks confirmed an increase in crystallinity and improved crystalline alignment within the graphene domains due to the introduction of functional groups. The additional peaks observed at 23.87°, 25.82°, 34.28°, and 52.73° can be attributed to the presence of various functional groups such as amine, carboxyl, and hydroxyl introduced during the functionalization process. These functional groups modified the interlayer spacing with enhanced structural order of the graphene lattice. The observed peaks verified that the GQDs were successfully functionalized and the graphene structure was maintained.28–30
 |
| | Fig. 1 (a) XRD (b) FTIR, (c) UV-spectra of GQDs and f-GQDs (d) Raman spectra of f-GQDs. | |
3.2 Functional group analysis and Raman analysis
The surface functional groups of GQDs and f-GQDs were characterized by FTIR, as depicted in Fig. 1(b) and Raman spectra in Fig. 1(d). A broad, intense peak at 3334 cm−1 attributes to the stretching vibrations of –OH and N–H groups. Peaks at 1552 and 1570 cm−1 indicate the bending and vibrational transitions of C![[double bond, length as m-dash]](https://www.rsc.org/images/entities/char_e001.gif) C bonds. The absorption bands at 1643 and 1049 cm−1 correspond to CO stretching and C–O (alkoxy and carboxyl) functional groups, respectively. Peaks at 1389 and 1276 cm−1 associate with the bending vibrations of C–H and the C–O–C bond, respectively. Additional peaks at 1389, 1095, and 1641 cm−1 were indicative of C–N/N–H/C–H, S–H, and C–S functional groups. The appearance of these functional groups confirmed that the treatment with nitric and sulfuric acid led to the effective incorporation of oxygen, nitrogen, and sulfur functionalities into the GQD matrix.31,32 Complementing FTIR's functional group identification, Raman spectra of the synthesized graphene quantum dots (GQDs) (Fig. S1) show a prominent band at 1477 cm−1 that can be attributed to the D band, which arises from disorder-induced vibrational modes associated with sp3 carbon defects, edges, and oxygen-containing functional groups. This band is generally observed near 1350 cm−1 for bulk graphene but often shifts to higher wavenumbers in nanoscale GQDs due to quantum confinement and edge effect.33 The absence or shifting of the typical G band (1580 cm−1), corresponds to the in-plane vibration of sp2 carbon atoms, suggests that the GQD structure is dominated by defects and edge states rather than extended graphitic domains. The higher-order overtone peaks at 2349 cm−1 and 2885 cm−1 correspond to the 2D and 2D’ modes, respectively, sensitive to structural disorder present in GQDs.34 After functionalization with nitric and sulfuric acid (Fig. 1(d)), Raman peaks shifted to 1515, 2234, and 2942 cm−1. The feature at 1515 cm−1 represents a modified vibrational mode influenced by surface functional groups such as nitrogen and sulfur, revealing partial restoration or modification of the graphitic lattice.35 FTIR distinguishes specific chemical bonds (O–H/N–H 3334 cm−1, CO 1643 cm−1, C–O/C–N/S 1049–1641 cm−1) while Raman reveals lattice defects (D-band 1477 → 1515 cm−1 shift) and quantum confinement effects, confirming successful heteroatom doping. These evidences indicate the successful chemical functionalization in GQDs.
C bonds. The absorption bands at 1643 and 1049 cm−1 correspond to CO stretching and C–O (alkoxy and carboxyl) functional groups, respectively. Peaks at 1389 and 1276 cm−1 associate with the bending vibrations of C–H and the C–O–C bond, respectively. Additional peaks at 1389, 1095, and 1641 cm−1 were indicative of C–N/N–H/C–H, S–H, and C–S functional groups. The appearance of these functional groups confirmed that the treatment with nitric and sulfuric acid led to the effective incorporation of oxygen, nitrogen, and sulfur functionalities into the GQD matrix.31,32 Complementing FTIR's functional group identification, Raman spectra of the synthesized graphene quantum dots (GQDs) (Fig. S1) show a prominent band at 1477 cm−1 that can be attributed to the D band, which arises from disorder-induced vibrational modes associated with sp3 carbon defects, edges, and oxygen-containing functional groups. This band is generally observed near 1350 cm−1 for bulk graphene but often shifts to higher wavenumbers in nanoscale GQDs due to quantum confinement and edge effect.33 The absence or shifting of the typical G band (1580 cm−1), corresponds to the in-plane vibration of sp2 carbon atoms, suggests that the GQD structure is dominated by defects and edge states rather than extended graphitic domains. The higher-order overtone peaks at 2349 cm−1 and 2885 cm−1 correspond to the 2D and 2D’ modes, respectively, sensitive to structural disorder present in GQDs.34 After functionalization with nitric and sulfuric acid (Fig. 1(d)), Raman peaks shifted to 1515, 2234, and 2942 cm−1. The feature at 1515 cm−1 represents a modified vibrational mode influenced by surface functional groups such as nitrogen and sulfur, revealing partial restoration or modification of the graphitic lattice.35 FTIR distinguishes specific chemical bonds (O–H/N–H 3334 cm−1, CO 1643 cm−1, C–O/C–N/S 1049–1641 cm−1) while Raman reveals lattice defects (D-band 1477 → 1515 cm−1 shift) and quantum confinement effects, confirming successful heteroatom doping. These evidences indicate the successful chemical functionalization in GQDs.
3.3 XPS
XPS analysis of the f-GQDs confirmed the successful incorporation of various surface functional groups and heteroatoms. In the C 1s spectrum, the dominant peak at 284 eV was assigned to CC bonds in the sp2 carbon lattice, while peaks at 286 eV and 288 eV were assigned to CO (carbonyl) and O–CO (carboxylate) functionalities, indicating effective oxidative functionalization (Fig. 2(b)). The O 1s spectrum exhibited at 531 eV from C–O–C (epoxy) and C–OH (hydroxyl) groups, and a higher binding energy peak at 535 eV was attributed to O–CO moieties and possibly adsorbed water or loosely bound oxygen species (Fig. 2(c)) The dominant N 1s peak near 407 eV corresponds to oxidized nitrogen species such as N–O bonds, introduced predominantly during acid functionalization that increases surface oxidation. This peak's higher intensity compared to the C–N bond peak near 403 eV (typical binding energy for pyrrolic or amine nitrogen) reflects extensive surface oxidation and the formation of nitro or nitrate groups, which enhance polarity and catalytic activity. Such oxidation often results from harsh acid treatments that generate abundant N–O functionalities, as reported with N–O binding energies in the 407 eV range.36 The relative intensities typically correlate with the degree of oxidation, where stronger N–O peaks indicate more extensive surface modification enhancing electron transfer and sensor performance.37 This is consistent with the literature where oxidized nitrogen functionalities dominate at higher binding energies due to acid treatment-induced surface chemistry changes (Fig. 2(d)). Sulphur was present in trace amounts, appearing only as a weak S 2p signal (∼165 eV) without resolvable deconvolution. Additionally, a peak at ∼497 eV corresponded to the Na KLL Auger transition and was attributed to residual sodium ions adsorbed on oxygen-rich surface groups, originating from the sodium hydroxide solution used during pH optimization.38,39
 |
| | Fig. 2 XPS spectra of f-GQDs (a) survey spectrum (b) C1 s (c) O1 s (d) N1 s. | |
3.4 Absorption studies
The absorbance and optical properties of GQDs and f-GQDS are investigated using UV-visible spectroscopy reported in Fig. 1(c). The aqueous dispersion of GQDs shows an absorption at 245 nm that corresponds to π–π* transition of the aromatic nature of sp2 domains and the hump at 343 nm shows n–π* transition due to functional groups present in GQDs.40,41 The peak on 207 nm indicates an n–π* transition and a red shift due to amine and carbonyl groups existing on the surface of GQDs. The blue shift of 37 nm effectively modulated the band gap of GQDs.42 Tauc plots were calculated from the absorption spectra of GQDS and f-GQDs. The direct energy bandgap for n– π* transitions was 3.12 and 3.00 eV for GQDs and f-GQDs. Functional groups present at the GQDs may increase the fermi energy level. Hence, a lower bandgap for f-GQDs with n–π* transition.
3.5 DLS and zetapotential
The size distribution of prepared graphene quantum dots (GQDs) and acid-functionalized GQDs (f-GQDs) was determined by dynamic light scattering (DLS), revealing hydrodynamic diameters of 346 nm for GQDs and 282.9 nm for f-GQDs (PDI > 0.4) at 0.1 mg mL−1 in pH 7 buffer, as shown in Fig. S3. These values reflect aggregate-dominated dispersions arising from π–π stacking and hydrogen bonding interactions inherent to GQDs in aqueous media, a common observation where TEM confirms underlying core sizes of 2–8 nm. The reduced hydrodynamic size of f-GQDs demonstrates improved dispersibility due to acid-induced surface carboxylation, which enhances electrostatic repulsion as corroborated by zeta potential data.
Zeta potential measurements, conducted using the same DLS instrument, showed negative values of −20 mV for GQDs and −24.1 mV for f-GQDs at pH 7 (Fig. S3). These strong negative potentials indicate excellent colloidal stability from deprotonated carboxylic acid (−COO−) and hydroxyl (−OH) groups, with the more negative shift in f-GQDs validating successful acid functionalization. This surface charge is crucial for electrochemical detection applications, as it ensures uniform nanocomposite formation and optimal electrode interactions during amino acid sensing.43,44
3.6 Morphological analysis
The morphology of the GQDs and f-GQDs is studied using TEM as reported in Fig. 3. The GQDs were observed as uniformly dispersed, spherical to quasi-spherical nanoparticles with minimal aggregation, appearing as dark contrast spots across the substrate. High-resolution images displayed well-defined lattice fringes characteristic of graphitic carbon, indicating high crystallinity and a preserved sp2-hybridized framework, consistent with earlier reports on GQDs synthesized via bottom-up and top-down routes. In contrast, the f-GQDs exhibited a tendency to form larger aggregates or interconnected clusters, likely due to the presence of surface functional groups that enhanced interparticle interactions. Their particle outlines were often less regular, with amorphous layers surrounding the crystalline domains, indicative of surface-bound organic moieties. HRTEM images further showed partial disruption of lattice fringes and regions of reduced crystallinity, confirming that functionalization introduced structural defects and chemical modifications, while the core graphitic domains remained intact. It shows diameter of the GQDs ranges from 1–2 nm which suggests the uniform distribution of spheres on the surface. The average size diameter of GQDs was calculated as 1.949 nm.45,46
 |
| | Fig. 3 TEM images of (a) GQDs and (b–f) f-GQDs. | |
3.7 Electrochemical characterization of f-GQDs/SPCE
CV and EIS techniques were employed to compare the electron transfer characteristics of bare SPCE and f-GQDs/SPCE in 5 mM ferricyanide solution. As shown in Fig. 4(a), the f-GQDs/SPCE exhibited higher peak currents and a smaller peak-to-peak separation in the CV curves compared to the bare SPCE, indicating improved electron transfer kinetics. The Nyquist plots (Fig. 4(b)) further supported this observation, as the semicircle diameter for f-GQDs/SPCE was significantly smaller than that of the bare SPCE, reflecting a lower charge transfer resistance. Additionally, the electroactive surface area, calculated using the Randles–Sevick equation.| |
 | (1) |
increased from 0.00132 cm2 for the bare SPCE to 0.0202 cm2 for the f-GQDs/SPCE, confirming that the modification enhanced the effective surface area and overall electrochemical performance of the electrode. Electrochemical characterization demonstrated that the f-GQDs exhibit enhanced pseudo-capacitive behaviour and higher specific capacitance compared to pristine GQDs, which is attributed to the introduction of redox-active functional groups.
 |
| | Fig. 4 (a) CV, (b) EIS plots of bare and f-GQDs modified electrode in 5 mM [Fe(CN)6] in 0.1 M NaCl, (c) CV profiles of bare and f-GQDs/SPCE in presence and absence of 10 µM of Tyr. | |
3.7.1 Electrochemical analysis of f-GQDs/SPCE. The CV response of the bare and modified SPCE (f-GQDs/SPCE) were scanned at 0.05 V s−1 in the absence and presence of 60 µM Tyr with 0.1 M NaCl. The bare SPCE electrode shows no significant peak in the presence and absence of Tyr ensuring the inert electrode on the surface. Based on the results shown in Fig. 4(c), the electrochemical sensing mechanism of Tyr at the f-GQDs/SPCE involves multiple synergistic interactions. Tyr molecules adsorb onto the f-GQDs surface primarily through coordination and electrostatic interactions between the amine and phenolic groups of Tyr and surface functional groups (carboxyl, hydroxyl, and doped heteroatoms) present on the f-GQDs, increasing analyte concentration. The f-GQDs also provide a conductive and catalytically active interface with dopants and structural defects that significantly enhance electron transfer kinetics by lowering the oxidation overpotential. Additionally, the electrochemical oxidation of Tyr proceeds via a proton-coupled electron transfer (PCET) mechanism, wherein the f-GQDs mediate simultaneous transfer of electrons and protons, facilitating efficient oxidation and generating a well-defined anodic peak. Upon applying a positive potential, Tyr underwent an irreversible oxidation process, typically involving the transfer of one electron which resulted in a distinct anodic peak and confirmed by eqn (2). The f-GQDs facilitated this electron transfer by providing a conductive and catalytically active interface, which lowered the overpotential and enhanced the oxidation current response compared to the bare electrode (Scheme 1).
 |
| | Scheme 1 Electrochemical sensing mechanism of f-GQDs/SPCE with Tyr. | |
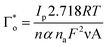
The surface coverage of electroactive tyrosine (Tyr) on the f-GQDs/SPCE was determined using eqn (3) and was calculated to be 4.57 × 10⁻⁸ mol cm−2, confirming that Tyr molecules were effectively adsorbed onto the electrode surface. The heterogeneous electron transfer rate constant (Ks) was evaluated as 6.77 s−1, indicating that a rapid electron transfer process occurred at the f-GQDs-modified electrode interface.
The charge transfer coefficient is calculated using,
| |
 | (2) |
| |
 | (3) |
| |
 | (4) |
where,
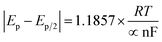
Ep/2 and
Ep denote the half-peak and peak potential of the obtained oxidation peak value in the presence of 60 µM Tyr.
α denotes electron transfer coefficient, and other parameters are gas constant (
R = 8.314), temperature (
T = 298 K), Faraday's constant (
F = 96
485), and the number of electrons (
n).
3.7.2 Influence of loading volume and pH. The effect of pH on the electrochemical detection of tyrosine using f-GQDs/SPCE was systematically studied across pH range of 3,5,7 and 12.0 to determine the optimal sensing conditions as shown in Fig. 5(a). The sensor response showed a clear dependence on pH, with the oxidation peak current of tyrosine increasing with pH up to 7.0 and then decreasing at higher pH values. At pH 7.0, the sensor exhibited the highest current response, indicating optimal electron transfer kinetics between tyrosine and the f-GQDs/SPCE. This enhanced performance at neutral pH can be attributed to the favourable protonation which enhanced hydrogen bonding and π–π interactions state between f-GQDs and the tyrosine molecule, promoting efficient electrochemical oxidation. In alkaline conditions, deprotonation of tyrosine and negatively charged functional groups induce electrostatic current response. Therefore, pH 7.0 was selected as the optimal condition for further studies, offering both high sensitivity and compatibility with physiological samples.
 |
| | Fig. 5 (a) Influence of pH, (b) volume of stock concentration of f-GQDs on SPCE, (c) varying scan rate of (0.01–0.1 V s−1) for modified f-GQD/SPCE electrode, and (d) linear plot for log (scan rate V s−1) vs. log (current µA) in the presence of 60 µM of Tyr. | |
To investigate the effect of loading volume on the current response (Fig. 5(b)), various volumes of f-GQDs ranging from 1 to 5 µL were drop-cast onto the SPCE and tested in the presence of 10 µM tyrosine at a scan rate of 0.05 V s−1. The cyclic voltammetry responses for each loading volume were recorded, and it was observed that the electrode modified with 3 µL of f-GQDs exhibited the highest current response. Based on these results, 3 µL was selected as the optimal loading volume for subsequent electrochemical measurements.
3.7.3 Scan rate study. The scan rate-dependent behaviour of the f-GQDs/SPCE sensor towards tyrosine was systematically investigated using CV in 30 µM tyrosine containing 0.1 M NaCl, varying scan rates from 0.01 to 0.1 V s−1 as depicted in Fig. 5(c). As the scan rate increased, the oxidation peak current also increased proportionally, demonstrating the sensor's rapid electron transfer capability. The relationship between log(peak current) and log(scan rate) yielded a linear plot (Fig. 5(d)) with a correlation coefficient (R2) of 0.99 and a slope of 0.69. The observed slope suggested a surface-controlled process. This behaviour reflects the dual role of f-GQDs in enriching the analyte concentration at the electrode interface and enabling efficient electron transfer. Fig. 6(a) depict the CV response of f-GQDs/SPCE for various concentrations of Tyr from 10–50 µM in 0.1 M NaCl. The peak current raised with increasing Tyr concentration, indicating the successful detection of Tyr using the f-GQDs/SPCE. Fig. 6(d) indicates the corresponding linear plot for the concentration of Tyr with a correlation coefficient of 0.99.
 |
| | Fig. 6 a) CV curve (b) DPV response of various concentration (10–60 µM) of Tyr at f-GQDs/SPCE (c) interferents of f-GQDs/SPCE. (d) and (e) linear plot of peak current vs. concentration for corresponding CV and DPV plot. | |
3.7.4 Effect of concentration of f-GQDs/SPCE. For quantification of tyrosine, the peak current obtained from the f-GQDs/SPCE-modified electrode was utilized. The sensing performance of the developed sensor was systematically evaluated using DPV technique as depicted in Fig. 6(b). Measurements were conducted in the concentration range of 10–60 µM tyrosine scanned at 0.05 V s−1 in 0.1 M NaCl. The DPV response exhibited a clear increase in peak current with rising tyrosine concentration, demonstrating a well-defined linear relationship within this range. The calibration plot of peak current versus tyrosine concentration displayed excellent linearity (Fig. 6(e)), confirming the sensor is suitable for quantitative analysis. Based on the slope of the calibration curve, the limit of detection (LOD) and sensitivity were calculated to be 0.102 µM and 0.03 µA µM−1, respectively. The figure of merits of the sensor are compared with other modified electrodes is shown in Table 1.
Table 1 Comparison of analytical parameter of the reported works for detection of Tyra
| Nanointerface |
Electrode |
Method |
LOD (µM) |
Sensitivity (µA µM−1) |
Linear range (µM) |
ref. |
| (Zr8Y-Yttria-Zirconia, PEI/(P2Mo16V2/BMIMBr-CNTs)–dawson polyoxometalates H8P2Mo16V2O62 (P2Mo16V2) and ionic liquid (BMIMBr)-decorated carbon nanotubes, Fe-iron, TiO), PEDOT- poly(3,4-ethylenedixoythiopene). |
| GQDs-β-CD |
GCE |
DPV |
0.03 |
0.864 |
0.1–1.5 |
23 |
| β-CD & GQDs |
GCE |
CV |
0.0067 |
3.523 |
6–1500 |
24 |
| GQDs/RuCl3 |
CCE |
Amperometry |
0.23 |
0.09 |
1–937 |
25 |
| Zr8Y |
SPCE |
CV |
0.1 |
0.140 |
0–250 |
47 |
| PEI/(P2Mo16V2/BMIMBr-CNTs)8 |
ITO |
CV |
17.1 |
0.462 |
0.58–120 |
48 |
| N-COF@MWCNT-COOH/Tri-AgNPs |
SPCE |
DPV |
0.015 |
0.45 |
0.01–100 |
18 |
| Cr, Sn, La-doped α-Fe2O3 |
GCE |
DPV |
0.02 |
0.38 |
0.05–120 |
46 |
| PEDOT/AuNPs |
GCE |
DPV |
0.01 |
0.50 |
0.02–150 |
20 |
| Graphene oxide–chitosan |
SPCE |
DPV |
0.03 |
0.25 |
0.05–200 |
49 |
| Tannic acid/Fe/TiO2 |
GCE |
DPV |
0.005 |
0.68 |
0.01–100 |
19 |
| Adonitol-based chiral sensor |
GCE |
DPV |
0.008 |
0.60 |
0.01–120 |
22 |
| MoCu-TCPP/GO |
GCE |
DPV |
0.006 |
0.72 |
0.01–150 |
50 |
| f-GQDs |
SPCE |
DPV |
0.102 |
0.03 |
10–60 |
This work |
3.7.5 Interferents and repeatability study of sensor. The selectivity of the f-GQDs/SPCE was tested using different interferents that might interfere with Tyr detection. This was done by adding high concentration of interfering species such as phenylalanine, valine, histamine, arginine, ascorbic acid, uric acid, dopamine and glucose to test the solution along with Tyr. The sensor displayed high selectivity, towards the detection of Tyr, while showing minimal response to the other interfering substance as shown in Fig. 6(c). The repeatability of the sensor was employed out for 5 experiments with concentration of 10 µM of Tyr on the f-GQDs/SPCE. The change in the current response might be due to the electro-catalytic action of the interface. The RSD value of 5.16% confirmed the repeatability nature of the sensor. The sensor exhibited reproducibility across 20 days with an RSD of 0.79%, encompassing both batch-to-batch fabrication consistency and long-term stability over 1–2 weeks.
4 Conclusion
In summary, GQDs and functionalized GQDs synthesized using carbonization and acid treatment were efficiently used as catalyst for the detection of Tyr. The structural, morphological characteristics of GQDs and f-GQDs facilitated high electron transfer rate for the detection of tyrosine. Electroanalytical techniques like cyclic voltammetry and differential pulse voltammetry were employed for f-GQD based Tyr sensor. The modified electrode exhibited electrocatalytic activity towards the oxidation of tyrosine. This work introduces a facile synthesis approach combined with promising sensor performance, highlighting its potential for real-time clinical applications and simultaneous detection of IMD biomarkers. Future research will focus on validating the sensor in biological fluids such as serum and exploring enzymatic detection strategies to improve selectivity and practical applicability.
Author contributions
Priyadharshini Sriram: writing – original draft, methodology, data curation, investigation. Noel Nesakumar: formal analysis, interpretation and editing. John Bosco Balaguru Rayappan: conceptualization, supervision, funding acquisition and editing.
Conflicts of interest
The authors declare that they have no known competing financial interests or personal relationships that could have appeared to influence the work reported in this paper.
Data availability
Data will be made available on request.
Supplementary information (SI) is available. See DOI: https://doi.org/10.1039/d5ra08274a.
Acknowledgements
The authors thank TCS foundation project for their fellowship and the Department of Science and Technology (DST), New Delhi for the financial support under the PURSE project (SR/PURSE/2023/165) and Birla Institute of Technology and Science, Pilani (BBF/BITS/FY2023-2024/SPOKE-02). We also express our sincere gratitude to SASTRA Deemed University for the infrastructural support to carry out this research work.
References
- R. Mueller Bruffaerts, Ph. Mortier, G. Kiekens, R. P. Auerbach, P. Cuijpers, K. Demyttenaere, J. G. Green, M. K. Nock and R. C. Kessler, Physiol. Behav., 2016, 176, 139–148 Search PubMed.
- J. Deng, Q. Liu, L. Ye, S. Wang, Z. Song, M. Zhu, F. Qiang, Y. Zhou, Z. Guo, W. Zhang and T. Chen, Biomed. Pharmacother., 2024, 173, 116337 Search PubMed.
- E. Aliu, S. Kanungo and G. L. Arnold, Ann. Transl. Med., 2018, 6, 471 CrossRef CAS PubMed.
- S. Mirani, V. Poojari, N. S. Shetty and I. Shah, J. Clin. Exp. Hepatol., 2021, 11, 9–13 CrossRef CAS.
- H. Barone, I. B. Elgen, Y. T. Bliksrud, E. Vangsøy Hansen, R. R. Skavhellen, M. I. Furevik and J. Haavik, Front. Psychiatr., 2023, 14, 1213590 CrossRef.
- W. Wang, C. Liu, J. Luo, L. Lei, M. Chen, Y. Zhang, R. Sheng, Y. Li and L. Wang, Acta Pharmacol. Sin., 2024, 45, 2119–2133 CrossRef CAS.
- Y. Tang, Y. Li, P. Chen, S. Zhong and Y. Yang, BioEssays, 2025, 47, e202400111 Search PubMed.
- C. Stinton, J. Geppert, K. Freeman, A. Clarke, S. Johnson, H. Fraser, P. Sutcliffe and S. Taylor-Phillips, Orphanet J. Rare Dis., 2017, 12, 48 CrossRef.
- G. Neurauter, S. Scholl-bürgi, A. Haara, S. Geisler, P. Mayersbach, H. Schennach and D. Fuchs, Clin. Biochem., 2013, 46, 1848–1851 CrossRef CAS PubMed.
- J. Nielsen, D. G. Delicado, A. Mats and S. G. Villas-b, Anal. Biochem., 2003, 322(1), 134–138 CrossRef.
- G. Ravindran and W. L. Bryden, Food Chem., 2005, 89(2), 309–314 CrossRef CAS.
- M. Cheng, B. Tsai and J. Yang, Anal. Chim. Acta, 2011, 708, 89–96 CrossRef CAS PubMed.
- H. Chen and Y. Yeh, RSC Adv., 2020, 21, 29745–29750 RSC.
- E. Vaughan, C. Santillo, M. Setti, C. Larrigy and A. J. Quinn, Adv. Sens. Res., 2023, 2, 2300026 CrossRef CAS.
- J. Li, L. Li, P. Zhao and Y. Xie, Microchem. J., 2024, 200, 110426 CrossRef CAS.
- G. Liu, X. Guan, P. Zhang, Q. Tan, T. Li, X. Jin, H. Xu, C. Li and J. Zhao, Anal. Chem., 2025, 97, 22858–22870 CrossRef CAS PubMed.
- D. Li, J. Yin, Z. Yu, Z. Gao, N. Xu and L. Meng, Sens. Actuators, B, 2025, 444, 138493 Search PubMed.
- R. Yan, H. Guo, Z. Yang, W. Niu, Y. Yan, J. Ma, M. Wang and W. Yang, Mikrochim. Acta, 2025, 192, 502 CrossRef CAS PubMed.
- N. Erk, M. Naser and W. Bouali, Microchem. J., 2025, 208, 112626 CrossRef CAS.
- X. Liang, W. Wang, Q. Ma and L. Wang, J. Solid State Electrochem., 2024, 28, 3731–3744 CrossRef CAS.
- S. Rajendrachari, R. Shrinivas, R. Ramkumar, J. Puneetha, G. Kudur and H. Nagarajappa, Inorg. Chem. Commun., 2025, 177, 114360 Search PubMed.
- J. Zhang, S. Li, Y. Liu, X. Jiang, Y. Liu and J. Zou, J. Taiwan Inst. Chem. Eng., 2025, 172, 106111 CrossRef CAS.
- X.-Q. Wu, P.-Q. Feng, Z. Guo and X. Wei, Langmuir, 2020, 36, 14123–14129 CrossRef CAS PubMed.
- E. Habibi and H. Heidari, Electroanalysis, 2016, 28, 2559–2564 CrossRef CAS.
- N. Shadjou, M. Hasanzadeh and F. Talebi, J. Anal. Chem., 2018, 73, 602–612 CrossRef CAS.
- Z. Ifrah, A. Shah Rukh, S. Muhammad Nauman, S. Maryam and U. Rahat, Front. Mater., 2022, 9, 857432 Search PubMed.
- S. Dong, Q. Bi, C. Qiao, Y. Sun, X. Zhang, X. Lu and L. Zhao, Talanta, 2017, 173, 94–100 CrossRef CAS PubMed.
- R. Biswal, P. Yadav, P. Kumar and M. K. Singh, J. Inorg. Organomet. Polym. Mater., 2024, 34(6), 1–17 Search PubMed.
- H. Deng, X.-M. Wang, C. Du, X.-C. Shen and F.-Z. Cui, CrystEngComm, 2012, 14, 6647 RSC.
- S. Bansal, J. Singh, U. Kumari, I. P. Kaur, R. P. Barnwal, R. Kumar, S. Singh, G. Singh and M. Chatterjee, Int. J. Nanomed., 2019, 14, 809–818 CrossRef.
- F. Y. Ban, S. R. Majid, N. M. Huang and H. N. Lim, Int. J. Electrochem. Sci., 2012, 7, 4345–4351 Search PubMed.
- C. C. Caliman, A. F. Mesquita, D. F. Cipriano, J. C. C. Freitas, A. A. C. Cotta, W. A. A. Macedo and A. O. Porto, RSC Adv., 2018, 8, 6136–6145 RSC.
- E. Dervishi, Z. Ji, H. Htoon, M. Sykora and S. K. Doorn, Nanoscale, 2019, 11, 16571–16581 RSC.
- G. Rajender and P. K. Giri, J. Mater. Chem. C, 2016, 4, 10852–10865 RSC.
- H. Liu, X. Lv, C. Li, Y. Qian, X. Wang, L. Hu, Y. Wang, W. Lin and H. Wang, Nanoscale, 2020, 12, 10956–10963 Search PubMed.
- Y. Mao, C. Zhao, S. Ge, T. Luo, J. Chen, J. Liu, F. Xi and J. Liu, RSC Adv., 2019, 9, 32977–32983 RSC.
- F. Liu, Y. Sun, Y. Zheng, N. Tang, M. Li, W. Zhong and Y. Du, RSC Adv., 2015, 5, 103428–103432 RSC.
- W. Zuo, L. Tang, J. Xiang, R. Ji, L. Luo, L. Rogée and S. Ping Lau, Appl. Phys. Lett., 2017, 110, 221901 CrossRef.
- S. Monika, M. Mahalakshmi, N. Subha, M. S. Pandian and P. Ramasamy, Diam. Relat. Mater., 2022, 125, 109033 CrossRef CAS.
- C. Qiu, L. Jiang, Y. Gao and L. Sheng, Mater. Des., 2023, 230, 111952 Search PubMed.
- N. Maity, A. Kuila, S. Das, D. Mandal, A. Shit and A. K. Nandi, J. Mater. Chem. A, 2015, 3, 20736–20748 RSC.
- W. Zuo, L. Tang, J. Xiang, R. Ji, L. Luo, L. Rogée and S. Ping Lau, Appl. Phys. Lett., 2017 DOI:10.1063/1.4984238.
- Q. Bao, G. Li, Z. Yang, P. Pan, J. Liu, R. Tian, Q. Guo, J. Wei, W. Hu, W. Cheng and L. Lin, Microchem. J., 2023, 185, 108238 CrossRef CAS.
- C. Varodi, F. Pogăcean, M. Coroş, A. Ciorîță and S. Pruneanu, Sensors, 2022, 22, 3606 Search PubMed.
- A. Muthurasu, P. Dhandapani and V. Ganesh, New J. Chem., 2016, 40, 9111–9124 RSC.
- K. Maryam, M. U. Javed, C. Rafique and A. Habib, J. Electrochem. Sci. Eng., 2024, 14(6), 787–801 CAS.
- A. Ferlazzo, C. Espro, D. Iannazzo, A. Bonavita and G. Neri, Mater. Today Commun., 2023, 35, 106036 CrossRef CAS.
- Y. Wang, J. Jiao, M. Chu, Z. Jin, Y. Liu, D. Song, T. T. Yu, G. Yang, Y. Wang, H. Ma, H. Pang and X. Wang, Microchim. Acta, 2023, 190, 1–9 Search PubMed.
- S. Dervin, S. Member, P. Ganguly and R. Dahiya, IEEE Sens. J., 2021, 21, 26226–26233 CAS.
- H. Zhao, X. Zhou, Y. Zhao, Y. Wang, H. Geng, L. Gao, Z. Zhang and S. Han, J. Electroanal. Chem., 2025, 996, 119435 CrossRef CAS.
|
| This journal is © The Royal Society of Chemistry 2026 |
Click here to see how this site uses Cookies. View our privacy policy here. 
 Open Access Article
 This Open Access Article is licensed under a Creative Commons Attribution-Non Commercial 3.0 Unported Licence
 *ab
*ab


