DOI:
10.1039/D5RA07186K
(Paper)
RSC Adv., 2026,
16, 3409-3419
CHA-driven SERS-nanoenzyme sensor for ultra-sensitive diagnosis of gastric precancerous lesions
Received
22nd September 2025
, Accepted 8th December 2025
First published on 15th January 2026
Abstract
Early identification and timely intervention of precancerous lesions of gastric cancer are the core strategies to block their malignant transformation into gastric cancer (GC). This study developed a dual functional sensor that combined surface-enhanced Raman scattering (SERS) activity and nanoenzyme catalytic properties. The sensor was driven by catalytic hairpin self-assembly (CHA) technology triggered by the target microRNA-21 (miR-21), promoting the conversion of 3,3′,5,5′-tetramethylbenzidine (TMB) and signal amplification of TMB oxidation (ox-TMB). This work used Au–platinum nanoparticles (Au–Pt NPs) as nanozyme probes and silica-encapsulated ferrite (Fe3O4@SiO2) as capture probes. In the presence of target miR-21, CHA technology induced Au–Pt NPs to assemble on the Fe3O4@SiO2 surface, endowing the sensor with SERS enhancement capability and peroxidase-like (POD-like) simulated catalytic performance. This catalyzed the conversion of TMB and hydrogen peroxide (H2O2) into the oxidized product ox-TMB with characteristic absorption. CHA technology, acting as an intrinsic driving force for sensor assembly, further facilitated exponential amplification of the ox-TMB detection signal. This SERS sensor demonstrated outstanding detection performance, achieving a detection limit as low as 20.24 aM for miR-21. It also exhibited excellent clinical applicability and accuracy in clinical sample testing. Therefore, the proposed SERS sensor holds significant clinical potential for diagnosing gastric precancerous lesions.
1. Introduction
In the progression of gastric cancer (GC), precancerous lesions serve as a critical transitional stage from normal gastric mucosa to malignant transformation.1,2 Their early identification and intervention are crucial for reducing GC incidence.3 However, existing detection methods still face significant challenges in sensitivity, specificity, and cost-effectiveness for identifying early-stage lesions.4,5 In recent years, nanozymes have emerged as highly efficient enzyme-like catalysts.6,7 They combine the high catalytic activity of natural enzymes with the robust stability of nanomaterials, while also offering the potential for cost-effective large-scale production.8–10 Leveraging these unique advantages, nanozymes overcome limitations of traditional enzyme applications and have found widespread use in biosensing and cancer diagnostics.11,12 Current research on nanocatalysts in analytical applications primarily focuses on the direct visualization of substrate signals following catalytic reactions.13,14 Electrochemical detection technologies are susceptible to electrode stability issues, while colorimetric methods, though intuitive, suffer from background interference affecting color signals and limited quantitative accuracy.15,16 These factors constrain their broader application scenarios.
Surface-enhanced Raman scattering (SERS) stands out as a highly promising analytical technique, offering significant advantages such as rapid response, non-destructive analysis, and high sensitivity.17–19 With its high spectral peak resolution and strong resistance to interference, SERS can reflect subtle biochemical changes in tissues at the molecular level.20,21 Au–platinum nanomaterials (Au–Pt NPs) exhibit dual functionality due to their bimetallic structure: exceptional SERS enhancement effects and outstanding simulated enzyme catalytic activity.22,23 Iron-based nanomaterials, such as iron(III) oxide (Fe3O4), also exhibit advantages including good biocompatibility, low cost, and ease of magnetic separation.24 However, pure Fe3O4 nanomaterials exhibit strong ferromagnetism, leading to magnetic aggregation that causes uneven SERS hotspot distribution and poor reproducibility.25 To enhance the stability of Fe3O4 and the flexibility of surface modification, we introduced a silica (SiO2) coating to construct Fe3O4@SiO2 core–shell nanomaterials through physical isolation and chemical stabilization.
To integrate the dual-functional properties of Au–Pt bimetallic nanomaterials with the magnetic separability advantage of Fe3O4@SiO2 core–shell nanomaterials, we introduced the catalytic hairpin self-assembly signal amplification strategy (CHA) for composite assembly.26 The assembled gold–platinum nanoparticle-coated silica-coated ferrite oxide composite structure (Fe3O4@SiO2@Au–Pt NPs) exhibits dual functionality with both SERS activity and nanozyme catalytic performance. Compared to traditional nucleic acid amplification techniques, CHA achieves rapid SERS signal amplification under isothermal conditions without enzymatic catalysis through a cyclic chain displacement reaction.27,28 Leveraging this property with SERS technology, a CHA-driven magnetic aggregation-based SERS-nanocatalyst sensor was developed. This sensor employs an indirect signal enhancement mechanism to minimize background interference from exogenous signal-labeling molecules, offering a novel solution for detecting microRNAs (miRNAs) associated with gastric precancerous lesions.
In this study, we developed a dual functional SERS sensor driven by CHA technology, which combined SERS activity and nanoenzyme catalytic properties, and can catalyze 3,3′,5,5′-tetramethylbenzidine (TMB) and hydrogen peroxide (H2O2) to generate TMB oxidation (ox-TMB). Based on the detection of the SERS signal of ox-TMB, we achieved sensitive detection of miRNA-21 in human serum samples. As shown in Scheme 1A, Fe3O4@SiO2 core shell magnetic material was prepared by sequentially using solvothermal method and sol–gel method, surface modified with HP2 structure to obtain capture probes Fe3O4@SiO2@HP2. As shown in Scheme 1B, Au–Pt NPs were prepared using the sodium citrate reduction method. This material exhibited significant SERS enhancement properties and efficient peroxidase-like (POD-like) activity due to its combination of Au and Pt elements. Surface modification of Au–Pt NPs with HP1 hairpin structure to obtain nano enzyme probe Au–Pt NPs@HP1. When the target miR-21 was present, miR-21 induced complementary pairing between the HP1 sequence on the surface of the nanoenzyme probe and the HP2 hairpin sequence on the surface of the capture probe, and the released miR-21 continued to induce the next cycle, achieving the recycling of the target. Due to the complementary pairing of HP1 and HP2, Au–Pt NPs were assembled in Fe3O4@SiO2 surface, obtained Fe3O4@SiO2@Au–Pt NPs through magnetic separation, Fe3O4@SiO2@Au–Pt NPs possessed both SERS activity and POD-like activity, catalyzing the generation of ox-TMB with strong SERS signals (Scheme 1C). The core–shell magnetic material prepared in this study Fe3O4@SiO2 compared with Fe3O4 pure magnetic materials, SiO2 shell can improve material stability and surface modification flexibility, further enhancing the reproducibility and reliability of detection results. At the same time, the SiO2 shell can protect the Fe3O4 core layer and prevent Fe3O4 from being corroded by H2O2 during the catalytic process. Furthermore, this study employed CHA technology as a driving force to induce the cyclic assembly of bifunctional Fe3O4@SiO2@Au–Pt NPs, achieving cascading signal amplification and enabling ultrasensitive detection of targets. This approach offers a novel strategy for the early detection of gastric precancerous lesions.
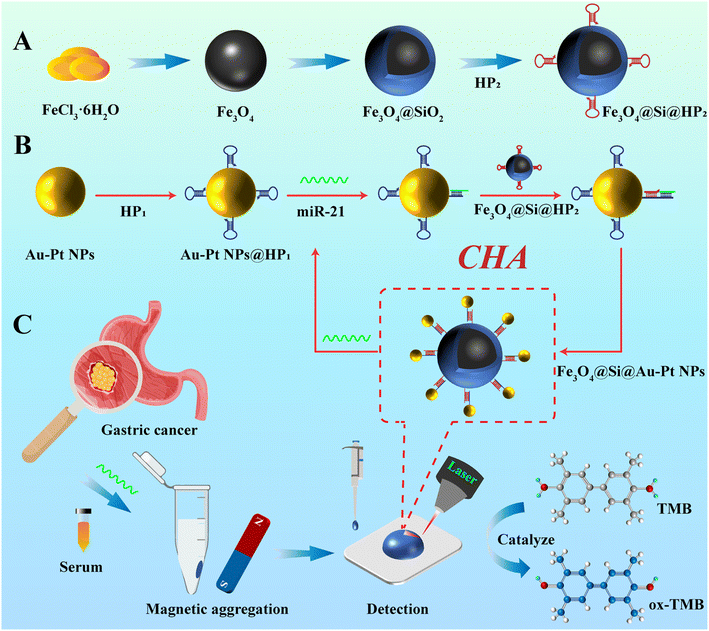 |
| | Scheme 1 (A) Preparation process of Fe3O4@SiO2, (B) preparation process of Au–Pt NPs, (C) process of detecting real serum samples using the SERS sensor. | |
2. Experiments and methods
2.1. Material and reagents
Chloroauric acid (HAuCl4), chloroplatinic acid hexahydrate (H2PtCl6·6H2O), ferric chloride hexahydrate (FeCl3·6H2O), hydrogen peroxide (H2O2), anhydrous ethanol, polydimethylsiloxane (PDMS), fetal bovine serum (FBS), and phosphate buffer solution (PBS) were purchased from China National Pharmaceutical Group Chemical Reagent Co., Ltd. Tetraethyl orthosilicate (TEOS), sodium citrate (TSC), ascorbic acid (AA), trichloroethyl phosphate (TCEP), 3,3′,5,5′-tetramethylbenzidine (TMB), and ammonia water (NH3·H2O) were purchased from Aladdin Biochemical Technology Co., Ltd. The Real-time Quantitative Polynucleotide Chain Reaction (qRT-PCR) kit was purchased from Jidan Biotechnology Co., Ltd. The nucleotide chains required for the experiment were provided by Shenggong Biotechnology (Shanghai) Co., Ltd (Table 1). The experimental water used is deionized water (18.2 MΩ cm).
Table 1 Summary of experimental nucleotide sequences
| Name |
Sequence (5′–3′) |
| miR-21 |
UAGCUUAUCAGACUGAUGUUGA |
| HP1 |
HS-TTTTTTTTCAACATCAGTCTGATAAGCTACATTGGATGCTCTAGCTTATCAGACTG |
| HP2 |
HS-TTTTTATATTTAAGCTAGAGCATCCAATGTAGCTTATCAGACTGCATTGGATGCTC |
| MT1 |
UAGCUUAUCAGAGUGAUGUUGA |
| MT3 |
UACGUUAUCAGACUCAUGUUGA |
| Random |
ACCAGCUCGAGUAAGGAAAUG |
2.2. Serum sample collection
This study is based on the “Screening and Early Diagnosis and Treatment Plan for Gastric Cancer (2024 Edition)”, strictly following the inclusion and exclusion criteria for clinical samples of GC, and combining gastroscopy observation, CT imaging examination, and pathological diagnosis results. We collected serum samples from 30 healthy individuals, 30 patients with precancerous lesions of GC, and 30 patients with GC. The specific information of the participants is shown in Table S1. All procedures were performed in accordance with the relevant national regulations of the “Ethical Review Measures for Biomedical Research Involving Human Subjects” University and approved by the Ethics Committee of Nantong Haimen People's Hospital. All subjects signed informed consent forms. The serum collection of clinical samples follows standard operating procedures (SOP): 1 mL of blood is collected from a vacuum blood collection tube and left to stand for 1 hour. The serum is separated by centrifugation (3000 rpm, 10 min), and the obtained serum samples are divided into sterile centrifuge tubes (0.2 mL per tube) and stored in a −80 °C ultra-low temperature freezer.
2.3. Preparation of nanoenzyme probes
Gold nanoparticles (Au NPs) with a diameter of 30 nm were prepared as the core via the sodium citrate reduction method.29 Take 30 mL of the Au NPs solution, dilute with deionized water to 60 mL, and heat to boiling. Sequentially add H2PtCl6 (2%, 1.5 mL) and AA (100 mM, 2.4 mL) to the mixture, maintaining the temperature at 100 °C for 20 minutes. After cooling, purify by centrifugation and redisperse in 25 mL of deionized water. The resulting particles were Au–Pt NPs.
Hairpin DNA (HP1 and HP2) was dissolved in a phosphate-buffered system containing magnesium ions (1× PBS, MgCl2 concentration 5 mM). Following denaturation (95 °C, 5 min), the solution was rapidly cooled on ice to prevent renaturation. Subsequently, 1 mM TCEP solution was added, and the mixture reacted at room temperature in the dark for 2 hours to ensure complete activation of the terminal thiol groups. Thoroughly mix the pretreated HP1 (10 µM) with the Au–Pt NPs solution (5 mL) and incubate overnight. After overnight incubation, disperse the mixture into BSA solution (1 wt%) and co-incubate for 1 hour for surface passivation. The resulting nanozyme probe (Au–Pt NPs@HP1) was prepared.
2.4. Capture probe preparation
Fe3O4 nanoparticles were synthesized via the sol–gel method.30 After the reaction, the black Fe3O4 product was collected by magnetic separation, washed three times sequentially with deionized water and anhydrous ethanol, then vacuum-dried at 65 °C to yield a black powder. The coating process employed the sol–gel method to synthesize Fe3O4@SiO2. Weigh 0.2 g of the prepared Fe3O4 nanoparticle powder and dissolve it in a mixture of 96 mL anhydrous ethanol and 24 mL distilled water. Subject the mixture to vigorous ultrasonic treatment for 10 min to achieve uniform dispersion. Add 4 mL of NH3·H2O as a catalyst and continue stirring for 25 min. Mix TEOS and anhydrous ethanol in equal proportions (1![[thin space (1/6-em)]](https://www.rsc.org/images/entities/char_2009.gif) :1). Slowly add this mixture dropwise to the reaction solution. Continue stirring at room temperature for 5 hours to allow complete hydrolysis of TEOS and formation of a uniform SiO2 coating layer on the Fe3O4 surface. After reaction completion, collect the Fe3O4@SiO2 product using the same method and prepare a stable suspension at 5 mg mL−1.
:1). Slowly add this mixture dropwise to the reaction solution. Continue stirring at room temperature for 5 hours to allow complete hydrolysis of TEOS and formation of a uniform SiO2 coating layer on the Fe3O4 surface. After reaction completion, collect the Fe3O4@SiO2 product using the same method and prepare a stable suspension at 5 mg mL−1.
Take pretreated HP2 (10 µM) and Fe3O4@SiO2 solution (5 mg mL−1, 3 mL), mix thoroughly, and incubate overnight. Collect the enriched product via magnetic separation to remove unbound hairpin DNA, yielding the capture probe (Fe3O4@SiO2@HP2).
2.5. Sensor preparation and Raman spectroscopy measurement
Prepare premix A by mixing equal volumes (1:1) of the prepared nanozyme probe and capture probe. Prepare premix B (PBS, pH = 4) by mixing equal volumes of TMB solution (1.2 M) and H2O2 solution (0.2 M). Add 800 µL of premix A and 300 µL of the sample to be tested into a 1.5 mL centrifuge tube. After incubation for 25 min, use a mini magnet to enrich and separate the product (Fe3O4@SiO2@Au–Pt NPs), wash away unbound nanozyme probes, and prepare the bifunctional sensor. Add 200 µL of premix B to the centrifuge tube and react at room temperature for 15 min, during which the solution gradually turns blue. After the reaction, pipette the blue solution onto a clean silicon wafer surface for Raman spectroscopy measurement. Instrument settings were as follows: excitation wavelength, power, integration time, and detection range were 785 nm, 5 mW, 5 s, and 600–1800 cm−1 respectively. Origin software was used for baseline correction and spectral smoothing. Spectral data represent the average of measurements taken at random positions on the same sample (n = 3).
2.6. Material characterization
Measure the ultraviolet absorption spectrum (UV-vis) of nanoparticles using a UV-vis spectrophotometer (Cary 60, Agilent). Field emission scanning electron microscopy (S-4800 II, Hitachi), transmission electron microscopy (Tecnai 12, Philips), and field emission high-resolution transmission electron microscopy (Tecnai G2 F30 S-TWIN, FEI) were employed to characterize the size and microstructure of the nanomaterials.
3. Results and discussions
3.1. Feasibility validation of CHA-driven amplification sensing strategy
To validate the feasibility of the CHA-driven sensing strategy proposed in this study, polyacrylamide gel electrophoresis (PAGE, 15%) was employed to characterize the strategy using target miR-21 as an example (Fig. S1). The leftmost lane represented the marker. HP1 (lane 1), HP2 (lane 2), and target miR-21 (lane 3) exhibited distinct bands. When HP1 and HP2 were mixed without adding target miR-21, almost no reaction occurred between them (lane 4). When HP1 was co-incubated with target miR-21, miR-21 induced HP1 to open its hairpin structure, forming an HP1–miR-21 complex. This complex exhibited increased molecular weight and reduced migration rate, forming an upper band (lane 5). Further addition of HP2 displaced miR-21 via a chain displacement reaction, forming an HP1–HP2 complex with an even larger molecular weight (lane 6). These experimental results fully validated the feasibility of the proposed sensing strategy for detecting target miR-21.
3.2. Characterization of Au–Pt NPs
This study used seed growth method to prepare nano enzyme probes, and obtained Au–Pt NPs with a diameter of about 50 nm, presenting a spike-like structure on the surface, uniform morphology, stable size, and batch preparation (Fig. 1A and B). Combining high-resolution transmission electron microscopy (HRTEM) image and selected area electron diffraction (SAED) patterns (Fig. 1C and D), distinct local lattice fringes were observed in the Au–Pt NPs. The lattice fringes with a spacing of 0.227 nm correspond to the {111} crystal plane of Pt in a face-centered cubic (FCC) structure. Furthermore, the Au–Pt NPs exhibited a single-crystal structure. The elemental composition of Au–Pt NPs was determined by energy dispersive X-ray spectroscopy (EDX) (Fig. 1E). Au–Pt NPs were composed of Au and Pt elements, C element came from the surfactant used in the preparation process, and Cu element came from the network structure as the test carrier. The element mapping further confirmed the uniform distribution of Au and Pt elements in Au–Pt NPs. Verified by UV-vis (Fig. 1F), Au–Pt NPs exhibited POD-like enzyme activity and can catalyze the generation of ox-TMB from H2O2 and TMB, resulting in the transformation of light gray liquid solution (Au–Pt NPs, UV absorption peak: 555 nm) into blue solution (ox-TMB, UV absorption peak: 652 nm). Enzyme reaction kinetics analysis was performed on the POD-like activity of Au–Pt NPs (Fig. 1G and H), and Michaelis–Menten curves and typical reciprocal plots were fitted. Au–Pt NPs nano enzyme exhibited high affinity (low Km of 0.393 mM) and considerable catalytic ability (Vmax of 5.962 µm s−1), indicating their enormous potential for efficient catalytic applications.
 |
| | Fig. 1 (A) SEM image, (B) TEM image, (C) HRTEM image, (D) SAED image, (E) EDX image, (F) UV-vis image, (G) Michaelis–Menten curve, and (H) typical reciprocal plot of Au–Pt NPs. | |
3.3. Characterization of the preparation process for Fe3O4@SiO2@Au–Pt NPs
The preparation process of Fe3O4@SiO2@Au–Pt NPs were characterized step by step. The initial Fe3O4 exhibited surface-rough spherical particles (Fig. 2A) with an average diameter of approximately 228 nm. To enhance solution stability, a layer of SiO2 was encapsulated onto the Fe3O4 surface, forming smooth spherical Fe3O4@SiO2 structures (Fig. 2B) with a diameter of about 428 nm. Fe3O4@SiO2 exhibited a distinct core–shell structure (Fig. 2E and H), with Fe3O4 as the core and SiO2 as the shell, whose thickness was approximately 50 nm. Finally, the Au–Pt NPs nanoenzyme probe was assembled onto the surface of the capture probe Fe3O4@SiO2 via CHA technology, forming the Fe3O4@SiO2@Au–Pt NPs (Fig. 2C, F and I), which endowed the Fe3O4@SiO2@Au–Pt NPs with nanoenzyme catalytic activity. Fig. 2D further illustrated the color changes in the solution and UV-vis absorption during the preparation of Fe3O4@SiO2@Au–Pt NPs, confirming their potent POD-like activity. Modifying Fe3O4@SiO2@Au–Pt NPs with 4-MBA at a specific concentration (10−6 M) as the signal molecule, compared to pure 4-MBA (10−1 M), yielded a characteristic peak at 1075 cm−1 (Fig. 2G). Yielding an enhancement factor (EF) of 1.2 × 10⁶, demonstrating dual functionality in both SERS and nanocatalytic activity.
 |
| | Fig. 2 SEM image of (A) Fe3O4, (B) Fe3O4@SiO2, (C) Fe3O4@SiO2@Au–Pt NPs. (D) UV-vis and color changes during the preparation of Fe3O4@SiO2@Au–Pt NPs. TEM image of (E) Fe3O4@SiO2, (F) Fe3O4@SiO2@Au–Pt NPs. (G) SERS enhancement performance verification of Fe3O4@SiO2@Au–Pt NPs. HRTEM image of (H) Fe3O4@SiO2, (I) Fe3O4@SiO2@Au–Pt NPs. | |
3.4. Verification of element distribution in the preparation process of Fe3O4@SiO2@Au–Pt NPs
The elemental composition and distribution of intermediates during the preparation process of Fe3O4@SiO2@Au–Pt NPs were verified. Fig. 3A illustrated the synthesis process of Fe3O4@SiO2@Au–Pt NPs. Au–Pt NPs were assembled onto the Fe3O4@SiO2 surface via miR-21 target-triggered assembly, successfully constructing a bifunctional composite exhibiting both SERS activity and nanocatalytic properties. Fig. 3B and C showed the elemental mapping distribution comparison between Fe3O4@SiO2 and Fe3O4@SiO2@Au–Pt NPs. It could be observed that Au–Pt bimetallic nanospheres were attached to the surface of the Fe3O4@SiO2 core–shell structure. Concurrently, EDX image comparison (Fig. 3C) revealed that Au–Pt NPs assembled on the surface of the intermediate Fe3O4@SiO2 structure, resulting in altered elemental composition with the addition of Au and Pt. This further confirmed via electron optical techniques the feasibility of the CHA-amplified sensing strategy.
 |
| | Fig. 3 (A) Synthesis process of Fe3O4@SiO2@Au–Pt NPs, (B) elemental mapping of Fe3O4@SiO2, (C) elemental mapping of Fe3O4@SiO2@Au–Pt NPs, (D) comparison of EDX images for Fe3O4@SiO2 and Fe3O4@SiO2@Au–Pt NPs. | |
3.5. Experimental parameter optimization
To optimize detection performance and obtain reliable results, optimal experimental parameters were achieved by adjusting reaction conditions such as CHA reaction time, pH, TMB concentration, and H2O2 concentration. As shown in Fig. 4A, with increasing CHA reaction time, more Au–Pt NPs were assembled on the Fe3O4@SiO2 surface, endowing the sensor with stronger SERS enhancement effects and POD-like catalytic capabilities. The catalytic production of increased ox-TMB resulted in a significant enhancement of the characteristic peak intensity at 1606 cm−1. This increase was attributed to inter-ring C–C stretching vibrations.31 The SERS intensity of the characteristic peak reached its maximum at 25 min, indicating that the optimal CHA reaction time for this SERS sensor was 25 min. pH directly influenced the catalytic efficiency of nanozymes. As shown in Fig. 4B, the intensity of the characteristic peak at 1606 cm−1 first increased and then decreased with rising pH, reaching its maximum at pH = 4. This result confirmed that the catalytic efficiency of Fe3O4@SiO2@Au–Pt NPs nanozyme reached its peak at pH = 4, maximizing the conversion of TMB and H2O2 into ox-TMB. The optimal pH value for this nanozyme was pH = 4. As shown in Fig. 4C and D, the intensity of the characteristic peak at 1606 cm−1 exhibited a trend of first increasing, then decreasing after reaching its peak. When the TMB concentration was 1.2 M and the H2O2 concentration was 0.2 M, the catalytic rate of ox-TMB reached its maximum, and the Fe3O4@SiO2@Au–Pt NPs exhibited optimal POD-like activity.
 |
| | Fig. 4 Experimental parameter optimization: (A) CHA reaction time, (B) pH, (C) TMB concentration, (D) H2O2 concentration. | |
3.6. Specific and stability evaluation
In biological sample analysis, specificity and reproducibility are key indicators for evaluating the performance of SERS sensors. To verify its specificity, this study selected single base mismatches, triple base mismatches, blank and random sequences as control groups (1 nM), and compared them with the target miR-21 (100 pM) for analysis. The nucleotide sequences used in the experiment are shown in Table 1. After three repeated detections, and the corresponding SERS detection results are shown in Fig. 5A and B. Using the characteristic peak at 1606 cm−1 corresponding to ox-TMB, the intra group relative standard deviation (RSD) of the control group was calculated to be 8.29%, indicating that the sensor has high recognition specificity for miR-21. To further investigate the reproducibility of the sensors, five different batches of sensors were used to detect the same sample solution (CmiR-21 = 100 pM). After three repeated detections, and the intensity changes of the characteristic peak at 1606 cm−1 were shown in Fig. 5C and D. The RSD values between the five batches of sensors were calculated to be 9.33%, indicating that the developed SERS sensor had good repeatability and detection stability. Only miR-21 was targeted, and SERS spectra were detected in the presence of physiologically relevant serum interferents (Fig. S2A). The RSD value of SERS intensity between groups at 1606 cm−1 was 7.28%, and the RSD values of SERS intensity corresponding to characteristic peaks within all test groups were below 10% (Fig. S2B). Therefore, the SERS sensor has strong serum anti-interference ability.
 |
| | Fig. 5 Sensor performance evaluation. (A and B) Specificity evaluation, (C and D) reproducibility evaluation. | |
3.7. Quantitative detection of miR-21
In the evaluation system for assessing the performance of SERS sensors in detecting samples, quantitative analysis of their sensitivity metrics is crucial. Using fetal bovine serum as the solvent, miR-21 target solutions at different concentration gradients (1 fM to 100 pM) were prepared. As shown in Fig. 6A, increasing target concentrations induced more Au–Pt NPs to assemble on the Fe3O4@SiO2 surface via CHA technology, forming Fe3O4@SiO2@Au–Pt NPs composite structures and yielding a bifunctional SERS sensor. The SERS activity and POD-like activity of this sensor increased with rising miR-21 concentration, catalyzing greater conversion of TMB and H2O2 into ox-TMB. The intensity of the characteristic peak at 1606 cm−1 corresponding to ox-TMB consequently rose. Concurrently, the CHA technology enables the recycling of targets, whereby the induced assembly of miR-21 continues to drive the assembly of the next batch of Fe3O4@SiO2@Au–Pt NPs complexes, further amplifying the characteristic peak signal intensity at 1606 cm−1. A significant linear correlation existed between the logarithm of miR-21 concentration and the intensity of the characteristic peak at 1606 cm−1 (Fig. 6B). The fitted linear equation was y = 1417.18x − 1851.03 (R2 = 0.9513). Calculations indicated a sensitivity of 20.24 aM for miR-21 detection using this sensor. Comparing the detection performance of this SERS sensor with other methods (Table 2), this approach significantly reduced detection sensitivity while providing a broader detection range. Although the current research uses miR-21 as the target to verify the sensing mechanism, the sensing mechanism in this study has the potential to expand to multiplex detection and multiple types of targets. Through the integration of microfluidic chip or microarray platform, multi-target synchronous analysis of spatial/spectral partition can be realized. In addition, this sensing mechanism can be used to detect other tumor biomarkers by redesigning hairpin DNA, which has a broad application prospect in future disease detection.
 |
| | Fig. 6 (A) SERS spectra of miR-21 at different concentration gradients in serum and (B) the corresponding linear relationship. | |
Table 2 Comparison of this strategy with other methods in biomarker detection
| Method |
Biomarker |
Linear range |
Detection limit |
Ref. |
| Electrochemistry |
miR-21 |
1.0 fM to 1 nM |
0.58 fM |
32 |
| Fluorescence |
miR-21 |
0–80 nM |
0.25 nM |
33 |
| Colorimetric |
miR-21 |
1–100 fM |
8.9 fM |
34 |
| SERS |
miR-21 |
10 pM to 1 fM |
20.24 aM |
This work |
3.8. Characterization of clinical samples
The clinical samples collected under three disease states, including healthy people (chronic gastritis), patients with precancerous lesions of GC and patients with GC, were characterized. As shown in Fig. 7A–C, the gastric mucosa was uniform in color and smooth in surface, with normal gastric morphology, clear surrounding tissues, normal cell morphology in pathological sections, and a small number of normal inflammatory cells could be seen. It was comprehensively determined as a healthy person in combination with blood examination. As shown in Fig. 7D–F, ulcer and local redness could be seen on the surface of gastric mucosa, local thickening of gastric wall could be seen, pathological section showed that glands have high dysplasia, and mitosis is increased. Combined with blood examination, it was comprehensively determined as precancerous lesion of GC. As shown in Fig. 7F and G, the gastric mucosa had large ulcerative lesions covered with dirty moss, the gastric wall was irregular and the hierarchical structure is fuzzy, and there were local invasion and lymph node metastasis. Cancer cells could be seen in the pathological section. The cell morphology was obviously heteromorphic, and the normal tissue structure was lost. Combined with the blood examination, it was comprehensively determined as GC.
 |
| | Fig. 7 Gastroscopy, CT and pathological verification of (A and B) healthy people, (C–F) precancerous lesions, (G–I) patients with GC. | |
3.9. Detection of clinical samples
To validate the reliability of the constructed sensor, this study performed SERS detection on 90 collected human serum samples, obtaining SERS spectra from healthy individuals, patients with gastric precancerous lesions, and GC patients (Fig. 8A). The intensity of the characteristic peak at 1606 cm−1 in the serum SERS spectra from different disease states (Fig. 8B) was substituted into the linear regression equation (Fig. 6B) to calculate the miR-21 content in human serum across the three disease states (Table S2), with clinical sample sizes of 30 for different groups and 3 replicates for detection. The obtained results were compared with qRT-PCR detection results (Table 3), demonstrating high consistency with absolute deviations all below 10%.
 |
| | Fig. 8 (A) SERS spectra of serum samples from healthy individuals, patients with gastric precancerous lesions, and GC patients detected by the SERS sensor, and (B) histogram of the characteristic peak intensity at 1606 cm−1. | |
Table 3 Comparison between this study and qRT-PCR detection of human serum samples
| Sample |
SERS (fM) |
qRT-PCR (fM) |
Relative error (%) |
| Health |
0.779 |
0.813 |
4.306 |
| Precancer |
2.622 |
2.481 |
−5.394 |
| GC |
4.793 |
4.993 |
4.172 |
4. Conclusion
This study successfully developed a dual-functional sensor based on SERS signal detection, combining SERS activity with nanozyme catalytic properties. Assisted by target-triggered CHA technology as the driving force to promote the generation and amplification of ox-TMB signals, it enables sensitive detection of miR-21 in the serum of GC precancerous patients. This study constructed novel Fe3O4@SiO2 core–shell magnetic materials. The SiO2 shell coating effectively reduced the susceptibility of pure Fe3O4 to oxidation reactions and agglomeration, significantly enhancing the dispersion, stability, and surface functionalization potential of the magnetic nanomaterials. Targeted miR-21 in serum triggers CHA technology, driving the assembly of dual-functional Au–Pt NPs onto the Fe3O4@SiO2 surface. Magnetic separation yields the Fe3O4@SiO2@Au–Pt NPs composite structure, endowing the sensor with strong SERS activity and high POD-like activity. Furthermore, the sensor demonstrates excellent specificity, reproducibility, broad detection range, and low sensitivity when analyzing serum samples. Clinical serum test results exhibit high consistency when compared against the gold standard qRT-PCR. However, there are still some issues to be addressed in clinical applications, such as the heterogeneity of clinical samples and the complexity of analyzing serum sample data. In the future, we should focus on optimizing these aspects to promote the wider application of this technology in clinical diagnosis and treatment.
Conflicts of interest
The authors declare that there are no conflicts of interest related to this article.
Data availability
The data that has been used is confidential. All data supporting this study are included in the article and its supplementary information (SI). Supplementary information is available. See DOI: https://doi.org/10.1039/d5ra07186k.
Acknowledgements
This work was financially supported by the 2024 Haimen District-level Social Welfare and People's Livelihood Technology Plan Projects, General Program of Nantong Municipal Health Commission Research Project (MS2024111, MS2024112) and the Nantong University Special Research Fund for Clinical Medicine (2024LZ028).
References
- Z. Zhang, S. Chen, S. Li, Y. Zheng, L. Mai and X. Zhang, Front. Med., 2025, 12, 150474 Search PubMed
 .
. - L. Wang, Y.-J. Lian, J.-S. Dong, M.-K. Liu, H.-L. Liu, Z.-M. Cao, Q.-N. Wang, W.-L. Lyu and Y.-N. Bai, World J. Gastroenterol., 2025, 31, 102053 Search PubMed .
- C. Shang, Y. Zhang, Y. Wang, W. Zhao, X. Sun, X. Dong and H. Qiao, Int. J. Biol. Macromol., 2025, 296, 139772 CrossRef CAS PubMed .
- D. Gao, J. Zhao, X. Yu, B. Zhang, M. Kong, Y. Fang, X. Li, J. Li and C. Zhu, Biomed. Res., 2017, 28, 6140–6143 Search PubMed .
- S. Ding, S. Hu, J. Pan, X. Li, G. Li and X. Liu, Expert Syst., 2020, 37, e12499 CrossRef .
- B. Zeng, Y. Tang, Y. Chen, Y. Liu, Y. Xia and F. Zhao, Anal. Chem., 2022, 94, 17787–17794 CrossRef .
- Q.-h. Yao, M.-h. Zeng, C. Zhang, F. Zheng, J.-w. Jin, T.-x. Ye, Y.-t. Wang, X.-m. Chen, Z.-y. Guo and X. Chen, Biosens. Bioelectron., 2025, 282, 117449 Search PubMed .
- X. Zhang, L. Zou, H. Liao, H. Ren, H. Niu, Z. Li, X. Zhang, X. Huang, Y. Liu, Z. Zhou, H. Pan, H. Ma and S. Rong, Microchim. Acta, 2025, 192, 103 Search PubMed .
- X. Wang and G. Shan, arXiv, 2024, arXiv:2406.04006, DOI:10.48550/arXiv.2406.04006.
- E. J. Cho, S. J. Lee, K. Lee, D.-S. Lee, Y. J. Lee and H.-J. Bae, Bioenergy Res., 2015, 8, 788–795 CrossRef CAS .
- H. Qin, R. Dai, P. Hu, H. Liu, C. Du, K. Huang and Z. Wang, Microchem. J., 2024, 207, 112016 CrossRef CAS .
- G. Guan, Z. Lin, J. Qian, F. Wang, L. Qu and B. Zou, Nanomaterials, 2025, 15, 712 CrossRef CAS PubMed .
- Z. Yan, H. Yuan, Q. Zhao, L. Xing, X. Zheng, W. Wang, Y. Zhao, Y. Yu, L. Hu and W. Yao, Analyst, 2020, 145, 3173–3187 RSC .
- T.-D. Liu, X.-Y. Ma, T.-F. Li, J. Wang and L.-C. Liu, Chin. J. Anal. Chem., 2024, 52, 1697–1707 CAS .
- B. Zhu, D. T. Bryant, A. Akbarinejad, J. Travas-Sejdic and L. I. Pilkington, Polym. Chem., 2022, 13, 508–516 Search PubMed .
- Y. Li, P. Li, Y. Chen, Y. Wu and J. Wei, Biosens. Bioelectron., 2023, 228, 115200 CrossRef CAS .
- J. Wang, J. Xia and H. Zhang, Laser Optoelectron. Prog., 2024, 61, 0900010 CrossRef .
- Z. Lin and L. He, Curr. Opin. Food Sci., 2019, 28, 82–87 CrossRef .
- J. Guo, F. Zeng, J. Guo and X. Ma, J. Mater. Sci. Technol., 2020, 37, 96–103 CrossRef CAS .
- W. Jiang, Q. Wang, K. Chang and Y. Zhao, Compr. Rev. Food Sci. Food Saf., 2024, 23, e70024 CrossRef CAS PubMed .
- C. Bao, X. Liu, C. Liang and S. Xu, J. Raman Spectrosc., 2025, 56, 959–973 CrossRef CAS .
- Y. Zhuang, H. Yin, Y. Huang, F. Jiang, L. Li, Z. Wu, Y. Yang, X. Cao and W. Wei, Biosens. Bioelectron., 2025, 283, 117536 CrossRef CAS PubMed .
- N. Bi, L. Sun, M. Hu, W. Song, J. Xu and L. Jia, Chem. Eng. Sci., 2025, 309, 121510 CrossRef CAS .
- M. Salehirozveh, P. Dehghani and I. Mijakovic, J. Funct. Biomater., 2024, 15, 340 CrossRef CAS PubMed .
- Y. Chen, C. Wu, H. Xie, Z. Deng, Y. Liu, Y. Zhang, Z. Huang, H. Hu and T. Gan, J. Alloys Compd., 2023, 963, 171220 CrossRef CAS .
- Y. Si, L. Xu, T. Deng, J. Zheng and J. Li, ACS Sens., 2020, 5, 4009–4016 CrossRef CAS PubMed .
- P. Wang, Y. Liu, X. Li, C. Li and G. Li, Microchim. Acta, 2024, 191, 441 CrossRef CAS .
- S. Wang, J. Shang, B. Zhao, H. Wang, C. Yang, X. Liu and F. Wang, ChemPlusChem, 2023, 88, e202300432 Search PubMed .
- S. Guo, L. Wang, S. Dong and E. Wang, J. Phys. Chem. C, 2008, 112, 13510–13515 Search PubMed .
- Y. Lu, X. Jin, X. Li, M. Liu, B. Liu, X. Zeng, J. Chen, Z. Liu, S. Yu and Y. Xu, Polymers, 2023, 15, 248 CrossRef CAS PubMed .
- S. Laing, A. Hernandez-Santana, J. Sassmannshausen, D. L. Asquith, I. B. McInnes, K. Faulds and D. Graham, Anal. Chem., 2011, 83, 297–302 CrossRef CAS .
- R. Zeng, J. Xu, T. Liang, M. Li and D. Tang, ACS Sens., 2023, 8, 317–325 CrossRef CAS .
- X. Lu, D. Li, Z. Luo and Y. Duan, Analyst, 2022, 147, 2834–2842 RSC .
- J. Piao, Q. Zhao, D. Zhou, W. Peng, W. Gao, M. Chen, G. Shu, X. Gong and J. Chang, Anal. Chim. Acta, 2019, 1052, 145–152 CrossRef CAS .
Footnote |
| † Both authors contributed equally to this work. |
|
| This journal is © The Royal Society of Chemistry 2026 |
Click here to see how this site uses Cookies. View our privacy policy here. 
 Open Access Article
 This Open Access Article is licensed under a Creative Commons Attribution-Non Commercial 3.0 Unported Licence
 c,
Miaowen Xuc,
Zixun Wangc,
Jingwen Zhuc and
Jinxin Sheng
c,
Miaowen Xuc,
Zixun Wangc,
Jingwen Zhuc and
Jinxin Sheng


