
 Open Access Article
 This Open Access Article is licensed under a Creative Commons Attribution-Non Commercial 3.0 Unported Licence
Chemotherapeutic loaded dynamic aggregated albumin nanoparticles for lung cancer therapy
Jyotish
Kumar†
 ab,
Sourima
Kundu†
a,
Asmita
Mojumdar
ac,
B. S.
Unnikrishnan
*ad,
Devika B.
Chithrani
e and
Gopinath
Packirisamy
*ac
ab,
Sourima
Kundu†
a,
Asmita
Mojumdar
ac,
B. S.
Unnikrishnan
*ad,
Devika B.
Chithrani
e and
Gopinath
Packirisamy
*ac
aDepartment of Biosciences and Bioengineering, Indian Institute of Technology, Roorkee, Uttarakhand-247667, India. E-mail: ukbsbio@gmail.com; gopi@bt.iitr.ac.in
bDepartment of Chemistry and Biochemistry, University of Texas at El Paso, El Paso, TX 79968, USA
cCentre for Nanotechnology, Indian Institute of Technology, Roorkee, Uttarakhand-247667, India
dDepartment of Pathology, Faculty of Medicine, Dalhousie University, Nova Scotia, Canada
eDepartment of Physics and Astronomy, University of Victoria, Victoria, British Columbia, Canada
First published on 4th November 2025
Abstract
The development of safe and effective anticancer drugs remains a significant challenge for the scientific community. A broad range of chemotherapeutic agents has been extensively evaluated for their efficacy across various patient populations. Among them, epirubicin has exhibited strong anti-cancer potential across different tumor models. In this study, epirubicin-loaded bovine serum albumin nanoparticles (EPI@BSA) were prepared using the desolvation method to explore their potential in lung cancer therapy. Physicochemical characterization confirmed that the nanoparticles were spherical and highly monodispersed. Cytotoxicity testing on the A549 cell line revealed enhanced cell death with the nanoparticle formulation compared to that with the free drug. Furthermore, semi-quantitative RT-PCR analysis indicated that the nanoparticles effectively induced apoptosis. These findings support the potential of a protein-based biodegradable carrier system to enhance the therapeutic efficacy of epirubicin in cancer treatment.
1. Introduction
Cancer is a disease that accounts for one in every six fatalities worldwide. According to estimates from 2022, there were an estimated 20 million new cancer cases and 9.7 million deaths.1 Cancer is a dreadful disease condition that develops over time with a generalized loss of growth control of cells.2–5 Cancer can be treated via surgery, radiation therapy, and chemotherapy, either separately or in combination.6,7 The cutting-edge strategy combines therapeutic and diagnostic capabilities on a single nanoscale platform, enabling more efficient and personalized cancer treatment.8 It helps in early detection and diagnosis,9 targeted drug delivery,10,11 enhanced therapeutic efficacy,12–14 combinatorial therapy,15,16 overcoming drug resistance17–19 and reducing the systemic toxicity of the free drug8,9 in the cancer treatment.Owing to their unique properties, such as biocompatibility, improved pharmacokinetics, enhanced targeting capacity and versatility, protein-based nanoparticles, particularly serum protein-based nanocarriers have drawn a lot of attention in the field of cancer therapy.20 Albumin,21 apoferritin,22 and lipoprotein23,24 are the most common serum proteins to be used for drug delivery. Recent research has shown that the paclitaxel-bound albumin nanoparticles (Abraxane™) were found to be effective for the management of breast cancer and lung cancer, and the precise biological design and potential clinical applications of serum protein-based nanoparticles have sparked interest in these materials.25 Since then, ten other albumin-based medications or imaging agents are undergoing clinical trials for a range of diseases, including diabetes, hepatitis C, rheumatoid arthritis, and cancer. Seven of these medications have already hit the market.26–28 As a result, there has been an increase in interest in using serum albumin as a cargo for drug delivery systems.29 Albumin-based nanoparticles are effective agents for drug delivery because of the Enhanced Permeability and Retention (EPR) effect30 and intrinsic targeting properties of albumin via gp60- and SPARC-mediated receptor endocytosis.29 Furthermore, surface modification albumin was carried out as the molecules possess a lot of carboxylic and amino groups. Bovine serum albumin (BSA), human serum albumin (HSA), rat serum albumin, ovalbumin, and other albumin sources have been widely utilized to date, serving as potential carriers for the delivery of diverse compounds, including drugs, genes, peptides, and antibiotics.27 Additionally, BSA nanoparticles have been studied for the potential release of stimuli-responsive delivery systems. Albumin based nanocarriers have often been used to increase the solubility and bioavailability of hydrophobic drugs. Anticancer drugs like niclosamide have a limited range of clinical uses due to their severe hydrophobicity and subsequently low systemic absorption. These hydrophobic drugs can be made water soluble using nanoparticle-based drug delivery strategies, avoiding the limitation of poor solubility.31 Previous studies have demonstrated that BSA–folate conjugate-stabilized silver nanoparticles (Ag NPs) can serve as a platform for developing folate receptor-targeted nanoparticles for cancer therapy. The surface coating via albumin improved the Ag NP stability and promoted folate conjugation by crosslinking chemistry. The produced nanoparticles exhibit excellent binding, particularly when applied to FR+ (MCF-7), than FR− cells (A549), which results in increased cellular internalization.32
Unquestionably, the most effective cancer medicines are anthracyclines, which have a variety of antitumor effects. Members of this pharmacological class are extremely effective against lymphoma, multiple myeloma, and leukaemia, as well as epithelial tumors. Many anticancer antibiotics, including doxorubicin, belong to the anthracycline group. Epirubicin represents a recently developed derivative of doxorubicin. The main difference between epirubicin and doxorubicin is in the steric position of the 4′-OH group.33 Although epirubicin shows activity in all cell cycle phases, it is particularly active in the synthesis and G2 phases. Epirubicin stabilizes the topoisomerase II–DNA complex following intercalation between DNA base pairs, causing irreversible DNA strand breaks. Acute dose-limiting hematological damage and cumulative dose-related cardiac toxicity are the main side effects of epirubicin34,35 The adverse effects of epirubicin are caused not only because of the properties of the drug but also by the non-specific targeting method of drug administration, which during chemotherapy damages both healthy non-cancerous tissues and cancer cells.
A number of research studies have already explored the use of albumin-based drug delivery systems to enhance the therapeutic efficacy of anticancer drugs while reducing its side effects and increasing its specificity and enabling slow and sustained release of the drug in the target tumor tissue.31,36–38 Previous research has described the production of bovine serum albumin nanoparticles with folate surface modification (FA-BSANPs) with the drug (FA-EPI-BSA-NPs) by the desolvation method for a specific-targeting drug delivery system in cancer treatment.39 The study had evaluated the effectiveness of the polymeric nanoparticle on the human hepatocarcinoma cell line SMMC-7221.40 In a similar approach, Yang et al. modified BSA to construct a nanosystem capable of regulated drug delivery and release. Doxorubicin (DOX) was added to BSA nanoparticles using the desolvation approach, and then the DOX-loaded system (DOXs-BSA NPs) was crosslinked utilizing cleavable bonds leading to pH-sensitive DOXs-BSA NPs. Compared to the free DOX control, the toxic effects of DOXs-BSA NPs on tumor cells were significantly greater.29,41
In the current study, to expand the scope of the use of epirubicin in cancer therapy, it was encapsulated into bovine serum albumin nanoparticles (EPI@BSA). The current drug delivery system is advantageous as it has the capability to minimize the drawbacks of conventional chemotherapy and enhances tissue-specific drug delivery, potentially enhancing the efficacy of the drug. Additionally, it is being critically analyzed for its potential molecular level activity. The effectiveness of this approach will be further studied in the future to assess its real-world applications.
2. Methodology
2.1. Materials
Epirubicin hydrochloride was purchased from Sigma-Aldrich. Acridine orange, BSA and ethidium bromide were purchased from HiMedia, India. LysoTracker™ Green DND-26 and Hoechst 33342 dyes, Dulbecco's modified Eagle's medium (DMEM), and penicillin–streptomycin were procured from Thermo Fisher Scientific, USA. Fetal bovine serum (FBS) was procured from Thermo Fisher Scientific, USA. All other molecular biology grade chemicals were purchased from Merck.2.2. Preparation of EPI@BSA
Desolvation and crosslinking methods were used in the synthesis of EPI@BSA. Briefly, BSA solution (50 mg mL−1) was incubated with epirubicin hydrochloride (200 µg mL−1) with continuous stirring at room temperature for 15 minutes. Absolute ethanol was added to the mixture dropwise at a steady rate of 1 mL min−1 for 45 minutes until the mixture turned turbid. After stirring for 10 minutes, 30 µL of 8% glutaraldehyde was gradually added to the mixture followed by overnight stirring. The colloidal mixture was then centrifuged at a speed of 12![[thin space (1/6-em)]](https://www.rsc.org/images/entities/char_2009.gif) 000g for 30 minutes, and the resulting pellet was washed three times with absolute ethanol to remove any unbound reagents. The final pellet was stored at 4 °C until use.
000g for 30 minutes, and the resulting pellet was washed three times with absolute ethanol to remove any unbound reagents. The final pellet was stored at 4 °C until use.
2.3. Characterization of EPI@BSA
The encapsulation of the nanoparticles was determined using UV-Vis spectroscopy. The samples were taken in quartz cuvettes and the absorbance was read at the wavelength range 200–800 nm. The molecular vibrations of BSA and EPI@BSA were recorded on an Agilent ATR-FTIR spectrometer, USA. The excitation wavelength was set at 480 nm, corresponding to the absorption maximum of epirubicin, and emission spectra were recorded from 500 to 700 nm. All spectra were corrected by subtracting the background signal from equivalent concentrations of BSA nanoparticles without EPI. Measurements were performed in triplicate to ensure reproducibility. To measure the hydrodynamic size and surface charge of the synthesized nanoparticles, the particles in aqueous medium were analyzed using Dynamic Light Scattering (DLS) (Malvern, UK). The surface morphology analysis was performed using FE-SEM (Carl Zeiss Gemini, Germany) and AFM (NT-MDT-INTEGRA, USA). The images were processed using the software programs such as ImageJ and Gwyddion.2.4. Efficiency analysis of drug encapsulation
Various concentrations of epirubicin were prepared in water as follows: 10, 5, 2.5, 1.25, 0.625, 0.3125 and 0.15625 µM. The maximum absorbance at 480 nm was measured using a nano-spectrophotometer (DeNovix DS-11, USA) to plot the calibration curve. The absorbance of EPI@BSA was measured at 480 nm using a spectrophotometer keeping BSA NP as a blank. The amount of entrapped drug in the synthesized EPI@BSA was calculated according to the equation given below. | (1) |
2.5. Drug release profiling of epirubicin from EPI@BSA
The in vitro release of EPI from EPI@BSA nanoparticles was evaluated under three different pH conditions using the dialysis method with 1 mL of the nanoparticle suspension.37–42 Three dialysis tubes were kept under three different pH conditions. The dialysis was carried out against 30 mL each of buffer at pH 5.5, 6.5 and 7.4 under shaking at 50 rpm and 37 °C. After a predefined time, 1 mL of buffer solution in each tube was collected followed by the addition of an equal amount of fresh buffer. Using a Biotek Cytation™ 3 plate reader (Biotek Epoch, USA), the concentration of released epirubicin in buffer solution at different pH values was examined. Finally, based on the encapsulation efficiency of EPI@BSA, the cumulative drug release percentage at different time points was computed. All the experiments were performed in triplicate. The following equation was used to estimate the percentage of drug release: | (2) |
2.6. Evaluation of the antineoplastic activity of EPI@BSA NPs
 | (3) |
:1) dye mixture was added to each well. The cells were then visualized using an EVOS M5000 imaging system (Thermo Fisher Scientific, USA), and images were captured under red and green filters.
Lysotracker and Hoechst 33342 dyes were combined to stain the EPI@BSA treated cells in order to assess the nanoparticles’ ability to be taken up by the cells. The cells were seeded in a 96-well plate for one day, followed by the treatment with 10 µM each of EPI@BSA and free EPI. The medium was discarded followed by washing with PBS and the cells were stained using 100 μL of Lysotracker/Hoechst 33342 mix in each well. The excess dye was removed after incubation and then visualized under a fluorescence microscope (EVOS M5000 Thermo Fisher Scientific, USA).
Furthermore, the amount of drug taken up per mg of cell protein was also determined quantitatively using a Bradford assay kit (Thermo Fisher Scientific, USA) which was used to plot a standard BSA calibration curve. A549 cells were seeded in a 6-well tissue culture plate, treated with free EPI and EPI@BSA (10 μM) and kept for 24 h incubation. The cells were lysed after incubation, and the supernatant was collected after centrifugation. The photoluminescence (PL) intensity of the cell extract was determined using a spectro-fluorophotometer. The protein extract was then subjected to the Bradford assay to determine the total protein concentration in the sample. The amount of drug taken up per mg of cell was calculated using the following formula:
 | (4) |
The dilution factor refers to the dilution of the protein extract that was used in the Bradford assay.
3. Results and discussion
3.1. Synthesis and characterization of EPI@BSA
BSA nanoparticles are promising drug delivery vehicles due to their low toxicity, appreciable swelling behaviour, high drug-loading capacity, scalability, and minimal immunogenicity. These nanoparticles can evade systemic clearance and maintain an optimal protein conformation with bioactive amino acids that facilitate adsorption of charged drug molecules. Epirubicin, a positively charged fluorescent drug, can interact with hydrophobic tryptophan residues within the BSA core, resulting in stable nanoparticle formation. The EPI@BSA nanoparticles were prepared using the desolvation method, in which absolute ethanol was employed to remove water from the polymer solution, and glutaraldehyde served as a crosslinking agent47–49 (SI Fig. S1). The process produces homogeneous, uniform particles with minimal aggregation, exhibiting stability in both water and cell culture media. Glutaraldehyde was used as a crosslinking agent to stabilize EPI@BSA nanoparticles by linking the amino groups of BSA, facilitating nanoparticle formation.37,50 The produced NPs were examined using UV-visible spectroscopy, and as can be seen, a spectrum scan from 190 to 700 nm was used to identify the absorption maxima in Fig. 1(A). The absorption spectrum of BSA protein displayed two peaks at 235 nm and 275 nm. Free epirubicin exhibited peaks at 234 nm and 489 nm, whereas epirubicin-loaded BSA nanoparticles (EPI@BSA) in aqueous medium showed a single peak at 231 nm. The UV-Vis absorption spectrum of EPI@BSA shows a noticeable decrease in intensity compared to that of free EPI. While this change could suggest an interaction between BSA and EPI, we acknowledge that the magnitude of the absorption change may also be influenced by optical effects, and absorption spectroscopy alone lacks sufficient sensitivity to definitively confirm complex formation. To provide stronger evidence for the interaction, we complemented these measurements with fluorescence spectroscopy, which shows a slight blue shift in emission upon binding, consistent with partial quenching of the fluorophore. These combined observations support the formation of a BSA-EPI complex while avoiding overinterpretation based solely on absorbance data. Fluorescence spectroscopy was performed to confirm the fluorescence properties of EPI, BSA NPs and EPI@BSA. Epirubicin is a fluorescent molecule and gives a red colour fluorescence upon excitation at a wavelength of 480 nm. The emission wavelengths were found to be 602 nm, 481 nm, and 549 nm for EPI, BSA NPs and EPI@BSA NPs, respectively. The results show a decrease in epirubicin's fluorescence emission from 602 nm to 549 nm upon encapsulation within the nanoparticles, therefore suggesting successful encapsulation of epirubicin within the BSA nanoparticles. A low intensity fluorescence was also observed in BSA nanoparticles, indicating aromatic amino acids in BSA protein (Fig. 1B).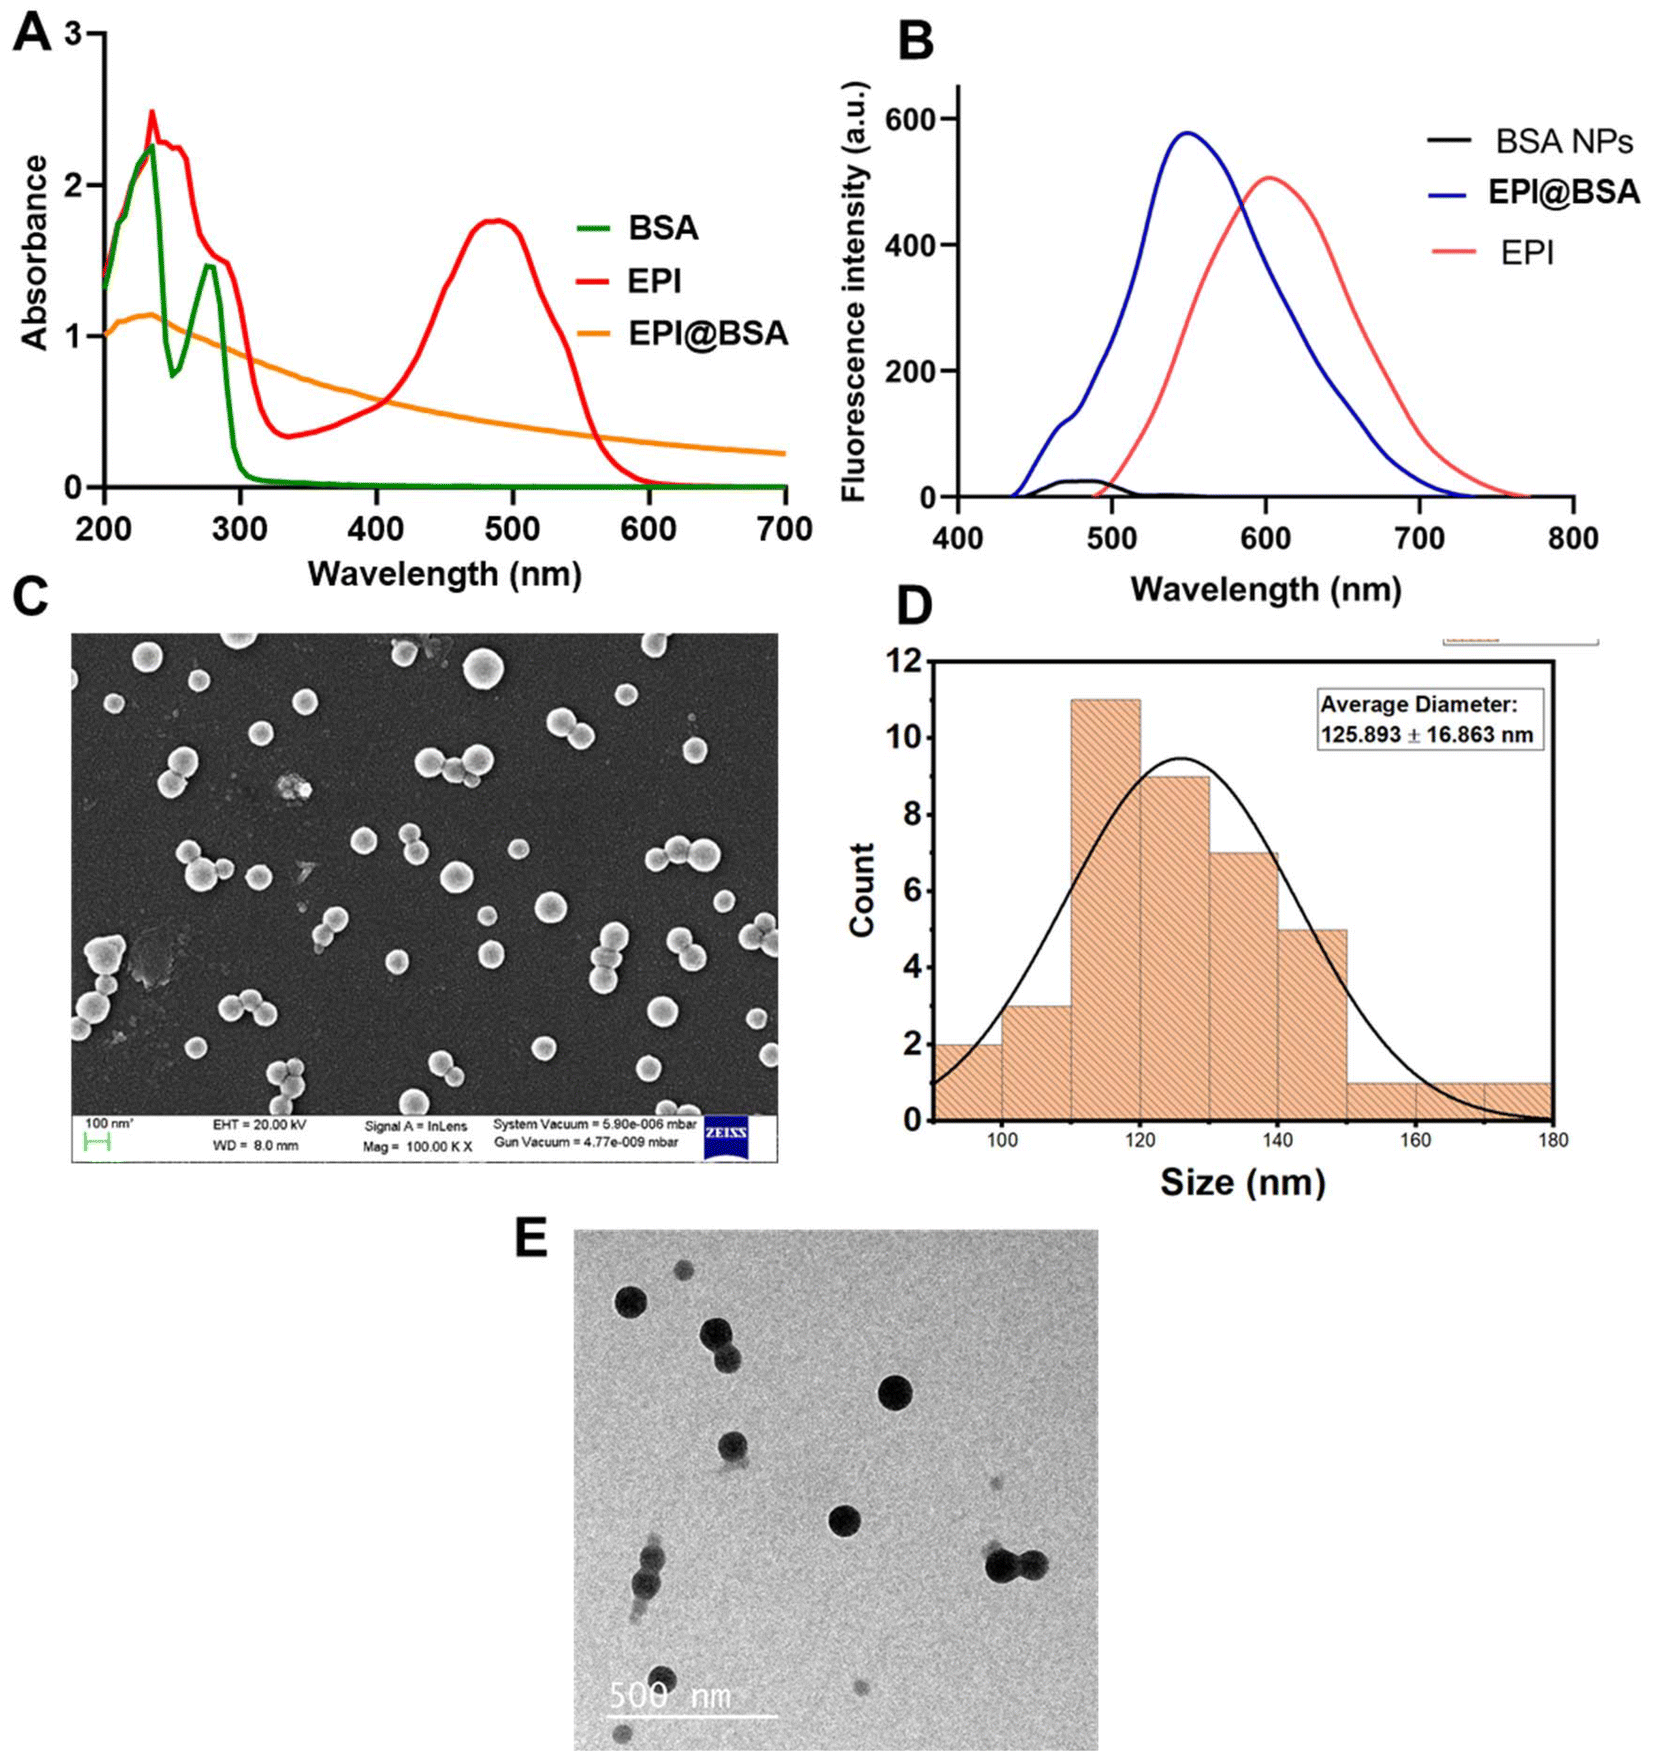 | ||
| Fig. 1 Characterization of EPI@BSA NPs: (A) UV-Vis spectroscopic analysis. (B) Fluorescence spectrum, (C) SEM (D) Histogram depicting size distribution. (E) TEM analysis. | ||
FE-SEM was employed to examine the surface morphology of the synthesized EPI@BSA. As shown in Fig. 1C and D, the drug-loaded BSA nanoparticles exhibited a spherical shape with a uniform size of 125.893 ± 16.863 nm. The synthesized BSA NPs showed a similar spherical surface morphology to that of EPI@BSA as shown in SI Fig. S2A & B. Transmission electron microscopy was also performed to study the shape, size and aggregation of the synthesized nanoparticles. Fig. 1E shows TEM photomicrographs of EPI@BSA NPs. The photomicrographs in the figure clearly show the spherical shape of the nanoparticles.
The hydrodynamic size distribution of the synthesized NPs was obtained by using Dynamic Light Scattering (DLS). The prepared EPI@BSA NPs’ particle size distribution is shown in SI Fig. S2C. The mean hydrodynamic size for EPI@BSA was found to be around 256.6 nm with a poly-dispersity index (PDI) of 0.211. The nanocarrier size plays a critical role in determining the efficiency of drug delivery. The EPR effect allows NPs up to 400 nm to preferentially reach the tumor microenvironment.51 The average surface roughness of the synthesized EPI@BSA NPs is shown in the SI Fig. S2D. The images were handled using Gwyddion software and the mean roughness of EPI@BSA NPs was found to be 26.58 nm. Thus, the average roughness decreased on drug encapsulation. The considerably higher zeta potential of the synthesized NPs signifies the stability of the NPs.52 The zeta potential of the particles was found to be ∼−40 mV which indicates its stability in an aqueous environment (SI Fig. S3A and B).
XRD analysis was performed to check the occurrence state of EPI encapsulated within the BSA nanoparticles. Comparing with the standard curve for crystalline EPI from the literature it was confirmed that EPI@BSA does not have any crystalline EPI inside BSA NPs and all the drug is in an amorphous form.53 The results show that the EPI is entirely encapsulated inside the BSA nanocarrier, thus making it an excellent vehicle for drug delivery (SI Fig. S4A).
Only BSA displayed the characteristic FTIR peaks at 3302.42 cm−1 (N–H stretching, amide A), 2924.09 cm−1 (aliphatic C–H stretching), 1669.84 cm−1 (amide I, C![[double bond, length as m-dash]](https://www.rsc.org/images/entities/char_e001.gif) O stretching), and 1567.34 cm−1 (amide II).31,53–55A typical decrease in the stretching frequency was observed for EPI@BSA NPs in SI Fig. S4B. The BSA amide I peak shifted from 1669.84 to 1638.16 cm−1, the amide II peak from 1567.34 to 1535.66 cm−1, and the –OH peak from 3302.42 to 3289.37 cm−1. These shifts likely result from cross-linking between residual amide groups and the amino acids in BSA with epirubicin.
O stretching), and 1567.34 cm−1 (amide II).31,53–55A typical decrease in the stretching frequency was observed for EPI@BSA NPs in SI Fig. S4B. The BSA amide I peak shifted from 1669.84 to 1638.16 cm−1, the amide II peak from 1567.34 to 1535.66 cm−1, and the –OH peak from 3302.42 to 3289.37 cm−1. These shifts likely result from cross-linking between residual amide groups and the amino acids in BSA with epirubicin.
3.3. Encapsulation efficiency (EE) and drug release study of nanoparticles
Different concentrations (10, 5, 2.5, 1.25, 0.625, 0.3125 and 0.15625 µM) of the free drug were prepared and absorbance was measured at 480 nm using UV-visible spectroscopy. The absorbance of the synthesized EPI@BSA NPs was taken at 480 nm keeping BSA NP as a blank. The drug encapsulation efficiency of EPI@BSA nanoparticles was calculated to be 87.91% using eqn (1) mentioned above. As shown in SI Fig. S5, the in vitro release of EPI@BSA was monitored over 72 hours at predetermined time points (0, 0.5, 1, 2, 3, 4, 8, 24, 48, and 72 h) in buffers of pH 5.5, 6.5, and 7.4. The sustained release profile of EPI@BSA highlights its potential as a drug delivery system in nanomedicine. Enhanced stability in physiological buffers is attributed to glutaraldehyde-induced cross-linking of the protein nanoparticles. Glutaraldehyde is a toxic reagent, and therefore we took special care to minimize any potential residual presence in the final EPI@BSA nanoparticles. After crosslinking, the nanoparticles were subjected to multiple cycles of centrifugation and washing with ethanol and deionized water to thoroughly remove unreacted glutaraldehyde. Cell viability assays performed in our study did not show any cytotoxicity attributable to glutaraldehyde, supporting that trace levels, if any, were negligible and had no impact on subsequent biological experiments (Fig. 2A). The study demonstrated that the drug delivery system enabled a controlled and sustained release of the medication in the medium, supporting its potential application in lung cancer therapy.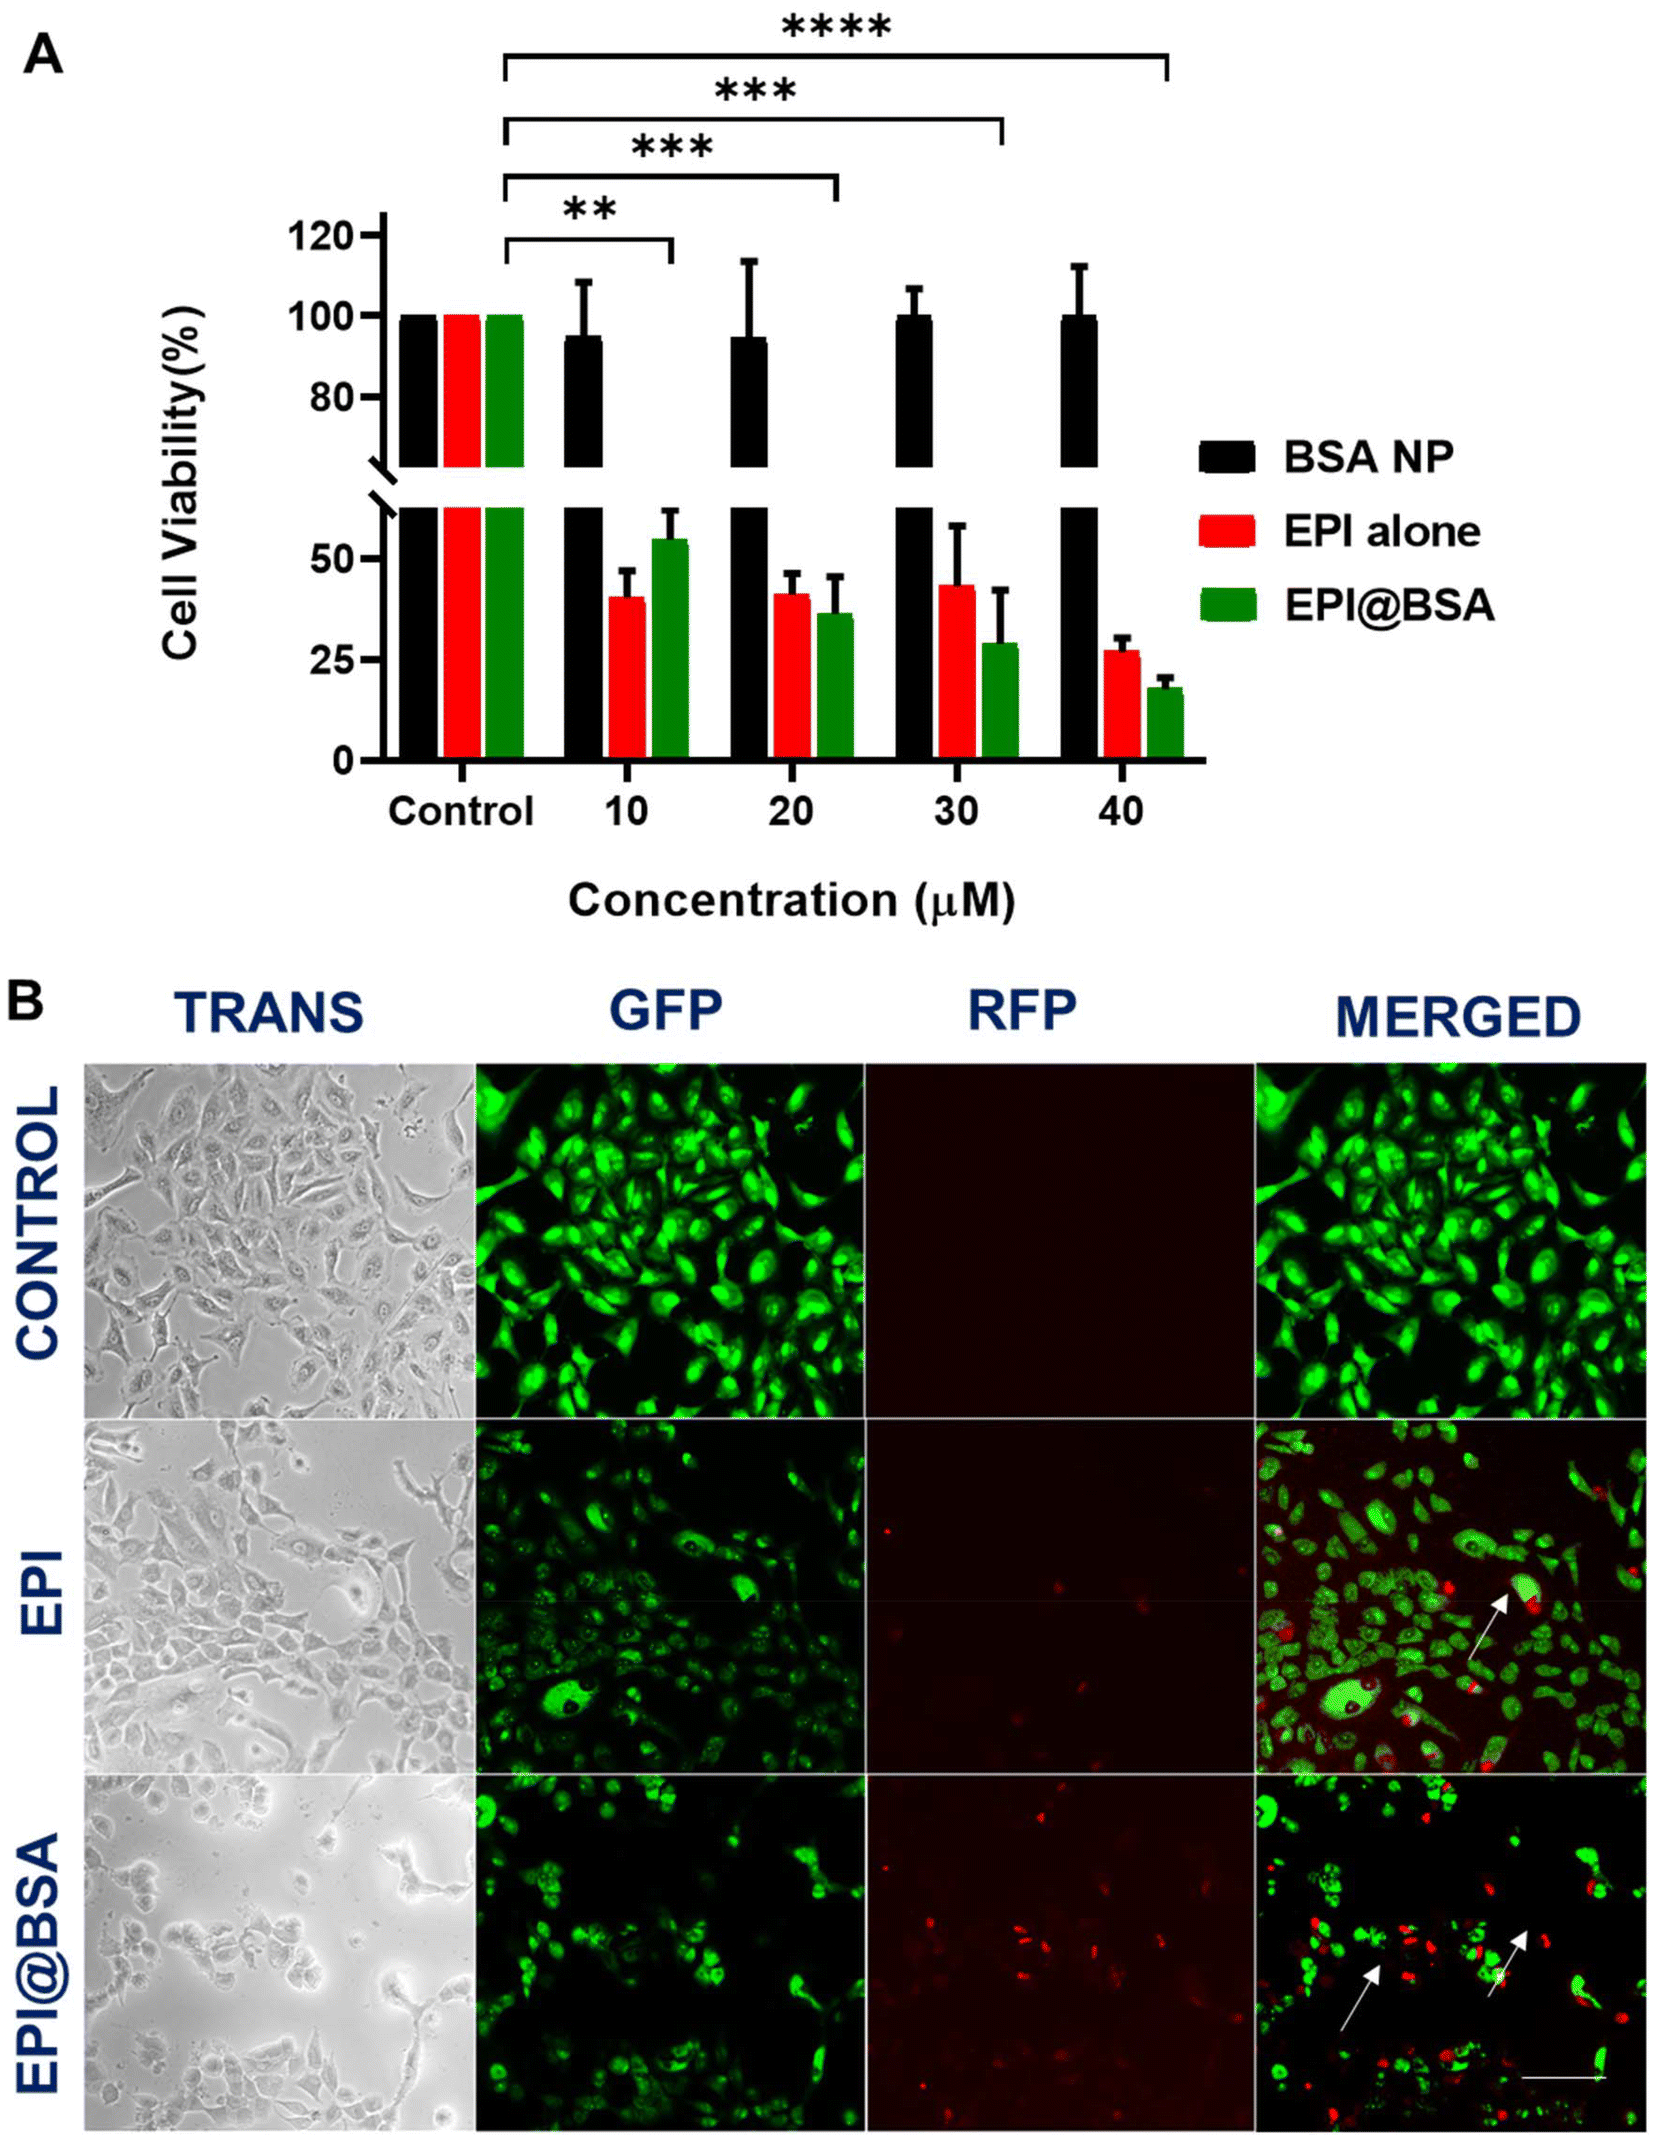 | ||
| Fig. 2 (A) Cell viability analysis of A549 cells. (B) Live–dead staining of A549 cells treated with the free drug and EPI@BSA NPs. Scale bar corresponds to 300 µm. Data expressed as mean ± S.D. Statistically significant differences at *P < 0.05, **P < 0.01, ***P < 0.001 and ***P < 0.0001. | ||
3.4. In vitro cell viability assay
As depicted in Fig. 2A, the MTT cell viability assay was conducted to assess the effect of EPI@BSA on A549 cells at drug-equivalent concentrations of 10, 20, 30, and 40 µM. EPI@BSA nanoparticles reduced A549 cell viability in a concentration-dependent manner. While sustained drug release is a potential contributing factor, the data presented here only demonstrate the observed cytotoxic effect. At the maximum used concentration of 40 µM, the free drug showed a cell viability of 26.93%, whereas the synthesized NPs had a cell viability of 17.69% proving that the EPI@BSA is more effective than the free drug. In contrast to the free epirubicin, EPI@BSA can therefore function as an efficient cargo system with an increased antitumor property.3.5. Cell morphological analysis and uptake imaging using dual staining
To identify qualitatively whether apoptotic cell death occurred, AO and EB dual staining was carried out in EPI@BSA treated A549 cells and were observed under the fluorescence microscope. A549 cells were treated with 10 µM EPI@BSA. The EB stain could not enter the viable cell nucleus and live cells showed light green fluorescence due to the presence of only AO (Fig. 2B).56,57 The AO/EB staining clearly exhibited the morphological changes of EPI@BSA-induced apoptosis that occurred in A549 cells.In order to examine the lysosomal entry of nanoparticles, Lysotracker and Hoechst 33342 were used to analyse the uptake nature of the EPI@BSA treated A549 cells and were observed under the fluorescence microscope. A549 cells were treated with 10 µM EPI@BSA. Lysotracker dye stains the lysosomes green and Hoechst 33342 stains the nuclei of the cells blue. EPI@BSA nanoparticles exhibit intrinsic red fluorescence. Co-localization with lysosomes produces yellow-orange fluorescence, indicating nanoparticle uptake and lysosomal fusion for cytosolic drug release (Fig. 3A). As shown in Fig. 3A, treatment with EPI@BSA nanoparticles resulted in a modest increase in cellular uptake compared to untreated controls or BSA-only controls (SI Fig. S6). While the enhancement is limited, it demonstrates that BSA nanoparticles can deliver EPI into cells, providing a baseline for further optimization. The surface morphological changes of A549 cells treated with free EPI and EPI@BSA NP were also observed under the FE-SEM. The characteristic morphology of untreated A549 cells that exhibits strong surface adhesion may be seen in Fig. 3B. However, as compared to the control, the treated cells with both the drug and EPI@BSA were loosely adherent to the surface and had a rounded morphology. Apoptotic cell death occurred in the treated cells as demonstrated by the appearance of membrane blebbing, constriction of cytoplasm, and the creation of apoptotic bodies.
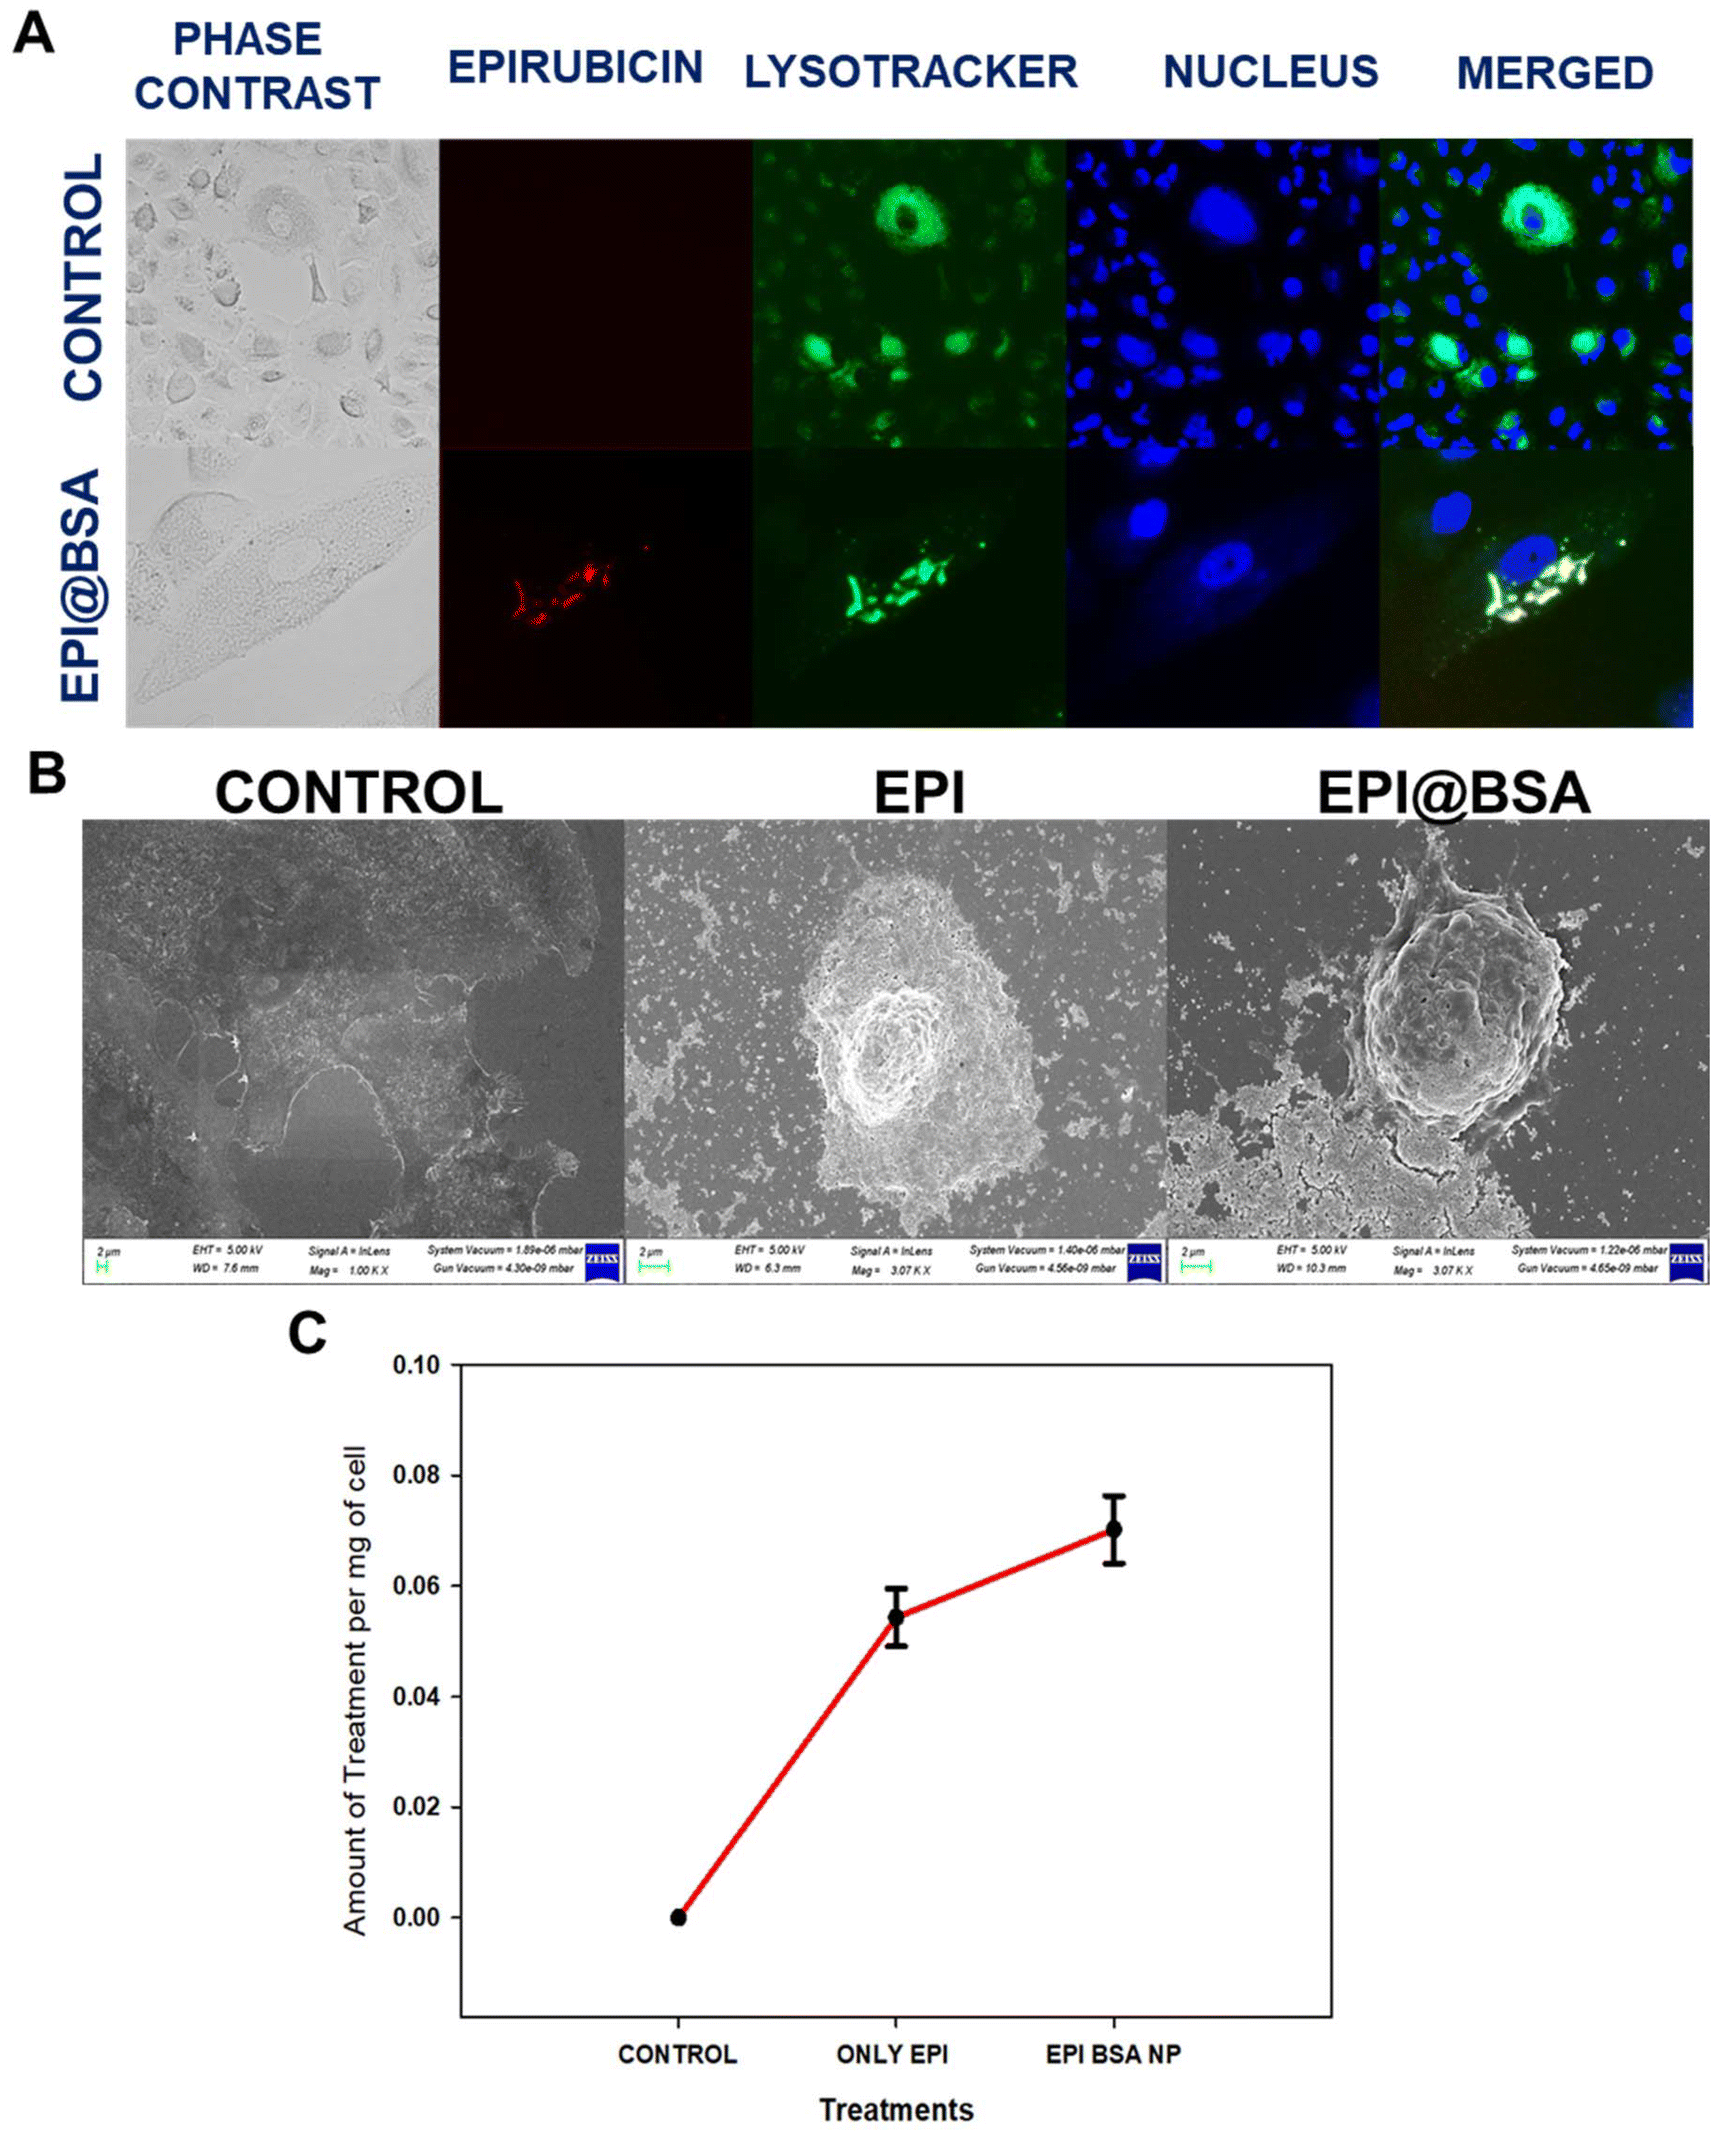 | ||
| Fig. 3 (A) Lysotracker/Hoechst 33342 staining to analyse the uptake efficiency of nanoparticles. (B) FE-SEM analysis of cells treated with the free drug and EPI@BSA NPs. Scale bar corresponds to 2 µm. (C) Quantitative drug uptake study of nanoparticles in A549 cells after 24 h. | ||
The intrinsic fluorescence of epirubicin was used to monitor the cellular uptake of EPI@BSA in A549 cells.58 After 24 h of incubation, there was a significant uptake of EPI@BSA nanoparticles in A549 cells (Fig. 3C). As is evident from the plot, in the case of EPI@BSA NP, the amount of drug taken up per mg of the cell is significantly more compared to that of the free drug. This may be due to the diffusion of the free drug in the medium, thus resulting in its dilution.
3.6. Semi-quantitative RT-PCR analysis
The ability of EPI@BSA in the induction of programmed cell death in A549 cells was evaluated using semi-quantitative RT-PCR analysis. The findings revealed that EPI@BSA-induced cell death was mediated by caspase-3 and Bcl-2 genes. The Bcl-2 (anti-apoptotic) gene expression was found to be down-regulated in the NP-treated cells, whilst the expression of the apoptotic signalling gene caspase-3 showed an up-regulation (Fig. 4A). In our study, we found that the caspase-3 gene expression was higher in EPI@BSA treated cells, suggesting that this protein plays a role in EPI@BSA-mediated apoptosis. RT-PCR results show upregulation of caspase-3 by EPI@BSA and downregulation by free EPI are intriguing (Fig. 4B). One possible explanation is that the EPI@BSA formulation enhances intracellular delivery and retention of EPI, leading to a stronger pro-apoptotic response, while free EPI at the tested concentration may induce cytotoxic stress through caspase-independent pathways (e.g., necrosis or autophagy), resulting in the suppression of caspase-3 transcription. Similar dual responses depending on the drug formulation and concentration have been reported in the literature for anthracyclines.59–61 The gene expression profile results strongly indicated that treating A549 cells with EPI@BSA causes apoptosis and subsequent cell blebbing (Fig. 4). | ||
| Fig. 4 (A) Representative gel electrophoresis images showing the qPCR end products of apoptosis-related genes in A549 cells treated with EPI@BSA nanoparticles. (B) Quantitative real time PCR for genes involved in the apoptosis of A549 cells treated with EPI@BSA NPs. (C) Mechanistic model of EPI@BSA NPs in lung cancer tissue. | ||
4. Conclusion
The limitations of the existing chemotherapeutic management of malignant cancer can be overcome by the development of protein-based nanoparticles. This study reports the underlying apoptotic and anti-apoptotic genes that may be involved in the induction of apoptosis by EPI@BSA NPs that were prepared by the desolvation method. BSA-NPs demonstrated a much better slow and sustained release of epirubicin in an aqueous environment. Studies on the uptake of EPI@BSA NPs in A549 cells revealed significant internalization of these nanoparticles, suggesting that these nanoparticles may have potential in the delivery of drugs. Furthermore, human serum albumin (HSA) should take the place of BSA in the future to prevent any potential immunologic side effects in vivo. Therefore, our data suggest that the epirubicin inside a biodegradable protein-based carrier could maximize its chemotherapeutic potential and minimize its side effects. Further experiments are underway to prove the mechanistic aspects of the efficacy of drug loaded nanoparticles in lung cancer cells.Conflicts of interest
The authors have no conflict of interest.Data availability
The data supporting this article have been included as part of the supplementary information (SI). Supplementary information is available. See DOI: https://doi.org/10.1039/d5pm00136f.Acknowledgements
This work was supported by the Shastri Institutional Collaborative Research Grant (SICRG) and Scheme for Promotion of Academic and Research Collaboration (SPARC) (Grant No.: SPARC/2019-2020/P2745/SL), Ministry of Education (MoE), Government of India. Mr Jyotish Kumar and Ms Sourima Kundu are grateful to the Department of Biotechnology (DBT), for the fellowship. Dr Unnikrishnan B. S. (MHRD Institute postdoctoral fellow) and Ms Asmita Mojumdar (PMRF PhD student) thank the Ministry of Education, Government of India, for providing the fellowship. We are thankful to the Institute Instrumentation Centre, Indian Institute of Technology Roorkee, for providing the facilities and support during the study. Prof. Gopinath Packirisamy is grateful to the Department of Biotechnology, Government of India, for the TATA Innovation Fellowship.References
- F. Bray, M. Laversanne, H. Sung, J. Ferlay, R. L. Siegel, I. Soerjomataram and A. Jemal, CA-Cancer J. Clin., 2024, 74, 229–263 CrossRef PubMed.
- K. Ganesh and J. Massagué, Nat. Med., 2021, 27, 34–44 CrossRef CAS.
- H. Sung, J. Ferlay, R. L. Siegel, M. Laversanne, I. Soerjomataram, A. Jemal and F. Bray, CA-Cancer J. Clin., 2021, 71, 209–249 CrossRef.
- D. T. Debela, S. G. Muzazu, K. D. Heraro, M. T. Ndalama, B. W. Mesele, D. C. Haile, S. K. Kitui and T. Manyazewal, SAGE Open Med., 2021, 9, 20503121211034366 CrossRef.
- S. W. D. Merriel, S. M. Ingle, M. T. May and R. M. Martin, BMJ Open, 2021, 11, e044420 Search PubMed.
- A. Roy and S.-D. Li, Wiley Interdiscip. Rev.: Nanomed. Nanobiotechnol., 2016, 8, 891–908 Search PubMed.
- GlobalSurg Collaborative and National Institute for Health Research Global Health Research Unit on Global Surgery, Lancet, 2021, 397, 387–397 CrossRef PubMed.
- V. P. Chavda, A. Khadela, Y. Shah, H. Postwala, P. Balar and L. Vora, Nanotheranostics, 2023, 7, 368–379 CrossRef PubMed.
- F. Aminolroayaei, D. Shahbazi-Gahrouei, S. Shahbazi-Gahrouei and N. Rasouli, IET Nanobiotechnol., 2021, 15, 247–256 CrossRef.
- Y. Zheng and Y. Gao, Expert Opin. Drug Delivery, 2020, 17, 1059–1062 CrossRef.
- X. Yin, Y. Cui, R. S. Kim, W. R. Stiles, S. H. Park, H. Wang, L. Ma, L. Chen, Y. Baek, S. Kashiwagi, K. Bao, A. Ulumben, T. Fukuda, H. Kang and H. S. Choi, Theranostics, 2022, 12, 4147–4162 CrossRef CAS.
- L. Zhang, Z. Yang, J. Ren, L. Ba, W. He and C.-Y. Wong, Nano Res., 2020, 13, 1389–1398 Search PubMed.
- T. Tian, J. Ruan, J. Zhang, C.-X. Zhao, D. Chen and J. Shan, J. Biomed. Nanotechnol., 2022, 18, 660–676 CrossRef.
- N. K. Bejjanki, Y. Zhong, J. Liu, Q. Li, H. Xu, H. Shen and M. Xie, Biochem. Biophys. Res. Commun., 2021, 557, 240–246 CrossRef CAS.
- X.-F. Du, Y. Li, J. Long, W. Zhang, D. Wang, C.-R. Li, M.-X. Zhao and Y. Lai, Appl. Mater. Today, 2021, 23, 101019 CrossRef.
- Y. Lai, Y. Dang, F. Li, C. Ding, H. Yu, W. Zhang and Z. Xu, Adv. Funct. Mater., 2022, 32, 2200016 CrossRef CAS.
- Y. Li, Q. Wu, D. Li, J. Huang, H. Wen, Y. Wu, D. Wang and B. Z. Tang, Adv. Funct. Mater., 2021, 31, 2106091 Search PubMed.
- X. Li, Y. Wang, H. Chen, Y. Zheng, H. Chen, X. Li and Y. Gao, Appl. Mater. Today, 2022, 29, 101660 CrossRef.
- P. Kola, P. K. B. Nagesh, P. K. Roy, K. Deepak, R. L. Reis, S. C. Kundu and M. Mandal, WIREs Nanomed. Nanobiotechnol., 2023, 15, e1876 CrossRef CAS PubMed.
- H. Iqbal, T. Yang, T. Li, M. Zhang, H. Ke, D. Ding, Y. Deng and H. Chen, J. Controlled Release, 2021, 329, 997–1022 CrossRef CAS PubMed.
- I. Hassanin and A. Elzoghby, Cancer Drug Resist., 2020, 3, 930–946 CAS.
- X. Sun, Y. Hong, Y. Gong, S. Zheng and D. Xie, Int. J. Mol. Sci., 2021, 22, 7023 CrossRef CAS PubMed.
- L. Scheetz, P. Kadiyala, X. Sun, S. Son, A. Hassani Najafabadi, M. Aikins, P. R. Lowenstein, A. Schwendeman, M. G. Castro and J. J. Moon, Clin. Cancer Res., 2020, 26, 4369–4380 CrossRef CAS.
- B. He and Q. Yang, Pharmaceuticals, 2022, 16, 18 CrossRef PubMed.
- H. Iqbal, T. Yang, T. Li, M. Zhang, H. Ke, D. Ding, Y. Deng and H. Chen, J. Controlled Release, 2021, 329, 997–1022 CrossRef CAS.
- M. A. Ashraf, B. Shen, M. A. Raza, Z. Yang, M. N. Amjad, G. ud Din, L. Yue, A. Kousar, Q. Kanwal and Y. Hu, Curr. Issues Mol. Biol., 2025, 47, 303 CrossRef CAS.
- B. Bhushan, V. Khanadeev, B. Khlebtsov, N. Khlebtsov and P. Gopinath, Adv. Colloid Interface Sci., 2017, 246, 13–39 CrossRef CAS.
- U. Garg, N. Jain, S. Kaul and U. Nagaich, Mol. Pharm., 2023, 20, 5345–5358 CrossRef CAS PubMed.
- E. Argitekin, E. Ersoz-Gulseven, G. Cakan-Akdogan and Y. Akdogan, Biomacromolecules, 2023, 24, 3603–3618 CrossRef CAS PubMed.
- S. Z. F. Phua, G. Yang, W. Q. Lim, A. Verma, H. Chen, T. Thanabalu and Y. Zhao, ACS Nano, 2019, 13, 4742–4751 Search PubMed.
- B. Bhushan, P. Dubey, S. U. Kumar, A. Sachdev, I. Matai and P. Gopinath, RSC Adv., 2015, 5, 12078–12086 RSC.
- B. Bhushan and P. Gopinath, RSC Adv., 2015, 5, 86242–86253 RSC.
- O. Othman El-Mahdy Sayed, Mutat. Res., Genet. Toxicol. Environ. Mutagen., 2000, 468, 109–115 Search PubMed.
- A. J. Coukell and D. Faulds, Drugs, 1997, 53, 453–482 CrossRef CAS PubMed.
- K. Petit, M. Suwalsky, J. R. Colina, D. Contreras, L. F. Aguilar, M. Jemiola-Rzeminska and K. Strzalka, Toxicol. in Vitro, 2020, 68, 104964 CrossRef CAS.
- C. Du, D. Deng, L. Shan, S. Wan, J. Cao, J. Tian, S. Achilefu and Y. Gu, Biomaterials, 2013, 34, 3087–3097 CrossRef CAS PubMed.
- Z. Yang, N. Zhang, T. Ma, L. Liu, L. Zhao and H. Xie, Drug Delivery, 2020, 27, 1156–1164 Search PubMed.
- A. Behera and S. Padhi, Targeted Nanotechnology: Enhancing the Efficacy of Natural Anticancer drug Therapies, CRC Press, Boca Raton, 1st edn, 2025 Search PubMed.
- P. V. Ashwani, G. Gopika, K. V. Arun Krishna, J. Jose, F. John and J. George, Chem. Biodiversity, 2023, 20, e202301009 Search PubMed.
- X. Zhao, J. Tang, Y. Zu, W. Wang, N. Li and W. Xu, NANO, 2013, 08, 1350066 CrossRef.
- Z. Yang, N. Zhang, T. Ma, L. Liu, L. Zhao and H. Xie, Drug Delivery, 2020, 27, 1156–1164 CrossRef CAS.
- S. Hua, Int. J. Nanomed., 2014, 9, 735–744 CrossRef.
- B. S. Unnikrishnan, A. Sen, G. U. Preethi, M. M. Joseph, S. Maya, R. Shiji, K. S. Anusree and T. T. Sreelekha, Int. J. Biol. Macromol., 2021, 168, 130–142 CrossRef CAS.
- A. R. James, B. Unnikrishnan, R. Priya, M. M. Joseph, T. Manojkumar, K. Raveendran Pillai, R. Shiji, G. Preethi, P. Kusumakumary and T. Sreelekha, Tumor Biol., 2017, 39, 1010428317695946 Search PubMed.
- N. T. N. Phuong, M. T. Ha, D. X. T. Nguyen, N. Y. Nguyen, H. A. T. Huynh, T. P. Hau, T. T. B. Quyen, M. Q. Nguyen, A. T. Nguyen and D. T. Pham, Front. Mater., 2024, 11, 1419697 CrossRef.
- F. Canal, M. J. Vicent, G. Pasut and O. Schiavon, J. Controlled Release, 2010, 146, 388–399 CrossRef CAS PubMed.
- C. Weber, C. Coester, J. Kreuter and K. Langer, Int. J. Pharm., 2000, 194, 91–102 CrossRef CAS PubMed.
- D. Agudelo, P. Bourassa, J. Bruneau, G. Berube, É. Asselin and H.-A. Tajmir-Riahim, PLOS ONE, 2012, 7, e43814 CrossRef CAS.
- R. Solanki, H. Rostamabadi, S. Patel and S. M. Jafari, Int. J. Biol. Macromol., 2021, 193, 528–540 CrossRef CAS PubMed.
- O. Barbosa, C. Ortiz, Á. Berenguer-Murcia, R. Torres, R. C. Rodrigues and R. Fernandez-Lafuente, RSC Adv., 2013, 4, 1583–1600 RSC.
- D. Peer, J. M. Karp, S. Hong, O. C. Farokhzad, R. Margalit and R. Langer, Nat. Nanotechnol., 2007, 2, 751–760 Search PubMed.
- S. Sripriyalakshmi, C. H. Anjali, P. D. C. George, B. Rajith and A. Ravindran, PLoS One, 2014, 9, e86317 CrossRef CAS.
- N. S. Rejinold, M. Muthunarayanan, K. P. Chennazhi, S. V. Nair and R. Jayakumar, J. Biomed. Nanotechnol., 2011, 7, 521–534 Search PubMed.
- J. Kong and S. Yu, Acta Biochim. Biophys. Sin., 2007, 39, 549–559 Search PubMed.
- P. Huang, Z. Li, H. Hu and D. Cui, J. Nanomater., 2010, 2010, 33:1–33:6 Search PubMed.
- P. Dubey, I. Matai, S. U. Kumar, A. Sachdev, B. Bhushan and P. Gopinath, Adv. Colloid Interface Sci., 2015, 221, 4–21 Search PubMed.
- S. Rello, J. C. Stockert, V. Moreno, A. Gámez, M. Pacheco, A. Juarranz, M. Cañete and A. Villanueva, Apoptosis, 2005, 10, 201–208 Search PubMed.
- M. T. Luiz, J. A. P. Dutra, L. D. Di Filippo, A. G. T. Junior, L. B. Tofani, J. M. Marchetti and M. Chorilli, Crit. Rev. Anal. Chem., 2023, 53, 1080–1093 Search PubMed.
- O. Tacar and C. R. Dass, J. Pharm. Pharmacol., 2013, 65, 1577–1589 CrossRef CAS.
- H.-J. Shin, H.-K. Kwon, J.-H. Lee, X. Gui, A. Achek, J.-H. Kim and S. Choi, Sci. Rep., 2015, 5, 15798 Search PubMed.
- P. Kawalec, M. D. Martens, J. T. Field, W. Mughal, A. M. Caymo, D. Chapman, B. Xiang, S. Ghavami, V. W. Dolinsky and J. W. Gordon, Toxicol. Appl. Pharmacol., 2022, 453, 116210 Search PubMed.
Footnote |
| † These authors contributed equally. |
| This journal is © The Royal Society of Chemistry 2026 |