DOI:
10.1039/D6MA00255B
(Paper)
Mater. Adv., 2026,
7, 4682-4709
Engineering an oxygen-vacancy-rich S-scheme CeSnO3/Bi2S3 perovskite-based heterojunction with dynamic Ce3+/Ce4+ redox recycling: efficient photoactivation of peroxymonosulfate towards lindane degradation, antimicrobial activity and sustainable H2 production
Received
23rd February 2026
, Accepted 29th March 2026
First published on 30th March 2026
Abstract
In this work, a series of highly porous and multifunctional CeSnO3/Bi2S3 perovskite-based heterojunctions (CBX) was successfully synthesized via a two-step mixing approach. Among them, the optimized 30% CeSnO3/Bi2S3 heterojunction (CB30) exhibited outstanding textural and electronic properties, featuring a high specific surface area (∼85 m2 g−1), which enabled efficient light harvesting and enhanced charge carrier separation. Consequently, CB30 degraded 70.7% of lindane (LN; 600 µg L−1) in aqueous media under solar light irradiation within 100 min. The incorporation of peroxymonosulfate (PMS) into the reaction medium synergistically enhanced the photocatalytic efficiency of the CB30 heterojunction, achieving 93.2% degradation of LN in 100 min. The outstanding performance of CB30 in conjunction with PMS is primarily attributed to the successful activation of PMS by the oxygen-vacancy-rich CeSnO3/Bi2S3 heterojunction and the continuous redox recycling of Ce3+/Ce4+ species in the heterojunction. Furthermore, radical quenching experiments revealed hydroxyl, sulphate and superoxide radical ions (˙OH, SO4˙− and O2˙−) as the dominant species responsible for the photocatalytic degradation of LN in aqueous media. In addition to LN degradation, antimicrobial activity analysis tests confirmed the excellent performance of CB30, with an average zone of inhibition (ZOI) of 21.5 mm and 20 mm against Escherichia coli (E. coli) and Candida albicans (C. albicans), respectively. Furthermore, CB30 exhibited outstanding hydrogen evolution performance of 12.2, 22.2 and 37.7 mmol g−1 of H2 with external quantum efficiency (EQE) values of 34.4%, 41.9% and 50.5% upon simulated solar irradiation for 6, 9 and 12 h of reaction time, respectively. The superior photocatalytic and photo-electrochemical activities are primarily governed by the synergistic integration of step-scheme (S-scheme) charge transfer, oxygen vacancies (34.91%) and Ce3+/Ce4+ redox cycling, establishing CB30 as a robust and multifunctional platform for persistent pollutant degradation, antimicrobial disinfection and sustainable hydrogen production.
1. Introduction
Pesticides are widely used in modern agriculture to improve crop yields and also to control pests. Although they serve an important role in food security, their indiscriminate use and over-application have led to serious environmental and health problems. Among these, lindane (γ-hexachlorocyclohexane, γ-HCH) is one of the most highly toxic organochlorine pesticides and has been widely used for decades in agriculture and for controlling ectoparasites. Lindane (LN) is persistent, bio-accumulative, and resistant to natural degradation; hence, it has been classified as a persistent organic pollutant (POP).1 Because of its high hydrophobicity and stability, lindane can easily accumulate in water bodies, and its exposure can present a serious risk because of neurotoxicity, endocrine disruption, and carcinogenicity.1 Its occurrence in water is of particular concern, and the Environmental Protection Agency (EPA) has established a maximum contaminant level (MCL) for lindane at 0.2 µg L−1 to protect public health. Although regulatory restrictions and bans have been enacted in many countries, due to its historic use and environmental persistence, lindane continues to be found in surface and groundwater around the world, with concentrations often above guideline values. Continuous monitoring studies have reported detectable levels of lindane in surface waters, and in some areas, these exceed the safety limits set by regulatory agencies, tending to highlight the ongoing threat to aquatic ecosystems and human health.2
It was indicated in previous studies that adsorption, chlorination, ozonation, membrane technologies, and biological treatments could not effectively remove refractory contaminants, such as lindane, due to limitations these treatment methodologies faced, such as expensive procedures, slow processing and formation of secondary waste.3,4 Thus, opportunities are left for more effective and advanced cost-effective wastewater treatment methodologies for the removal of such refractory contaminants. Recently, peroxymonosulfate (PMS, HSO5−)-assisted advanced oxidation processes (AOPs) have attracted remarkable interest as an efficient and eco-friendly way to destroy persistent organic contaminants in water.5 Compared with hydroxyl radicals (˙OH), sulfate radical ions (SO4˙−) possess a higher redox potential and longer lifetime, which could lead to a highly effective oxidation over a wide pH range.5 Such a dual-radical mechanism ensures the complete degradation of hazardous materials, including pesticides such as LN, in aqueous medium and provides a potential pathway toward effective, sustainable wastewater purification techniques.
Khan et al. applied the visible- and solar-light-assisted S-TiO2/PMS system for the efficient removal of lindane in aqueous media. Their results showed 31% and 63.4% removal of lindane (10 µM) under visible- and solar-light-assisted S-TiO2 photocatalysis, respectively, at a reaction time of 6 h. The photocatalytic performance of S-TiO2 was increased remarkably by the incorporation of PMS (0.2 mM) in aqueous media, achieving 68.2% and 99.9% removal of lindane at a reaction time of 6 h under visible and solar light, respectively.6 Similarly, another investigation by Khan et al. revealed 78.4% removal of lindane (3.43 µM) by a Fe2+/PMS system under fluorescence light in 12 h.7 Furthermore, application of a UV/PMS process attained 92% removal of lindane in 180 min with a kapp value of 1.42 × 10⁻² min−1.8 The present study, however, effectively degrades lindane at extreme trace levels (2.06 µM).
Energy production (H2) from water splitting is also an interesting area on which research is currently focused. For such dual-purpose applications (contaminants degradation and H2 production), researchers have developed different types of photocatalysts and their composites/heterojunctions. Wu et al. used MoS2@TiO2 for the simultaneous removal of contaminants (Enrofloxacin (ENR), Ofloxacin (OFX) and Ciprofloxacin (CIP)) and H2 production. The results showed 95.6%, 95.3% and 72.1% degradation of these contaminants with corresponding rates of H2 evolution of 41.59, 36.82 and 30.26 µmol g−1 h−1 for ENR, OFX and CIP, respectively, in aqueous media under visible-light irradiation for 3 h.9 Similarly, the one-pot hydrothermal synthesis of a TiO2/RCN heterojunction was reported, and the material showed 98.6% degradation of Rhodamine B under visible-light irradiation for 3.5 h. Moreover, the TiO2/RCN heterojunction yielded 361.8 µmol g−1 h−1 of H2 after 5 h of visible-light illumination.9,10
Recently, perovskite-based photocatalysts have attracted considerable attention in the field of wastewater treatment and energy production (H2) through water splitting due to their exciting properties of tunable band structures, high absorption coefficients, oxygen vacancies, and adjustable surface chemistry.11 However, it has been documented that conventional perovskite materials, such as calcium titanate (CaTiO3), barium titanate (BaTiO3), and strontium titanate (SrTiO3), face challenges in the field of wastewater treatment due to their poor stability, limited visible-light absorption, high band gap energies, and rapid electron–hole pair coupling.12 On the other hand, cerium tin oxide (CeSnO3) has emerged as an encouraging material due to its exceptional electronic structure, structural stability, efficient charge transport and extended light absorption. In CeSnO3, cerium exists as a reversible Ce3+/Ce4+ redox pair that enables dynamic redox recycling, and the material possesses excellent oxygen-storage capability. Similarly, the oxygen vacancies in CeSnO3 act as electron reservoirs for the photogenerated electrons and as catalytically active sites.13,14 The occurrence of these features promotes charge separation, enhances PMS activation, and enables efficient reactive oxygen species (ROS) formation during the photocatalytic process.
Recently, sulfide-based materials, especially bismuth sulfide (Bi2S3), have attracted attention as photocatalysts in the field of wastewater treatment. Bi2S3 is a semiconductor with a low band gap energy (∼1.3–1.7 eV), strong absorption in the visible region, and excellent charge-transport properties. These qualities make it a promising catalyst for use in the construction of suitable heterojunctions for wastewater treatment.15 Furthermore, coupling of Bi2S3 with other photocatalysts, especially CeSnO3, can significantly improve the interfacial charge separation and migration and effectively inhibit electron–hole pair recombination, thereby enhancing the photocatalytic efficiency in environmental remediation and energy conversion applications.16
Keeping in mind these outstanding features, the current study introduces a highly porous oxygen-vacancy-rich CeSnO3/Bi2S3 perovskite-based heterojunction with a high surface area and efficient Ce3+/Ce4+ redox recycling. The synthesized heterojunction material synergistically activates PMS, leading to the successful generation of ROS (˙OH, SO4˙− and O2˙−) and causing efficient degradation of LN in aqueous media under light illumination. Furthermore, the performance of the synthesized material was compared with previously reported photocatalysts, and a detailed summary is provided in Table S2. Compared to previously reported photocatalysts, the as-synthesized CeSnO3/Bi2S3 heterojunction achieved 93.21% degradation under simulated solar illumination for 100 min, showing the enhanced efficiency of the CeSnO3/Bi2S3 heterojunction compared to previously reported photocatalysts. In addition to this, the CeSnO3/Bi2S3 heterojunction exhibits excellent antimicrobial activity against Escherichia coli (E. coli) and Candida albicans (C. albicans) and enables significant solar-driven H2 production. All these qualities (contaminant degradation, antimicrobial activity and H2 production) make CeSnO3/Bi2S3 a promising material for use in simultaneous wastewater purification and energy production applications.
2. Experimental
2.1. Chemicals
The following were supplied by Sigma-Aldrich: cerium(IV) sulfate tetrahydrate (Ce(SO4)2·4H2O, 98%), polyvinylpyrrolidone ((C6H9NO)n), lindane pestanal (C6H6Cl6, 97%), oxone (KHSO5; 0.5 KHSO4; 0.5 K2SO4), benzoquinone (C6H4O2, 98%) and ethanol (C2H5OH, 99.8%). Scharlau (Spain) provided SnCl2·2H2O (98%), sodium hydroxide (NaOH, 97%), tert-butanol (C4H10O, 99%) and sodium bicarbonate (NaHCO3, 99%). Bi2(NO3)2·5H2O (98%), Na2S (60–63%) and Na2CO3 (99.8%) were supplied by Acros Organics. Perchloric acid (HClO4, 60%), terephthalic acid (C8H6O4, 97%) and NaNO3 were supplied by Daejung Korea. Silver nitrate (AgNO3, 99.8%), sodium chloride (NaCl, 99.5%) and potassium iodide (KI, 99.8%) were provided by Merck. Ammonium hydroxide (NH4OH, 25%) originated from BDH England. All chemicals were used without further purification, and all solutions were prepared with ultrapure water (resistivity 18.2 MΩ cm).
2.2. Material synthesis
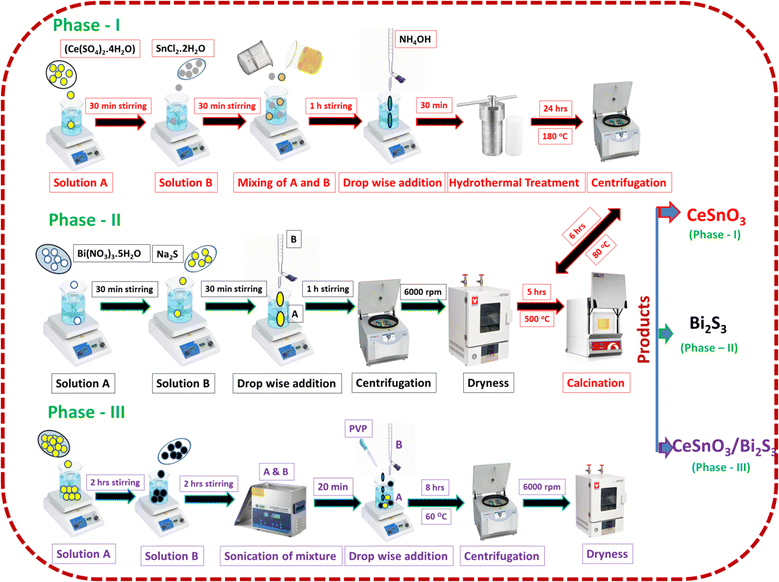
2.2.1. Synthesis of CeSnO3.
CeSnO3 was synthesized by using a simple hydrothermal approach. Equimolar 0.2 M solutions of cerium (Ce) and tin (Sn) were prepared in 40 mL of distilled water, named solutions A and B, respectively. For the 0.2 M Ce solution, 3.2 g Ce(SO4)2·4H2O was dispersed in 40 mL of water with continuous stirring for 30 min (solution A). For the 0.2 M Sn solution, 1.81 g SnCl2·2H2O was dissolved in 40 mL of distilled water with continuous stirring for 30 min (solution B). Solution A was slowly dropped into solution B under stirring for 1 h. The pH was adjusted to 8 with NH4OH. The mixture was placed in a Teflon-lined autoclave and submitted to hydrothermal treatment at 180 °C for 24 h. The contents in the autoclave were washed repeatedly with distilled water and ethanol and dried at 80 °C for 6 h. The dried material was further calcinated at 500 °C for 5 h to obtain the final CeSnO3 product.
2.2.2. Synthesis of Bi2S3.
Bismuth sulfide (Bi2S3) was prepared using a two-step mixing procedure with the precursors of Bi(NO3)3·5H2O and Na2S. First, 4.85 g Bi(NO3)3·5H2O was dispersed in 50 mL of distilled water with stirring for 25 min to obtain Solution A. Then, Solution B was prepared by dissolving 1.17 g Na2S in 50 mL of distilled water. Solution B was added dropwise to solution A under continuous stirring for 1 hour. The resulting black precipitate was washed with distilled water and ethanol and then vacuum-dried at 80 °C to obtain the final product.
2.2.3. Synthesis of CeSnO3/Bi2S3 perovskite-based heterojunction.
CeSnO3/Bi2S3 perovskite-based heterojunctions with weight percentages of 5%, 10%, 20%, 30 and 40% were synthesized using a two-step mixing method; the samples were labeled as CB5, CB10, CB20, CB30, and CB40, respectively. To synthesize CB5, 950 mg CeSnO3 was dissolved in 100 mL of ethanol–water (1![[thin space (1/6-em)]](https://www.rsc.org/images/entities/char_2009.gif) :1) to form solution A. Solution B was prepared by dissolving 50 mg Bi2S3 in 100 mL of ethanol–water (1:1). PVP was then added to solution A at a concentration of 100 mg per 10 mL with continuous stirring. Solution B was then slowly added to solution A. The mixed solution was then magnetically stirred at 60 °C for 8 h. The resulting precipitate was washed several times with distilled water and then vacuum-dried at 60 °C. The resultant sample was denoted as CB5. The same method was applied for the synthesis of CB10, CB20, CB30 and CB40, adjusting the initial concentrations of CeSnO3 and Bi2S3 according to stoichiometry. Scheme 1 shows a schematic view of the synthetic procedures.
:1) to form solution A. Solution B was prepared by dissolving 50 mg Bi2S3 in 100 mL of ethanol–water (1:1). PVP was then added to solution A at a concentration of 100 mg per 10 mL with continuous stirring. Solution B was then slowly added to solution A. The mixed solution was then magnetically stirred at 60 °C for 8 h. The resulting precipitate was washed several times with distilled water and then vacuum-dried at 60 °C. The resultant sample was denoted as CB5. The same method was applied for the synthesis of CB10, CB20, CB30 and CB40, adjusting the initial concentrations of CeSnO3 and Bi2S3 according to stoichiometry. Scheme 1 shows a schematic view of the synthetic procedures.
 |
| | Scheme 1 Systematic synthesis of the CeSnO3/Bi2S3 perovskite-based heterojunction. | |
2.3. Characterization of synthesized materials
The surface morphology and particle size were investigated through scanning electron microscopy (SEM; JSM-5910). More detailed information on the material at the nanoscale was obtained using transmission electron microscopy (TEM) and high-resolution transmission electron microscopy (HRTEM) (FEI Corp., USA). Energy-dispersive X-ray (EDX) (EX-2300BU, JEOL) was carried out to study the elemental composition and the purity of the synthesized materials. In association with EDX, elemental mapping was also performed in order to determine the distribution of elements in the synthesized samples. X-ray diffraction (XRD) measurements were performed using a Rigaku D/max-RB diffractometer with Cu-Kα radiation (λ = 1.54 Å) to investigate the crystallinity and phase composition. The instrument was operated at 45 kV and 100 mA, with a scan rate of 0.03° s−1 over the 2θ range. Fourier-transform infrared (FTIR) analysis provided information on the formation of the synthesized materials and the presence of various functional groups associated with the material surface; spectra were obtained with an FTIR-8400 spectrophotometer (Shimadzu). X-ray photoelectron spectroscopic (XPS) analysis of the synthesized materials was carried out to study the surface chemical composition and the binding energies using a Thermo Scientific Kα spectrophotometer (PHI-5300 ESCA spectrometer). Surface area and porosity analyses of the synthesized catalysts were performed using a Quantachrome (Quantachrome® ASiQwin™- Automated Gas Sorption Data, Acquisition and Reduction, 1994–2016, Quantachrome Instruments version 5.0) system by recording the nitrogen adsorption–desorption isotherms. Before measurements, the samples were well degassed at 150 °C for 8 h under vacuum to eliminate adsorbed species. The specific surface area was measured using the Brunauer–Emmett–Teller (BET) method, while the pore size distributions were determined by employing the Barrett–Joyner–Halenda (BJH) model. The optical band gap energy of the synthesized materials was determined using ultraviolet diffuse reflectance spectroscopy (UV-DRS), performed with a PerkinElmer Lambda 1050 UV/Vis/NIR spectrophotometer. Barium sulfate (BaSO4) was used as the non-absorbing reflectance standard. The phenomena of radical production and electron–hole pair (e−, h+) recombination were investigated through photoluminescence analysis (PL) using a fluorescence spectrometer (PerkinElmer LS 45). Electrochemical analyses, including electrochemical impedance spectroscopy (EIS), Mott–Schottky analysis (MS) and photocurrent measurement of the synthesized materials, were conducted to evaluate the charge transfer resistance, charge transport characteristics, band position and photo-response of the synthesized samples; the measurements were performed using a Corrtest Potentiostat (CS310M, Corrtest, China). The three-electrode system was used for analysis, wherein the synthesized material was deposited on the working electrode, with silver–silver chloride (Ag/AgCl) as the reference electrode and platinum as the counter electrode. A common salt addition method was employed for determining the surface charge of the synthesized material, using NaNO3 (0.1 M) as the electrolytic solution.17
2.4. Photoluminescence analysis
The formation of hydroxyl radicals (˙OH) during the photocatalytic process was confirmed by photoluminescence analysis (PL). For PL analysis, a reaction system was made by mixing 50 mL of terephthalic acid (TA, 3.5 × 10⁻⁴ M) with 50 mL of sodium hydroxide solution (2 × 10⁻³ M). About 15 mg of the synthesized CeSnO3 was added to the reaction with continuous stirring. The reaction mixture was exposed to a simulated solar lamp (Xe; 55 W) for 100 min. Under light illumination, the CeSnO3 produced ˙OH, which, upon reaction with TA, caused the formation of the fluorescent product, 2-hydroxyterephthalic acid (TAOH), as given in eqn (1) and (2).17 The fluorescence emission intensity of TAOH, typically monitored around 425 nm, is directly related to the amount of ˙OH formed in the system. Thus, an increase in fluorescence intensity confirmed the successful generation of ˙OH during photocatalysis. The same experimental protocol was applied to Bi2S3 and the CeSnO3/Bi2S3 heterojunction (CB30), wherein CeSnO3 was substituted with Bi2S3 and CB30, respectively (eqn (3)–(6)).
2.5. Point of zero charge (PZC) analysis
In the area of photocatalysis, surface charge plays a crucial role that greatly influences the interaction capabilities and the adsorption of contaminants over the material surface. The point of zero charge (PZC) value provides valuable information regarding the surface charge, which plays a significant role in various applications, including adsorption, photocatalysis and wastewater treatment. For the same purpose, the PZC of the as-synthesized CB30 was determined using the salt addition technique.17
Typically, an approximately 0.1 M solution of sodium nitrate (NaNO3) was prepared and taken in 10 separate reagent bottles. The pH of the solutions was altered from 3 to 12 using the dilute solution of HNO3 (0.1 M) and/or NaOH (0.1 M). After pH adjustment, an equal amount of the CB30 (20 mg) was supplemented to each reagent bottle. The reagent bottles were transferred to a shaker and shaking was continued for 24 h at 150 rpm. After 24 h of continuous shaking, the samples were filtered and the pH was re-measured. Using eqn (7), the change in pH (ΔpH) was determined. Finally, the PZC of the material was obtained by plotting ΔpH against initial pH (pHi). The PZC of CB30 was found to be 4, as evident from the intersection point (Fig. S1).
2.6. Photocatalytic degradation of LN under simulated solar irradiation in aqueous media
The photocatalytic efficiency of the as-synthesized CeSnO3, Bi2S3 and the CeSnO3/Bi2S3 perovskite-based heterojunction was systematically evaluated towards the photodegradation of LN in aqueous media. The photocatalytic investigations were performed in a batch reactor under simulated solar irradiation using a 55 W xenon lamp, placed 15 cm above a Petri dish containing LN solution (600 µg L−1). Prior to illumination, the reaction mixture was stirred in the dark for 30 min to establish the adsorption–desorption equilibrium. The lamp was then turned on to initiate the photocatalytic degradation process. At regular intervals, a sample (1 mL) of the LN solution was collected, filtered through a nylon syringe filter (0.45 µm), and analyzed quantitatively using gas chromatography with a micro-cell electron capture detector (GC-µECD). The details of this method are provided in Text S1. The influence of peroxymonosulfate (HSO5−) (a source of ˙OH and SO4˙−) on the photocatalytic activity was also explored. Additionally, the effects of various operational parameters, including catalyst amount (5–20 mg), contaminant concentration (200–1000 µg L−1), HSO5− concentration (0.1–2 mM) and solution pH (acidic, neutral and basic), were thoroughly examined.
The degradation products (DPs) were qualitatively examined using gas chromatography–mass spectrometry (GC-MS; QP-2010 Plus, Shimadzu, Japan). For mechanistic analysis, the ROS involved in the degradation process were detected via scavenger studies using benzoquinone (BQ), silver nitrate (AgNO3), tertiary butyl alcohol (TBA) and ethanol (EtOH), with each added at a concentration of 5 mM. Reusability tests were performed to evaluate the long-term stability and durability of the synthesized photocatalytic materials. At the end of each degradation cycle, the photocatalyst was recovered by centrifugation, washed carefully with distilled water and ethanol and finally vacuum-dried at 80 °C.
2.7. Photocatalytic degradation of LN in different water systems
To assess the practical applicability of the synthesized photocatalysts, degradation experiments were further extended to different water matrices, including distilled water (DW), tap water (TW), synthetic wastewater (SW) and industrial water (IW) samples. The industrial water sample was collected from Stanley Pharmaceutical Company, Hayatabad, Peshawar. The sample was filtered before use and utilized as such without further processing. The detailed chemical composition of these samples is provided in Table S1.
2.8. Assessment of acute and chronic toxicity
The potential toxicity of the by-products was evaluated using the Ecological Structure Activity Relationships (ECOSAR) predictive software. The details are provided in Text S2.
2.9. Assessment of antimicrobial properties
The antimicrobial activities of the synthesized materials were investigated using the Agar well diffusion method. The details are provided in Text S3.
2.10. Solar-light-induced hydrogen evolution over CB30 photocatalyst
Photocatalytic hydrogen (H2) evolution tests were conducted in a custom-fabricated 500 mL Pyrex photoreactor sealed with a rubber septum. About 40 mg of CB30 was dispersed in 120 mL of an aqueous methanol solution (20% methanol and 80% distilled water), wherein methanol acted as a sacrificial agent for effective hole (h+) scavenging. Prior to irradiation, the reaction system was purged with high-purity N2 gas for 30 min to ensure complete removal of dissolved oxygen. A xenon lamp (55 W), positioned 15 cm above the reactor and served as the irradiation source. The reaction suspension was continuously stirred during the experiment, while an integrated exhaust fan dissipated excess heat to maintain the system temperature close to 25 °C. At specified time intervals (6, 9 and 12 h), a gas sample was collected from the reactor headspace using a gas-tight syringe and stored in a gas-sampling bag (HBD-0.5L, 16 × 18 cm). Quantitative analysis of the hydrogen gas was performed using a gas chromatograph (GC-2010 Pro, Shimadzu, Kyoto, Japan) equipped with a thermal conductivity detector (TCD) and an RT-MSSA column (30 m, 0.32 mm ID, 30 µm film thickness), with high-purity N2 employed as the carrier gas. The external quantum efficiency (EQE) was also evaluated under identical photocatalytic conditions using monochromatic Xe lamp irradiation centered at 490 nm (±20 nm). The EQE was calculated using the following equation (eqn (8)).18| |  | (8) |
3. Results and discussions
3.1. Characterization of the as-synthesized materials
The morphological and microstructural studies of the synthesized materials were performed using SEM analysis. Fig. 1 shows the SEM analysis of as-synthesized CeSnO3 and different percent CeSnO3/Bi2S3 perovskite-based heterojunctions (CB5–CB40). The SEM analysis of CeSnO3 revealed the different, irregularly sized crystals. The particles are widely distributed, and some agglomeration can also be seen (Fig. 1(A)). The average particle size was observed to be 3.8 µm (Fig. 1(A), inset). The SEM images of CeSnO3/Bi2S3 perovskite-based heterojunctions (CB5–CB40) exhibited the presence of both CeSnO3 (yellow encircled) and Bi2S3 (red encircled) nanoparticles (Fig. 1(B–F)). In CB5 (Fig. 1(B)), the coexistence of both CeSnO3 and Bi2S3 phases is evident, with CeSnO3 appearing more dominant due to its higher concentration. The CeSnO3 crystallites exhibit irregular, porous aggregates intimately anchored onto the Bi2S3 surfaces, indicating the initiation of interfacial contact between the two components, with an average particle size of 4.6 µm. Furthermore, the interaction between the phases becomes more prominent upon increasing the content of Bi2S3 beyond 5%. Fig. 1(C) shows the spongy-type morphology for CB10, and compact Bi2S3 crystals can also be observed. In the case of CB20, the interfacial adhesion improved, resulting in an increase in the particle size from 5.1 µm (for CB10) to 5.6 µm (Fig. 1(D)). The increase in particle size suggests enhanced heterojunction formation in the case of CB20. Similarly, the SEM image of CB30 (Fig. 1(E)) clearly shows that the spongy-type particles of CeSnO3 (yellow encircled) are attached to the grayish sheets of Bi2S3 (red encircled). It can be observed that the particles of CeSnO3 have successfully formed a heterojunction with the sheets of Bi2S3 with minimum agglomeration. The average particle size calculated for CB30 was 6.1 µm. In contrast, excessive Bi2S3 incorporation in CB40 (Fig. 1(F)) resulted in compact stacking, pronounced agglomeration, and reduced porosity, with an average particle size of 6.4 µm, which may limit the accessibility of the active sites and inhibit the charge mobility. These observations confirm that the controlled integration of Bi2S3 up to 30 wt% yields an ideal, highly porous microstructural arrangement, promoting effective heterojunction formation and superior photocatalytic activity in the CB30 sample.
 |
| | Fig. 1 SEM images of (A) CeSnO3, (B) CB5, (C) CB10, (D) CB20, (E) CB30, and (F) CB40. Insets show the particle size distributions of the corresponding samples. | |
The elemental composition and distribution of the synthesized materials were studied using energy-dispersive X-ray spectroscopy (EDX) and elemental mapping techniques. Fig. 2(A) and (B) show the EDX spectra of CeSnO3 and CB30, respectively. The characteristic peaks of Ce, Sn and O can be observed in CeSnO3. In the case of CB30, additional peaks for Bi and S can also be observed, which arise from Bi2S3 in the CB30 heterojunction. The observed C peak in both CeSnO3 and CB30 likely arises from instrumental contamination, carbon tape used during sample preparation, or it might be attributed to some other carbon-containing impurities in the samples. The atomic and mass percentages of the elements are aligned with the stoichiometric calculations (Fig. 2(A) and (B), inset). Furthermore, the mapping results provided with both CeSnO3 and CB30 showed the uniform distribution of particles in both CeSnO3 (Fig. 2(A) (A–C)) and CB30 (Fig. 2(B) (A–E)), indicating the successful synthesis and uniform elemental distribution. The observed uniformity in particle distribution, as revealed by the elemental mapping, indicates a well-dispersed microstructure in both CeSnO3 and CB30 perovskite-based heterojunctions.
 |
| | Fig. 2 EDX and elemental mapping of CeSnO3 (A) and CB30 (B). Insets show the atomic and mass percentages of each element in the corresponding samples. | |
Fig. 3(A) shows the TEM analysis of as-synthesized CB30, which reveals different morphologies for CeSnO3 (red encircled) and Bi2S3 (green encircled). The CeSnO3 counterpart of CB30 exhibits a porous, honeycomb-like structure. Similarly, the TEM results showed the rod-like morphology for the synthesized Bi2S3 material. The TEM results show that the CeSnO3 particles are attached to the surface of the Bi2S3. The existence of both CeSnO3 and Bi2S3 confirms the successful synthesis of the porous perovskite-based heterojunction (CB30). Elemental analysis of CB30 (Fig. 3(B)), confirms the existence of bismuth (Bi), cerium (Ce), tin (Sn), sulfur (S) and oxygen (O), which corresponds to the composition of CB30. Moreover, the uniform distribution of these elements in their corresponding mapping results suggests good compositional homogeneity. The porous nature of CeSnO3 may enhance the surface reactivity, while the rod-shaped crystals of Bi2S3 could facilitate the charge transport. Furthermore, the close contact between the CeSnO3 and Bi2S3 in CB30, as evidenced by TEM, may enable the charge dynamics in CB30. Thus, the synthesized perovskite-based heterojunction (CB30) may lead to improved performance in various applications, especially in the field of wastewater treatment.
 |
| | Fig. 3 TEM analysis of the as-synthesized CB30 (A) and elemental mapping of the corresponding material (B). | |
The high-resolution transmission electron microscopy (HRTEM) and selected area electron diffraction (SAED) assessments of CB30 are depicted in Fig. 4. The HRTEM analysis of CB30 (Fig. 4(a)), reveals a complex nanostructure with multiple crystalline phases. Various lattice fringes corresponding to CeSnO3, Bi2S3, CeO2 and SnO2 can be clearly seen. The high-resolution views of the specific regions in the HRTEM image are shown in Fig. 4(b, d, f and h), highlighting the lattice fringes of different crystalline phases for CeSnO3, Bi2S3, CeO2 and SnO2, respectively. The corresponding inverse FFT images in Fig. 4(c, e, g and i) further confirmed the presence of these phases and provided insight into their crystal structures. The d-spacing calculated from the HRTEM image was found to be 0.38 nm, corresponding to the 130 plane of Bi2S3, 0.335 nm, consistent with the 110 plane of SnO2, 0.31 nm, matching the 111 plane of CeO2, and 0.365 nm for CeSnO3.19–21Fig. 4(j) shows the SAED pattern of CB30. The image shows a ring pattern with multiple diffraction rings, indicating a polycrystalline material. The observed rings are indexed to specific crystal planes. The 130 ring (green encircled) corresponds to Bi2S3. The second ring (red encircled) is assigned to CeSnO3. The 110 ring (brown encircled) is assigned to SnO2. Similarly, the 111 ring (yellow encircled) corresponds to CeO2. The red-circled second ring may correspond to the perovskite CeSnO3. The observed CeO2 and SnO phases in HRTEM and SAED also agree with the XRD results. The formation of a heterojunction between CeSnO3 and Bi2S3 may result in enhanced interfacial charge transfer and separation. This may result in improved effectiveness of the material in different applications, especially in the field of wastewater treatment and energy production.
 |
| | Fig. 4 HRTEM image (a), high-resolution images of the specific regions (b, d, f and h), inverse FFT of the selected regions (c, e, g and i) and the SAED pattern (j) of the as-synthesized CB30. | |
The XRD analyses of as-synthesized CeSnO3, Bi2S3 and CeSnO3/Bi2S3 perovskite-based heterojunctions (CB5–CB40) are depicted in Fig. 5. In the case of Bi2S3, characteristic peaks are observed at 2θ values of 11.3, 17.9, 22.3, 24.9, 28.7, 31.9, 33.4, 45.6, 46.6 and 51.2° corresponding to the (110), (120), (220), (130), (211), (221), (311), (501), (501) and (222) planes, respectively.22 The peak positions and their corresponding hkl values match well with the standard JCPDS Card No. 17-0320,22 confirming the orthorhombic crystal structure of Bi2S3. The presence of sharp peaks indicates the good crystallinity of the synthesized material. For CeSnO3, the XRD patterns show characteristic peaks at 33.1, 47.5, 56.4, 69.4 and 79°, confirming the successful formation of CeSnO3. Furthermore, the XRD spectrum also shows the presence of secondary phases, such as CeO2 (peaks at 28.5 and 76.7° matching the JCPDS: 34-0394), SnO2 (peaks at 26.6, 38 and 51.9° matching the JCPDS: 41-1445) and SnO (peaks at 29.7 and 31.9° matching the JCPDS: 06-0395).23 The presence of these oxides suggests that some Ce and Sn ions are not incorporated into the perovskite CeSnO3 structure, resulting in the creation of these secondary oxide phases.23 Compared to bare CeSnO3 and Bi2S3, the XRD patterns of all the heterojunctions (CB5–CB40) possess the representative peaks of both CeSnO3 and Bi2S3, confirming the successful formation of the heterojunctions.5 Certain peaks from the individual phases, such as peaks at 28.5° of CeO2, 29.7 and 31.9° of SnO, and the corresponding peaks of Bi2S3 at 11.3, 17.9, 22.3, and 24.9°, are not visible in the heterojunction materials, which might be due to the overlapping of peaks, change in crystal structure, or reduced crystallinity.24 Moreover, the results clearly show that the characteristic peaks of Bi2S3 become more prominent with increasing the Bi2S3 concentration in the heterojunction materials. Furthermore, Fig. 5 shows that the intensity of the representative peaks of the secondary phases (CeO2, SnO and SnO2) gradually decreases with increasing Bi2S3 concentration in the heterojunction. In the bare CeSnO3 sample, weak reflections corresponding to these minor oxide species are observed along with the main CeSnO3 phase. However, after forming the CeSnO3/Bi2S3 heterojunction, the oxide peaks diminish significantly, and only a very weak SnO2 peak is detected in the optimized CB30 sample. This behavior can be attributed to strong interfacial coupling, surface coverage effects, suppression of secondary crystallization and improved phase stability within the heterostructure, indicating that the heterojunction is primarily composed of CeSnO3 and Bi2S3 phases.25 The aforementioned XRD results are consistent with the HRTEM and SAED results. The successful formation of the heterojunction is anticipated to improve the material's light-harvesting properties due to the synergistic effects between the CeSnO3 and Bi2S3 in the heterojunction system.
 |
| | Fig. 5 XRD analysis of the as-synthesized Bi2S3, CeSnO3, CB5, CB10, CB20, CB30 and CB40. | |
Fourier-transform infrared spectroscopy (FTIR) was performed to study the chemical composition and the presence of various types of functional groups associated with the synthesized materials. Fig. 6 shows the FTIR spectra of as-synthesized CeSnO3, Bi2S3 and CB30. The broad absorption peaks observed in the region around 3619–3149 cm−1 are credited to the stretching vibration of O–H at the material's surface.26 Similarly, the small absorption peaks in the range of 1700–1570 cm−1 are due to the bending vibrations of H–O–H, confirming the adsorbed water molecules.27 In the case of CeSnO3, the small absorption peak around 1280 cm−1 is ascribed to the presence of CO32−, likely formed by the reaction of atmospheric CO2 and NH4OH during the synthesis.28 Similarly, the broad absorption in the range of 1206–930 cm−1 is due to the presence of SO42− stretching vibrations, suggesting residual sulfate ions from the precursor Ce(SO4)2·4H2O.29 The absorption band at 665 and 646 cm−1 is assigned to metal–oxygen lattice vibrations (O–Sn–O/M–O–M type modes), consistent with formation of the Ce–Sn perovskite framework.30 Furthermore, the peak at 597 cm−1 is ascribed to the stretching vibrations of Ce–O and Sn–O. The presence of these confirms the formation of SnO2 and CeO2.31 The FTIR spectrum of Bi2S3 showed a broad absorption peak at 1470–1230 cm−1 corresponding to the presence of NO3− ions from the precursor Bi(NO3)2·5H2O.32 The absorption peaks at 1130–990 cm−1 might correspond to S–O stretching modes over the material surface.33 Similarly, the absorption peak at 813 cm−1 is likely associated with the Bi–O vibration, which confirms the small amount of Bi oxidation in the material.34 Moreover, the absorption peaks at 726 and 554 cm−1 are due to the Bi–S stretching vibration, proving the successful synthesis of Bi2S3.35
 |
| | Fig. 6 FTIR spectra of the as-synthesized CeSnO3, Bi2S3 CB5, CB10, CB20, CB30 and CB40. | |
The FTIR spectra of the heterojunctions (CB5–CB40) show weak residual bands that correspond to minor surface impurities originally present in the bare CeSnO3 and Bi2S3, but the intensities of these impurity bands are markedly reduced after heterojunction formation. This attenuation might be due to the following: (i) surface washing and removal of loosely bound adsorbates during post-synthetic purification, (ii) physical coverage/dilution of impurity sites by the deposited secondary phase, and (iii) strong interfacial chemical coupling and lattice reorganization at the CeSnO3/Bi2S3 interface that modifies the local vibrational environment and suppresses defect/impurity modes.36 Similarly, the results show that, upon formation of the CeSnO3/Bi2S3 heterojunction, instead of retaining the individual peaks of CeSnO3 and Bi2S3, a single broad and intense peak appeared between 780 and 400 cm−1. This behavior suggests strong interfacial interactions and chemical bonding between CeSnO3 and Bi2S3 during the heterojunction formation. The merging and shift of the peaks imply the generation of new metal–oxygen–sulfur (M–O–S) linkages and lattice distortion due to the close coupling of the two phases. Such changes are commonly reported in heterojunction systems, where the formation of a chemical interface alters the local vibrational environment.22
The N2 adsorption–desorption isotherms and BJH pore-size distributions of CeSnO3 and the corresponding perovskite-based heterojunctions (CB5–CB40), exhibit a type IV isotherm with a H3-type hysteresis loop, according to the IUPAC classification,37 indicating the presence of mesoporous structures with slit-shaped pores. Such pore characteristics are typically associated with the aggregation of plate-like particles or layered nanostructures in the CeSnO3/Bi2S3 heterojunction (Fig. 7(A–F)). Table 1 provides details regarding the specific surface area, pore diameter, and pore volume of the synthesized materials. Pristine CeSnO3 (Fig. 7(A)) shows a relatively low BET surface area of 16.4 m2 g−1, a pore diameter of 6.27 nm, and a pore volume of 0.105 cm3 g−1, reflecting its compact and less porous microstructure. With the introduction of Bi2S3, a remarkable improvement in textural characteristics was observed. Fig. 7(B) shows the significant enhancement in surface area of CB5 (60.9 m2 g−1) with the observed pore diameter and pore volume of 4.18 nm and 0.337 cm3 g−1, respectively. The significant increase in surface area indicates the formation of a more favorable mesoporous structure. In the case of CB10 and CB20 (Fig. 7(C) and (D)), the mesoporous nature further improved, with continuous enhancement in surface area to 72.3 and 81.0 m2 g−1 for CB10 and CB20, respectively. For CB10 and CB20, the pore diameter and pore volume were found to be 3.95 nm and 0.323 cm3 g−1 and 3.92 nm and 0.311 cm3 g−1, respectively. The observed increase in surface area upon increasing the concentration of Bi2S3 suggests the formation of additional adsorption sites/channels in heterojunction materials, as observed in the SEM images. The BET analysis of CB30 (Fig. 7(E)) showed a further improvement in the surface area (85.0 m2 g−1) accompanied by an average pore diameter and pore volume of 3.41 nm and 0.284 cm3 g−1, respectively. Among all the synthesized materials, the highest surface area (85.0 m2 g−1) was achieved at this composition, which reflects the optimized and most suitable composition for heterojunction formation. However, further increasing the Bi2S3 content beyond 30% led to a significant reduction in the BET surface area. Fig. 7(F) shows a BET surface area of 17.9 m2 g−1 for CB40, with a corresponding pore diameter and pore volume of 6.78 nm and 0.258 cm3 g−1, respectively. This drastic reduction in surface area is attributed to the particles’ agglomeration and non-uniform distribution of the individual components of the heterojunction. These results are in good agreement with the SEM images, where agglomeration can clearly be observed. Overall, these findings reveal CB30 to be the most significant heterojunction, with the enhanced surface area making it a superior catalyst for simultaneous wastewater and energy production applications.
 |
| | Fig. 7 N2 adsorption–desorption isotherms of CeSnO3 (A), CB5 (B), CB10 (C), CB20 (D), CB30 (E) and CB40 (F). BJH pore-size distributions are also provided in the corresponding inset graphs. | |
X-ray photoelectron spectroscopic (XPS) analysis was carried out on the as-synthesized CB30 heterojunction before and after light illumination in order to study the surface chemical composition, occurrence of various chemical states and the photocatalytic stability (Fig. 8 and Fig. S2). The full XPS spectra of CB30 before and after illuminations show identical results and confirm the presence of all elements (Ce, Sn, O, Bi and S) in both samples (before and after light illuminations) (Fig. 8(A) and Fig. S2(A)). These results confirmed the excellent stability of the synthesized material under light illumination, which is a crucial factor in the field of wastewater treatment and energy production. Furthermore, high-resolution XPS analysis of the individual elements was carried out in order to study the light-induced chemical changes in the as-synthesized CB30 heterojunction (Fig. 8(B–F) and Fig. S2(B–F)). Particular attention was paid to the cerium redox states (Ce3+/Ce4+) and the presence of oxygen vacancies in the as-synthesized CB30 heterojunction. Moreover, the XPS results of certain elements (Ce, Sn and S) showed a slight increase in binding energies after light illumination. This positive shift in binding energy is due to the photoinduced charge redistribution38 in the CeSnO3/Bi2S3 heterojunction. Overall, the formation and migration of charge carriers, with dynamic Ce3+/Ce4+ redox transition together with oxygen-vacancy-related defect states, modify the electronic environment of the surface atoms, resulting in a slight positive shift of the binding energies for these elements (Ce, Sn and S).39,40
 |
| | Fig. 8 XPS analysis of the as-synthesized CB30 before illumination: full spectra (A), high-resolution spectra of Ce (B), Sn (C), O (D), Bi (E) and S (F). | |
High-resolution XPS analysis of the Ce 3d region in the as-synthesized CB30 heterojunction was performed to evaluate the various oxidation states of the Ce in the given sample. Moreover, the analysis was performed both before and after light illumination in order to determine the photoinduced chemical changes in cerium species. Fig. 8(B) shows that, before illumination, the Ce 3d5/2 spectrum could be deconvoluted into three characteristic peaks. The first two peaks at 880.0 eV (63.55%) and 885.0 eV (20.80%) are attributed to Ce3+ ions, while the third, low-intensity peak at a binding energy of 888.0 eV (15.65%) is assigned to Ce4+. Overall, the surface is dominated by the reduced Ce3+ ions (84.35%). This suggests that the perovskite possesses a defect-rich structure characterized by abundant electron-donating Ce3+ sites and oxygen vacancies associated with Ce3+ species. Such an environment is highly beneficial for electronic transport and efficient charge separation in cerium-based compounds.
Fig. S2(B) shows a noticeable change in the Ce 3d peaks after illumination. After light illumination, the dominant peak at 880.0 eV (before illumination) shifted to 882.0 eV (76.74%) and was assigned to Ce4+ species in the perovskite system. The intensity of the second peak at 885.0 eV also decreased (3.97%). Also, a positive shift in the third peak was observed; i.e., a shift from 888.0 eV to 888.6 eV. The peak at a binding energy of 888.6 eV (19.29%) is assigned to the Ce4+ oxidation state. Quantitative analysis showed that Ce4+ became dominant after light illumination. The significant transformation of Ce3+ → Ce4+ upon light illumination showed the photoinduced oxidation of Ce3+ ions, confirming the active participation of cerium redox centers during the photocatalytic process. Furthermore, the oxidation of Ce3+ to Ce4+ shows efficient formation of photogenerated electrons in the CeSnO3 system upon light illumination. This results in the formation of an internal electric field in the heterojunction system, and thus supports the proposed S-scheme charge-transfer mechanism in the CeSnO3/Bi2S3 heterojunction. In the given system, the Ce3+ sites act as electron reservoirs, and their conversion to Ce4+ ions revealed the effective charge migration and inhibition of electron–hole pair (e−/h+) recombination. More importantly, the reversible Ce3+/Ce4+ transition suggests that cerium ions remain redox-active and recyclable within the perovskite lattice. This redox flexibility contributes to stable long-term photocatalytic activity by enabling continuous regeneration of active sites, which, in turn, enhances photocatalytic degradation, antimicrobial efficiency and solar-driven hydrogen evolution. In addition, the combined effect of Ce3+/Ce4+ redox cycling and effective interfacial charge separation is a key factor behind the enhanced multifunctional performance of the CB30 heterojunction system.41,42
For Sn 3d, the XPS high-resolution spectrum showed two distinct peaks at binding energies of 486.1 eV and 494.5 eV. These peaks are assigned to the Sn 3d5/2 and Sn 3d3/2 spin–orbit component of tin, respectively (Fig. 8(C)). Moreover, the occurrence of the peaks at the corresponding positions confirmed that tin exists in the Sn2+ state, consistent with the CeSnO3 perovskite structure. Quantitative analysis further confirmed that Sn 3d5/2 contributes 60.7% and the Sn 3d3/2 contributes 39.3%, which are in good agreement with the spin–orbit intensity ratio. These quantitative contributions further confirmed the stability of Sn2+ ions in the perovskite lattice.43
The Sn 3d spectrum remained almost unchanged after light illumination, with both peaks (486.1 eV and 494.5 eV) showing minute shifts to the higher binding energy (∼0.1 eV). After light illumination, the peaks appeared at 486.2 and 494.6 eV, respectively (Fig. S2(C)). This small shift towards higher binding energies indicated the enhanced stability of Sn under light illumination. Quantitative analysis confirmed that, after light illumination, the peaks at 486.2 eV contributes 61.4% while the second peak at 494.6 eV contributes 38.6%, which further confirmed that the electronic environment of Sn remains largely unaffected upon light exposure. Additionally, after light illumination, no extra peaks were observed, showing that Sn retains its Sn2+ state, ultimately demonstrating its good chemical stability during the photocatalytic process. These results confirm that, unlike cerium (Ce), tin (Sn) does not participate actively in redox recycling but remains a stable component of the perovskite lattice. In the context of the CeSnO3/Bi2S3 heterojunction, upon light illumination, the photogenerated holes (h+) in the CeSnO3 counterpart of the heterojunction are predominantly regulated by the Ce3+/Ce4+ redox couple, while the Sn2+ facilitates charge separation and provides structural stability to the perovskite lattice.
In the case of the high-resolution O 1s XPS spectrum, three distinct peaks were observed (Fig. 8(D)). The first peak at 529.2 eV (48.62%) is attributed to the lattice oxygen (OL), the second peak at 530.6 eV (34.91%) is assigned to oxygen vacancies (OV), while the third peak at a binding energy value of 532.1 eV (16.47%) is assigned to surface adsorbed oxygen (Oads). The major contribution from the OL confirmed a precise metal-oxygen bonding in the CeSnO3 perovskite and the related oxide phase, as confirmed from the XRD, FTIR and HRTEM analyses, showing the structural integrity of the synthesized material. Furthermore, the presence of an appreciable amount of OV (34.91%) revealed the inherently defect-rich structure of the heterojunction material. The observed OV results from the imbalanced charging that arises from the different redox states of the Ce ions (Ce3+/C4+). These OV play crucial roles in charge-carrier separation (e−/h+), surface reactivity and adsorption of species, thereby enhancing the photocatalytic efficiency. Besides OL and OV, the Oads (16.47%) also plays an important role and actively participates in the surface redox reactions.44
Fig. S2(D) shows the XPS high-resolution spectrum of O 1s after light illumination. The result clearly shows a modification of the O 1s spectrum upon light illumination. The concentration of OV increased significantly to 71.26%, while the concentration of OL reduced to 14.83% of the total oxygen. The result demonstrates the significant production of OV upon light illumination inside the heterojunction. Similarly, the reduction in OL concentration after light illumination revealed the activation of the lattice oxygen and weakening of the metal–oxygen network in the perovskite system, which is in close conjugation with the oxidation of Ce3+ to Ce4+, as observed in the Ce 3d XPS spectrum. Furthermore, the almost identical contribution from Oads (13.91%) after illumination revealed that the involvement of these species in surface reactions remains largely unaffected. Interestingly, the enhancement in OV upon light illumination strongly supports the redox recycling of Ce3+ and Ce4+ in the perovskite system, in which photogenerated holes on the CeSnO3 side drive the oxidation of Ce3+, with OV forming simultaneously to preserve charge balance. The generated OV acts as an electron reservoir and plays a significant role in peroxymonosulfate (PMS) activation and the production of reactive oxygenated species (ROS), including ˙OH, SO4˙− and O2˙−. As a result, the combined effect of OV and reversible Ce3+/Ce4+ redox cycling potentially contributes to the enhanced photocatalytic degradation, antimicrobial performance and solar-driven hydrogen evolution.
Fig. 8(E) reveals the high-resolution Bi 4f XPS spectrum. Prior to light illumination, two prominent peaks were observed at binding energies of 157.2 (57.92%) and 162.6 eV (42.08%), which were assigned to Bi 4f7/2 and Bi 4f5/2, respectively. The observed binding energies (157.2 and 162.6 eV) are characteristic of Bi3+ in the Bi2S3 system, which further confirms the successful introduction of Bi2S3 in the heterojunction system.45 After light illumination (Fig. S2(E)), the main Bi 4f peaks remain at nearly the same binding energies (157.2 eV and 162.6 eV), suggesting that the bulk electronic structure of Bi2S3 remains largely preserved during photocatalytic excitation. However, two additional shoulder peaks emerge at 158.3 eV and 163.8 eV, which are attributed to surface-oxidized bismuth species, such as Bi–O, Bi–OH, or Bi2O3, formed due to mild photoinduced surface oxidation. The quantitative deconvolution further reveals that, after illumination, the contribution of the original Bi2S3 peaks decreases to 39.46% (157.2 eV) and 27.14% (162.6 eV), while the newly formed oxidized species account for 20.81% (158.3 eV) and 12.59% (163.8 eV) (Fig. S2(E)), respectively. This redistribution indicates that surface oxidation is limited and does not dominate the Bi chemical environment, with the majority of Bi remaining in the sulfide state even after illumination.
From a mechanistic perspective, these results provide strong support for the S-scheme charge transfer mechanism. The stability of the Bi2S3 core peaks implies efficient electron retention in the conduction band of Bi2S3, while photogenerated holes preferentially accumulate in CeSnO3, as independently confirmed by the pronounced Ce3+ → Ce4+ conversion and oxygen vacancy enrichment observed in the Ce 3d and O 1s spectra. The minor surface oxidation of Bi2S3 can be viewed as a secondary interfacial phenomenon arising from reactive oxygen species generated during photocatalysis, rather than detrimental bulk oxidation.
The high-resolution XPS S 2p spectrum for the CB30 heterojunction before illumination exhibits three well-defined peaks at 161.8, 162.9, and 164.0 eV, confirming the presence of sulfur species in different chemical environments (Fig. 8(F)). The peaks at 161.8 eV (S 2p3/2) and 162.9 eV (S 2p1/2) are characteristic of sulfide ions (S2−) in Bi2S3, while the higher binding energy peak at 164.0 eV is attributed to surface-oxidized sulfur species (S–O/S–OH). Quantitative peak deconvolution reveals that the sulfide sulfur dominates the surface chemistry prior to illumination, with percentage contributions of 46.87% (161.8 eV) and 38.42% (162.9 eV), giving a total S2− contribution of 85.29% (Fig. 8(F)). Compared to sulfide sulfur (S2), the surface oxidized sulfur only contributes 14.71% to the total sulfur content, revealing the small amount of oxidation, which, in turn, proves the structural stability of Bi2S3 in the heterojunction system.45
Fig. S2(F) showed a small positive shift in all the S 2p peaks upon light illumination. After light illumination, the corresponding peaks were found at 162.5 eV (43.56%), 163.5 eV (38.94%) and 164.6 eV (17.50%), respectively. Furthermore, it was observed that the concentration of sulfide sulfur decreased slightly (85.28% → 82.50%), while the concentration of oxidized sulfur increased (14.71% → 17.50%) upon light illumination. These small modifications suggest that only surface oxidized sulfur participates in the redox reaction, while the bulk Bi2S3 remains chemically stable during the photocatalytic process. As mechanistic insight, these results strongly support the proposed S-scheme charge-transfer mechanism, where the photogenerated electrons are retained in the CB of Bi2S3, while the photogenerated holes in the VB of CeSnO3 promote surface oxidation at the heterojunction interface.
The phenomenon of electron–hole pair (e−/h+) recombination of the synthesized materials was further studied by photoluminescence (PL) recombination experiments. The results of the PL recombination experiments, shown in Fig. S3(A), revealed significant variations in electron–hole pair recombination rates among the synthesized samples. A high-intensity PL peak was observed for the as-synthesized CeSnO3, indicating rapid recombination of e−/h+ in the synthesized sample. In contrast, the different heterojunctions (CB5–CB40) showed a significant decrease in PL intensities. The PL intensities decreased consistently from CB5 to CB30 and then again increased for the CB40 sample. The lowest PL intensity for CB30 indicates optimal charge separation and transfer in the heterojunction system. The exceptional increase in PL intensity for CB40 showed increased recombination of e−/h+ pairs, and hence a decrease in the photocatalytic activity of CB40. The results are in good agreement with degradation results (Fig. 9(A)). The decrease in the PL intensities might be attributed to the development of the heterojunction, which facilitates the charge separation and transfer, thereby decreasing the electron–hole pair recombination rates.17 The superior performance of CB30 relative to other photocatalysts can be attributed to its optimized compositional ratio, which promotes efficient charge carrier dynamics while effectively suppressing electron–hole pair recombination.46 These results are promising for the development of effective photocatalysts.
 |
| | Fig. 9 Photocatalytic degradation of LN over CeSnO3, CB5, CB10, CB20, CB30 and CB40 (A), effects of CB30 dosage (B), initial LN concentration (C), and HSO5− concentration (D), each with inset showing the corresponding kapp values. Experimental conditions: [LN]0 = 200–1000 µg L−1, [catalyst]0 = 5–20 mg, Xe lamp (55 W), irradiation time = 100 min. | |
The formation of ˙OH through the photocatalytic procedure was confirmed by photoluminescence (PL) analysis of the as-synthesized CeSnO3, Bi2S3 and CB30 using terephthalic acid (TA) as a probe molecule. The results of the PL analysis are shown in Fig. S3(B). The PL spectra of the TA probe molecule revealed significant enhancement upon ˙OH formation in the CB30 heterojunction, as evidenced by the increased PL intensity at approximately 425–430 nm. The interaction of light with the synthesized materials results in the formation of ˙OH. The generated ˙OH reacts with TA molecules and results in the formation of 2-hydroxyterephthalic acid (HTA),5 which exhibits a characteristic PL peak in the given wavelength range (eqn (1)–(6)). The formation of ˙OH followed the order CB30 > Bi2S3 > CeSnO3, showing a synergistic effect in the CB30 heterojunction, enabling efficient charge separation and transfer. The enhanced ˙OH formation in CB30 might be attributed to enhanced e−/h+ pair separation and efficient generation of ROS. The PL results suggest the use of CB30 heterojunction as a superior photocatalyst, making it a promising material for applications in wastewater treatment.
Table 1 BET analysis of the as-synthesized CeSnO3, CB5, CB10, CB20, CB30 and CB40 photocatalysts
| Sample |
S
(BET) (m2 g−1) |
Pore diameter (nm) |
Pore volume (cm3 g−1) |
| CeSnO3 |
16.4 |
6.268 |
0.105 |
| CB5 |
60.9 |
4.178 |
0.337 |
| CB10 |
72.3 |
3.953 |
0.323 |
| CB20 |
81 |
3.924 |
0.3111 |
| CB30 |
85 |
3.409 |
0.284 |
| CB40 |
17.9 |
6.777 |
0.258 |
The charge-transfer resistance and the re-association rate of charge carriers were further evaluated by electrochemical impedance spectroscopy (EIS). Fig. S3(C) shows the EIS spectra of as-synthesized CeSnO3 and the different weight percent perovskite-based heterojunctions (CB5–CB40). As shown in Fig. S3(C), each sample exhibits a characteristic semicircle, the diameter of which reflects the charge-transfer resistance (Rct) at the electrode–electrolyte interface. Among the different samples, the bare CeSnO3 possesses the largest semicircle, revealing the maximum Rct, which is attributed to the limited electrical conductivity and fast electron–hole pair (e−/h+) recombination in the CeSnO3 system. Furthermore, a progressive decline in Rct was observed upon the incorporation of Bi2S3 in the CeSnO3 system, which demonstrates the enhanced charge mobility and suppression of electron–hole pair (e−/h+) recombinations. Among the different heterojunctions, the smallest semicircle was observed for CB30. This clearly confirms its superior interfacial charge-transport capability and the most efficient separation of photogenerated e−/h+. The improved conductivity and rapid electron migration in CB30 compared to the other photocatalysts (CeSnO3, CB5, CB10, CB20 and CB40) is attributed to its optimized heterojunction structure, balanced composition and well-developed surface characteristics. These synergistic features account for its exceptional photocatalytic activity. A further increase in Bi2S3 loading (CB40) results in a slight increase in Rct compared to CB30, likely due to excess Bi2S3 blocking active sites and hindering charge movement. These results provide valuable insights into the electrochemical behavior of the synthesized photocatalytic materials, highlighting the benefits of the CB30 perovskite-based heterojunction in suppressing recombination of the generated electron–hole pairs and enhancing its photocatalytic performance in the field of wastewater treatment. Furthermore, the Nyquist plot of the CB30 electrode (Fig. S4), fitted using the Rs–(C||Rp)–Ws equivalent circuit, showed a characteristic semicircular arc followed by an inclined Warburg tail, revealing charge-transfer resistance coupled with diffusion-controlled mass transport. Where “Rs” is the solution resistance, “Rp” is the polarization resistance, “C” is the capacitance, and “Ws” is the Warburg impedance of CB30. The corresponding values of the circuit elements, Rs, C, Rp and Ws are listed in Table 2. The close overlap between the experimental and simulated impedance responses confirms the suitability of the selected model in perfectly describing the interfacial electrochemical processes. This behavior shows efficient ionic conduction and balanced charge-transfer kinetics within the electrode–electrolyte interface, highlighting the robust electrochemical performance of the CB30 system.
Table 2 Simulation results of the EIS fitting for the CB30 photocatalyst
| RC-circuit element |
R
s (Ω) |
C (F) |
R
p (Ω) |
W
s-P |
| CB30 |
18.22 |
2.50 × 10⁻⁵ |
73.92 |
0.95 |
The optical properties of the as-synthesized CeSnO3, Bi2S3 and CB30 were studied using UV-vis diffuse reflectance spectroscopy (UV-vis DRS), and the corresponding bandgap energies (Eg) of these materials were determined using the Tauc equation5 (eqn (9)).
where “
A” is a constant, “
h” is Plank's constant, “
Eg” is the band gap energy, “1/
n” equals ½ for the allowed direct transition. The “
α” is the absorption coefficient, which can be obtained from the Kubelka–Munk equation as follows (
eqn (10)).
| |  | (10) |
where “
R” represents the absolute reflectance of the synthesized materials, “
k” is the molar absorption coefficient and “
s” is the scattering coefficient. The obtained diffuse reflectance spectrum is converted into the Kubelka–Munk function (
F(
R)), which is equivalent to the absorption coefficient (
α). Thus, the left side of
eqn (10) was modified as (
F(
R)
hv)
1/n and plotted against the photon energy (
hv). The corresponding spectra of the synthesized materials were extrapolated to the
x-axis to obtain the band gap energy (
Eg) of the synthesized materials.
Fig. S3(D) shows band gaps of 2.86 eV for CeSnO3, 1.33 eV for Bi2S3 and 1.42 eV for the CB30 heterojunction. The bandgap energies of these materials confirmed their semiconductor nature, with the heterojunction exhibiting an intermediate bandgap energy. The Eg of the CeSnO3 decreased significantly from 2.86 eV to 1.42 eV upon the incorporation of Bi2S3 in the CeSnO3 system. The reduction in the Eg values of CB30 compared to those of CeSnO3 implies improved solar light absorption, potentially improving its photocatalytic performance towards the degradation of LN in aquatic media. These results highlight the importance of bandgap engineering in improving optical features and offer insightful information about potential applications of CB30.
The charge mobility and separation ability of the as-synthesized materials were further examined by transient photocurrent measurements. Fig. S5 shows the photocurrent response of the as-synthesized CeSnO3, CB10, CB20, CB30 and CB40 heterojunctions. These findings revealed that all the samples showed a positive response to light. A quick rise and rapid decrease in photocurrent were noted when the light was turned ON and OFF, confirming the reversible photoresponse of the synthesized materials. From Fig. S5, a slight drop in the current density can be observed within each light-on period; however, the photocurrent returns to almost its original value in the following cycles. This phenomenon shows that the slight decline in current density does not account for material degradation or structural instability under light illumination. Instead, the observed small decline in photocurrent density arises due to a temporary interfacial phenomenon, such as charge build-up at the electrode–electrolyte interface47 or the gradual stabilization of the photoelectrode surface under repeated illumination.48,49 Among all the samples, the CB30 heterojunction shows the highest photocurrent density of 7.674 µA cm−2, which is significantly higher than those of CB10 (3.292 µA cm−2), CB20 (4.611 µA cm−2), CB40 (5.821 µA cm−2) and especially pure CeSnO3 (1.501 µA cm−2). The outstanding performance of CB30 compared to other materials is attributed to the enhanced charge-carrier separation and mobility upon light illumination. Besides, the other materials show moderate responses in photocurrent measurements, with CeSnO3 showing the least among all the materials. Overall, the photocurrent measurements revealed that CB30 formed the most efficient heterojunction, making it a superior photocatalyst for use in wastewater purification and energy production applications.
3.2. Solar-light-assisted photocatalytic degradation of lindane in aqueous media
The photocatalytic efficiency of as-synthesized CeSnO3 and the different weight percent CeSnO3/Bi2S3 perovskite-based heterojunctions was determined in terms of LN degradation in aqueous media. Furthermore, the photocatalytic degradation of LN was also evaluated by optimizing various initial parameters, including catalyst optimization, pH optimization, PMS optimization, and the effect of different water systems, and the role of reactive species towards the LN degradation was also evaluated.
3.2.1. Photolysis of LN under simulated solar lamp.
Photolysis experiments conducted under simulated solar light showed that LN is highly resistant to direct photodegradation, with only 0.22% degradation observed after 100 min of irradiation and a corresponding kapp of 0.00003 min−1 (Fig. S6). The enhanced stability of LN is due to its negligible solar light absorption above 290 nm.50 Overall, it is concluded that direct photolysis is not an efficient way to degrade LN, likely due to its stable molecular structure and the irradiation conditions being used. These findings serve as the baseline for evaluating the efficiency of alternative degradation strategies, such as photocatalytic degradation using our synthesized materials.
3.2.2. Photocatalytic degradation of LN by as-synthesized CeSnO3 and the CeSnO3/Bi2S3 perovskite-based heterojunction.
The photocatalytic performance of the as-synthesized CeSnO3 and its heterojunction materials, i.e., CB5–CB40, was systematically evaluated for the degradation of LN under simulated solar light irradiations in aqueous media. As illustrated in Fig. 9(A), under simulated solar light illumination for 100 min, about 23%, 37.3%, 48.62%, 57.79%, 59.02% and 43.07% removal of LN was observed for CeSnO3, CB5, CB10, CB20, CB30, and CB40, respectively, with corresponding kapp values of 0.0027, 0.0048, 0.0067, 0.0083, 0.0092 and 0.0061 min−1 (Fig. 9(A), inset). The superior photocatalytic activity of CB30 towards LN degradation compared to the other materials is primarily ascribed to its high specific surface area (∼85 m2 g−1), oxygen-vacancy-rich surface, Ce3+/Ce4+ redox recycling–assisted charge regulation, high concentration of ˙OH and effective suppression of e−/h+ pairs. Based on its outstanding performance, CB30 was selected as the most efficient photocatalyst for further investigations.
3.3. Evaluation of key operational parameters
3.3.1. Effect of initial catalyst loading [CB30]0.
Following the identification of CB30 as the most effective photocatalyst, the next objective was to determine its optimal dosage for maximum photocatalytic performance. To this end, various initial concentrations of CB30 (5–20 mg) were photocatalytically tested against the target contaminant (LN) under simulated solar light for 100 min. As shown in Fig. 9(B), the degradation efficiency of LN increased significantly with increasing initial catalyst amount from 5 to 15 mg. At a reaction time of 100 min, about 62.17%, 66.41% and 70.71% removal was observed for 5, 10 and 15 mg, respectively, with corresponding kapp values of 0.0094, 0.0106 and 0.0117 min−1 (Fig. 9(B), inset). The observed improvement in photocatalytic performance with increasing CB30 dosage up to 15 mg is credited to the availability of a greater number of active surface sites, which enhance photon absorption and facilitate the generation of ROS.51 However, further increasing the catalyst dosage to 20 mg led to a decline in photocatalytic activity to 59.02% with a kapp value of 0.0092 min−1 (Fig. 9(B), inset). This decline might be attributed to several factors: (i) decreased light penetration due to increased turbidity, (ii) agglomeration of catalyst particles at higher concentrations, and (iii) reduced light utilization efficiency as excess catalyst may shield active sites from light exposure.51
3.3.2. Effect of initial concentration of lindane [LN]0.
The photocatalytic performance of the CB30 heterojunction was also determined by varying the initial concentration of LN in aqueous media in the range of 200–1000 µg L−1. As shown in Fig. 9(C), the photocatalytic performance of CB30 for LN degradation slightly decreases regularly upon increasing the initial concentration of LN in the aqueous media. About 75.7%, 73.4%, 70.7%, 62.4% and 57.8% degradation was achieved, with corresponding kapp values of 0.0137, 0.0127, 0.0117, 0.0095 and 0.0078 min−1 for 200, 400, 600, 800 and 1000 µg L−1 of LN, respectively (Fig. 9(C) and (C), inset). The decrease in percent degradation upon increasing the initial concentration of LN from 200–1000 µg L−1 might be attributed to (i) saturation of active sites of photocatalyst (CB30) and competitive adsorption of a large number of lindane molecules, (ii) light attenuation and reduced photon penetration, and (iii) competition between the addition intermediates and undegraded LN molecules.52
3.3.3. Effect of initial concentration of peroxymonosulfate [HSO5−]0.
Fig. 9(D) shows the photocatalytic degradation of LN by as-synthesized CB30 in the presence of HSO5−. For the experiment, the concentration of CB30 was kept constant (15 mg), while the concentration of HSO5− was varied from 0.1 to 2.0 mM. The results revealed that increasing the initial concentration of HSO5− from 0.1 to 1.5 mM caused an enhancement in the % degradation of LN from 74.55% to 93.21% under simulated solar lamp for 100 min. The enhancement in the percent degradation of LN upon increasing the initial HSO5− concentration is credited to the high concentration of reactive species (˙OH and SO4˙−) formation, which facilitates faster and more effective degradation of LN in aqueous media. However, a slight decline in the degradation of LN was observed when the HSO5− concentration was further increased beyond 1.5 mM. This decrease in percent degradation beyond the optimum limit (1.5 mM) might be due to (i) quenching of ˙OH and SO4˙− by HSO5−, (ii) reaction between ˙OH and SO4˙−, (iii) reaction between ˙OH and ˙OH, (iv) reaction between SO4˙− and SO4˙−, and/or (v) decreased penetration of light.5,53 The calculated kapp values for LN degradation were found to be 0.0138, 0.017, 0.0207, 0.0259 and 0.0215 min−1 at HSO5− concentrations of 0.1, 0.5, 1.0, 1.5, and 2.0 mM, respectively (Fig. 9(D), inset).
Additionally, a detailed comparison of the photocatalytic performance of the synthesized catalyst with previously reported materials for lindane degradation is summarized in Table S2.
3.3.4. Effect of pH of the medium on the photocatalytic performance of the CB30/HSO5− system.
The photocatalytic degradation of LN was also performed in media with three different pH values (3.5, 6.5 and 9); the results are depicted in Fig. 10(A). The results revealed that CB30/HSO5− worked efficiently in all media, with more than 90% removal of LN within 100 min under the simulated solar lamp. About 95.67%, 93.21% and 90.56% removal was achieved within 100 min, with kapp values of 0.0303, 0.0259 and 0.0227 min−1, for pH 3.5, 6.5 and 9.0, respectively (Fig. 10(A), inset). The degradation of LN was slightly favored in acidic media compared to neutral and basic media, which is attributed to better adsorption and efficient formation of ˙OH and h+ in acidic media, which, in turn, increased the percent degradation of LN.54 In basic media, the adsorption of LN was slightly more difficult owing to the generated ˙OH being scavenged by −OH.55 Hence, the percent degradation decreased slightly in basic media. Overall, the CB30/HSO5− showed efficient degradation performance towards LN across acidic, neutral and basic media, highlighting its versatility and stability under a wide pH range. This revealed that the synthesized material possesses robust photocatalytic properties and can be effectively employed in diverse wastewater conditions without significant loss in performance.
 |
| | Fig. 10 Effects of initial solution pH on LN removal (A), photocatalytic degradation in different water matrices (B), role of reactive species in the CB30/HSO5− system (C), and stability of CB30 (D), each with inset showing the corresponding kapp values. Experimental conditions: [LN]0 = 600 µg L−1, [CB30]0 = 15 mg, [HSO5−]0 = 1.5 mM, pH = 3–9, Xe lamp (55 W), irradiation time = 100 min. | |
3.4. Photocatalytic efficiency of CB30/HSO5− in different water systems
The photocatalytic activity of the CB30/HSO5− system was further investigated in diverse water matrices, including distilled water (DW), tap water (TW), synthetic wastewater (SW) and industrial water (IW) samples. The findings showed better results for LN degradation in DW and TW compared to SW and IW samples. The degradation of LN followed the order DW > TW > SW > IW. In the case of LN, 93.21%, 91.43%, 77.56% and 70.43% degradation was achieved with corresponding kapp values of 0.0259, 0.0236, 0.0144 and 0.0121 min−1 under the simulated solar light illumination for 100 min (Fig. 10(B), inset). The low degradation efficiency of LN in SW and IW compared to DW and TW might be due to the presence of interfering species, such as HCO3−, CO32−, SO42−, NO22−, and Cl−, which decreased the efficiency of the CB30/HSO5− system. These ionic species act as scavengers for the generated reactive radical species, such as ˙OH and SO4˙−, thereby lowering the efficiency of the degradation process (eqn (11)–(20)).5,17| | | HCO3− + HO → CO3− k = 8.5 × 10⁶ M−1 s−1 | (11) |
| | | HCO3− + SO4− → CO3− + SO42− + H+ k = 3.5 × 10⁶ M−1 s−1 | (12) |
| | | CO32− + HO → O3− + HO− k = 3.9 × 10⁸ M−1 s−1 | (13) |
| | | CO32− + SO4− → CO3− + SO42− k = 4.21 × 10⁶ M−1 s−1 | (14) |
| | | SO42− + HO → SO4− + HO− k = 3.5 × 10⁵ M−1 s−1 | (15) |
| | | SO42− + SO4− → S2O82− + e− k = 2.71 × 10⁵ M−1 s−1 | (16) |
| | | NO22− + HO → NO2− + HO− k = 8.0 × 10⁹ M−1 s−1 | (17) |
| | | NO22− + SO4− → NO2− + SO42− k = 8.8 × 10⁸ M−1 s−1 | (18) |
| | | Cl− + HO → CO2− + ClOH− k = 4.31 × 10⁹ M−1 s−1 | (19) |
| | | Cl− + SO4− → Cl + SO42− k = 2.6 × 10⁵ M−1 s−1 | (20) |
3.5. Identification of reactive species via scavenger study
To explain the photocatalytic mechanism and identify the primary ROS responsible for the degradation of the selected contaminant (LN), scavenger studies were conducted using CB30/HSO5− under simulated solar irradiation. Specific radical quenchers were introduced to selectively inhibit the target species: benzoquinone (BQ) for superoxide radicals (O2˙−), silver nitrate (AgNO3) for photogenerated e−, tertiary butyl alcohol (TBA) for ˙OH, and ethanol (EtOH) for both ˙OH and SO4˙−.17,56 Each scavenger was added at a concentration of 5 mM, while maintaining the same photocatalytic conditions. Fig. 10(C) shows 93.2%, 84.42%, 64.41%, 57.49% and 41.10% degradation of LN for Blank, AgNO3, BQ, TBA and EtOH, respectively, with corresponding kapp values of 0.0259, 0.0184, 0.0095, 0.0088, and 0.0056 min−1 (Fig. 10(C), inset). These findings revealed that the degradation of LN followed the order Blank > AgNO3 > BQ > TBA > EtOH. The degradation data clearly indicate that the addition of TBA and EtOH led to the most significant reduction in degradation efficiency and kinetic rates of LN, suggesting that ˙OH, SO4˙− and O2˙− play dominant roles in the photocatalytic removal of LN from aqueous media under light illumination. The results of the scavenger study confirm that the CB30/HSO5− photocatalytic system primarily operates through an oxidative pathway dominated by ˙OH, SO4˙− and O2˙− radicals. Furthermore, the percentage contribution of each reactive generated species towards the degradation of LN was calculated using eqn (21)–(24). The results showed 38.7, 7.3, 37.1% and 16.9% contribution of ˙OH, SO4˙−, O2˙− and e−, respectively, towards the degradation of LN in aqueous media (Fig. S7).| |  | (21) |
| |  | (22) |
| |  | (23) |
| |  | (24) |
3.6. Reusability and stability of the CB30 heterojunction
To assess the practical applicability of the as-synthesized CB30 heterojunction, its reusability and stability were assessed over five successive degradation cycles for the photocatalytic degradation of LN under simulated solar light illumination in aquatic media for 100 min. After each cycle, the photocatalyst was retrieved via centrifugation, washed thoroughly with distilled water and ethanol to remove surface-adsorbed residues, and dried in a vacuum oven at 80 °C before reuse under identical experimental conditions. As shown in Fig. 10(D), in the photocatalytic degradation of LN, the CB30 retained photocatalytic activity in up to five consecutive cycles, with degradation efficiencies of 93.21%, 91.96%, 89.32%, 88.25% and 86.12% and corresponding kapp values of 0.0259, 0.0223, 0.0195, 0.0138 and 0.0124 min−1, respectively (Fig. 10(D)). The minor reduction in photocatalytic activity after each cycle is primarily attributed to catalyst surface fouling, the accumulation of intermediate degradation products that may block the active sites, the reaction of intermediate chloride ions (formed during LN degradation) with reactive radical species (˙OH, SO4˙−) caused the formation of less reactive secondary radicals species, and the loss of catalytic nanoparticles after each cycle.57,58 Overall, the results confirmed the structural robustness and operational stability of CB30, supporting its potential for repeated use in solar-driven photocatalytic wastewater treatment.
3.7. Analysis of LN degradation products and proposed degradation pathways
The photocatalytic degradation of LN was achieved using the CB30/HSO5− system. GC-MS analysis identified nine degradation products (DPs) for LN in the CB30/HSO5− system. The DPs were formed during interactions of the contaminant molecules (LN) with ROS generated during the photocatalytic process. The primary reactive species responsible for the degradation were ˙OH and SO4˙−, as confirmed by the radical scavenging experiments (Fig. 10 (C)). The SO4˙− mainly facilitated electron-transfer reactions, while ˙OH attacked aromatic rings and functional groups, promoting bond cleavage and the formation of various intermediate species. In addition, photogenerated electrons reduced molecular oxygen to superoxide radicals (O2˙−), and photogenerated holes oxidized water molecules to yield additional ˙OH and directly oxidize the contaminants.5 These combined effects enhanced the degradation efficiency and promoted complete mineralization of the selected contaminants. Based on the identified DPs and radicals, pathways for the photocatalytic degradation of LN were proposed, as shown in Scheme 2.
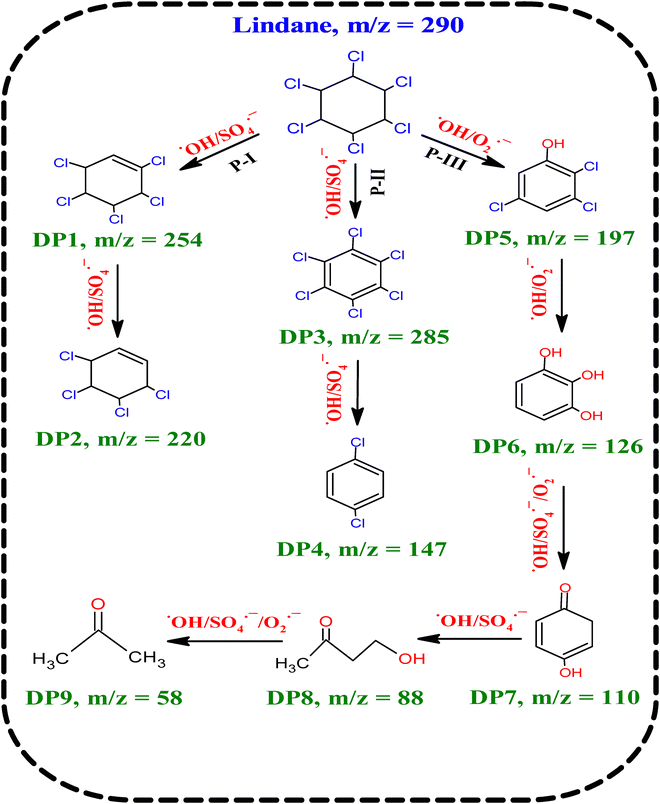 |
| | Scheme 2 Proposed photocatalytic degradation pathways and intermediate degradation products (DPs) of LN under simulated solar light irradiation using the CB30/HSO5− system. | |
The degradation pathways of LN (m/z 290), shown in Scheme 2, proceed through three routes (P-I, P-II and P-III) under the influence of SO4˙−, ˙OH and O2˙−. In Path-I, LN undergoes dechlorination and aromatization to yield chlorobenzene derivatives DP1 (m/z 254), which further dechlorinate to generate DP2 (m/z 220). Path-II, initiates with the dehydrogenation of LN and produces chlorobenzene intermediates DP3 (m/z 285), which, on dechlorination, generates DP4 (m/z 147). In P-III, LN is directly hydroxylated to chlorophenols (DP5, m/z 197), further oxidized to trihydroxylated derivatives of DP6 (m/z 126) and then to DP7 intermediates (m/z 110) through ring oxidation. Continued oxidative attack on DP7 leads to ring-opening products, generating hydroxylated aliphatic intermediates (DP8, m/z 88). Finally, small dimethyl ketone (DP9, m/z 58) is obtained via de-alcoholation of DP8. Collectively, the pathway reflects stepwise dechlorination, hydroxylation and ring-cleavage transformations, with DP9 representing the simplest breakdown product. The appearance of these low-molecular-weight products suggests extensive breakdown of the LN structure and likely mineralization to CO2.59
Overall, the degradation pathways of LN highlight the synergistic roles of SO4˙− and ˙OH along with O2˙− in driving the efficient decomposition of LN in aqueous media. The contribution of photogenerated charge carriers to generating these radicals underscores the effectiveness of the CB30/HSO5− photocatalytic system in degrading complex molecules such as LN into smaller molecular structures.
3.8. Eco-toxicity evaluation of LN and its degradation products
LN is a persistent organic contaminant of major concern due to its toxicity and stability in aquatic systems. An eco-toxicity assessment was carried out using the ECOSAR program. This assessment revealed that the parent contaminant LN and its degradation products (DPs) showed different levels of toxicity, with early DPs being more toxic than the later ones. Several intermediates (DP1 and DP3) were more harmful than the parent contaminant (LN). These findings also showed that the later DPs (DP7–DP9) that are formed upon the continuous attack of reactive radical species (SO4˙−, ˙OH and O2˙−) are essentially harmless (Fig. 11 and Table S3). According to the European Union and Chinese classification standards,17,34 LN, along with its degradation products (DPs), pose risks to aquatic organisms but at different levels. LN is moderately toxic, with LC50 values of 2.24 mg L−1 for fish and 1.57 mg L−1 for daphnia. Early-stage DPs of LN, such as DP1 and DP3, showed severe toxicity, with LC50 values as low as 0.52 mg L−1 and 0.08 mg L−1 for fish, and 0.48 mg L−1 and 0.06 mg L−1 for daphnia, respectively. Green algae were also sensitive, with EC50 values of 0.211 mg L−1 for DP3. Chronic toxicity (ChV) data confirmed this trend, as DP1 and DP2 of LN produced ChV values below 0.1 mg L−1 across all species. In contrast, the later degradation products (DP7-DP9) of LN were essentially harmless. These findings highlight that LN is moderately toxic and its early degradation products can pose greater ecological threats. However, the later degradation products that are formed after continuous attack of ROS are non-toxic/harmless to aquatic organisms, including fish, daphnia and green algae. Therefore, toxicity profiling of intermediates is essential for evaluating the environmental safety of advanced oxidation processes and ensuring complete mineralization or safe transformation of contaminants during wastewater treatment.
 |
| | Fig. 11 Predicted eco-toxicological profiles of LN and its degradation products (DPs) toward model aquatic organisms, as evaluated by the ECOSAR computational model. | |
3.9. Mechanistic insights into the photocatalytic degradation of LN by the oxygen-vacancy-rich CeSnO3/Bi2S3 perovskite-based heterojunction
The proposed photocatalytic mechanism of CB30, supported by radical quenching experiments, PL analysis and electrochemical characterizations, is illustrated in Scheme 3. Mott–Schottky analysis (Fig. S8), confirmed that both CeSnO3 and Bi2S3 exhibit n-type semiconductor behavior. The flat-band potentials (Efb) of CeSnO3 and Bi2S3, obtained from their respective Mott–Schottky plots, were −0.79 V and −1.196 V versus Ag/AgCl (Fig. S8). These values were further converted into the normal hydrogen electrode (NHE) scale using the standard equation (eqn (25)),17 yielding a potential of −0.593 V for CeSnO3 and – 0.96 V for Bi2S3. According to the literature,5,17 the conduction band (CB) edge for n-type semiconductor lies approximately 0.10–0.20 eV more negative than its Efb, whereas for p-type semiconductors the valence band (VB) edge is typically 0.10–0.20 eV more positive. Based on this principle, the CB positions for CeSnO3 and Bi2S3 were estimated to be −0.693 eV and −1.07 eV, respectively. Furthermore, the optical band gaps (Eg), determined from UV-vis DRS analysis, were 2.86 eV for CeSnO3 and 1.33 eV for Bi2S3 (Fig. S3(D)). Accordingly, the VB positions were estimated to be 2.22 eV for CeSnO3 and 0.26 eV for Bi2S3 using eqn (26).| | | E(NHE) = E(Ag/AgCl) + Eθ | (25) |
where “E(Ag/AgCl)” is actually the “Efb” that is obtained from the Mott–Schottky plots and Eθ = 0.197 V.
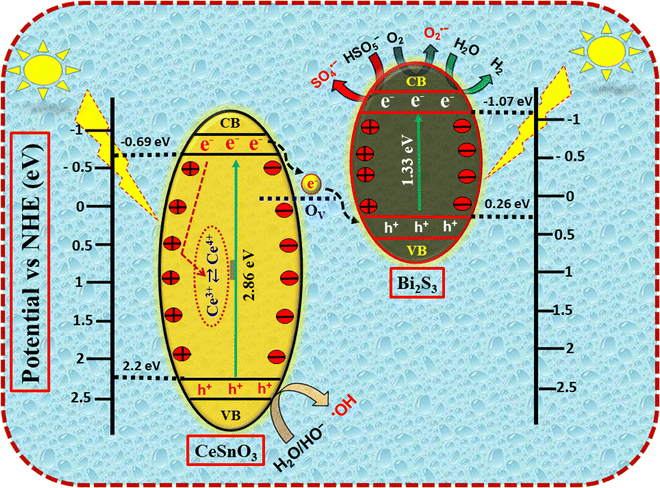 |
| | Scheme 3 Schematic of the proposed charge transfer and separation mechanism at the CeSnO3/Bi2S3 heterojunction interface in the CB30 photocatalyst under simulated solar light irradiation. | |
Scheme 3 represents the photocatalytic mechanism of the CB30 heterojunction, consisting of CeSnO3 and Bi2S3 components. The photocatalytic mechanism of the CB30 heterojunction is driven by an S-scheme charge-transfer pathway, which preserves the strong redox potential of photogenerated charge carriers while enabling spatial charge separation. Upon solar light illumination, both CeSnO3 and Bi2S3 are photoexcited and produce electron–hole pairs (e−/h+) (eqn (27) and (28)). The difference in Fermi levels between the two semiconductors induces interfacial band bending and a built-in electric field, which directs the selective migration of charge carriers. Photogenerated electrons (e−) in the conduction band (CB) of CeSnO3 (−0.693 eV) recombine with holes (h+) in the valence band (VB) of Bi2S3 (0.26 eV) through oxygen vacancies (OV), which create defect energy levels within the bandgap of CeSnO3, acting as interfacial recombination bridges.60 These oxygen vacancies are mainly associated with the redox flexibility of cerium ions within the CeSnO3 lattice. During the synthesis process, partial reduction of Ce4+ to Ce3+ can occur, which requires the removal of lattice oxygen atoms to maintain charge neutrality, thereby generating oxygen vacancy defects.61 In addition, the formation of the CeSnO3/Bi2S3 heterojunction may induce local lattice distortion and interfacial electronic interactions that further facilitate the generation and stabilization of these vacancies.62,63 The resulting oxygen-vacancy sites serve as effective electron-trapping centers, promoting interfacial charge separation and enhancing the activation of peroxymonosulfate during the photocatalytic process. This selective recombination of e−/h+ leaves behind energetic electrons in the CB of Bi2S3 (−1.07 eV) and h+ in the VB of CeSnO3 (2.2 eV) (eqn (29)).64 Moreover, the photogenerated electrons and holes are dynamically stabilized by the Ce3+/Ce4+ redox couple. Some of the photogenerated electrons in the CB of CeSnO3 are captured by Ce4+ and reduce it to Ce3+ ions (eqn (30)).65 Thus, the redox pairs (Ce3+ ⇄ Ce4+) act as an electron reservoir and play a crucial role in inhibiting electron–hole pair recombinations by modifying the internal redox capability of the catalyst. On the other hand, the photogenerated electrons in the CB of Bi2S3 reduce the molecular oxygen (O2) to the superoxide radical ion (O2˙−) (eqn (31)), while the photogenerated holes in the VB of CeSnO3 oxidize H2O or surface −OH and cause the formation of hydroxyl radicals (˙OH) (eqn (32) and (33)). Besides this, peroxymonosulfate (HSO5−) introduced into the reaction mixture is also activated by photogenerated electrons in the CB of Bi2S3, causing the formation of hydroxyl and sulfate radical ions (˙OH and SO4˙−) (eqn (36)).4 Along with this, some molecules of HSO5− undergo direct photolysis, leading to the formation of reactive radical species (eqn (37)).17 Together, these species (˙OH, SO4˙− and O2˙−) act synergistically to achieve the efficient removal of LN in aqueous media (eqn (34), (35) and (38)).
Besides pollutant degradation, the strong oxidative potential of holes in the CeSnO3 facilitates microbial membrane disruption and cellular inactivation, while the reducing electrons in Bi2S3 enable solar-light-driven hydrogen evolution by reducing protons to H2.17 Thus, the proposed oxygen-vacancy-rich S-scheme CeSnO3/Bi2S3 perovskite-based heterojunction, coupled with robust Ce3+/Ce4+ redox cycling and HSO5−, synergistically enhances redox selectivity, interfacial charge separation and electron–hole pair recombination. This unique combination of defect-mediated charge transfer and dynamic redox buffering endows the heterojunction with exceptional multifunctional photocatalytic performance, enabling efficient persistent pollutant (LN) degradation, microbial inactivation and solar-light-driven hydrogen evolution under environmentally relevant conditions.
| | | CeSnO3 + hv → e− + h+ | (27) |
| | | e(CeSnO3)− + h(Bi2S3)+ → e(Bi2S3)−, h(CeSnO3)+ | (29) |
| | | Ce3+ + hv ⇄ Ce4+ + e− | (30) |
| | | h(CeSnO3)+ + H2O → HO + H+ | (32) |
| | | h(CeSnO3)+ + HO− → HO | (33) |
| | | e(Bi2S3)− + HSO5− → SO4− + HO | (36) |
| | | HSO5− + hv → SO4− + HO | (37) |
3.10. Antimicrobial activities analysis of the as-synthesized CeSnO3, Bi2S3 and CB30 heterojunction
In addition to chemical contaminants, the presence of various microbes, such as bacteria and fungi, presents considerable threats to aquatic life and human health. The presence of these microbes in aquatic media can cause a series of problems, including waterborne diseases and ecological imbalance. Effective strategies are thus highly crucial for controlling microbial growth in aquatic media.
Fig. 12 shows the antimicrobial activities of the as-synthesized CeSnO3, Bi2S3 and CB30 heterojunction. The antimicrobial activities of these materials were determined against E. coli and C. albicans using the well-diffusion method. Details of the methodology are supplied in Text S3. The findings revealed that all the samples exhibit very good antimicrobial activities against E. coli and C. albicans. The zones of inhibition (ZOI) measured for these samples provide quantitative evidence of their efficiency towards microbial elimination, with detailed data presented in Table S4. The average ZOI values recorded against E. coli were found to be 16.5, 18.5 and 21.5 mm for CeSnO3, Bi2S3 and CB30, respectively. Similarly, for C. albicans, the average ZOI values were found to be 17.5, 18.5 and 20 mm for CeSnO3, Bi2S3 and CB30, respectively (Table S3).
 |
| | Fig. 12 Comparative evaluation of the antimicrobial activity against E. coli and C. albicans for the as-synthesized CeSnO3 (A and B), Bi2S3 (C and D) and the CB30 heterojunction (E and F). | |
A comparative analysis of the ZOI values of CeSnO3, Bi2S3 and CB30 reveals that the CB30 heterojunction exhibits a high antimicrobial activity compared to CeSnO3 and Bi2S3. The enhanced antimicrobial activity of CB30 arises from the synergistic effects of S-scheme heterojunction formation between CeSnO3 and Bi2S3, further amplified by oxygen-vacancy-induced defect sites and dynamic Ce3+/Ce4+ redox recycling, which collectively promote ROS generation and microbial cell inactivation. The enhanced performance of CB30 against E. coli and C. albicans confirmed its outstanding antimicrobial activity, highlighting its potential application in microbial elimination from aqueous media.
3.11. Photocatalytic H2 production using the oxygen-vacancy-rich CB30 heterojunction
The photocatalytic efficiency of the material towards hydrogen production is highly influenced by the overpotential associated with the hydrogen evolution reaction (HER). Materials that possess less negative HER overpotential are considered thermodynamically and kinetically feasible for H2 evolution. Linear sweep voltammetry (LSV) analysis of the as-synthesized CeSnO3, Bi2S3 and CB30 heterojunction shows HER values of −1.15 V, −1.07 V and −0.96 V against Ag/AgCl, respectively (Fig. 13(A)). The less negative HER overpotential value of CB30 compared to the others makes it a superior catalyst for solar-induced photocatalytic hydrogen evolution.
 |
| | Fig. 13 Linear sweep voltammetry (LSV) curves of CeSnO3, Bi2S3 and CB30, illustrating their respective overpotential for the hydrogen evolution reaction (HER) (A). Time-dependent photocatalytic H2 generation over CB30 under solar light irradiation at 6, 9 and 12 h (B). Corresponding hydrogen evolution rates (B; inset). External quantum efficiency (B). | |
Fig. 13(B) shows the photocatalytic hydrogen evolution catalyzed by the as-synthesized CB30 heterojunction under simulated solar light irradiations. The photocatalytic hydrogen evolution reactions were performed, and the samples were collected at reaction times of 6, 9 and 12 h. The collected samples were quantitatively analyzed using gas chromatography (GC-2010 Pro, Shimadzu, Kyoto, Japan). The GC analysis revealed H2 concentrations of 12.2, 22.2 and 37.7 mmol.g−1, which are produced at reaction times of 6, 9 and 12 h, respectively (Fig. 13(B)). The increase in the amount of H2 produced with time confirmed the excellent stability of the synthesized material upon light illumination. The calculated rates of hydrogen evolution under the same conditions were found to be 2.03, 2.47 and 2.98 mm h−1 g−1 for 3, 9 and 12 h of reaction time, respectively (Fig. 13(B); inset). These results demonstrate that the rate of hydrogen evolution increases regularly upon light illumination. The enhancement in the rate of hydrogen evolution is attributed to the activation of the material surface and enhanced interfacial charge dynamics upon light illumination.66
In the area of hydrogen production, one of the most important factors is the external quantum efficiency (EQE). EQE measures the fraction of incident protons that are effectively converted into hydrogen molecules during the hydrogen evolution reaction. A higher EQE reflects more efficient solar to chemical energy conversion, arising from improved charge separation, which consequently enhances photocatalytic hydrogen evolution activity.67 In the current study, the EQE was found to be 34.4%, 41.9% and 50.5% at reaction times of 6, 9 and 12 h, respectively (Fig. 13(B)). The results are quite interesting as they show the enhanced efficiency of the as-synthesized CB30 heterojunction for the effective solar-to-chemical energy conversion, compared to other conventional photocatalysts.
Overall, the photocatalytic hydrogen evolution experiments demonstrate the effective use of the CB30 heterojunctions for solar-induced H2 production. The enhanced efficiency is attributed to the occurrence of oxygen vacancies, redox recycling of Ce3+/Ce4+ and efficient heterojunction formation, which collectively participate in interfacial redox reactions, making CB30 a promising material for use in solar-induced H2 production.
4. Conclusions
This work describes the synthesis of a highly porous and multifunctional CeSnO3/Bi2S3, perovskite-based S-scheme heterojunction. The aim of this study was to achieve an efficient multifunctional photocatalyst for simultaneous wastewater treatment and hydrogen production. The synthesized material was comprehensively analyzed by characterization techniques including SEM, EDX, elemental mapping, TEM, HRTEM, SAED, XRD, FTIR, UV-Vis DRS, PL, EIS, LSV, BET and XPS, which confirmed the successful formation of the materials, including the presence of abundant oxygen vacancies and mixed Ce3+/Ce4+ oxidation states, which play a critical role in charge transfer and redox processes. Among the synthesized materials, the CB30 (30% heterojunction of CeSnO3 and Bi2S3) exhibited superior photocatalytic performance, achieving 70.7% degradation of lindane (600 µg L−1) in aqueous media under simulated solar light in 100 min. The photocatalytic efficiency of CB30 was synergistically enhanced by the introduction of HSO5− in the reaction medium, achieving 93.2% degradation of LN at a reaction time of 100 min with corresponding kapp values of 0.0259 min−1. The CB30 heterojunction also exhibits significant antimicrobial activity against E. Coli and C. albicans, with average ZOI values of 21.5 and 20 mm, respectively. The outstanding performance of CB30 is attributed to the successful formation of the heterojunction with a high surface area (∼85 m2 g−1) that enables efficient charge separation, inhibition of electron–hole pair recombination, and the formation of high concentrations of ˙OH, further reinforced by oxygen-vacancy-induced defect states that facilitate interfacial charge migration and selective recombination of low-energy charge carriers. The optical and photo-electrochemical analyses reveal that the CB30 follows an S-scheme charge-transfer mechanism, as supported by Mott–Schottky, UV-Vis DRS, PL and EIS results. This S-scheme configuration preserves the strong redox potential on both sides of the heterojunction, while the Ce3+/Ce4+ redox couples act as electron reservoirs, capturing and releasing photogenerated electrons to enhance redox capacity and sustain continuous charge transport. Electrons in the CB of Bi2S3 efficiently reduce O2 to O2˙− and protons to H2, while holes in the VB of CeSnO3 oxidize H2O/−OH to generate ˙OH. Along with these, the highly reactive SO4˙− is also formed upon the incorporation of HSO5− in the CB30 system. The generated radical species attacked the target contaminants and caused their successful elimination from aqueous media. Radical scavenging experiments revealed hydroxyl (˙OH), superoxide (O2˙−) and sulfate (SO4˙−) radicals as the major reactive species responsible for the contaminant's degradation in the aqueous media. In addition, the CB30 heterojunction showed excellent potential for solar-to-chemical energy conversion, producing 12.2, 22.2 and 37.7 mmol g−1 of H2 with the EQE values of 34.4%, 41.9% and 50.5% at reaction times of 6, 9 and 12 h, respectively, benefiting from oxygen-vacancy-assisted charge separation and Ce3+/Ce4+ redox recycling that maintain long-lived, highly reactive charge carriers.
Conflicts of interest
There are no conflicts to declare.
Data availability
All the original and raw data is available with the first author and can be provided upon request.
Supplementary information (SI) is available. See DOI: https://doi.org/10.1039/d6ma00255b.
Acknowledgements
The authors sincerely acknowledge the Higher Education Commission (HEC) of Pakistan for generous financial assistance through Project No. 17212. The authors thank Dr Zahid Ali Ghazi for granting permission to access the electrochemical workstation for the analysis of samples. CH acknowledges the support from the National Research Foundation of Korea (NRF) grant, funded by the Korean government (MSIT) (No. RS-2025-00461931). JZ and MS thank the Shanghai Sci-tech Co-research Program (25HB2711700).
References
- X. Li, W. Li, S. Wang, X. Zeng and Y. Jia, J. Environ. Chem. Eng., 2025, 117919 CrossRef CAS.
- R. Rescigno, O. Sacco, S. Pragliola, L. Albarano, G. Libralato, G. Lofrano, V. R. Spica, O. Tammaro, G. Montalbano and S. Esposito, Sep. Purif. Technol., 2024, 330, 125246 CrossRef CAS.
- P. S. Uluçtan, H. A. Eroğlu, E. N. Kadıoğlu and F. Akbal, J. Photochem. Photobiol., A, 2025, 459, 116105 CrossRef.
- Y. Song, Y. Hou and J. Wang, Sep. Purif. Technol., 2025, 377, 134266 CrossRef CAS.
- I. Gul, M. Sayed, F. Rehman, W. Jinlong, P. Fu, Y. Zhang and M. N. Nadagouda, Chem. Eng. J., 2025, 506, 159992 CrossRef CAS.
- S. Khan, C. Han, H. M. Khan, D. L. Boccelli, M. N. Nadagouda and D. D. Dionysiou, Mol. Catal., 2017, 428, 9–16 CAS.
- S. Khan, X. He, H. M. Khan, D. Boccelli and D. D. Dionysiou, J. Photochem. Photobiol., A, 2016, 316, 37–43 CrossRef CAS.
- S. Khan, X. He, J. A. Khan, H. M. Khan, D. L. Boccelli and D. D. Dionysiou, Chem. Eng. J., 2017, 318, 135–142 CrossRef CAS.
- Y. Wu, X. Chen, J. Cao, Y. Zhu, W. Yuan, Z. Hu, Z. Ao, G. W. Brudvig, F. Tian and J. C. Yu, Appl. Catal., B, 2022, 303, 120878 CrossRef CAS.
- H. Huang, M. He, X. Yang, Z. Tian, J. Hu and B. Wen, Appl. Surf. Sci., 2019, 493, 202–211 CrossRef CAS.
- Q. Zhang and W. Liu, J. Mater. Chem. A, 2025, 13, 7601–7633 RSC.
- T. D. Malevu, R. O. Ocaya, H. Soonmin and T. A. Nhlapo, Crit. Rev. Solid State Mater. Sci., 2024, 49, 464–481 CrossRef CAS.
- H. Sun, A. Sohail, A. Shah, Z. Liaqat and M. Gul, Phytopharmacol. Res. J., 2025, 4, 28–42 Search PubMed.
- M. Song, Y. Wu, Y. Zhao, C. Du and Y. J. I. C. Su, Inorg. Chem., 2020, 59, 3181–3192 CrossRef CAS PubMed.
- B. Y. Balarabe, Y. N. Kanafin, K. Rustembekkyzy, I. Serkul, M. A. Nauryzbaeva and T. S. Atabaev, Mater. Today, 2025, 9, 100099 CAS.
- J. Li and Z. Jin, J. Colloid Interface Sci., 2021, 592, 237–248 CrossRef CAS PubMed.
- I. Gul, M. Sayed, F. Rehman, W. Jinlong, P. Fu, Y. Zhang and M. N. Nadagouda, Appl. Catal., B, 2024, 359, 124493 CrossRef CAS.
- K. Ishihara, A. Nakada, H. Suzuki, A. Yamakata, O. Tomita, A. Saeki and R. Abe, J. Am. Chem. Soc., 2025, 147, 20759–20769 CrossRef PubMed.
- M. Mateen, G. Chen, N. Guo and W. S. Chin, Nanoscale Horiz., 2025, 10, 2397–2410 RSC.
- S. Karonnan Koroth, H. Islam, U. Pal and M. Vasundhara, ACS Appl. Energy
Mater., 2025, 8, 16082–16100 CrossRef CAS.
- P. A. Eslami, Surf. Interfaces, 2025, 106719 CrossRef.
- L. Xu, Y. Li, Z. Li, Z. Yin, Y. Wang, S. Gao, Z. Yang, J. Qiu and Z. Song, Chem. Eng. J., 2025, 165096 CrossRef CAS.
- S.-M. Bonyad-Shekalgourabi and Z. Shariatinia, Int. J. Hydrogen Energy, 2024, 51, 1397–1412 CrossRef CAS.
- D. Yi, Y. Wang, O. M. van't Erve, L. Xu, H. Yuan, M. J. Veit, P. P. Balakrishnan, Y. Choi, A. T. N’Diaye and P. Shafer, Nat. Commun., 2020, 11, 902 CrossRef CAS PubMed.
- S. Zhang, Y. Si, B. Li, L. Yang, W. Dai and S. Luo, Small, 2021, 17, 2004980 CrossRef CAS PubMed.
- Y. Liu, M. Li, X. Ma, Y. Zhang, Y. Wang, G. Li, R. Tang, S. Zhang, H. Zhao and Y. Zhu, Chem. Eng. J., 2024, 498, 155235 CrossRef CAS.
- M. Karmaoui, A. B. Jorge, P. F. McMillan, A. E. Aliev, R. C. Pullar, J. A. Labrincha and D. M. Tobaldi, ACS Omega, 2018, 3, 13227–13238 CrossRef CAS PubMed.
- Y. Gu, D.-H. Park, M.-H. Kim, J.-H. Byeon, D.-M. Lim, S.-H. Park, J.-H. Kim, J.-S. Jang and K.-W. Park, Chem. Eng. J., 2024, 480, 147789 CrossRef CAS.
- Y.-N. Lu, K. Mo, M. Gu, J.-S. Xie, Y. Yang, L. Zheng, X.-R. Liu, Y. Lu, J.-S. Chen and J. Ge, Chem. Eng. J., 2025, 510, 161390 CrossRef CAS.
- Z. Ghubish, R. Kamal, H. R. Mahmoud, M. Saif, H. Hafez and M. El-Kemary, J. Mater. Sci.: Mater. Electron., 2022, 33, 24322–24339 CrossRef CAS.
- E. Zavala-Flores, R. López-Juárez and J. C. González-Crisostomo, J. Mater. Sci.: Mater. Electron., 2025, 36, 1017 CrossRef CAS.
- Y. Chen, X. Chen, C. Ni, S. Li, D. Xiao, M. Liu and H. Su, Chem. Eng. J., 2025, 508, 160938 CrossRef CAS.
- K. I. Hadjiivanov, D. A. Panayotov, M. Y. Mihaylov, E. Z. Ivanova, K. K. Chakarova, S. M. Andonova and N. L. Drenchev, Chem. Rev., 2020, 121, 1286–1424 CrossRef PubMed.
- I. Gul, M. Sayed, N. S. Shah, J. A. Khan, K. Polychronopoulou, J. Iqbal and F. Rehman, Chem. Eng. J., 2020, 384, 123255 CrossRef CAS.
- I. Uddin, S. M. Abzal, K. Kalyan, S. Janga, A. Rath, R. Patel, D. K. Gupta, T. Ravindran, H. Ateeq and M. S. Khan, ACS Omega, 2022, 7, 42438–42445 CrossRef CAS PubMed.
- K. Bu, Y. Qu, J. Zhang, T. Zhang, L. Wu, D. Chen, S. Heng, H. Li and L. Bai, Chem. Eng. J., 2025, 167060 CrossRef CAS.
- L. Cerón-Urbano, C. J. Aguilar, J. E. Diosa and E. J. N. Mosquera-Vargas, Nanomaterials, 2023, 13, 2967 CrossRef PubMed.
- B. Zhang, D. Wang, J. Cao, C. Zhao, J. Pan, D. Liu, S. Liu, Z. Zeng, T. Chen and G. J. A. A. M. Liu, ACS Appl. Mater. Interfaces, 2023, 15, 12924–12935 CrossRef CAS PubMed.
- G. Colón, M. Hidalgo, G. Munuera, I. Ferino, M. G. Cutrufello and J. J. A. C. B. E. Navío, Appl. Catal., B, 2006, 63, 45–59 CrossRef.
- L. Wang, B. Cheng, L. Zhang and J. J. S. Yu, Small, 2021, 17, 2103447 CrossRef CAS PubMed.
- J. Pan, S. Wang, A. Chen, Y. Chen, M. Wang and Y. Chen, J. Alloys Compd., 2022, 898, 162895 CrossRef CAS.
- A. K. Dhanka, B. Pani and N. Agasti, RSC Adv., 2025, 15, 11774–11789 RSC.
- V. M. Nkwe, D. C. Onwudiwe and M. A. Azeez, BMC Chem., 2021, 15, 65 CrossRef CAS PubMed.
- I. Gul, M. Sayed, F. Rehman, W. Jinlong, P. Fu, Y. Zhang and M. N. J. A. C. B. E. Nadagouda, Appl. Catal., B, 2024, 359, 124493 CrossRef CAS.
- N. T. M. Tho, N. Van Cuong, V. H. L. Thi, N. Q. Thang and P. H. Dang, RSC Adv., 2023, 13, 16248–16259 RSC.
- W. Liu, C. Zhang, J. Shi, Z. Yu, Z. Fu, C. Cheng, X. Guan, M. Liu and L. Guo, Appl. Catal., B, 2025, 125858 Search PubMed.
- S. Kumar, K. Ojha and A. K. J. A. M. I. Ganguli, Adv. Mater. Interfaces, 2017, 4, 1600981 CrossRef.
- I. Gul, M. Sayed, F. Rehman, W. Jinlong, P. Fu, Y. Zhang and M. N. J. C. E. J. Nadagouda, Chem. Eng. J., 2025, 506, 159992 CrossRef CAS.
- B. Paci, A. Generosi, V. R. Albertini, P. Perfetti, R. De Bettignies and C. Sentein, Sol. Energy Mater. Sol. Cells, 2008, 92, 799–804 CrossRef CAS.
- S. Khan, J. A. Khan, N. S. Shah, M. Sayed, M. Ateeq, S. Ansar, G. Boczkaj and U. Farooq, RSC Adv., 2023, 13, 20430–20442 RSC.
- X. Xin, P. Zhu, M. Liu, Z. Huang and H. Lu, Chem. Eng. J., 2025, 165861 CrossRef CAS.
- M. Kanagalakshmi, T. N. Kumar, R. Janani and A. Pius, Chem. Eng. J., 2025, 168519 CrossRef CAS.
- G. Wang, Y. Deng, T. Sun, S. Zhou, G. Che, C. Liu and W. Jiang, Chem. Eng. J., 2025, 169686 CrossRef CAS.
- B. R. Shah and U. D. Patel, J. Environ. Chem. Eng., 2021, 9, 105458 CrossRef CAS.
- A. M. Khan, A. Mehmood, M. Sayed, M. F. Nazar, B. Ismail, R. A. Khan, H. Ullah, H. M. A. Rehman, A. Y. Khan and A. R. Khan, J. Mol. Liq., 2017, 236, 395–403 CrossRef CAS.
- F. Puga, J. Navío and M. Hidalgo, Appl. Catal., A, 2024, 685, 119879 CrossRef CAS.
- R. Cheng, J. Ren, H. Wang, H. Liang and P. Tsiakaras, Appl. Catal., B, 2024, 352, 124024 CrossRef CAS.
- M. Sayed, B. Ren, A. M. Ali, A. Al-Anazi, M. N. Nadagouda, A. A. Ismail and D. D. Dionysiou, Appl. Catal., B, 2022, 315, 121532 CrossRef CAS.
- Z. Zhang, H. Dong, Q. Cao, S. Chu and H. Zhang, Chem. Eng. J., 2024, 497, 154921 CrossRef CAS.
- N. Li, M. Shi, Y. Xin, W. Zhang, J. Qin, K. Zhang, H. Lv, M. Yuan and C. Wang, J. Environ. Chem. Eng., 2022, 10, 107420 CrossRef CAS.
- L. Zhou, M. Xie, C. Rao, H. Su, Y. Pang, H. Lou, D. Yang and X. J. C. E. J. Qiu, Chem. Eng. J., 2023, 471, 144574 CrossRef CAS.
- S. Zhang, Y. Si, B. Li, L. Yang, W. Dai and S. J. S. Luo, Small, 2021, 17, 2004980 CrossRef CAS PubMed.
- H. Dong, Y. Ji, Q. Shao, X. Hu, J. Zhang, X. Yao and C. Long, Sci. Total Environ., 2024, 924, 171521 CrossRef CAS PubMed.
- J. Low, J. Yu, M. Jaroniec, S. Wageh and A. A. Al-Ghamdi, Adv. Mater., 2017, 29, 1601694 CrossRef PubMed.
- Z. Li, D. Jia, W. Zhang, Y. Li, M. Wang and D. Zhang, Front. Chem. Sci. Eng., 2024, 18, 31 CrossRef CAS.
- Y. Li, L. Yang, H. He, L. Sun, H. Wang, X. Fang, Y. Zhao, D. Zheng, Y. Qi and Z. Li, Nat. Commun., 2022, 13, 1355 CrossRef CAS PubMed.
- J. Yi, T. Fei, L. Li, Q. Yu, S. Zhang, Y. Song, J. Lian, X. Zhu, J. Deng and H. Xu, Appl. Catal., B, 2021, 281, 119475 CrossRef CAS.
|
| This journal is © The Royal Society of Chemistry 2026 |
Click here to see how this site uses Cookies. View our privacy policy here. 
 Open Access Article
 This Open Access Article is licensed under a
  bc,
Wang
Jinlong
d,
Mallikarjuna N.
Nadagouda
e,
Saima
Noorin
f,
Juan
Zhang
bc,
Wang
Jinlong
d,
Mallikarjuna N.
Nadagouda
e,
Saima
Noorin
f,
Juan
Zhang


