DOI:
10.1039/D5MA01475A
(Paper)
Mater. Adv., 2026,
7, 3833-3845
Design and synthesis of an AIE-active naphthaldehyde hydrazone-based ligand: mechanochromic, acidochromic, and sensing studies
Received
17th December 2025
, Accepted 3rd March 2026
First published on 12th March 2026
Abstract
A new multifunctional Schiff base material, 1-((E)-(((Z)-3,5-difluoro-2-hydroxybenzylidene)hydrazineylidene)methyl)naphthalen-2-ol (L2), was synthesized through a simple one-step condensation of 2-hydroxy-1-naphthaldehyde hydrazone and 3,5-difluorosalicylaldehyde. The ligand was characterized by FT-IR, 1H and 13C NMR, ESI-MS and single crystal X-ray diffraction. The crystal structure of L2 crystallizes in the monoclinic system with the space group P121/c1. The compound exhibited aggregation-induced emission (AIE) and excited-state intramolecular proton transfer (ESIPT) characteristics, along with reversible mechanochromic and acidochromic behavior. L2 exhibited a rapid, sensitive, and reversible colorimetric as well as fluorometric “turn-off” response for Cu2+ ions in aqueous media, displaying a 1![[thin space (1/6-em)]](https://www.rsc.org/images/entities/char_2009.gif) :1 binding stoichiometry and an exceptionally low detection limit of 0.71 µM. The sensor L2 was effectively applied for Cu2+ detection in an on-site detection kit. Moreover, bioimaging studies demonstrated its excellent cell permeability, low cytotoxicity, and efficient Cu2+ sensing within living cells.
:1 binding stoichiometry and an exceptionally low detection limit of 0.71 µM. The sensor L2 was effectively applied for Cu2+ detection in an on-site detection kit. Moreover, bioimaging studies demonstrated its excellent cell permeability, low cytotoxicity, and efficient Cu2+ sensing within living cells.
1. Introduction
Stimuli-responsive fluorescent materials can undergo reversible changes in their optical properties, such as fluorescence emission and UV-visible absorption, in response to external stimuli including mechanical force, acidic or basic environments, heat, and light.1–9 As a result, these materials have been widely explored for applications in optoelectronic devices, data storage, security inks, and fluorescent sensing technologies.9–18 Mechanochromic luminescence (MCL) materials exhibit significant changes in emission wavelength, emission intensity, or fluorescence quantum yield when subjected to mechanical stimuli such as grinding, crushing, or shearing, resulting in high-contrast variations in luminescence color or intensity19–22 and can revert to their original state through annealing or exposure to organic solvent vapours.23,24 The mechanism of this process is mainly ascribed to changes in molecular conformation, packing structures, or intermolecular interactions, resulting in phase transitions such as crystalline-to-amorphous25,26 or crystalline to crystalline.27,28
Aggregation-induced emission (AIE), first reported by Tang et al. in 2001,29 has attracted considerable interest due to its unique luminescence behavior. AIE-active compounds are weakly emissive in dilute organic solutions, but exhibit strong fluorescence upon nanoaggregation in aqueous media, making them particularly attractive for biomedical applications.30–34 Photoinduced proton transfer (PT) is a basic and extremely significant process in chemistry and biology fields.35,36 In parallel, excited-state intramolecular proton transfer (ESIPT) has emerged as an important photophysical process, characterized by large Stokes shifts,37–39 and dual emission from enol and keto tautomers, enabled by strong intramolecular hydrogen bonding between proton donor and acceptor groups.
Copper is an essential trace element required for key enzymatic and physiological functions; its excessive accumulation poses serious health risks, including organ damage and neurodegenerative disorders.40 The WHO and USEPA have established the maximum allowable concentration of copper ions in drinking water as 31.5 µM and 20.5 µM, respectively.41,42 Therefore, the increasing environmental burden of copper due to its widespread industrial and biomedical use necessitates the development of sensitive and reliable detection methods. In this context, colorimetric and fluorometric chemosensors have gained significant attention as simple, rapid, cost-effective, and highly sensitive alternatives to conventional analytical techniques for Cu2+ detection.
Salicylaldehyde-derived Schiff bases are attractive stimuli-responsive materials due to their facile synthesis and purification, frequent aggregation-induced emission (AIE) behavior,43–46 and inherent structural flexibility,47–49 which enables phase transitions and tunable photophysical responses under external stimuli. Accordingly, these compounds have been widely explored for sensing mechanical stress, temperature, metal cations, anions, and enzymatic activity.13–17,50–54 In recent years, particular emphasis has been placed on their application in Cu2+ ion detection. However, many reported Schiff base-based Cu2+ sensors suffer from limitations such as slow response, high detection limits, narrow pH operating ranges, poor selectivity, interference from competing ions, and low aqueous solubility. Therefore, the development of a multifunctional fluorescent probe that integrates mechanochromic and acidochromic properties with highly selective and sensitive Cu2+ detection remains a significant and timely challenge.
In this work, we report a novel naphthaldehyde hydrazone-based ligand, 1-((E)-(((Z)-3,5-difluoro-2-hydroxybenzylidene)hydrazineylidene)methyl)naphthalen-2-ol (L2), which was synthesized by condensation of 2-hydroxy-1-naphthaldehyde hydrazone and 3,5-difluorosalicylaldehyde. Single crystals of L2 were finally obtained and analysed using single-crystal X-ray diffraction. Additional structural characterisation was performed through spectroscopic techniques such as FTIR spectroscopy, 1H & 13C-NMR, and ESI-MS analyses, as well as theoretical calculations. The AIE-ESIPT-active multifunctional probe L2 exhibited a distinct mechanochromic response, with its color changing from bright green to bright orange upon mechanical grinding, and reverting back to green upon exposure to DCM vapour. The ligand also exhibited reversible acidochromic responses upon alternate exposure to TFA and TEA vapours. Moreover, Schiff base ligand L2 exhibits a ‘turn-off’ fluorescence response for selectively detecting copper ions.
2. Experimental section
2.1. Synthesis and characterization of 1-((E)-(((Z)-3,5-difluoro-2-hydroxybenzylidene)hydrazineylidene)methyl)naphthalen-2-ol (L2)
In the initial step, 2-hydroxy naphthaldehyde hydrazone was synthesized by the following procedure. A solution of 2-hydroxy-1-naphthaldehyde (0.234 g, 1 mmol) in 20 mL of methanol was treated with 6 mL hydrazine hydrate (80%), and a few drops of acetic acid were added. After that, the reaction mixture was refluxed for 6 hours at 80 °C, and after cooling to room temperature, a pale orange-yellow solid was obtained in 91% yield. In the final step, naphthaldehyde hydrazone (0.093 g, 0.5 mmol) was dissolved in 15 mL of methanol, and 15 mL of 3,5-difluoro salicylaldehyde (0.079 g, 0.5 mmol) solution was added dropwise, and a catalytic amount of acetic acid was used. This step was quite sensitive; within 5 minutes, the reaction mixture formed a bright yellow precipitate. The product was isolated by filtration, washed thoroughly with cold methanol, and dried in an oven. Recrystallisation was achieved by dissolving the compound in an equimolar binary solvent system of CHCl3 and n-hexane, followed by gradual solvent evaporation, affording orange-yellow crystals. These crystals are appropriate for single-crystal X-ray diffraction analysis (SC-XRD). The formation of L2 was confirmed through FTIR, 1H NMR, 13C NMR, ESI-MS techniques, and single-crystal XRD analyses. Scheme 1 shows the synthetic route for L2 preparation. Yield: (91%); orangish-yellow; melting point: 162–165 °C. FT-IR (KBr, cm−1): 3430 (phenolic O–H); 2840, 2916 (aromatic C–H); 1625 (imine C![[double bond, length as m-dash]](https://www.rsc.org/images/entities/char_e001.gif) N); 1470 (aromatic CC); 1092 (C–O); 735 (C–Br) (Fig. S1). 1H NMR (400 MHz, chloroform-D) δ 11.47–11.42 (s, 2H), 9.68–9.60 (s, 3H), 8.70–8.66 (s, 2H), 8.19–8.08 (dd, J = 16.7, 8.5 Hz, 3H), 7.93–7.85 (dd, J = 9.0, 5.8 Hz, 3H), 7.83–7.76 (dd, J = 8.2, 1.4 Hz, 3H), 7.64–7.55 (m, 3H), 7.45–7.36 (td, J = 7.7, 2.6 Hz, 3H), 7.29–7.19 (m, 5H), 7.06–6.96 (ddd, J = 10.8, 8.2, 2.9 Hz, 2H), 6.94–6.86 (ddd, J = 8.2, 3.2, 1.8 Hz, 2H) (Fig. S2). 13C NMR (125 MHz, DMSO) δ 160.28–160.12, 155.45–155.13 (m), 153.70–153.45 (d, J = 11.4 Hz), 153.43–153.15 (d, J = 15.0 Hz), 152.41–152.25, 151.75–151.49 (d, J = 11.4 Hz), 145.34–145.04 (dd, J = 14.1, 4.1 Hz), 136.06–135.90, 133.33–133.17, 129.12–128.96, 128.16–128.00, 126.93–126.77, 126.33–126.17, 124.52–124.36, 122.36–122.10 (dd, J = 4.5, 3.1 Hz), 119.20–119.04, 116.95–116.79, 115.00–114.62 (dd, J = 23.1, 5.0 Hz), 108.07–107.91, 107.89–107.68 (d, J = 2.1 Hz), 107.66–107.50 (Fig. S3). ESI–MS analysis: a molecular ion peak at m/z = 326.09 corresponding to [(C18H12F2N2O2 + H) = 327.0947], which confirms the successful synthesis of the ligand (Fig. S4).
N); 1470 (aromatic CC); 1092 (C–O); 735 (C–Br) (Fig. S1). 1H NMR (400 MHz, chloroform-D) δ 11.47–11.42 (s, 2H), 9.68–9.60 (s, 3H), 8.70–8.66 (s, 2H), 8.19–8.08 (dd, J = 16.7, 8.5 Hz, 3H), 7.93–7.85 (dd, J = 9.0, 5.8 Hz, 3H), 7.83–7.76 (dd, J = 8.2, 1.4 Hz, 3H), 7.64–7.55 (m, 3H), 7.45–7.36 (td, J = 7.7, 2.6 Hz, 3H), 7.29–7.19 (m, 5H), 7.06–6.96 (ddd, J = 10.8, 8.2, 2.9 Hz, 2H), 6.94–6.86 (ddd, J = 8.2, 3.2, 1.8 Hz, 2H) (Fig. S2). 13C NMR (125 MHz, DMSO) δ 160.28–160.12, 155.45–155.13 (m), 153.70–153.45 (d, J = 11.4 Hz), 153.43–153.15 (d, J = 15.0 Hz), 152.41–152.25, 151.75–151.49 (d, J = 11.4 Hz), 145.34–145.04 (dd, J = 14.1, 4.1 Hz), 136.06–135.90, 133.33–133.17, 129.12–128.96, 128.16–128.00, 126.93–126.77, 126.33–126.17, 124.52–124.36, 122.36–122.10 (dd, J = 4.5, 3.1 Hz), 119.20–119.04, 116.95–116.79, 115.00–114.62 (dd, J = 23.1, 5.0 Hz), 108.07–107.91, 107.89–107.68 (d, J = 2.1 Hz), 107.66–107.50 (Fig. S3). ESI–MS analysis: a molecular ion peak at m/z = 326.09 corresponding to [(C18H12F2N2O2 + H) = 327.0947], which confirms the successful synthesis of the ligand (Fig. S4).
 |
| | Scheme 1 Synthetic procedure of L2. | |
2.2. Single crystal XRD analysis
Clear orangish-yellow crystals of L2 were crystallized by slow solvent evaporation of a chloroform-n-hexane (1:1) solution of the ligand. Single-crystal X-ray diffraction data for the crystal were collected on a Bruker SMART APEX II instrument. The diffractometer is equipped with a graphite-monochromated MoKα X-ray source with a wavelength of 0.7107 Å. Direct methods were used to solve the structure, followed by refinement through full-matrix least-squares on F2 using the SHELXTL and OLEX2 systems.55,56 Non-hydrogen atoms underwent anisotropic refinement, and hydrogen atoms were fixed at calculated positions. Hydrogen atoms were placed in their idealised positions and refined as riding atoms, with isotropic displacement parameters set to 1.2 or 1.5 times larger than the corresponding carrier atoms. The crystallography results, along with refinement details of ligand L2, are summarised in Table 1. The Mercury 2023.3.0.S program was used to draw the molecular structure.
Table 1 X-ray crystallographic structural refinement data of ligand (L2)
| Parameter |
Ligand (L2) |
| CCDC No. |
2467508 |
| Empirical formula |
C18H12F2N2O2 |
| Formula weight |
326.30 |
| Temperature |
296 (2) K |
| Wavelength |
0.71073 A |
| Crystal system |
Monoclinic |
| Space group |
P
121/c1 |
| Unit cell dimensions |
a (Å) = 16.730(7) |
|
|
b (Å) = 7.121(3) |
|
|
c (Å) = 13.227(5) |
|
|
α = 90° |
|
|
β = 111.664° (11) |
|
|
γ = 90° |
| Volume |
1464.5 (10) |
|
Z
|
4 |
| Density (calculated, g cm−3) |
1.480 |
| Crystal size (mm3) |
0.045 × 0.05 × 0.12 |
| µ (mm−1) |
0.115 |
|
F (000) |
672 |
|
θ range (deg) |
2.620–28.176 |
| No. of reflections collected |
3576 |
| Independent reflections (I0 > 2σ(I0)) |
1478 |
| GOF |
0.993 |
|
R
1 (I0 > 2σ(I0)) |
0.0550 |
| wR2 (all data) |
0.1662 |
| Largest hole and peak (e Å−3) |
−0.173 and 0.223 |
2.3. Preparation of stock solutions
Stock solutions of L2 (1 mM) were prepared in five solvents of different polarities. Working solutions (∼5 × 10⁻⁵ M) for UV-visible absorption and fluorescence measurements were obtained by appropriate dilution in the respective pure solvents. For metal ion sensing studies, stock solutions of metal ions (10−3 M) were prepared in distilled water, while a 10−3 M stock solution of L2 was prepared in tetrahydrofuran (THF). Test solutions of L2 (25 µM) were prepared using a THF–water mixture (1:9, v/v), followed by the addition of appropriate volumes of metal ion solutions before spectral measurements. UV-visible absorption and fluorescence emission spectra were recorded in the ranges of 200–800 nm and 370–720 nm, respectively, at room temperature.
3. Results and discussion
3.1. X-ray crystallographic studies
The clear, orangish-yellow colored crystal of L2 was crystallized by slow solvent evaporation of a chloroform-n-hexane (1:1) solution. The molecule crystallizes in the monoclinic system with P121/c1 space group and the unit cell parameters are a = 16.730(7) Å, b = 7.121(3) Å, c = 13.227(5) Å, α = 90°, β = 111.664(11)°, and γ = 90°. Four molecular units were present in the asymmetric unit. The ORTEP diagram of the structure with the thermal ellipsoids at a 50% probability level is shown in Fig. 1. The final crystal structure has been deposited in the Cambridge Crystallographic Data Centre with data access number CCDC 2467508. Crystallographic data and structural refinement data for L2 are described in Table 1. The crystal structure consists of a naphthalene ring with one –OH group in it and a phenyl ring with one –OH group and two fluorine atoms. Both rings were connected by the azomethine hydrazone linkage (CN–NC). L2 is almost planar with a minor dihedral angle, with a range of 0.66–2°. The bond length of C2N2 is 1.286 Å and C5N2 is 1.277 Å, which is comparable with previously published papers. The crystal structure exhibits strong intramolecular hydrogen bonds O2–H2—N2 (dH–A = 1.880 Å) and O1–H1—N1 (dH–A = 1.907 Å) forming a S(6) motif ring. All the bond lengths and angles of L2 are given in the SI (Tables S2 and S3).
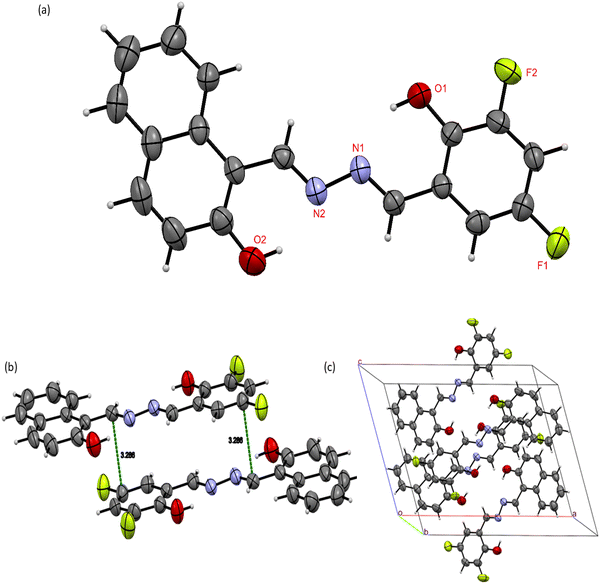 |
| | Fig. 1 (a) ORTEP representation of L2. The thermal ellipsoids at a 50% probability level. (b) Stacking interaction of L2 and (c) molecular packing in the unit cell of L2. | |
SCXRD can provide direct evidence of both ESIPT and AIE characteristics of the ligand L2, which belongs to the azomethine hydrazone family. The presence of ESIPT is observed due to strong intramolecular H-bonding between a proton donor (–OH group) and a proton acceptor (azomethine hydrazone nitrogen), which allows a proton jump from oxygen to nitrogen upon excitation. Such geometries allow the formation of a keto-tautomeric excited species. The AIE behaviour of ligand L2 can be justified by the restriction of intramolecular rotation (RIR). The ligand L2 contains multiple aromatic rings connected by single bonds that can rotate freely, providing non-radiative decay pathways. In the crystal structure, the ligand L2 contains multiple weak non-covalent interactions, such as C–H—F (dH–A = 2.473–2.643 Å) and C–H—π (dH–A = 3.826 Å) interactions (see Fig. 2), which act as ‘molecular stiffeners’, restricting the torsional rotation of the central azomethine hydrazone linkage and the peripheral phenyl rings. These interactions restrict intramolecular motions, accounting for the observed AIE behaviour.
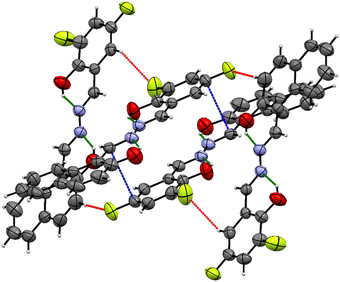 |
| | Fig. 2 Non-covalent interactions such as C–H—F (red colour) and C–H—π (blue colour) interactions. | |
3.2. ESIPT property of L2
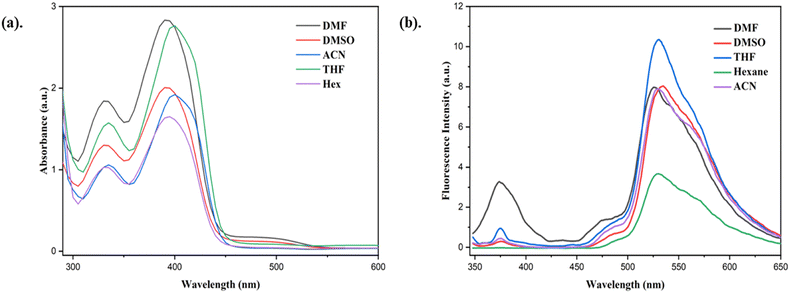
The photophysical behavior of the L2 ligand (∼50 µM) was studied in five different solvents with different polarities (DMF, DMSO, ACN, THF, and n-hexane) (Table S1). L2 exhibited two prominent absorption bands in the range of ∼390–404 nm across all investigated solvents, along with an additional broad band near ∼500 nm specifically in DMSO and DMF (Fig. 3a). The higher-energy absorption is assigned to the π–π* transition associated with the extended conjugation between the phenyl moiety and the imine linkage.58 In contrast, the longer-wavelength absorption observed in polar aprotic solvents is attributed to an n–π* transition, which originates from intramolecular hydrogen transfer between the azomethine nitrogen and the ortho–hydroxyl group. The steady-state fluorescence spectrum (Fig. 3b) revealed the ESIPT characteristics of L2, where the short-wavelength emission corresponds to the enol → enol (E–E*) transition, while the long-wavelength emission originates from the keto → keto* (K–K*) transition.57,58 The excited-state decay profiles recorded in different solvents exhibited multi-exponential behavior. Notably, the enol (E) emission showed a markedly longer fluorescence lifetime than the keto* (K*) emission. Time-correlated single-photon counting (TCSPC) measurements were therefore carried out to gain further insight into the excited-state dynamics. The TCSPC analysis revealed two distinct fluorescence lifetimes at different emission wavelengths, which can be assigned to the enol and keto* species, respectively. These observations provide strong evidence for the presence of ESIPT behavior in the molecule (Fig. S5). The average fluorescence lifetimes corresponding to the shorter-wavelength emission bands of L2 were longer than those of the corresponding longer-wavelength bands. Such differences in decay behavior can be attributed to the interaction of the solute with polar solvents.59,60 This indicates that solvent polarity affects the excited-state structure of L2 more strongly than the ground-state structure.
 |
| | Fig. 3 (a). Absorption and (b) emission spectra of L2 (50 µM) in different solvents. | |
3.3. AIE property of L2
The aggregation-induced emission (AIE) behavior of L2 was investigated by recording its fluorescence spectra in THF–water mixtures with varying water fractions (fw = 0–95%) (Fig. 4b). Fig. 4a presents the changes in emission intensity of L2 with increasing water content, along with images of the UV-illuminated vials. In pure THF, L2 exhibits weak fluorescence, which can be attributed to rapid intramolecular rotations and CN isomerization that promotes non-radiative decay pathways. As the water fraction increases from 0 to 30%, a slight decrease in emission intensity is observed, likely due to enhanced solvent polarity and the associated intramolecular charge transfer (ICT) effect, which converts the locally excited state into a twisted ICT (TICT) state. Upon increasing the water content up to 70%, only a slight enhancement in the emission peak was observed. When the water fraction reached 80%, a significant enhancement in the fluorescence intensity appeared, with ligand L2 exhibiting its maximum emission at 90%, attributed to aggregate formation. Overall, the emission intensity of L2 increased nearly 46-fold from fw = 0% to 90%, accompanied by a slight red shift from 528 to 532 nm. The formation of nanoaggregates in fw = 90% was supported by the dynamic light scattering (DLS) experiment, which shows that the average particle size distribution of the ligand was 164 nm (Fig. S6). Upon further increasing the water fraction to 95%, the emission intensity decreases, which is attributed to excessive agglomeration, leading to a reduction in effective emissive density. At higher water fractions, self-aggregation restricts intramolecular motions and enhances molecular rigidity, thereby facilitating the ESIPT process.61,62 These results demonstrate that L2 exhibits combined AIE and ESIPT characteristics.
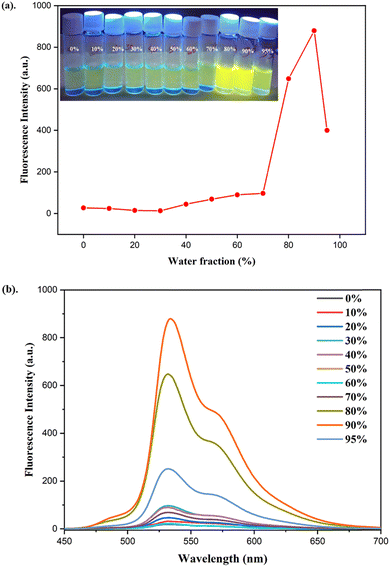 |
| | Fig. 4 (a) Color and fluorescence intensity of L2 (50 µM) in different water fractions (0–95%). (b) Fluorescence emission spectra of L2 in THF (λex = 370 nm, λem = 532 nm) recorded with increasing water fractions (fw) ranging from 0% to 95%. | |
3.4. Mechanochromic luminescence properties of L2
Generally, many AIE-active materials display mechanochromic behavior when transitioning between crystalline and amorphous states under external stimuli, typically showing a bathochromic shift and changed emission intensities, as their emission characteristics are strongly influenced by molecular packing. Therefore, we investigate the mechanochromic response of L2 to understand its behavior under mechanical stimuli. The mechanochromic luminescence properties of L2 were studied using photoluminescence spectroscopy. When excited with a 365 nm UV lamp, L2 exhibited a bright green emission with a peak at 526 nm. When the original sample L2 was ground mechanically with a mortar and pestle, a clear mechanochromic response was triggered, leading to a 16 nm red shift in the emission peak, shifted to 542 nm, accompanied by a significant decrease in emission intensity from 371 to 245 a.u. Consequently, the luminescence color changed from bright green to bright orange, demonstrating a distinct mechanochromic response (as shown in Fig. 5). Interestingly, the original emission peak, intensity, and color were recovered upon fuming the ground sample with DCM vapor, confirming the reversible nature of the mechanochromic process (Fig. 6a). Moreover, the emissive color change was reversible and it could be cycled multiple times through alternate grinding and solvent fuming, demonstrating both durability and reversibility under external stimuli.
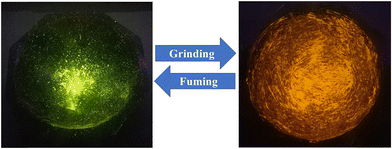 |
| | Fig. 5 Photographic images of L2 before and after grinding under a UV lamp (365 nm). | |
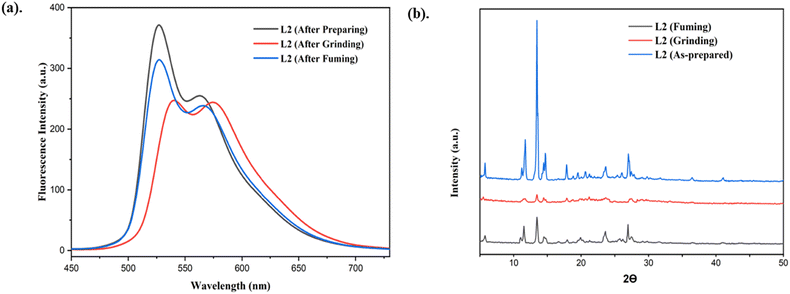 |
| | Fig. 6 (a) Solid state emission spectra of prepared, ground, and fumed samples of L2. (b) PXRD data of prepared, ground, and fumed samples of L2. | |
Reversible mechanochromic behavior is generally associated with changes in molecular packing in the solid state. To elucidate this effect, sensor L2 powders in different solid forms were analyzed by powder X-ray diffraction (PXRD). As illustrated in Fig. 6b, the as-prepared sample displays several sharp diffraction reflections, notably at 2θ = 5.64°, 11.69°, 13.51°, 14.74°, 17.81°, 23.69°, and 27.11°, indicating a well-defined crystalline arrangement. Upon mechanical grinding, these sharp reflections become significantly broadened and weakened, accompanied by the emergence of a broad diffraction halo, confirming the formation of an amorphous phase. This crystalline-to-amorphous transformation induced by external mechanical force is responsible for the observed fluorescence color change from bright green to bright orange.63 When the ground L2 samples were subsequently exposed to DCM vapor, sharp and intense peaks reappeared, similar to those of the as-prepared crystalline state. DCM plays a crucial role in regulating the mechanochromic luminescence behavior by acting as an efficient solvent vapor that facilitates molecular mobility and structural reorganization in the solid state. Mechanical grinding disrupts the original crystalline packing of the luminophore, converting it into a disordered amorphous phase and thereby altering the emission color. This solvent-assisted molecular diffusion enables the disordered molecules to reorganize into a thermodynamically favored crystalline or microcrystalline lattice, as evidenced by the recovery of sharp PXRD reflections and well-defined morphologies. Consequently, the original emission color is restored. Thus, DCM governs the reversible mechanochromic response primarily by promoting solvent-induced recrystallization and self-assembly, rather than participating directly in electronic transitions. These results indicate that the reversible transition between crystalline and amorphous phases is responsible for the mechanochromic behavior.
3.5. Acidochromic luminescence properties of L2
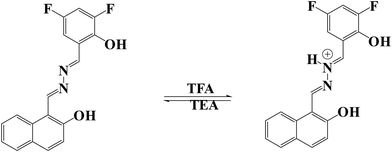
Acidochromism differs from mechanochromism, as it is induced by acidification through changes in the electronic delocalisation within a molecule.64 The Schiff base skeleton of L2 contains an azomethine hydrazone unit with a Lewis basic nitrogen, and this nitrogen is responsible for acidochromic properties because of the availability of the lone pair of electrons on the nitrogen to readily bind with protons. Moreover, deprotonation can be induced by exposure to a base, enabling reversible acid sensing or acidochromic luminescence (ACL) behavior, which has been examined in the solid state as well as the solution state. The pale-yellow color of the ligand in CHCl3 gradually changed to bright orange upon the addition of trifluoroacetic acid (TFA) and returned to its original color when triethylamine (TEA) was introduced. The reversible acidochromic properties of L2 were further examined through UV-vis absorption spectra and fluorescence studies stimulated by TFA and TEA. The absorption band of L2 at 415 nm gradually diminished, while a new band at 480 nm appeared and progressively intensified with the incremental addition of TFA. A clear isosbestic point at 440 nm in the spectra confirms the equilibrium between the protonated and non-protonated species, as shown in Fig. 7.65 The process was fully reversible upon the addition of the base triethylamine (TEA). Scheme 2 shows the proposed acidochromic mechanism of L2 with TFA and TEA.
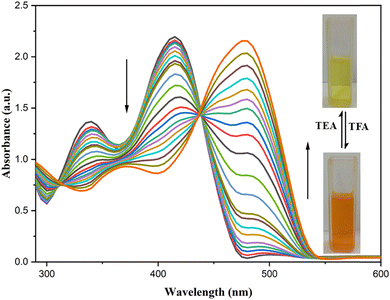 |
| | Fig. 7 UV-visible titration measurements of L2 with continuous addition of TFA and TEA in CHCl3. | |
 |
| | Scheme 2 Proposed simplified protonation process and response of L2 with TFA and TEA. | |
3.6. Metal ion sensing by L2
To evaluate the sensing ability of L2, its response in THF–H2O (1:9) toward various metal cations was explored using UV-visible absorption and fluorescence emission spectroscopy. Solutions of Na+, K+, Mg2+, Ca2+, Co2+, Fe3+, Ni2+, Sn2+, and Hg2+ were prepared from their corresponding chloride salts, while solutions of Cu2+, Al3+, Cd2+, Pb2+, and Zn2+ were obtained from nitrate salts. It became clear that the sensor L2 exhibited colorimetric as well as fluorometric responses selectively with Cu2+ ions (as shown in Fig. 8).
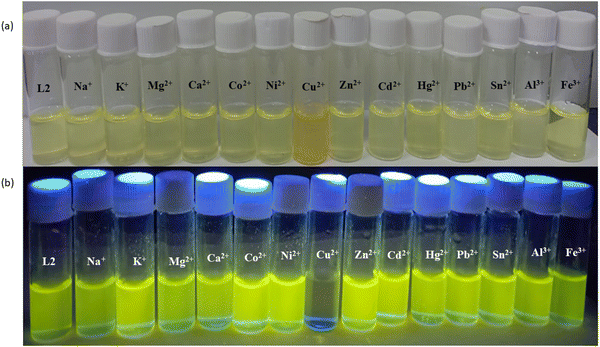 |
| | Fig. 8 Images of changes in the colour of L2 with various metal ions in THF:water (1:9 v/v) (a) under white light and (b) under UV light. | |
The absorption spectra of L2 revealed that the characteristic peak at 396 nm remained almost unaffected upon the addition of various metal ions, except in the presence of copper(II). Interestingly, the introduction of Cu2+ resulted in a red shift of this peak to 443 nm (Fig. 9) due to ligand to metal charge transfer (LMCT).
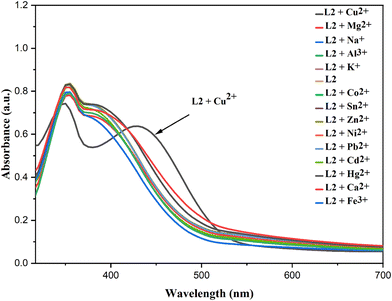 |
| | Fig. 9 Absorption spectra of L2 with different metal ions in a THF:water (1:9, v/v) mixture. | |
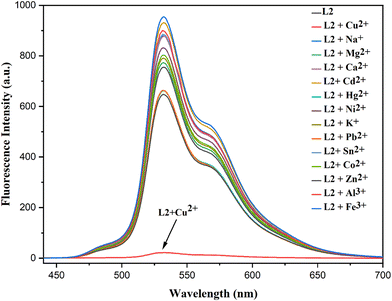
In fluorescence measurements, the emission band at 532 nm (excited at 370 nm) was significantly quenched by Cu2+, whereas other metal cations had a negligible influence on the fluorescence intensity (Fig. 10). Overall, both UV-vis absorption and fluorescence spectra confirmed that the probe exhibits high selectivity toward Cu2+ ions. During the experiments, it was observed that the emission intensity of L2 was rapidly quenched in the presence of Cu2+ ions.
 |
| | Fig. 10 Emission spectra (λexc = 370 nm) of sensor L2 (25 µM) with different metal ions in a THF:water (1:9, v/v) mixture. | |
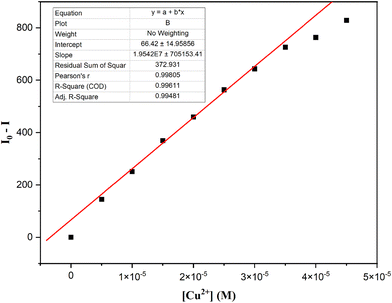
To evaluate the sensitivity and quenching efficiency, fluorometric titration of L2 (50 µM) was carried out with varying Cu2+ ion concentrations. The emission intensity at 532 nm decreased progressively with increasing Cu2+ concentration and was quenched by over 99% in the presence of the double equivalent concentration of copper ions (as shown in Fig. 11). The limit of detection (LOD) was estimated by applying the equation 3σ/S, where S represents the calibration plot's slope and σ stands for the standard deviation (Fig. 12). The slope was obtained from the plot of PL emission variation (I0 − I) versus Cu2+ concentration. Based on this calculation, the LOD was determined to be 0.71 × 10⁻⁶ M, which is far lower than the allowable copper levels recommended by the USEPA and WHO.66,67 Furthermore, a comparison with previously reported naphthaldehyde hydrazone-based chemosensors (Table S4) revealed that L2 exhibits superior sensitivity toward Cu2+ ions, even at trace concentrations.
 |
| | Fig. 11 Fluorescence spectra (λexc = 370 nm) of L2 (25 µM) on titrating with Cu2+ ions (0–50 µM) in a THF:water (1:9, v/v) mixture. | |
 |
| | Fig. 12 Calibration plot of L2 for the calculation of the LOD for Cu2+ ions (λexc = 370 nm) in a THF:water (1:9, v/v) mixture. | |
Applying the relation (I0 − I)/I0 × 100%, the quenching efficiency of L2 was determined to be 99.8%,68–71 confirming the effective quenching with Cu2+ ions. Stern–Volmer analysis showed a linear relationship with Cu2+ ion concentration, indicating the involvement of static quenching mechanisms (Fig. S7). The high Stern–Volmer constant further demonstrated efficient quenching, attributed to the paramagnetic nature of Cu2+. The observed intensity reduction arises from –OH replacement and disruption of conjugation upon Cu2+ chelation within the L2 framework. This chelation facilitates ligand-to-metal charge transfer, resulting in chelation-enhanced quenching.72–77
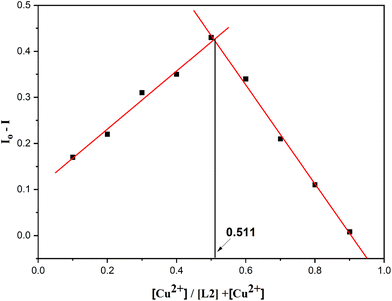
Job's figure experiment was applied to calculate the binding stoichiometry ratio of L2 and L2 + Cu2+ by plotting I0–I against [Cu2+]/[L2] + [Cu2+], where I0 denotes the fluorescence intensity of L2, and I denotes the fluorescence emission of L2 after various concentrations of copper ion were added. The measurement was carried out under uniform mixing conditions with various concentrations of Cu2+ and L2, preserving a constant volume of 2 mL. The Job's plot was made by plotting the emission intensity at 532 nm against the mole fraction of L2 (0.1 to 0.9). From the Job's plot (Fig. 13), we observed that the two straight lines intersect at 0.511 mole fraction, confirming a 1:1 stoichiometric ratio between L2 and Cu2+ ions.75 ESI-MS analysis further validated the proposed binding ratio of the L2–Cu2+ complex (as shown in Fig. S8). A molecular ion peak appears at m/z = 387.1173, which can be attributed to [L2 + Cu–2H]+ (calculated m/z = 387.00), confirming a 1:1 binding ratio (Scheme 3), which is correlated with the Job's plot results. Using the Benesi–Hildebrand plot, the binding constant was determined to be 1.6 × 10⁴ M−1, indicating a strong affinity between L2 and Cu2+ (as shown in Fig. S9).
 |
| | Fig. 13 Job's plot for the L2–Cu2+ complex obtained by plotting the fluorescence emission intensity of L2 against the mole fraction of Cu2+ (λexc = 370 nm) in a THF:water (1:9, v/v) mixture. | |
 |
| | Scheme 3 Plausible binding between L2 and Cu2+. | |
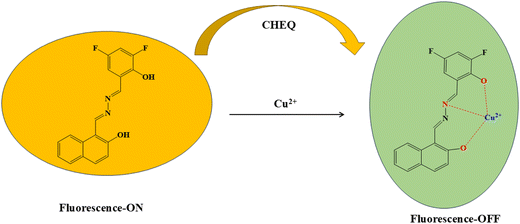
The possibility of binding of ligand L2 with copper ions was further analyzed through FT-IR analysis supported by DFT simulations. A comparative study of the FT-IR spectra of L2 and L2 + Cu2+ (Fig. 14) revealed notable shifts upon coordination. The free ligand shows a characteristic CN stretching band at 1625 cm−1. Upon complexation, this band shifts to 1600 cm−1 in the Cu2+ complex. The downward shift of the CN frequency confirms the coordination of the azomethine nitrogen atom to the Cu2+ ion, due to reduced electron density on the CN bond after metal–ligand interaction. Additionally, the broad band for O–H stretching frequency at 3430 cm−1 disappeared in the complex spectra, suggesting deprotonation and coordination of the hydroxyl group. This strongly suggests the involvement of the oxygen atom in metal binding. The aromatic CC stretching band shifts slightly from 1470 cm−1 (L2) to 1449 cm−1 (L2–Cu2+). This change indicates perturbation of the aromatic system, further supporting complex formation. It was further corroborated through the C–O band (1092 cm−1) shifted to 1036 cm−1, confirming the participation of the hydroxyl oxygen in chelation. Similar spectral changes have been reported in earlier studies.76–78
 |
| | Fig. 14 Comparison of the FT-IR spectra of L2 and the L2–Cu2+ complex. | |
We optimized the most stable geometry binding with copper ions through N and O atoms via six-membered rings in a 1:1 fashion using DFT simulations for both L2 and L2–Cu2+ to analyze the changes in electronic properties caused by complex formation. Strong Cu–O, Cu–O, and Cu–N interactions were evident from the calculated bond lengths of 1.93, 1.98, and 2.12 Å, confirming effective coordination within the complex. The HOMO–LUMO energy gap of the Cu2+ complex was found to be smaller (3.021589 eV) than that of the free ligand (3.8283 eV), which is consistent with the bathochromic shift observed in the absorption spectra after complexation with the copper ion (as shown in Fig. S10).58,79 Furthermore, the results revealed that the electronic cloud in the HOMO and LUMO of L2 was delocalized toward the Cu2+ ion, which confirmed the participation of O and N atoms in complex formation. This observation further confirms the occurrence of an LMCT phenomenon.80 Thus, both experimental and theoretical results clearly indicate that the ligand binds efficiently to Cu2+ ions in a 1:1 stoichiometry through the phenolic –OH group and the N atom of the –CHN moiety.
Reversibility is a key attribute that significantly enhances the practical applicability of a chemosensor for selective detection. The reversibility of sensor L2 was evaluated by tracing its fluorescence emission response during successive additions of equal concentrations of Cu2+ ions and EDTA over four cycles. Upon the addition of Cu2+, the fluorescence emission of L2 was completely quenched, whereas the emission intensity was fully restored after introducing equivalent amounts of EDTA. Reintroduction of copper ions to the same solution (L2 + Cu2+ + EDTA) again suppressed the recovered fluorescence (Fig. 15), confirming that L2 operates through a reversible sensing mechanism toward Cu2+ ions.
 |
| | Fig. 15 Fluorescence spectra (λexc = 370 nm) of L2 (25 µM) in the presence of Cu2+ ions (50 µM) with and without adding EDTA solution (50 µM) and on further addition of Cu2+ (50 µM) to the L2 solution containing Cu2+ and EDTA. | |
The key distinguishing features of the present sensor include its aggregation-induced emission (AIE) activity with excited-state intramolecular proton transfer (ESIPT) behavior, along with dual stimuli-responsive properties, namely reversible mechanochromism and acidochromism, which are rarely observed simultaneously in similar Schiff base ligands. In addition, the sensor exhibits high selectivity toward Cu2+ ions, with a low limit of detection (0.71 µM), which is comparable to or lower than those of several previously reported Schiff base-based chemosensors. Furthermore, the sensor demonstrates a rapid and highly reversible response, with nearly 95% fluorescence intensity recovery upon the addition of EDTA, and this almost completely disappears after the addition of Cu2+ ions to the same solution, indicating efficient metal binding and release. Importantly, the successful application of the sensor in living cells, such as HeLa cells, further demonstrates its practical applicability and biocompatibility, providing a significant advantage over many existing chemosensors.
4. Applications
To investigate the reliability and practical applicability of sensor L2 for the detection of Cu2+ ions in real samples, recovery experiments were carried out using different water sources. Water samples were collected from the laboratory tap, a lake (NIT campus), and the Barak River (Silchar, Assam). Before analysis, the samples were filtered to remove suspended impurities and subsequently spiked with known amounts of Cu2+ ions (0.02 and 0.05 equivalents). Following the addition of copper ions, fluorescence spectra were recorded, and the Cu2+ concentrations in these real samples were quantified using the corresponding calibration curve. The recovery results demonstrated satisfactory performance, with recovery values ranging from 98.4–101.5% for tap water, 97.2–99.1% for river water, and 94.50–96.70% for lake water (Table 2). The slightly lower recovery observed in lake water may be attributed to the presence of multiple competing ions. These findings highlight the capability of sensor L2 for accurate Cu2+ determination in real water matrices. Moreover, the successful estimation of copper ions in environmental samples suggests the potential applicability of L2 in diagnosing copper-related disorders, such as Wilson's disease. Overall, the real sample analysis confirms that L2 functions as an efficient fluorescent probe for Cu2+ detection in practical applications.
Table 2 Recovery percentage of Cu2+ ion concentration from different water samples
| Source |
Cu2+ added (µM) |
Cu2+ found (µM) |
Recovery (%) |
| Tap |
5 |
4.94 |
98.4 |
| 10 |
10.12 |
101.5 |
| River |
5 |
4.88 |
97.20 |
| 10 |
9.93 |
99.11 |
| Lake |
5 |
4.67 |
94.50 |
| 10 |
9.71 |
96.70 |
The practical applicability of L2 for qualitative detection of Cu2+ was initially evaluated using L2-coated cotton buds. To prepare them, cotton buds were dipped in an L2 solution for 30 seconds and then air-dried. These coated buds were subsequently immersed in various metal ion solutions (25 µM) and exposed to daylight and a UV chamber at 365 nm. As illustrated in Fig. 16, the copper-coated cotton buds exhibited a bright yellow color in daylight, but in the UV chamber, most of the cotton buds (except Cu-coated buds) exhibited bright green fluorescence, which selectively disappeared upon the addition of Cu2+, whereas other metal ions had no discernible impact. This observation confirmed the potential of L2-coated cotton buds as a simple and low-cost tool for Cu2+ detection.
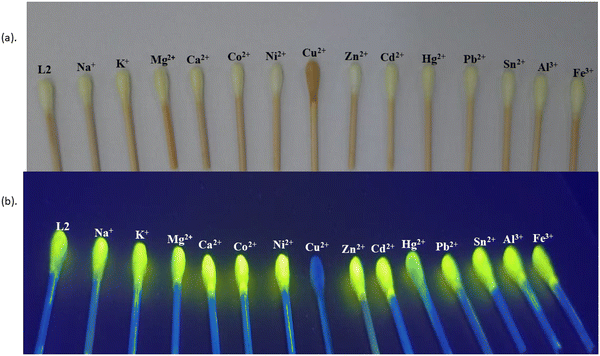 |
| | Fig. 16
L2-coated cotton buds tested as (a) colorimetric and (b) fluorometric sensors under daylight and UV-light in the presence of different metal ions. | |
Evaluating the biocompatibility of L2 was essential before applying it in living systems. Therefore, the cytotoxicity of L2 and L2 + Cu2+ was examined using an MTT assay on HeLa cells. The cells were incubated with different concentrations of the probe (0–100 µM) for two days at 37 °C. As shown in Fig. S11, L2 exhibited negligible toxicity toward the cells even at concentrations above ∼50 µM. Based on this, confocal fluorescence imaging was carried out to study the cellular uptake and response, and the corresponding images are presented in Fig. 17. When the cells were treated with approximately 25 µM of L2 for 3 h, strong green fluorescence was observed, confirming efficient internalization of the probe. In contrast, the fluorescence disappeared after subsequent treatment with ∼20 µM Cu2+, demonstrating a clear TURN-OFF response. These findings confirm that L2 can readily permeate cells and effectively detect Cu2+ ions in living cells, demonstrating its opportunity for intracellular copper sensing purposes.81–83
 |
| | Fig. 17 Bioimaging evaluation of sensors L2 and L2–Cu2+. | |
5. Conclusion
In summary, we report a new multifunctional material, 1-((E)-(((Z)-3,5-difluoro-2-hydroxybenzylidene)hydrazineylidene)methyl)naphthalen-2-ol (L2), that was synthesized via a facile one-step condensation of 2-hydroxy-1-naphthaldehyde hydrazone and 3,5-difluorosalicylaldehyde. The compound displayed AIE-active and ESIPT behavior, along with reversible mechanochromic and acidochromic responses. Mechanical grinding of the pristine L2 solid resulted in a 16 nm red shift in emission, accompanied by a reduction in intensity from 371 to 245 nm and also a fluorescence color change from bright greenish to bright orange. Remarkably, exposure of the ground sample to DCM vapor reinstated its original emission peak, intensity, and color, confirming the reversible nature of the mechanochromic behavior. The compound exhibited reversible acidochromic responses upon alternate addition of TFA and TEA. The sensor exhibited rapid, sensitive, and reversible colorimetric and fluorometric responses toward Cu2+ ions in aqueous media. The sensing mechanism toward Cu2+ was elucidated using DFT calculations and Job's figure and ESI-MS analyses, confirming a 1:1 sensor–metal binding stoichiometry. The limit of detection was calculated to be 0.71 × 10⁻⁶ M, which is substantially lower than the allowable concentration of Cu2+ ions in drinking water. The sensor L2 was effectively utilized in a test kit for the detection of copper ions. Finally, a cell imaging study verified its excellent cell permeability, minimal cytotoxicity, and “turn-off” fluorescence response in living cells. Thus, this study offers valuable insights for designing future “smart materials” with diverse applications arising from their multi-responsive properties in different states.
Conflicts of interest
There are no conflicts of interest to declare.
Data availability
The data supporting the findings of the study will be made available on request from the corresponding author.
Supplementary information (SI) is available. See DOI: https://doi.org/10.1039/d5ma01475a.
CCDC 2467508 contains the supplementary crystallographic data for this paper.84
References
- J.-J. Liu, Z.-J. Wang, S.-B. Xia, J. Liu and X. Shen, Dyes Pigm., 2020, 172, 107856 CrossRef CAS.
- B. A. Versaw, M. E. McFadden, C. C. Husic and M. J. Robb, Chem. Sci., 2020, 11, 4525–4530 RSC.
- M.-E. Sun, Y. Li, X.-Y. Dong and S.-Q. Zang, Chem. Sci., 2019, 10, 3836–3839 RSC.
- Y. Dong, J. Zhang, A. Li, J. Gong, B. He, S. Xu, J. Yin, S. H. Liu and B. Z. Tang, J. Mater. Chem. C, 2020, 8, 894–899 RSC.
- M. Martínez-Junquera, R. Lara, E. Lalinde and M. T. Moreno, J. Mater. Chem. C, 2020, 8, 7221–7233 RSC.
- W. Yang, S. Yamamoto, K. Sueyoshi, T. Inadomi, R. Kato and N. Miyamoto, Angew. Chem., 2021, 133, 8547–8552 CrossRef.
- Y. Huang, H. K. Bisoyi, S. Huang, M. Wang, X. Chen, Z. Liu, H. Yang and Q. Li, Angew. Chem., Int. Ed., 2021, 60, 11247–11251 CrossRef CAS PubMed.
- W. Yang, Y. Yang, Y. Qiu, X. Cao, Z. Huang, S. Gong and C. Yang, Mater. Chem. Front., 2020, 4, 2047–2053 RSC.
- P. Haloi, R. K. Mandal, S. Das, R. Dinda and P. Barman, New J. Chem., 2026, 50, 3169–3184 RSC.
- R. Liao, S. Gu, X. Wang, X. Zhang, X. Xie, H. Sun and W. Huang, J. Mater. Chem. C, 2020, 8, 8430–8439 RSC.
- Z. Wang, F. Yu, W. Chen, J. Wang, J. Liu, C. Yao, J. Zhao, H. Dong, W. Hu and Q. Zhang, Angew. Chem., Int. Ed., 2020, 59, 17580–17586 CrossRef CAS PubMed.
- M. Echeverri, C. Ruiz, S. Gamez-Valenzuela, M. Alonso-Navarro, E. Gutierrez-Puebla, J. L. Serrano, M. C. Ruiz Delgado and B. Gomez-Lor, ACS Appl. Mater. Interfaces, 2020, 12, 10929–10937 CrossRef CAS PubMed.
- Q. Lai, Q. Liu, K. Zhao, C. Shan, L. Wojtas, Q. Zheng, X. Shi and Z. Song, Chem. Commun., 2019, 55, 4603–4606 RSC.
- L. Tom and M. R. P. Kurup, J. Mater. Chem. C, 2020, 8, 2525–2532 RSC.
- J. Han, K.-M. Tang, S.-C. Cheng, C.-O. Ng, Y.-K. Chun, S.-L. Chan, S.-M. Yiu, M.-K. Tse, V. A. L. Roy and C.-C. Ko, Inorg. Chem. Front., 2020, 7, 786–794 RSC.
- Y. Qi, N. Ding, Z. Wang, L. Xu and Y. Fang, ACS Appl. Mater. Interfaces, 2019, 11, 8676–8684 CrossRef CAS PubMed.
- B. Xu, Z. Song, M. Zhang, Q. Zhang, L. Jiang, C. Xu, L. Zhong, C. Su, Q. Ban and C. Liu, Chem. Sci., 2021, 12, 15556–15562 RSC.
- B. Huang, D. Jiang, Y. Feng, W.-C. Chen, Y. Zhang, C. Cao, D. Shen, Y. Ji, C. Wang and C.-S. Lee, J. Mater. Chem. C, 2019, 7, 9808–9812 RSC.
- P. Shi, Y. Duan, W. Wei, Z. Xu, Z. Li and T. Han, J. Mater. Chem. C, 2018, 6, 2476–2482 RSC.
- L. Deng, L. Xue, Y. Gao, S. Fu and H. Wang, Spectrochim. Acta, Part A, 2024, 305, 123479 CrossRef CAS PubMed.
- C. Duan, Y. Zhou, G.-G. Shan, Y. Chen, W. Zhao, D. Yuan, L. Zeng, X. Huang and G. Niu, J. Mater. Chem. C, 2019, 7, 3471–3478 RSC.
- X.-W. Chen, L.-H. He, P. Ju, J.-L. Chen, S.-J. Liu and H.-R. Wen, J. Mater. Chem. C, 2020, 8, 16160–16167 RSC.
- J. Jia and H. Zhao, Org. Electron., 2019, 73, 55–61 CrossRef CAS.
- X. Yan, P. Zhu, Y. Li, S. Yuan, H. Lan and S. Xiao, Mater. Today Commun., 2019, 20, 100565 CrossRef CAS.
- S. Nagai, M. Yamashita, T. Tachikawa, T. Ubukata, M. Asami and S. Ito, J. Mater. Chem. C, 2019, 7, 4988–4998 RSC.
- M.-Y. Zhang, Q. Peng and C.-H. Zhao, J. Mater. Chem. C, 2021, 9, 1740–1745 RSC.
-
M. Jin, in Novel Luminescent Crystalline Materials of Gold (I) Complexes with Stimuli-Responsive Properties, Springer, 2020, pp. 103–126 Search PubMed.
- M. Echeverri, C. Ruiz, S. Gámez-Valenzuela, I. Martín, M. C. Ruiz Delgado, E. Gutiérrez-Puebla, M. A. Monge, L. M. Aguirre-Díaz and B. Gómez-Lor, J. Am. Chem. Soc., 2020, 142, 17147–17155 CrossRef CAS PubMed.
- J. Luo, Z. Xie, J. W. Y. Lam, L. Cheng, H. Chen, C. Qiu, H. S. Kwok, X. Zhan, Y. Liu and D. Zhu, Chem. Commun., 2001, 1740–1741 RSC.
- L. Huang, S. Yang, J. Chen, J. Tian, Q. Huang, H. Huang, Y. Wen, F. Deng, X. Zhang and Y. Wei, Mater. Sci. Eng., C, 2019, 94, 270–278 CrossRef CAS PubMed.
- R. Jiang, M. Liu, H. Huang, L. Mao, Q. Huang, Y. Wen, Q. Cao, J. Tian, X. Zhang and Y. Wei, J. Colloid Interface Sci., 2018, 519, 137–144 CrossRef CAS PubMed.
- J. Chen, M. Liu, Q. Huang, L. Huang, H. Huang, F. Deng, Y. Wen, J. Tian, X. Zhang and Y. Wei, Chem. Eng. J., 2018, 337, 82–90 CrossRef CAS.
- H. Huang, M. Liu, R. Jiang, J. Chen, L. Mao, Y. Wen, J. Tian, N. Zhou, X. Zhang and Y. Wei, J. Colloid Interface Sci., 2018, 513, 198–204 CrossRef CAS PubMed.
- X. Zhang, K. Wang, M. Liu, X. Zhang, L. Tao, Y. Chen and Y. Wei, Nanoscale, 2015, 7, 11486–11508 RSC.
- E. Hadjoudis and I. M. Mavridis, Chem. Soc. Rev., 2004, 33, 579–588 CAS.
- A. Douhal, F. Lahmani and A. H. Zewail, Chem. Phys., 1996, 207, 477–498 CrossRef CAS.
- V. Kumar, A. Kumar, U. Diwan, S. K. Srivastava and K. K. Upadhyay, Sens. Actuators, B, 2015, 207, 650–657 CrossRef CAS.
- S. Liu, L. Zhang, W. Zan, X. Yao, Y. Yang and X. Liu, Sens. Actuators, B, 2014, 192, 386–392 CrossRef CAS.
- X. Li, B. Hu, J. Li, P. Lu and Y. Wang, Sens. Actuators, B, 2014, 203, 635–640 CrossRef CAS.
- H. Tapiero, D. M. Townsend and K. D. Tew, Biomed. Pharmacother., 2003, 57, 386–398 CrossRef CAS PubMed.
- A. K. Boal and A. C. Rosenzweig, Chem. Rev., 2009, 109, 4760–4779 CrossRef CAS PubMed.
- B. R. Stern, J. Toxicol. Environ. Health, Part A, 2010, 73, 114–127 CrossRef CAS PubMed.
- W. Tang, Y. Xiang and A. Tong, J. Org. Chem., 2009, 74, 2163–2166 CrossRef CAS PubMed.
- Q. Feng, Y. Li, L. Wang, C. Li, J. Wang, Y. Liu, K. Li and H. Hou, Chem. Commun., 2016, 52, 3123–3126 RSC.
- S. S. Pasha, H. R. Yadav, A. R. Choudhury and I. R. Laskar, J. Mater. Chem. C, 2017, 5, 9651–9658 RSC.
- Y. Xie, L. Yan, Y. Tang, M. Tang, S. Wang, L. Bi, W. Sun and J. Li, J. Fluoresc., 2019, 29, 399–406 CrossRef CAS PubMed.
- M. I. Knyazhansky, A. V. Metelitsa, A. J. Bushkov and S. M. Aldoshin, J. Photochem. Photobiol., A, 1996, 97, 121–126 CrossRef CAS.
- I. O. Staehle, B. Rodriguez-Molina, S. I. Khan and M. A. Garcia-Garibay, Cryst. Growth Des., 2014, 14, 3667–3673 CrossRef CAS.
- P. Haloi, R. Kumar and P. Barman, Inorg. Chem. Commun., 2025, 182, 115612 CrossRef CAS.
- K. Zhang, J. Shu, J. Li, L. Meng, Y. Yang, B. Xu and W. Jiang, Tetrahedron Lett., 2020, 61, 151797 CrossRef CAS.
- A. Sen Gupta, K. Paul and V. Luxami, Sens. Actuators, B, 2017, 246, 653–661 CrossRef CAS.
- T. Zhang, L. Zhu, Y. Ma and W. Lin, Analyst, 2020, 145, 1910–1914 RSC.
- X. Zhang, J. Shi, G. Shen, F. Gou, J. Cheng, X. Zhou and H. Xiang, Mater. Chem. Front., 2017, 1, 1041–1050 RSC.
- L. Peng, S. Xu, X. Zheng, X. Cheng, R. Zhang, J. Liu, B. Liu and A. Tong, Anal. Chem., 2017, 89, 3162–3168 CrossRef CAS PubMed.
- G. M. Sheldrick, Acta Crystallogr., Sect. A: Found. Crystallogr., 2015, 71, 3–8 CrossRef PubMed.
- O. V. Dolomanov, L. J. Bourhis, R. J. Gildea, J. A. K. Howard and H. Puschmann, Appl. Crystallogr., 2009, 42, 339–341 CrossRef CAS.
- A. Jain, S. De, P. Saraswat, J. Haribabu, J. F. Santibanez and P. Barman, J. Mol. Struct., 2024, 1310, 138383 CrossRef CAS.
- A. Jain, S. De, D. Mukherjee, J. Haribabu, J. F. Santibanez and P. Barman, Spectrochim. Acta, Part A, 2024, 322, 124824 CrossRef CAS PubMed.
- S. Protti and A. Mezzetti, J. Mol. Liq., 2015, 205, 110–114 CrossRef CAS.
- A. Jain, S. De and P. Barman, Dyes Pigm., 2023, 220, 111769 CrossRef CAS.
- J. Gong, P. Wei, Y. Su, Y. Li, X. Feng, J. W. Y. Lam, D. Zhang, X. Song and B. Z. Tang, Chin. Chem. Lett., 2018, 29, 1493–1496 CrossRef CAS.
- P. Alam, V. Kachwal and I. R. Laskar, Sens. Actuators, B, 2016, 228, 539–550 CrossRef CAS.
- R. Zou, J. Zhang, S. Hu, F. Hu, H. Zhang and Z. Fu, CrystEngComm, 2017, 19, 6259–6262 RSC.
- J. Zhang, J. Chen, B. Xu, L. Wang, S. Ma, Y. Dong, B. Li, L. Ye and W. Tian, Chem. Commun., 2013, 49, 3878–3880 RSC.
- Y. Zhan, Q. Wei, J. Zhao and X. Zhang, RSC Adv., 2017, 7, 48777–48784 RSC.
- S. Vyas, Y. B. Barot and R. Mishra, J. Fluoresc., 2025, 35, 2903–2915 CrossRef CAS PubMed.
- D. A. Patel, T. Anand, P. Selvam and S. K. Sahoo, J. Fluoresc., 2024, 34, 359–366 CrossRef CAS PubMed.
- Y. Hu, A. Chen, Z. Kong and D. Sun, Molecules, 2019, 24, 4283 CrossRef CAS PubMed.
- T. K. Mondal, U. K. Ghorai and S. K. Saha, ACS Omega, 2018, 3, 11439–11446 CrossRef CAS PubMed.
- P. Haloi, R. K. Mandal, A. Jain, J. Haribabu, A. Arulraj and P. Barman, Inorg. Chem. Commun., 2025, 177, 114408 CrossRef CAS.
- L. P. F. Peixoto, J. F. L. Santos and G. F. S. Andrade, Spectrochim. Acta, Part A, 2023, 284, 121753 CrossRef CAS PubMed.
- L. Giraldo-Silva, B. Ferreira, E. Rosa and A. C. P. Dias, Plants, 2023, 12, 543 CrossRef CAS PubMed.
- S. Singh, S. Bhardwaj, C. Verma, M. Chhajed, K. Balayan, K. Ghosh and P. K. Maji, J. Mol. Liq., 2022, 366, 120326 CrossRef CAS.
- R. K. Mandal, P. Haloi, A. Jain, S. Sutradhar, J. Saikia, J. Haribabu, A. Arulraj and P. Barman, J. Mol. Struct., 2026, 1349, 143617 CrossRef CAS.
- B. Musikavanhu, Y. Zhang, D. Zhu, Z. Xue, R. Yuan, S. Wang and L. Zhao, Spectrochim. Acta, Part A, 2022, 281, 121599 CrossRef CAS PubMed.
- B. Ashok, N. Hariram, S. Siengchin and A. V. Rajulu, J. Bioresour. Bioprod., 2020, 5, 180–185 CAS.
- A. Kumar, B. Mohan, A. A. Solovev, M. Saini and H. K. Sharma, Microchem. J., 2022, 180, 107561 CrossRef CAS.
- M. A. M. Alhamami, A. Y. A. Mohammed, J. S. Algethami, H. M. Al-Saidi, S. Khan and S. S. Alharthi, Microchem. J., 2024, 197, 109817 CrossRef CAS.
- P. Haloi, A. Jain, H. Roy, D. Mukherjee, B. Nath and P. Barman, Spectrochim. Acta, Part A, 2025, 127204 Search PubMed.
- N. Goswami, H. P. Gogoi and P. Barman, J. Photochem. Photobiol., A, 2024, 446, 115106 CrossRef CAS.
- L. G. T. A. Duarte, F. L. Coelho, J. C. Germino, G. G. da Costa, J. F. Berbigier, F. S. Rodembusch and T. D. Z. Atvars, Dyes Pigm., 2020, 181, 108566 CrossRef.
- S. Kaleeswaran, D. S. Prabakaran, M. Santhamoorthy, S. Ansar, M. A. Farah, R. Rajamanikandan and K. S. Mani, Inorg. Chim. Acta, 2025, 575, 122440 CrossRef CAS.
- D. Rajasekaran, K. Venkatachalam and V. Periasamy, Appl. Organomet. Chem., 2020, 34, e5342 CrossRef CAS.
-
CCDC 2467508: Experimental Crystal Structure Determination, 2026 DOI:10.5517/ccdc.csd.cc2ntn16.
|
| This journal is © The Royal Society of Chemistry 2026 |
Click here to see how this site uses Cookies. View our privacy policy here. 
 Open Access Article
 This Open Access Article is licensed under a Creative Commons Attribution-Non Commercial 3.0 Unported Licence
 a,
Jebiti
Haribabu
b,
Diego
Quezada
a,
Jebiti
Haribabu
b,
Diego
Quezada


