DOI:
10.1039/D5MA01310K
(Paper)
Mater. Adv., 2026,
7, 3747-3760
Rice husk biochar-boosted BiOCl nanoplates: a sunlight-responsive route to wastewater detoxification and pathway insights for methylene blue degradation
Received
11th November 2025
, Accepted 8th January 2026
First published on 11th March 2026
Abstract
Heterojunction photocatalysts have attracted significant attention due to their ability to enhance pollutant degradation efficiency. In this study, bismuth oxychloride/rice husk biochar (BO/RB) heterojunction photocatalysts with different mass ratios (1![[thin space (1/6-em)]](https://www.rsc.org/images/entities/char_2009.gif) :1, 1:3, and 3:1) were successfully synthesized via an in situ approach and comprehensively characterized using field emission scanning electron microscopy (FESEM), energy-dispersive X-ray spectroscopy (EDS), Fourier transform infrared spectroscopy (FTIR), X-ray photoelectron spectroscopy (XPS), X-ray diffraction (XRD), high-resolution transmission electron microscopy (HRTEM), ultraviolet-visible diffuse reflectance spectroscopy (UV–DRS), photoluminescence (PL) spectroscopy, and Brunauer–Emmett–Teller (BET) surface area analysis, confirming their structural integrity and high levels of porosity. The incorporation of RB onto BO broadened solar light absorption, enhanced charge carrier separation, and increased the surface area, resulting in improved photocatalytic degradation of methylene blue (MB). The degradation process was optimized by varying catalyst dosage, pollutant concentration, light source, pH, and contact time. Under optimized conditions, BR13 achieved 99% removal of 10 ppm MB within 100 min at pH ≥ 7 under sunlight, following pseudo-first-order kinetics with a rate constant of 0.01761 min−1, exceeding that of commercial TiO2-P25 (0.00922 min−1). Reusability studies demonstrated good stability, retaining 92.3% degradation efficiency after five cycles. Radical scavenging experiments identified holes (h+) and hydroxyl radicals (˙OH) as the dominant reactive species. Additionally, BR13 exhibited effective mineralization, achieving 62% COD and 55% TOC reduction for MB. Due to its high photocatalytic efficiency, stability, and simple synthesis, the BO/RB heterojunction shows strong potential for large-scale wastewater treatment and mitigation of persistent organic pollutants.
:1, 1:3, and 3:1) were successfully synthesized via an in situ approach and comprehensively characterized using field emission scanning electron microscopy (FESEM), energy-dispersive X-ray spectroscopy (EDS), Fourier transform infrared spectroscopy (FTIR), X-ray photoelectron spectroscopy (XPS), X-ray diffraction (XRD), high-resolution transmission electron microscopy (HRTEM), ultraviolet-visible diffuse reflectance spectroscopy (UV–DRS), photoluminescence (PL) spectroscopy, and Brunauer–Emmett–Teller (BET) surface area analysis, confirming their structural integrity and high levels of porosity. The incorporation of RB onto BO broadened solar light absorption, enhanced charge carrier separation, and increased the surface area, resulting in improved photocatalytic degradation of methylene blue (MB). The degradation process was optimized by varying catalyst dosage, pollutant concentration, light source, pH, and contact time. Under optimized conditions, BR13 achieved 99% removal of 10 ppm MB within 100 min at pH ≥ 7 under sunlight, following pseudo-first-order kinetics with a rate constant of 0.01761 min−1, exceeding that of commercial TiO2-P25 (0.00922 min−1). Reusability studies demonstrated good stability, retaining 92.3% degradation efficiency after five cycles. Radical scavenging experiments identified holes (h+) and hydroxyl radicals (˙OH) as the dominant reactive species. Additionally, BR13 exhibited effective mineralization, achieving 62% COD and 55% TOC reduction for MB. Due to its high photocatalytic efficiency, stability, and simple synthesis, the BO/RB heterojunction shows strong potential for large-scale wastewater treatment and mitigation of persistent organic pollutants.
1. Introduction
A planet seemingly blue from space, Earth is paradoxically gripped by a crisis where drinkable water is exceptionally scarce—less than 1% of all freshwater is readily accessible for human use.1 Rapid population growth and industrial expansion compound this challenge, as industries continue to release toxic pollutants2–4 such as methylene blue (MB) into lakes and rivers, threatening both people and aquatic ecosystems. MB resists natural degradation, disrupts sunlight penetration, and is connected to severe health issues, including toxicity and cancer.5,6 These toxicological concerns necessitate the development of efficient and sustainable treatment strategies for the complete removal and mineralization of MB from wastewater. A variety of methods exist for removing synthetic dyes from wastewater, including adsorption,7 photocatalysis,8 biological processes,9 and membrane-based physical separation;10 nevertheless, many fall short in completely breaking down these pollutants.11,12 Photocatalytic degradation has emerged as a highly effective approach that uses light-activated catalysts to decompose complex dye molecules into non-toxic substances like carbon dioxide and water. This process involves three main steps: the catalyst absorbs photons to create reactive electron–hole pairs, these reactive species initiate oxidation–reduction reactions, and the dyes are ultimately mineralized through direct or indirect photocatalytic pathways.13,14 Photocatalysis offers the advantage of mineralizing dyes without generating secondary waste, making it a sustainable approach for treating dye-contaminated water.15,16
In recent years, rice husk biochar has emerged as a promising, economical, eco-friendly material for the removal of pollutants from water.17 Rice husk biochar, being rich in carbon, silica, and functional groups, offers a high surface area, excellent pollutant adsorption capacity, and potential light-harvesting ability.18,19 A wide range of metal oxides, including zinc oxide (ZnO),20,21 titanium dioxide (TiO2), bismuth oxychloride (BiOCl), iron oxide (Fe2O3), copper oxide (CuO), and tin oxide (SnO2), and ferrite-based photocatalysts, including Fe3O4 and CoFe2O4 which offer the advantage of magnetic recovery, have been extensively studied for their photocatalytic abilities in degrading synthetic dyes, but their surface area and visible-light activity often require enhancement via composite formation.22–24 However, a common challenge among these materials is their wide band gap, which limits light absorption mainly to the UV region, reducing overall efficiency.25 To overcome this, numerous approaches have been employed to narrow the band gap and improve photocatalytic efficiency, including metal or non-metal ion doping, coupling with conductive polymers, and forming composites with carbon-based materials like graphene, carbon nanotubes, or biochar. These modifications improve charge separation, increase visible light absorption, and boost degradation rates of dyes under sunlight or artificial light sources.26,27
Eltaweil et al. synthesized a silver-loaded biochar nanocomposite (Ag@biochar), achieving 88.4% removal of methylene blue and retaining 70.65% efficiency after six reuse cycles.28 Yu et al. synthesized ZnO/biochar nanocomposites via a simple ball-milling method, achieving 95.19% removal of methylene blue at a starting concentration of 160 mg L−1 under visible light through combined adsorption and photocatalysis.29 Sun et al. fabricated a g-C3N4/Ni0.1Co0.9Fe2O4/biochar hybrid photocatalyst, achieving 96.7% breakdown of methylene blue within 2 hours under visible light in the presence of H2O2.30 Eswaran et al. reported the successful preparation of a zinc oxide-coated biochar nanocomposite, demonstrating its remarkable potential as a photocatalyst for the degradation of methylene blue under sunlight, achieving up to 92% efficiency.31 Sharma et al. developed a CeO2/BiOCl/Ag2WO4 heterojunction photocatalyst that rapidly degraded methylene blue within 75 minutes.32 Adenuga et al. developed Ag/AgCl/BiOCl, showing 52% pollutant degradation under visible light.33 Dong et al. synthesized BiOCl/reduced graphene oxide (BiOCl/RGO) composites, showing photocatalytic degradation of sulfanilamide (SN) with an 82.7% degradation rate.34 He et al. demonstrated that Fe-doped BiOCl hierarchical microspheres significantly enhance visible-light-driven photocatalytic degradation of methylene blue, achieving a 93.5% removal efficiency.35 Although these catalysts have shown encouraging outcomes, they typically exhibit relatively low degradation efficiencies for organic dyes and require prolonged light irradiation. Additionally, issues such as sluggish reaction kinetics, poor reusability, restricted operational pH ranges, and incomplete pollutant mineralization limit their effectiveness and practical applicability in environmental remediation.
The present study introduces a novel BiOCl/Rice Husk Biochar (BR) nanocomposite synthesized via a hydrothermal route, which has not been previously reported for photocatalytic applications. Unlike previously reported systems, this study uniquely couples carbon-rich rice husk biochar, a renewable agricultural by-product, with semiconducting BiOCl, creating a synergistic hybrid material. The incorporation of biochar enhances surface area, pollutant adsorption, and charge transfer, while effectively narrowing the band gap of BiOCl and extending its response into the visible region. This synergistic interaction enhances charge carrier separation, suppresses electron–hole recombination, and significantly boosts photocatalytic activity. Remarkably, the BR nanocomposite exhibits its maximum degradation efficiency under natural sunlight, demonstrating its potential for real-world, solar-driven wastewater treatment. To the best of our knowledge, this is the first report of a BiOCl/rice husk biochar hybrid photocatalyst for methylene blue degradation under natural sunlight, highlighting its potential as a sustainable, cost-effective, and high-performance material for wastewater remediation. The composites were extensively characterized (XRD, XPS, FTIR, FESEM-EDS, HRTEM, UV-DRS, and PL), and key photocatalytic parameters, including catalyst dose, light source, solution pH, degradation kinetics, and scavenger studies, were systematically analyzed. Intermediates and final degradation products were identified by HRMS, and mineralization was confirmed by TOC and COD analyses. The optimized BR composites exhibited fast degradation rates, remarkable reusability, and superior solar-driven efficiency, successfully addressing prior constraints and offering a scalable, sustainable option for wastewater treatment.
2. Materials and methods
2.1. Materials
The chemicals and raw materials used are listed in the SI, S1.
2.2. Synthesis of BiOCl (BO)
A total of 242 mg of bismuth nitrate pentahydrate was dissolved in 100 mL of DI water with the addition of 1 mL of nitric acid to facilitate complete dissolution. The resulting solution was subjected to ultrasonication for 30 min, after which 37 mg of potassium chloride was added. The mixture was continuously stirred for 4 h and then centrifuged. The precipitate obtained was washed three times with distilled water and ethanol, then dried at 60 °C for 24 h to yield the final white powder.36
2.3. Synthesis of rice husk biochar (RB)
The rice husk sample was thoroughly washed with distilled water and dried in an oven at 70 °C overnight to remove residual moisture. The dried material was then ground into a fine powder. 2 g of dried material was then sonicated in 50 mL DI water for 30 min and subjected to a hydrothermal reaction in a Teflon-lined autoclave at 200 °C for 24 hours, resulting in the formation of rice husk biochar. Then it was thoroughly washed with distilled water to remove impurities. The products were then dried in an oven. Then the dried samples were preserved in desiccators to avoid further absorption of moisture.
2.4. Synthesis of BiOCl/rice husk biochar composites
The composites were synthesized via an in situ method using different weight ratios of bismuth nitrate pentahydrate and porous biochar. For the representative 1:1 ratio, 485 mg of bismuth nitrate pentahydrate was dissolved in 200 mL of DI water, followed by the addition of 2 mL concentrated nitric acid to facilitate complete dissolution and suppress hydrolysis of Bi3+ ions. Then, 180 mg of RB was introduced into the solution, and the mixture was ultrasonicated for 30 min. Subsequently, 74 mg of KCl was added, and the reaction mixture was stirred continuously for 4 h to ensure appropriate interaction of all components. The same procedure was applied for other weight ratios (1:3 and 3:1) with appropriately adjusted amounts of reagents. The final suspension was centrifuged, and the collected precipitate was washed three times with distilled water and ethanol to eliminate any unreacted species and residual by-products. The purified material was dried in a hot air oven at 60 °C to obtain the powdered product. By altering the relative amounts of Bi(NO3)3·5H2O, KCl, and biochar, hybrid composites with weight ratios of 1:1, 1:3, and 3:1 were successfully prepared and labelled as BR11, BR13, and BR31, respectively. The synthetic procedure for the BR hybrid is depicted schematically in Scheme 1.
 |
| | Scheme 1 Schematic representation of the synthesis procedure of BR composites. | |
3. Results and discussion
3.1. Characterization methods
Detailed descriptions of the characterization techniques employed in this study are provided in the supplementary material S2.
3.1.1. X-ray diffraction study.
The crystalline structures of RB, BO, and their composites were examined using XRD patterns (Fig. 1a). The diffraction peaks observed at 2θ = 11.99°, 24.12°, 25.87°, 32.54°, 33.46°, 36.52°, 40.90°, 46.67°, 49.71°, 55.06°, and 58.63° correspond to the crystal planes (001), (002), (101), (110), (102), (003), (112), (200), (201), (004), (104), and (212), respectively. These diffraction peaks correspond well with the standard JCPDS card No. 06-0249, confirming the successful synthesis of BO nanoplates with a tetragonal crystal structure.37 The strong preferential orientation along the (001) plane indicates the formation of stacked nanosheet-like structures, which is consistent with the layered nature of BO. In the case of RB, the XRD pattern confirmed the presence of amorphous silica, as evidenced by the broad hump around 2θ ≈ 21.48° (002).38 No additional impurity peaks were detected in the XRD patterns, confirming the successful fabrication of the composites. Furthermore, the negligible shift in peak positions suggests high phase purity of the binary heterojunction photocatalysts and confirms the coexistence of both phases in the composite.
 |
| | Fig. 1 (a) XRD pattern, (b) FTIR spectra, (c) N2 adsorption–desorption isotherm curve and (d) BJH plot of BO, RB, BR11, BR13, and BR31. | |
3.1.2. FTIR measurements.
FTIR spectroscopy was used to examine the surface functionalities and bonding characteristics of RB, BO, and their composites (Fig. 1b). The FTIR spectrum of BO typically exhibits a characteristic peak around 1128 cm−1 corresponding to the Bi–Cl stretching vibration, indicative of the bismuth oxychloride structure. Additionally, a broad band around 1609 cm−1 and one between 3200 and 3500 cm−1 correspond to the bending and stretching vibrations of hydroxyl groups and adsorbed water, indicating oxygen-containing surface functionalities vital for photocatalytic activity.39,40 The FTIR analysis of RB reveals specific functional groups characteristic of the material. Peaks in the range of 1619–1627 cm−1 likely indicate ketonic C![[double bond, length as m-dash]](https://www.rsc.org/images/entities/char_e001.gif) O groups, while a peak at 1568 cm−1 is associated with C–O+ stretching vibrations of oxonium groups, contributing to surface protonation. A distinct peak at 1106 cm−1, representing Si–O–Si stretching confirms the formation of biochar-derived silica during high-temperature calcination.41 The aromatic C–H symmetric stretching vibrations manifest near 1460 cm−1, and out-of-plane aromatic C–H bending appears at 788 cm−1 (ref. 38). These spectral features correlate well with earlier XRD, confirming the composite's structural integrity and functionalization. Overall, the observed absorption bands, along with slight shifts in wavenumbers, confirm the coexistence of BiOCl and RB, and validate the successful synthesis of the nanocomposite.
O groups, while a peak at 1568 cm−1 is associated with C–O+ stretching vibrations of oxonium groups, contributing to surface protonation. A distinct peak at 1106 cm−1, representing Si–O–Si stretching confirms the formation of biochar-derived silica during high-temperature calcination.41 The aromatic C–H symmetric stretching vibrations manifest near 1460 cm−1, and out-of-plane aromatic C–H bending appears at 788 cm−1 (ref. 38). These spectral features correlate well with earlier XRD, confirming the composite's structural integrity and functionalization. Overall, the observed absorption bands, along with slight shifts in wavenumbers, confirm the coexistence of BiOCl and RB, and validate the successful synthesis of the nanocomposite.
3.1.3. BET surface area analysis.
The specific surface area and porosity of the synthesized photocatalysts were evaluated using N2 adsorption–desorption isotherms, as illustrated in Fig. 1c and summarized in Table 1. The adsorption–desorption profiles exhibited type IV isotherms for all samples, confirming the development of multilayer adsorption and capillary condensation within narrow pores. BJH analysis further revealed that the materials exhibit mesoporous characteristics, with pore diameters below 5 nm (Fig. 1d). The composites displayed larger pore volumes compared to the individual bulk counterparts. Notably, BO exhibited a relatively low surface area, whereas the incorporation of RB substantially enhanced the surface area in the composites, thereby promoting more effective adsorption.
Table 1 BET analysis results including specific area, mean pore diameter, and mean pore volume
| Catalyst |
Specific area (m2 g−1) |
Mean pore diameter (nm) |
Mean pore volume (cm3 g−1) |
| BO |
2.60 |
6.9 |
0.00446 |
| RB |
39.6 |
18.2 |
0.1807 |
| BR11 |
17.6 |
13.8 |
0.0605 |
| BR13 |
30.1 |
7.5 |
0.0866 |
| BR31 |
8.64 |
14.3 |
0.0310 |
3.1.4. UV-Vis DRS analysis.
The light-harvesting ability and band gap energies of the photocatalysts were examined through UV-Vis DRS measurements (Fig. 2a). The absorption edge of BO was observed in the wavelength range of 270–305 nm. The optical band gaps of the samples were determined using Tauc's relationship eqn (1):where α denotes the absorption coefficient, h is Planck's constant, ν represents the frequency of incident light, and Eg corresponds to the optical band gap energy. The calculated band gap values for BO, RB, BR11, BR13, and BR31 were 3.46, 3.13, 2.24, 2.00, and 2.13, respectively (Fig. 2b). The positions of the valence band and conduction band of BO were further estimated using the following relationships:| | | E(Valenceband) = X – Ee + 0.5Eg | (2) |
| | | E(Conductionband) = EVB − Eg | (3) |
Here, E(Valenceband) and E(Conductionband) denote the valence band and conduction band energies, respectively, X is the absolute electronegativity of the semiconductor, and Ee is the reference energy of free electrons on the hydrogen scale, taken as 4.5 eV.42 Using these relationships, the E(Valenceband) and E(Conductionband) values of BO were calculated to be 3.58 eV and 0.12 eV, respectively. RB exhibited broad absorption across the entire visible region due to its amorphous carbon structure with conjugated π-electron systems, which endows it with light-harvesting ability and electron conductivity. The reduced band gap of the BR13 composites facilitates improved absorption in the visible spectrum, enabling more efficient utilization of solar light.
 |
| | Fig. 2 (a) UV-vis DRS absorbance spectra, and (b) Tauc plot showing band gap energies of BO, RB, BR11, BR13, and BR31. | |
3.1.5. XPS analysis.
X-ray photoelectron spectroscopy (XPS) was performed to investigate the elemental composition, chemical states, and surface electronic environment of BR13. The survey spectra confirmed the presence of Bi, C, N, O, and Cl (Fig. 3a). The C 1s spectra displayed multiple chemical environments at 284.2 eV and 285.2 eV, attributed to graphitic sp2 carbon and C–O bonding, respectively (Fig. 3b). The N 1s spectrum also showed distinct features at 398.59 eV, 398.95 eV, and 400.58 eV (Fig. 3c). In the Bi 4f region, multiple peaks were observed at 159.5 eV and 164.7 eV corresponding to Bi 4f7/2 and Bi 4f5/2, characteristic of Bi3+ in BO (Fig. 3d). In the O 1s region, the composite showed contributions from Bi–O bonds and surface hydroxyls by peaks appearing at 530.90 eV (Bi–O bonds) and 532.92 eV (oxygen vacancies and surface hydroxyl groups) (Fig. 3e). The Cl 2p spectra confirmed the presence of chloride ions, with characteristic doublets at 198 eV and 199.5 eV which were assigned to Cl 2p3/2 and Cl 2p1/2 of Cl− ions bonded within the BO lattice (Fig. 3f). Altogether, these XPS results verify the coexistence of Bi3+, and carbon, nitrogen species, Bi–O bonding, hydroxyl groups, and chloride ions, confirming the successful formation and chemical composition of the composites.19,36,43 Such interactions not only stabilize the BO nanostructures on the RB surface but also promote efficient electron transfer pathways.
 |
| | Fig. 3 XPS analysis of BR13 showing (a) a wide survey spectrum corresponding to (b) C 1s, (c) N 1s, (d) Bi 4f, (e) O 1s, and (f) Cl 2p regions. | |
3.1.6. Morphological characterization.
FESEM analysis was employed to gain insights into the morphological characteristics. Representative FESEM micrographs of BO, RB, and BR13 are shown in Fig. 4(a–c). The FESEM analysis of the BO component reveals that it forms rectangular nanoplates, showcasing a well-defined, angular morphology. In contrast, RB exhibited a fibrous morphology with a porous texture. In the nanocomposite BR13, RB was found to interact with BO sheets due to its fibrous framework, while the BO nanoplates were distinctly visible within the composite. These observations confirm the coexistence of BO and RB, indicating the successful fabrication of heterojunction structures. The elemental makeup of BR13 was further confirmed through energy-dispersive X-ray spectroscopy (EDS) analysis. EDS spectra confirmed the presence of C, N, Bi, O, Cl, and Si, while elemental coloured mapping demonstrated uniform spatial distribution of these elements, supporting the improved photocatalytic performance of the composite (Fig. 4(d–j)).
 |
| | Fig. 4 FESEM images of (a) BO, (b) RB, (c) BR13, (d) EDS mapping, (e)–(j) colour mapping of all the elements present, (k) and (l) HRTEM images of BR13 at different magnifications and (m) calculated lattice fringes of BR13. | |
Furthermore, High-Resolution Transmission Electron Microscopy (HR-TEM) analysis revealed detailed structural features, confirming the formation of a porous, sheet-like morphology in Fig. 4(k and l). Fig. 4(m) displays aggregated nanoparticles, and high-resolution imaging revealed distinct lattice fringes corresponding to the (102) and (002) planes. The measured d-spacings were 0.266 nm for BO (2θ = 33.61°) and 0.250 nm for RB (2θ = 21.48°), confirming the crystalline nature of the respective components within the composite. The interplanar spacing observed from HRTEM lattice fringes is in good agreement with the corresponding planes identified in the XRD analysis. Overall, FESEM-EDS and HRTEM analyses validate the successful formation of the BR13 composite with uniform distribution, strong interfacial contact, and a porous heterojunction structure that is highly beneficial for photocatalytic applications. Particle size analysis was carried out using ImageJ software based on FESEM micrographs. The analysis was performed by measuring the diameters of randomly selected particles to ensure statistical reliability. The resulting particle size distribution histogram indicates a narrow size distribution, with an average particle size of approximately 34.04 nm, confirming the uniform morphology of the synthesized material. The nanoscale dimensions observed are in good agreement with the structural features evident from the HRTEM analysis (35.45 nm), confirming consistency between morphological and high-resolution structural characterization (Fig. S1).
3.1.7. Photoluminescence (PL) analysis.
PL spectroscopy was employed to investigate the charge carrier recombination behavior in the synthesized samples.44 Pristine BO exhibited a strong and sharp emission peak, signifying a high rate of recombination between photogenerated electron–hole pairs. Such high recombination severely limits its photocatalytic performance. In contrast, RB displayed a very weak PL signal due to its amorphous carbon nature, which acts as an electron reservoir and does not significantly contribute to radiative recombination. Notably, the BR composites demonstrated a markedly reduced PL intensity compared with pristine BO and RB, whereas BR13 showed the lowest PL intensity, signifying the effective suppression of charge carrier recombination at the heterojunction interface. The decrease in PL intensity can be ascribed to the efficient transfer of photoexcited electrons from BO to the conductive carbon matrix of RB, where they are stabilized and participate in subsequent redox reactions. This charge separation mechanism is further supported by the oxygenated functional groups present on RB, which act as anchoring sites and promote interfacial electron migration (Fig. 6a). The suppressed PL emission intensity of the composites directly correlates with their enhanced photocatalytic activity, confirming that the synergistic interaction between BO nanosheets and RB facilitates charge separation, prolongs carrier lifetimes, and thereby improves the efficiency of pollutant degradation under light irradiation.
3.2. Photocatalytic activity
The photocatalytic performance of BR13 was assessed through the degradation of MB dye. For each experiment, a 10 mL MB solution (10 ppm) was used with a catalyst dosage of 0.2 g L−1. To attain adsorption–desorption equilibrium, the mixture was stirred in the dark for 120 minutes before exposure to light. Subsequently, the photocatalytic reactions were carried out under natural sunlight in August 2025 on clear, sunny days within a fixed time window for a duration of 100 min. To further study the effect of light irradiation, an artificial illumination test was performed using a 45 W Philips lamp (radiant flux ≈100 W m−2), positioned 10 cm above the reaction mixture. A control experiment was also conducted under dark conditions for 120 min and was performed while maintaining identical experimental parameters.
Each experiment was conducted in triplicate, and the resulting data are represented with error bars showing approximately ±5% variation. The degradation of MB was monitored by recording its absorbance at 659 nm using a UV-visible spectrophotometer as shown in Fig. S2, the characteristic absorption peak of MB gradually decreased with increasing irradiation time, indicating effective degradation of the dye molecules rather than mere adsorption, and the degradation efficiency (%D) was computed using the following eqn (4).
| |  | (4) |
where
A0 represents the initial absorbance of the MB solution before irradiation, and
Af denotes the final concentration after the degradation process.
To evaluate the performance of the synthesized nanocomposite, a comparative study was performed against TiO2 (P25, a commercial photocatalyst), BO, RB, BR11, BR13, and BR31 (Fig. 5(a) and (b)). In contrast, only a very small extent of degradation was observed in the absence of the photocatalyst, confirming that the process was predominantly photocatalytic in nature (Fig. 5(c) and (d)). The apparent rate constant (k) for the photocatalytic degradation process was determined using the following eqn (5).
| |  | (5) |
Here,
A0 represents the initial concentration of dye,
A is the concentration at a given time
t, and
k denotes the apparent rate constant of the reaction. Based on the plots in
Fig. 6(b), the degradation process was observed to follow pseudo-first-order kinetics. The BR13 composite exhibited the highest efficiency, with a rate constant of 0.01761 min
−1, which is considerably greater than that of bare BO (0.00425 min
−1), RB (0.01032 min
−1), BR11 (0.00907 min
−1), and BR31 (0.00681 min
−1). To further understand the cooperative effect among the composite components, the synergy factor (
R) was calculated using
eqn (6).
| |  | (6) |
 |
| | Fig. 5 (a) and (b) Kinetic examination of the different fabricated catalysts for the remediation of MB. (c) and (d) Kinetic analysis of the degradation of MB with and without a catalyst. | |
 |
| | Fig. 6 (a) Photoluminescence (PL) spectra, (b) changes in degradation of MB under different light intensities, (c) effect of catalyst loading towards MB, (d) effect of pH on MB removal, (e) pzc studies, and (f) scavenger studies. | |
In this context, KBO+RB, KBO, and KRB represent the photodegradation rate constants of the BR composites, pristine BO, and pristine RB, respectively. The calculated synergy factors for BR11, BR13, and BR31 were 0.6225, 1.2086, and 0.4674, which revealed that BR13 exhibited the highest value, indicating the strongest interfacial interaction between its components. This enhanced synergy explains its superior photocatalytic efficiency and the highest observed rate constant among all the prepared nanocomposites (Table 2).
Table 2 MB degradation synergy factors (R) and rate constants (k)
| Material |
Rate constant (min−1) |
Synergy factor (R) |
| TiO2-P25 |
0.00922 |
— |
| BO |
0.00425 |
— |
| RB |
0.01032 |
— |
| BR11 |
0.00907 |
0.6225 |
| BR13 |
0.01761 |
1.2086 |
| BR31 |
0.00681 |
0.4674 |
3.2.1. Effect of light sources.
Comparative photocatalytic tests were performed under UV, visible, and natural sunlight to evaluate pollutant degradation. As illustrated in Fig. 6b, the BR13 (0.1 g L−1) heterojunction photocatalyst achieved 48% degradation under UV light and 54% under visible light, and a maximum of 89% under sunlight. These findings demonstrate that sunlight provides the most effective conditions for pollutant breakdown using this photocatalyst, confirming its superior performance.
3.2.2. Impact of the catalyst dose.
The influence of catalyst dosage on photocatalytic performance was investigated by varying the concentration from 0.1 to 0.6 g L−1 under sunlight. The degradation efficiency increased steadily with catalyst loading up to 0.2 g L−1, beyond which it reached a plateau (Fig. 6c). This saturation effect was attributed to the reduced transparency of the dye solution, which hindered light penetration and partially blocked the active sites of the photocatalyst. Additionally, the deactivation of active sites may also limit photocatalytic activity at elevated concentrations. Thus, 0.2 g L−1 was determined as the most effective catalyst dosage for subsequent studies.
3.2.3. Impact of pH.
pH strongly governs photocatalytic degradation by influencing catalyst surface charge and dye–catalyst interactions. The point of zero charge (PZC) of the photocatalyst was found to be 7.8 (Fig. 6e). At pH values below this point, the catalyst surface carries a positive charge, whereas at pH values above 7, it becomes negatively charged. Since methylene blue (MB) is a cationic dye, electrostatic repulsion occurs under acidic conditions (pH < 7), resulting in reduced adsorption and degradation efficiency. In contrast, under neutral to alkaline conditions (pH ≥ 7), the negatively charged catalyst surface strongly attracts the positively charged MB molecules, enhancing adsorption and accelerating photocatalytic degradation. As shown in Fig. 6d, degradation efficiency increased significantly under alkaline conditions, achieving up to 99.71% removal efficiency above pH 7, confirming that the photocatalyst exhibits optimal performance in basic media for MB wastewater treatment. Consequently, maximum removal efficiency is achieved in basic media, highlighting the catalyst's suitability for MB wastewater treatment.
3.2.4. Effect of scavengers on photocatalytic activity.
The photocatalytic mechanism was further investigated by performing scavenger experiments to identify the primary reactive species involved in the degradation process. Different radical scavengers were introduced into the reaction system: isopropanol (IPA) for hydroxyl radicals (˙OH), benzoquinone (BQ) for superoxide radicals (˙O2−), methanol (MeOH) for holes (h+), and dimethyl sulfoxide (DMSO) for electrons (e−).7 The interaction of O2˙− with BQ results in the formation of hydroquinone, confirming the role of superoxide radicals. The strong inhibition observed in the presence of DMSO indicates the pivotal involvement of hydroxyl radicals, as DMSO readily undergoes electron transfer via its unpaired oxygen electrons and forms hydrogen bonds with ˙OH radicals. As depicted in Fig. 6f, the addition of methanol and IPA significantly reduced the degradation efficiency, demonstrating that photogenerated holes and hydroxyl radicals are the primary reactive species responsible for the photocatalytic degradation, while the contributions of other species are comparatively minor.
3.2.5. Proposed photocatalytic mechanism.
Upon sunlight irradiation, e− in the CB of BO can migrate back to its VB, and similarly, e− from the CB of RB can also move to its own VB. This process leads to an interfacial recombination where e− in the VB of BO recombine with h+ in the CB of RB. Such recombination at the interface helps reduce charge carrier recombination elsewhere, enhancing overall photocatalytic efficiency (Scheme 2). When holes and hydroxyl radicals are the primary reactive species in degradation, the process involves these charge carriers oxidizing pollutants through the following key reactions (7)–(13):| | | ˙O2− + H2O → HOO˙ + OH˙ | (10) |
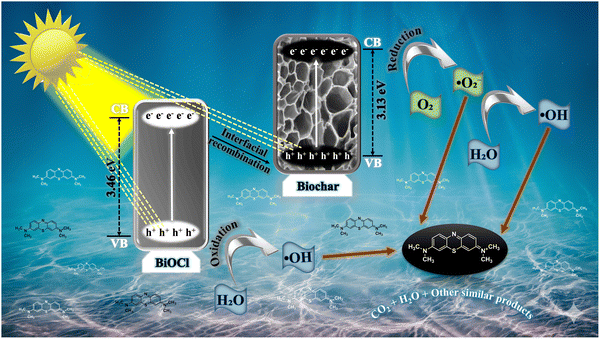 |
| | Scheme 2 Proposed mechanism illustrating the photocatalytic degradation pathway of MB over the BR13 composite under light irradiation. | |
This mechanism highlights the crucial role of interfacial charge transfer and recombination dynamics in generating active oxidative species, leading to efficient photocatalytic degradation.
3.3.6. Reusability study.
The long-term stability and recyclability of a photocatalyst are essential parameters for its practical application in wastewater treatment. To assess the reusability of the BR13 composite, cyclic photocatalytic degradation experiments were conducted using MB under natural sunlight. After each cycle, the catalyst was separated from the reaction mixture by centrifugation, thoroughly washed with distilled water and ethanol to remove any residual dye or intermediate products, and then dried at 60 °C before reuse. As shown in Fig. 7(a), the degradation efficiency remained close to 92% even after five consecutive cycles, demonstrating excellent reusability. The observed decline in activity, from 99% to 92%, can be ascribed to minor catalyst loss during recovery and the surface accumulation of undegraded intermediates, which may partially block the pores and active sites. Moreover, the structural stability of the reused BR13 photocatalyst was validated by X-ray diffraction analysis after five cycles (Fig. 7e), where the diffraction peaks retained their positions and intensities without the emergence of any new peaks, confirming the preservation of its crystalline framework. Furthermore, BET surface analysis (Fig. 7c) revealed a pore volume of 0.1059 cm3 g−1, a specific area of 25.992 m2 g−1, and a mean pore diameter of 16.296 nm for the recycled photocatalyst. Although a slight reduction in surface area was observed, it remained sufficient for effective photocatalytic activity. FESEM micrographs (Fig. 7d), EDS, and colour mapping further confirmed that the morphology and the distribution of elements of the composite remained unchanged after repeated use. These findings highlight that the BR13 photocatalyst exhibits remarkable durability, structural integrity, and strong reusability, establishing it as a suitable composite for long-term photocatalytic environmental remediation application.
 |
| | Fig. 7 (a) Cyclic degradation performance of BR13 demonstrating excellent recyclability, (b) comparative TOC and COD analyses, and (c) BET surface area analysis with the inset showing the Barrett–Joyner–Halenda pore size distribution curve of the BR13 photocatalyst after degradation activity, (d) FESEM images and EDS elemental colour mapping of the BR13 photocatalyst after degradation studies, and (e) XRD analysis after five cycles. | |
3.2.7. Mineralization studies.
To evaluate the extent of complete degradation of methylene blue (MB) and confirm its conversion into non-toxic end products, total organic carbon (TOC) and chemical oxygen demand (COD) analyses were performed after photocatalytic treatment. After 100 minutes of sunlight irradiation, TOC and COD removal efficiencies for MB were recorded as 55% and 62%, respectively. As illustrated in Fig. 7(b), the solution underwent progressive mineralization, although the persistence of intermediate species with low mineralization potential was evident. The presence of these partially oxidized organic compounds before the complete conversion of MB into CO2, H2O and other byproducts accounts for the lower TOC and COD reduction compared to the overall degradation rate.
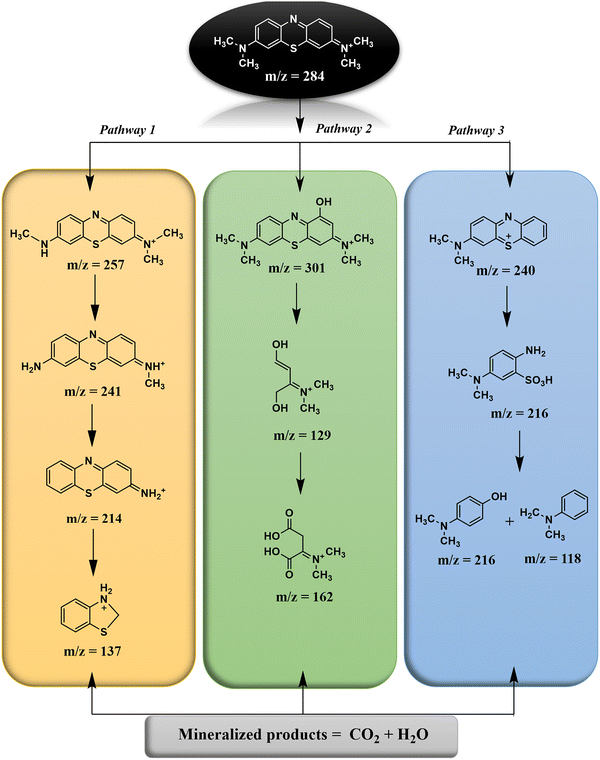
3.2.8. Probable degradation pathway of MB.
High-resolution mass spectrometry (HRMS) analysis was performed to identify the intermediate and final degradation products formed during the photocatalytic oxidation of methylene blue (MB). The corresponding HRMS spectra are presented in Fig. S3. Multiple intermediate peaks with varying m/z values confirmed the stepwise decomposition of MB molecules. Based on the detected fragments and their molecular ion peaks, three predominant degradation pathways were proposed, as illustrated in Scheme 3.
 |
| | Scheme 3 Proposed degradation pathway of MB. | |
Pathway I: the degradation of methylene blue (m/z = 284) begins with stepwise demethylation of the molecule. Initially, a methyl group (–CH3) is removed, yielding a product at m/z = 257 and 241, corresponding to the gradual removal of methyl groups from the nitrogen atoms. Further demethylation or reduction transforms the molecule into amine-containing intermediates at m/z = 214, where additional hydrogen or methyl substitutions generate amino-functionalized species. The pathway then progresses through cleavage of the central aromatic ring or heterocyclic structure, producing a smaller intermediate at m/z = 138, identified as protonated phenyl thiophene. Finally, complete mineralization of this intermediate occurs, resulting in the formation of inorganic end products such as CO2 and H2O.45
Pathway II: the first step involves hydroxylation, introducing an –OH group into the structure, which increases its mass to m/z = 301. Subsequent oxidative cleavage of the aromatic rings generates smaller intermediates. One of these is a molecule with m/z = 129, which is a partially degraded and functionalized fragment of the original structure, likely containing hydroxyl and amino functionalities. Further oxidation leads to an intermediate at m/z = 162, containing carboxyl and hydroxyl groups. Finally, complete mineralization occurs, breaking the molecule down into CO2 and H2O, representing the total degradation of methylene blue into inorganic end products.46
Pathway III: pathway 3 of the degradation process begins with the cleavage of the –N(CH3)2 group from the parent molecule, resulting in the formation of a product m/z of 240. Subsequently, oxidation of the sulfhydryl (C–S or CS) groups occurs, which transforms into a fragment (m/z = 216). Further degradation takes place through desulfurization, oxidation, and deamination, producing additional fragments at m/z = 137 and m/z = 118. Overall, Pathway 3 involves sequential demethylation, ring cleavage, oxidation of sulfur-containing groups, and stepwise removal of functional groups, ultimately yielding a series of smaller, oxidized products detectable by their characteristic m/z values.47
Comparison from the literature.
To further evaluate the performance of the synthesized photocatalyst, a comparative analysis was conducted with previously reported photocatalysts. Table 3 summarizes the degradation efficiencies, and operational conditions of various photocatalytic systems reported in the literature, highlighting the superior activity and sunlight-driven performance of the present BR13 nanocomposite toward MB degradation.
Table 3 Comparison of different photocatalysts used for the degradation of MB
| Photocatalyst |
Pollutant decomposed |
Catalyst dose (g L−1) |
Illuminating source |
Time (min) |
% Degradation |
Ref. |
| rGO/NiOx/Ag |
Methylene blue |
0.5 |
Sunlight |
90 |
91 |
48
|
| TiO2/CNTs |
Methylene blue |
0.2 |
Visible |
180 |
85 |
49
|
| RGO/CDs (RC) |
Methylene blue |
0.1 |
Visible |
135 |
87 |
50
|
| NiO/g-G3N4 |
Methylene blue |
0.1 |
Sunlight |
180 |
91 |
51
|
| FeWO4@N-TiO2 |
Methylene blue |
0.2 |
Visible light |
120 |
77 |
52
|
| CuS/ZnS |
Methylene blue |
0.6 |
Visible light |
85 |
90 |
53
|
| Bi2CrO6/CuO |
Methylene blue |
— |
Visible light |
120 |
90.06 |
54
|
| α-Fe2O3/ZnO |
Methylene blue |
1.0 |
UV light |
105 |
85 |
55
|
| BiOCl/rice husk biochar (1:3) |
Methylene blue |
0.2 |
Sunlight |
100 |
99 |
Present work |
4. Conclusion
In this work, a novel BiOCl/rice husk biochar (BR13) heterojunction photocatalyst was successfully developed through an in-situ synthesis approach aimed at the efficient degradation of methylene blue (MB) dye from aqueous media. Extensive physicochemical characterization, including XRD, FTIR, BET, FESEM-EDS, HRTEM, XPS, UV-DRS, and PL analyses, confirmed the uniform integration of biochar within the BiOCl framework, resulting in a stable composite with superior crystallinity, enhanced light-harvesting capability, and significantly increased specific surface area. Under solar irradiation, the optimized BR13 composite achieved nearly complete degradation (∼99%) of a 10 ppm MB solution within 100 minutes, following pseudo-first-order kinetics with a rate constant of 0.01761 min−1. This performance was 1.7 and 4.1 times higher than that of pristine RB and BO, respectively, and almost twice that of commercial TiO2-P25, clearly demonstrating the synergistic enhancement and high photocatalytic activity. Systematic optimization of operational parameters, including catalyst dosage, pH, illumination conditions, and scavenger tests, revealed that photogenerated holes and hydroxyl radicals play dominant roles in the degradation mechanism. Furthermore, BR13 exhibited outstanding recyclability and structural durability, maintaining over 92% of its initial degradation efficiency after five successive cycles, as confirmed by post-reaction XRD analyses. Mineralization studies showed substantial TOC and COD reductions of 55% and 62%, respectively, indicating effective conversion of MB into environmentally benign products. HRMS analysis provided additional mechanistic insights by identifying intermediate species and outlining the stepwise degradation pathway. Overall, this study establishes BR13 as a robust, solar-active photocatalyst with scalable synthesis, strong structural integrity, and remarkable reusability, making it a highly promising candidate for practical wastewater remediation and broader applications in sustainable environmental purification technologies. Despite these advantages, the photocatalytic performance may be influenced by fluctuations in natural sunlight intensity, and complete mineralization is not achieved, indicating scope for further optimization toward real wastewater applications.
Author contributions
Loveneet Kaur: designed and performed the experiments, analysed data and co-wrote the paper. Palkaran Sethi: supervised the research, designed experiments and co-wrote the paper. Soumen Basu: supervised the research and co-wrote the paper.
Conflicts of interest
The authors declare that there are no conflicts of interest, financial or personal, that could have influenced the research presented in this paper.
Data availability
All data supporting the findings of this study are available within the article and detailed list of materials used and characterisation techniques are listed in its supplementary information (SI). It also includes particle size distribution curve, UV visible spectra of methylene blue during different time intervals, and HRMS spectra for degradation pathway. See DOI: https://doi.org/10.1039/d5ma01310k.
Additional raw data, including characterization spectra (FESEM, EDS, FTIR, XPS, XRD, HRTEM, UV-DRS, PL, and BET) and photocatalytic degradation datasets, are available from the corresponding author upon reasonable request.
Acknowledgements
We sincerely acknowledge DCBC and DPMS, TIET, for providing the necessary infrastructure for the characterization studies. The Department of Chemical Engineering is gratefully recognized for making their UV-visible spectrophotometer available. Special thanks are extended to SAIF and CIL, Punjab University for the HR-TEM and XPS analysis and the Institute of Nano Science and Technology, Mohali, for providing FESEM-EDS facilities.
References
- J. N. Maduelosi and M. U. Ezuluofor, Br. J. Multidiscip. Adv. Stud., 2023, 4, 1–8 CrossRef.
- A. Tariq and A. Mushtaq, Int. J. Chem. Biochem. Sci., 2023, 23, 121–143 Search PubMed.
- O. Cardoso, J.-M. Porcher and W. Sanchez, Chemosphere, 2014, 115, 20–30 CrossRef CAS PubMed.
-
S. Thakur, A. Chandra, V. Kumar and S. Bharti, in Biotechnology for Environmental Sustainability, ed. P. Verma, Springer Nature Singapore, Singapore, 2025, pp. 55–100 Search PubMed.
- S. Khan, T. Noor, N. Iqbal and L. Yaqoob, ACS Omega, 2024, 9, 21751–21767 CrossRef CAS PubMed.
-
R. B. Chavan, Health and Environmental Hazards of Synthetic Dyes, 2013 Search PubMed.
- P. Sethi, S. Basu and S. Barman, New J. Chem., 2025, 49, 8454–8471 RSC.
- H. Bansal, P. Sethi and S. Basu, Mater. Adv., 2025, 6(20), 7585–7598 RSC.
- P. V. Nidheesh, C. Couras, A. V. Karim and H. Nadais, Chem. Eng. Commun., 2022, 209, 390–432 CrossRef CAS.
- S. K. Ramachandran and P. Sathishkumar, Curr. Opin. Environ. Sci. Health, 2023, 36, 100513 CrossRef.
- K. Masula, P. Sreedhar, P. Vijay Kumar, Y. Bhongiri, S. Pola and M. Basude, Mater. Sci. Semicond. Process., 2023, 160, 107432 CrossRef CAS.
- K. Kaur, R. Gade, R. Mitty, V. S. (Narayanabhatla) Puli, S. Pola and N. B. Simhachalam, Surf. Interfaces, 2025, 72, 107254 CrossRef CAS.
- B. Garg, P. Hait and S. Basu, J. Environ. Manage., 2024, 370, 122403 CrossRef CAS PubMed.
- C. Maggu, S. Singla and S. Basu, J. Environ. Manage., 2024, 349, 119424 CrossRef CAS.
- M. Subburu, R. Gade, V. Guguloth, P. Chetti, K. R. Ravulapelly and S. Pola, J. Photochem. Photobiol., A, 2021, 406, 112996 CrossRef CAS.
- R. Vallavoju, R. Kore, R. P, M. Subburu, M. Basude, P. Chetti and S. Pola, J. Photochem. Photobiol., A, 2023, 442, 114775 CrossRef CAS.
- M. Kordi, N. Farrokhi, M. I. Pech-Canul and A. Ahmadikhah, Rice Sci., 2024, 31, 14–32 CrossRef.
- Q. Liang, D. Pan and X. Zhang, Chem. Eng. J., 2023, 453, 139441 CrossRef CAS.
- R. Nandi, M. K. Jha, S. K. Guchhait, D. Sutradhar and S. Yadav, ACS Omega, 2023, 8, 4802–4812 CrossRef CAS PubMed.
- P. Agale, V. Salve, S. Mardikar, S. Patange and P. More, Appl. Surf. Sci., 2024, 672, 160795 CrossRef CAS.
- P. More, V. Inamdar, S. Suresh, S. Dindorkar, S. Peddakolmi, K. Jain, N. Khona, S. Khatoon and S. Patange, J. Mater. Sci.: Mater. Electron., 2021, 32, 20725–20741 CrossRef CAS.
- K. Jangam, K. Patil, S. Balgude, S. Patange and P. More, RSC Adv., 2020, 10, 42766–42776 RSC.
- V. C. Pujari, P. D. Mhase, S. D. Balgude, S. S. Jadhav, S. J. Gilani, P. S. More, S. E. Shirsath, S. F. Shaikh and S. M. Patange, Ceram. Int., 2025, 51, 39866–39885 CrossRef CAS.
- K. Jangam, S. Balgude, H. Pawar, S. Patange and P. More, Surf. Interfaces, 2022, 33, 102189 CrossRef CAS.
- E. Asgari, A. Esrafili, A. J. Jafari, R. R. Kalantary and M. Farzadkia, Desalin. Water Treat, 2019, 161, 228–242 CrossRef CAS.
- A. Al Miad, S. P. Saikat, M. K. Alam, M. S. Hossain, N. M. Bahadur and S. Ahmed, Nanoscale Adv., 2024, 6(19), 4781–4803 RSC.
- P. Sethi, S. Barman and S. Basu, ACS Sustainable Resour. Manage., 2026, 3(1), 244–259 CrossRef CAS.
- A. S. Eltaweil, A. M. Abdelfatah, M. Hosny and M. Fawzy, ACS Omega, 2022, 7, 8046–8059 CrossRef CAS PubMed.
- F. Yu, F. Tian, H. Zou, Z. Ye, C. Peng, J. Huang, Y. Zheng, Y. Zhang, Y. Yang, X. Wei and B. Gao, J. Hazard. Mater., 2021, 415, 125511 CrossRef CAS PubMed.
- J. Sun, X. Lin, J. Xie, Y. Zhang, Q. Wang and Z. Ying, Colloids Surf., A, 2020, 606, 125556 CrossRef CAS.
- P. Eswaran, P. D. Madasamy, K. Pillay and H. Brink, Biomass Convers. Biorefin., 2025, 15, 12347–12367 CrossRef CAS.
- K. Sharma, S. Sonu, A. Sudhaik, T. Ahamad, S. Kaya, S. Thakur, Q. Van Le, V.-H. Nguyen, A. Singh, L. H. Nguyen, P. Singh and P. Raizada, J. Water Process Eng., 2024, 66, 105918 CrossRef.
- D. O. Adenuga, S. M. Tichapondwa and E. M. N. Chirwa, J. Photochem. Photobiol., A, 2020, 401, 112747 CrossRef CAS.
- S. Dong, Y. Pi, Q. Li, L. Hu, Y. Li, X. Han, J. Wang and J. Sun, J. Alloys Compd., 2016, 663, 1–9 CrossRef CAS.
- L. He, X. Wang and D. Hong, Langmuir, 2025, 41, 21471–21482 CrossRef CAS PubMed.
- P. Hait, R. Mehta and S. Basu, J. Clean Prod., 2023, 424, 138851 CrossRef CAS.
- M. Guan, C. Xiao, J. Zhang, S. Fan, R. An, Q. Cheng, J. Xie, M. Zhou, B. Ye and Y. Xie, J. Am. Chem. Soc., 2013, 135, 10411–10417 CrossRef CAS PubMed.
- S. Aziz, B. Uzair, M. I. Ali, S. Anbreen, F. Umber, M. Khalid, A. A. A. Aljabali, Y. Mishra, V. Mishra, Á. Serrano-Aroca, G. A. Naikoo, M. El-Tanani, S. Haque, A. G. Almutary and M. M. Tambuwala, Environ. Res., 2023, 238, 116909 CrossRef CAS PubMed.
- W. Tang, Y. Zhang, H. Guo and Y. Liu, RSC Adv., 2019, 9, 14060–14071 RSC.
- A. Kundu, S. Sharma and S. Basu, J. Phys. Chem. Solids, 2021, 154, 110064 CrossRef CAS.
- P. T. Le, D. N. Le, T. H. Nguyen, H. T. Bui, L.
A. Pham, L. L. Nguyen, Q. S. Nguyen, T. P. Nguyen, T. H. Dang, T. T. Duong, M. Herrmann, S. Ouillon, T. P. Q. Le, D. L. Vo, H. Mai and T. M. T. Dinh, Water, 2021, 13(23), 3326 CrossRef CAS.
- D. Monga and S. Basu, RSC Adv., 2021, 11, 22585–22597 RSC.
- K. Jasuja and R. K. Das, Mater. Adv., 2025, 6, 3957–3968 RSC.
- A. A. B. Baloch, F. H. Alharbi, G. Grancini, M. I. Hossain, Md. K. Nazeeruddin and N. Tabet, J. Phys. Chem. C, 2018, 122, 26805–26815 CrossRef CAS.
- L. O. de, B. Benetoli, B. M. Cadorin, V. Z. Baldissarelli, R. Geremias, I. G. de Souza and N. A. Debacher, J. Hazard. Mater., 2012, 237–238, 55–62 Search PubMed.
- H. W. P. Carvalho, A. P. L. Batista, P. Hammer and T. C. Ramalho, J. Hazard. Mater., 2010, 184, 273–280 CrossRef CAS PubMed.
- Y. Sun, S. Tu, Y. Li, X. Sui, S. Geng, H. Wang, X. Duan and L. Chang, Colloids Surf., A, 2024, 690, 133861 CrossRef CAS.
- D. Singh, K. M. Batoo, S. Hussain, A. Kumar, Q. H. Aziz, F. S. Sheri, H. Tariq and P. Singh, RSC Adv., 2024, 14, 2429–2438 RSC.
- P. Akhter, F. Ali, A. Ali and M. Hussain, Diamond Relat. Mater., 2024, 141, 110702 CrossRef CAS.
- H. S. Shahraki, R. Bushra, N. Shakeel, A. Ahmad, Quratulen, M. Ahmad and C. Ritzoulis, J. Bioresour. Bioprod., 2023, 8, 162–175 CAS.
- M. A. Ahmed, M. A. Ahmed and A. A. Mohamed, Opt. Mater., 2024, 151, 115339 CrossRef CAS.
- A. K. Chakraborty, S. Akter, S. Ganguli, M. A. Haque, A. S. M. Nur and M. A. Sabur, Environ. Technol. Innovation, 2024, 33, 103536 CrossRef CAS.
- J. Yadav, S. Tripathi, S. P. Singh, P. Dwivedi, R. K. Rawat and P. Chauhan, Chem. Inorg. Mater., 2025, 7, 100113 CAS.
- V. Elyasi, Y. Shaveisi and S. Sharifnia, Mater. Chem. Phys., 2025, 329, 130118 CrossRef CAS.
- Sonia, H. Kumari, Monica, S. Sharma, Reenu, R. Kumar, Suman, S. Chahal, S. Kumar, P. Kumar and A. Kumar, J. Electron. Mater., 2024, 53, 5990–6002 CrossRef CAS.
Footnote |
| † Both authors contributed equally. |
|
| This journal is © The Royal Society of Chemistry 2026 |
Click here to see how this site uses Cookies. View our privacy policy here. 
 Open Access Article
 This Open Access Article is licensed under a
  *
*


