The effect of Bisphenol A vs. Bisphenol F on the performance of polysulfone membranes
Received
24th September 2025
, Accepted 8th December 2025
First published on 8th December 2025
Abstract
Microfiltration is widely used in water filtration to remove large particles, suspended solids, and bacteria. This study examines polysulfone membranes fabricated via nonsolvent-induced phase separation (NIPS) using Bisphenol A (pBPA) and Bisphenol F (pBPF) at 20 and 40 kDa molecular weights. The relationship between water permeance and the viscosity of polymer solutions used for membrane fabrication is explored through solution rheology and permeability tests. Thermal properties, analyzed by thermogravimetric analysis (TGA) and differential scanning calorimetry (DSC), confirmed high stability for both polymers, with degradation temperatures above 450 °C and glass transition temperatures between 160–190 °C; pBPF undergoes a two-step degradation process. The Young's modulus increases with molecular weight and polymer casting solution concentration, as indicated by stress–strain curves, with similar trends in strength across membranes cast at similar concentrations. Deionized (DI) water permeance decreases logarithmically with membrane thickness, polymer concentration in the membrane solution, and viscosity. Across all polymers at equivalent casting concentrations, comparable DI water permeance is observed. Organic solvent permeation studies (ethanol, 1-butanol, ethylene glycol, and 1,4-butanediol) revealed viscosity was the dominant factor controlling transport. The sharp decrease in the distance between Hansen's solubility parameters (Ra) from water (∼44) to organic solvents (16–23) predicted the onset of substantial swelling, though the narrow range among organic solvents produced minimal variation in swelling. These findings provided insights into the various ways processing conditions can influence the properties and potential utility of polysulfone membranes for microfiltration processes.
Introduction
Polysulfone membranes are widely used in various filtration applications, due to their excellent thermal stability, mechanical strength, and chemical resistance. These properties make them particularly suitable for processes such as microfiltration, ultrafiltration, and pervaporation.1–3 Their high glass transition temperature (∼165–190 °C)4 enables operation at elevated temperatures, while their resistance to acids and bases allows for their use in harsh chemical environments, such as wastewater treatment5–7 and protein separation.8 Polysulfones offer versatility in membrane design, with their performance being influenced by factors such as molecular weight,9 polymer loading of the membrane solution,10,11 processing conditions, such as solution composition,12,13 and operating conditions, such as pressure.13,14 In particular, the ability to control these parameters allows for tailoring membrane properties to meet the demands of filtration processes.15–19
The field of membrane science has witnessed extensive development in recent years, with researchers exploring diverse strategies to enhance separation performance. Significant advances have been made in removing pollutants from water, including the development of photocatalytic sponges,20 activated clay and bauxite-laden membranes,21 metal–organic frameworks,22 bio-based electrospun polyamide membranes,23 branched polyaramides,24 and hypercrosslinked polymers.25 Beyond water treatment applications, innovative approaches to controlling porous structures have emerged, including the use of poly(ionic liquids) and polyacrylic acid for gradient porous membranes,26 and emulsion-templated macroporous polyesters.27 These developments demonstrate the breadth of current membrane research and the ongoing push toward more efficient, sustainable, and application-specific separation technologies. Within the polysulfone membrane space specifically, researchers have explored numerous modification strategies to enhance performance. Studies have investigated various morphologies including hollow fibers28 and electrospun nanofibers29,30 as well as the incorporation of functional additives such as chitin nanowhiskers for composite reinforcement,31 polyetherimide blends for improved microfiltration,32 polyaniline blends for enhanced pore structure and hydrophilicity,33 and poly(2-ethylaniline) blends for specialized applications such as redox flow batteries.34 While these approaches have successfully demonstrated performance improvements, they typically introduce additional complexity through processing modifications or secondary component additions.
Despite extensive research on polysulfone membranes, a critical gap remains in the systematic investigation of how fundamental variations in monomer composition35 influence membrane performance across different molecular weights. Most studies focus on processing parameters, post-synthetic functionalization, or additive incorporation rather than examining the intrinsic effects of polymer backbone chemistry. The subtle structural differences between commonly used bisphenol monomers remain largely unexplored in terms of their systematic influence on membrane properties and performance. This study addresses this gap by characterizing polysulfones synthesized with Bisphenol A (pBPA) and Bisphenol F (pBPF) at molecular weights of 20 kDa & 40 kDa, alongside a commercially available 40 kDa pBPA (Udel). The work uniquely spans the entire membrane development pipeline from polymer synthesis and solution rheology to membrane fabrication via nonsolvent-induced phase separation (NIPS), mechanical characterization, morphological analysis, and multi-solvent transport studies. By systematically correlating polymer composition and molecular weight with membrane morphology, permeability, and separation performance across water and a series of organic solvents (ethanol, 1-butanol, ethylene glycol, and 1,4-butanediol), this work provides critical insights into the fundamental design principles that dictate membrane performance. The findings establish baseline structure–property relationships for unmodified polysulfone membranes, providing a foundation for rational membrane design that can subsequently be enhanced through targeted modifications when needed for specific applications.
Materials
Bisphenol F (BPF) was purchased from TCI and used without further purification. All other chemicals, including dichlorodiphenyl sulfone (DCDPS), potassium carbonate (K2CO3), Bisphenol A (BPA), dimethylacetamide (DMAc), toluene, N-methyl-2-pyrrolidone (NMP), hydrochloric acid (HCl), tetrahydrofuran (THF), Celite® diatomaceous earth (DE), chloroform (CHCl3), methanol (MeOH), ethanol (EtOH), 1-butanol (BtOH), ethylene glycol (EG), and 1,4-butanediol (BDO), and were purchased from Sigma Aldrich and used as received.
Experimental
Synthesis
The synthesis of 20 kDa and 40 kDa phenol-terminated BPA polysulfone (pBPA) and phenol-terminated BPF polysulfone (pBPF) followed the methodology outlined by Weyhrich, depicted in Fig. 1.36 For this process, 19 wt% solids of DCDPS and either BPA or BPF were dissolved in a 40![[thin space (1/6-em)]](https://www.rsc.org/images/entities/char_2009.gif) :60 (v:v) mixture of DMAc and toluene. The ratio of DCDPS to BPA or BPF was calculated using Carother's equation,
:60 (v:v) mixture of DMAc and toluene. The ratio of DCDPS to BPA or BPF was calculated using Carother's equation,| | 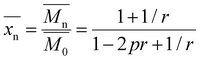 | (1) |
where  is the number-average degree of polymerization,
  is the targeted number-average molecular weight,
  is the monomer molar mass, r is the stoichiometric ratio of monomers, and p is the conversion.37 In step-growth polymerizations, assuming full reaction of the limiting reagent (p = 1), the equation simplifies to:
| |  | (2) |
 |
| | Fig. 1 Polycondensation reaction to produce polysulfones. Polysulfone reaction setup utilizes N2 flow, a mechanical stir rod, an oil bath set to 160 °C for 4 h and 180 °C overnight, a 3-neck round bottom flask, a Dean–Stark trap, and a reflux condenser. | |
Based on this relationship, a monomer ratio of 1/r equivalents of BPA or BPF to 1 equivalent of DCDPS was used. The r-value was set to 0.98 for 20 kDa polymers, while it is assumed to be 1 for 40 kDa polymers. Additionally, 1.2 eq. of K2CO3 was introduced as a base catalyst. The experimental setup, illustrated in Fig. 1, involved stirring the solution under nitrogen (N2) at 160 °C for 4 h, followed by overnight incubation at 180 °C. At 180 °C, toluene was removed via a Dean–Stark trap.
After the reaction, the mixture was quenched by dropwise addition of 2 M HCl in THF to the polymer solution until the solution color changed from dark amber to light yellow. The quenched mixture was filtered through a DE plug. The filtered solution was then precipitated in MeOH. The polymer was then filtered, redissolved in CHCl3, and reprecipitated in MeOH to ensure removal of any impurities. The purified product was then dried overnight at 110 °C. The final product, 40 kDa pBPA was characterized by 1H NMR spectroscopy (500 MHz, CDCl3) δ 7.89–7.79 (m, 183H), 7.29–7.19 (m, 176H), 7.18–7.10 (m, 2H), 7.06–6.94 (m, 178H), 7.00–6.88 (m, 185H), 6.82 (d, J = 8.9 Hz, 2H), 1.69 (s, 250H).
Synthesis of 20 kDa pBPA.
To synthesize 20 g of 20 kDa pBPA, 12.98 g (45 mmol) DCDPS and 10.55 g (46 mmol) BPA were dissolved in 71 mL (0.768 mol) DMAc and 38 mL (0.362 mol) toluene. Then, 7.66 g (55 mmol) K2CO3 was added and stirred with a mechanical stir rod. The reaction was heated, under N2, in an oil bath at 160 °C for 4 h. The N2 flow was then decreased while the temperature was increased to 180 °C, allowing the reaction to continue for an additional 16 h. The final product, 20 kDa pBPA, was characterized by 1H NMR spectroscopy (500 MHz, CDCl3) δ 7.86–7.80 (m, 57H), 7.28–7.19 (m, 64H), 7.14–7.04 (m, 2H), 7.04–6.95 (m, 56H), 6.95–6.82 (m, 60H), 6.76 (d, J = 8.4 Hz, 2H), 1.68 (d, J = 7.1 Hz, 185H).
Synthesis of 40 kDa pBPF.
To synthesize 20 g of 40 kDa pBPF, 13.86 g (48 mmol) DCDPS and 9.66 g (48 mmol) BPF were dissolved in 71 mL (0.767 mol) DMAc and 38 mL (0.363 mol) toluene. Then, 8.00 g (58 mmol) K2CO3 was added, stirred with a mechanical stir rod, and heated under N2 in an oil bath at 160 °C for 4 h. Then, the N2 flow was decreased and temperature was increased to 180 °C, allowing the reaction to continue for an additional 16 h. The final product, 40 kDa pBPF, was characterized by 1H NMR spectroscopy (500 MHz, CDCl3) δ 7.84 (d, J = 8.8 Hz, 250H), 7.35 (d, J = 8.3 Hz, 2H), 7.20 (d, J = 8.0 Hz, 253H), 7.02–6.92 (m, 488H), 6.86–6.71 (m, 2H), 3.98 (s, 122H).
Synthesis of 20 kDa pBPF.
To synthesize 20 g of 20 kDa pBPF, 13.78 g (48 mmol) DCDPS and 9.81 g (49 mmol) BPF were dissolved in 72 mL (0.770 mol) DMAc and 39 mL (0.364 mol) toluene. Then, 8.13 g (59 mmol) K2CO3 was added, stirred with a mechanical stir rod, and heated under N2 in an oil bath to 160 °C for 4 h. Then, the N2 flow was decreased and temperature was increased to 180 °C, allowing the reaction to continue for an additional 16 h. The final product, 20 kDa pBPF, was characterized by 1H NMR spectroscopy (500 MHz, CDCl3) δ 7.84 (dd, J = 33.9, 0.0 Hz, 77H), 7.20 (d, J = 8.4 Hz, 75H), 7.04 (d, J = 8.6 Hz, 2H), 7.01–6.93 (m, 148H), 6.85–6.75 (m, 2H), 3.98 (s, 36H).
Membrane fabrication
Membrane solutions ranging from 10 to 30 wt% polymer in NMP were prepared by thorough mixing using a BenchMixer V2, Vortex Mixer. These solutions were cast onto a glass plate at a thickness of 150 μm, using a doctor blade for precision. For 40 kDa pBPA, additional membranes were cast at thicknesses of 75, 100, 125, and 150 μm. The cast samples underwent nonsolvent-induced phase separation (NIPS) by immersion in a water bath 5 s after casting.38,39 After phase separation, the membranes were moved to a new water bath, which was refreshed every 24 h for 3 days. These membranes were kept submerged in water until the testing phase. They were dried prior to further analysis. In cases where alternative solvents (i.e., BDO or BtOH) were used for permeance tests, the membranes were soaked in the respective solvent until testing.
Methods
Nuclear magnetic resonance (NMR) spectroscopy
NMR spectroscopy data was collected using a Bruker 500, with samples dissolved in CDCl3. 1H NMR spectroscopy analysis was performed at a frequency of 500.15 MHz, using 8 scans and a 5 s relaxation delay.40 The number-average molecular weight ( ) was determined by calculating the ratio of integration of the end group peaks to the backbone peaks,
| | 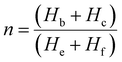 | (3) |
Here, Hb and Hc represent the integration of end group peaks, while He and Hf represent the integration of the backbone peaks. The  was then calculated based on the molecular weight of the end group (227.28 g mol−1 for pBPA and 198.22 g mol−1 for pBPF) and the molecular weight of the repeat unit (442.53 g mol−1 for pBPA and 414.47 g mol−1 for pBPF),
| |  | (4) |
| |  | (5) |
Size exclusion chromatography (SEC)
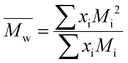
For each sample of pBPA and pBPF, 2 mg of polymer was dissolved in 1 mL anhydrous THF. The solutions were passed through a Waters SEC system at 1 mL min−1. The analysis provided the  , weight-average molecular weight (
 ), and z-average molecular weight (
 ).41 These values are calculated using the following equations
| | 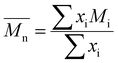 | (6) |
| |  | (7) |
| |  | (8) |
where Mi is the molecular weight of a single chain and xi is the number of polymers at that specific molecular weight. Additionally, dispersity (Đ) is calculated as| |  | (9) |
Solution rheology
Membrane solutions ranging from 1 to 30 wt% solids in NMP were tested using a Discovery Hybrid Rheometer 3 (DHR 3). The rheometer was equipped with a Peltier plate, a 20.0 mm 2.0° cone, and a 50 μm truncation gap height. Flow sweep tests were conducted at 25 °C with shear rates ranging from 1 to 100 s−1.9 The specific viscosity (ηsp) was calculated using| |  | (10) |
where ηNMP represents the viscosity of NMP (1.65 mPa s), and ηmeasured is the viscosity of the solution extrapolated to a shear rate of 0 s−1.42
Thermogravimetric analysis (TGA)
TGA was conducted using a TGA 5500 from TA instruments. For each polymer, a 15 mg sample was heated at a rate of 10 °C min−1 from room temperature to 700 °C.43Td, 5% was calculated as the temperature at which 5% of the polymer mass was lost. Additionally, derivative thermogravimetric peaks were analyzed and tabulated for further evaluation.
Differential scanning calorimetry (DSC)
DSC was performed using a TA Instrument Q2000 calorimeter to determine the glass transition temperatures (Tg) of each polymer. For each polymer, 5 mg of sample was crimped into an aluminum pan and heated under nitrogen at a rate of 10 °C min−1 to 250 °C, cooled to −80 °C, then heated back to 250 °C at 10 °C min−1.43 The Tg of each polymer was calculated using the midpoint method during the second heating ramp.44
Tensile testing
Stress–strain curves were collected using an E3000 Instron at a displacement rate of 5 mm min−1. Dogbone-shaped specimens were prepared following ASTM D-1708 standards using an appropriate die.45 Stress (σ) was calculated using| |  | (11) |
where Fn is the measured load and A is the cross-sectional area of the sample, determined as the product of its thickness and width. The strain (ε) was calculated using| |  | (12) |
where ΔL is the measured displacement, and L0 is the initial gauge length of the sample. Mechanical properties such as Young's modulus (calculated from the initial slope of the stress–strain curve), maximum stress, strain at break, and toughness (determined by integrating the area under the stress–strain curve) were analyzed.
Scanning electron microscopy (SEM)
Dried membranes were prepared for analysis by cold fracturing with liquid nitrogen. After fracturing, the membranes were coated with a 6 μm layer of gold using a Luxor Gold sputter coater. The coated membranes were imaged using a Phenom XL SEM at an operating voltage of 15 kV with a vacuum pressure of 0.10 Pa. The acquired images were then processed using ImageJ software to measure the average pore size in the cross-section of each membrane.
Dead end cell pure water permeance
Dead-end cell tests were conducted using a Sterlitech HP4750 with DI water as the permeation medium.11 A pressure of 5 bar was applied using compressed N2. The permeate was collected into a beaker, and its mass was measured over time using a balance that transmitted measurements to a computer. Flux (J) was calculated from the initial slope of the volume versus time (dV(t)/dt) plots divided by the cross-sectional area of the membrane (Am) using the following equation,| | 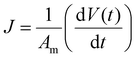 | (13) |
Permeance (QM) and permeability  were calculated from these flux values using the following relationship:
| | 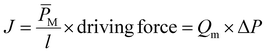 | (14) |
where l is the membrane thickness measured with a Miimoto micrometer, and Δ
P is the difference in pressure, which is the driving force.
46 Additionally, pure EtOH, BtOH, EG, and BDO were tested in similar experimental conditions.
Swelling degree
Three 15 mg membrane samples cast from 15 wt% polymer solutions were dried under vacuum at 60 °C. The dried membranes were weighed then submerged in vials containing either water, EtOH, BtOH, EG, and BDO and mass measurements were recorded after 4 days. The swelling degree (SD) was calculated using| | 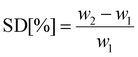 | (15) |
where w1 is the dry membrane mass (in mg), and w2 is the saturated membrane mass after 4 days (in mg).47
Results & discussions
Polymer characterization
Carother's equation was used to calculate monomer mass necessary to achieve targeted molecular weights of 20 and 40 kDa for both pBPA and pBPF.37 The analysis of 1H NMR spectra for pBPA (Fig. 2a and S4) indicates that the 20 kDa batch has an  of 14.4 kDa, while the 40 kDa Udel P-1700 has an
  of 42.6 kDa. Similarly, the 1H NMR spectral analysis for pBPF (Fig. 2b and S5) shows that the 20 kDa batch has an
  of 16.1 kDa and the 40 kDa batch has an
  of 43.7 kDa. SEC molecular weights, as shown in Fig. 3, are determined relative to polystyrene standards. The elution times are similar for the 20 kDa polymers, pBPA (25.1 kDa
  ) and pBPF (28.3 kDa
  ), and 40 kDa polymers, pBPA (58.5 kDa
  ) and pBPF (65.6 kDa
  ). Đ values range between 1.5 and 2 for all polymers.
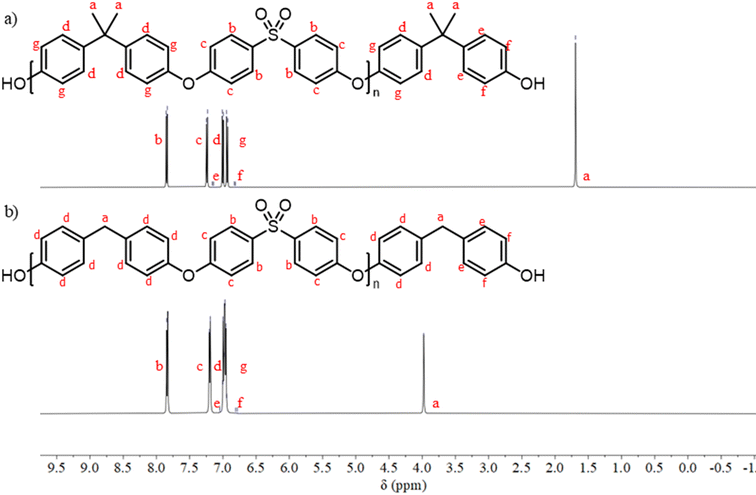 |
| | Fig. 2 (a) 1H NMR spectroscopy for 40 kDa pBPA confirms a molecular weight of 42.6 kDa. (b) 1H NMR spectroscopy for 40 kDa pBPF confirms a molecular weight of 43.7 kDa. | |
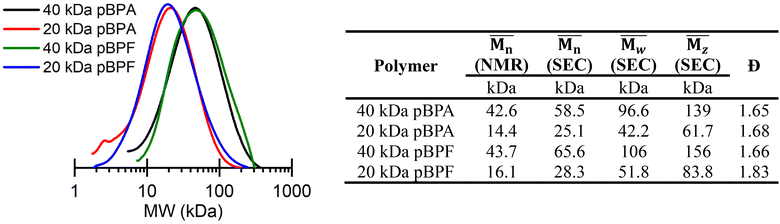 |
| | Fig. 3 (Left) SEC shows that replacing BPA with BPF does not change the elution time for polymers with similar targeted molecular weights. (Right) A summary of molecular weights from SEC and 1H NMR spectroscopy. | |
Rheological properties
The rheological behavior of the polymers in solution in Fig. 4 illustrate how molecular weight and chemical structure influence chain entanglement and flow resistance. As expected, higher molecular weight polymers exhibit higher viscosities, consistent with longer chain lengths enhancing intermolecular entanglement. The viscosity of polymer solutions used to fabricate separation membranes typically fall into two concentration-dependent regimes: semi-dilute unentangled and semi-dilute entangled. At lower concentrations, polymer chains move relatively independently, leading to a weak dependence of viscosity on concentration. This semi-dilute unentangled regime is characterized by a lower power law exponent, typically around 1.3 for neutral polymers.48 As concentration increases, chains begin to transiently entangle which restricts motion, marking the transition to the semi-dilute entangled regime. Here, viscosity increases much more rapidly with concentration, with power law exponents around 3.9.48 The transition between these two slopes defines the entanglement concentration (Ce).48 Notably, both 20 kDa polymers exhibit this transition near 100 mg mL−1, while the 40 kDa polymers transition below 65 mg mL−1, reflecting the earlier onset of chain entanglement which is common in higher molecular weight polymers. These longer chains more readily entangle, even at dilute concentrations, hindering segmental motion and thereby increasing resistance to flow, i.e., viscosity.49 Additionally, pBPF required lower concentrations to reach the entanglement threshold compared to pBPA at similar molecular weights. This behavior may stem from the absence of methyl groups in BPF, which allows the polymer chains to adopt more contorted conformations, promoting increased self-entanglement.50 Additionally, all scaling factors listed in Fig. 4 follow similar trends: scaling factors in the semi-dilute unentangled regime are between 1.3 and 1.8, while scaling factors in the semi-dilute entangled regime are between 3.5 and 4.7 In the semi-dilute unentangled regime, higher molecular weight polymers displayed larger scaling factors, whereas in the semi-dilute unentangled regime, lower molecular weight polymers show the larger scaling factors. This trend reflects the fact that higher molecular weight polymers approach the entanglement threshold at lower concentrations, causing viscosity to increase more drastically in the semi-dilute unentangled regime, whereas lower molecular weight polymers require higher concentrations to reach this point, delaying the onset of the steeper viscosity increase. These rheological observations provide valuable insights into the viscosity and flow behavior of the polymers, highlighting solution properties at different concentrations and molecular weights that are essential for membrane formation.
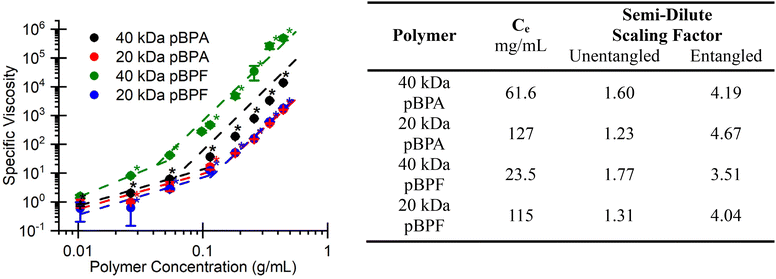 |
| | Fig. 4 (Left) Solution rheology shows the increase in specific viscosity with concentration and molecular weight for each polymer in NMP. (Right) Entanglement concentration (Ce) and scaling factors for the semi-dilute unentangled regine and the semi-dilute entangled regime for pBPA and pBPF in NMP. *The asterisk denotes that differences in the data are statistically significant at 95% confidence. | |
Thermal properties
Thermal characterization of all polymers was performed using TGA and DSC to evaluate their stability and thermal transitions. In Fig. S1a, the TGA results revealed that both pBPA polymers exhibit a single degradation step around 500–530 °C, whereas both pBPF polymers exhibit two degradation steps, occurring around 460 °C and 520–540 °C. The onset of decomposition (Td, 5%) for all samples occurred well above 400 °C, with 40 kDa pBPA beginning to degrade near 500 °C. These results indicate robust thermal stability for all polymers, well beyond typical membrane operating temperatures. In Fig. S1c, DSC measurements showed that the glass transition temperatures (Tg) increased with Mn for both series. Notably, pBPA exhibited consistently higher Tg values than pBPF of similar Mn, reflecting the increased rigidity imparted by the methyl substituents on the bisphenol bridge, which restricts chain mobility. Together, these findings confirm the high thermal resilience of both polymer systems and demonstrate the subtle structural differences significantly influence chain dynamics and thermal transitions. All thermal data are summarized in Table S1.
Membrane characterization
Mechanical properties.
Fig. 5 presents the stress–strain curves for the porous membranes prepared from polymers with varying molecular weights and casting solution concentrations. From these curves, the Young's modulus, maximum stress at break, strain at break, and toughness were calculated (Fig. 6). Because these polymers were fabricated by NIPS, the polymer concentration in the casting solution strongly affects the resulting pore structure and porosity, which governs mechanical performance. Higher polymer loadings generally yield denser membranes with reduced porosity, leading to higher stiffness and strength compared to membranes cast from more dilute solutions. As shown in Fig. 6a, Young's modulus remained consistent for all polymers up to 25 wt% polymer loading, after which commercial pBPA outperformed all other polymers. At 30 wt% pBPF showed a lower Young's modulus than pBPA. Higher molecular weight polymers consistently displayed greater modulus values. Stress–strain behavior (Fig. 6b and c) revealed that pBPA sustained longer plastic deformation at higher stresses before failure compared to pBPF. Increasing molecular weight significantly extended both stress and strain prior to failure. Toughness (Fig. 6d) followed these same trends: pBPA outperformed pBPF, and higher molecular weight polymers achieved greater toughness. Overall, mechanical properties improved with higher polymer casting concentration and molecular weight, consistent with reduced membrane porosity and enhanced chain entanglement. Notably, a given polymer at both molecular weights showed consistent slopes across all property trends, indicating mechanical response is governed by both polymer composition and molecular weight.
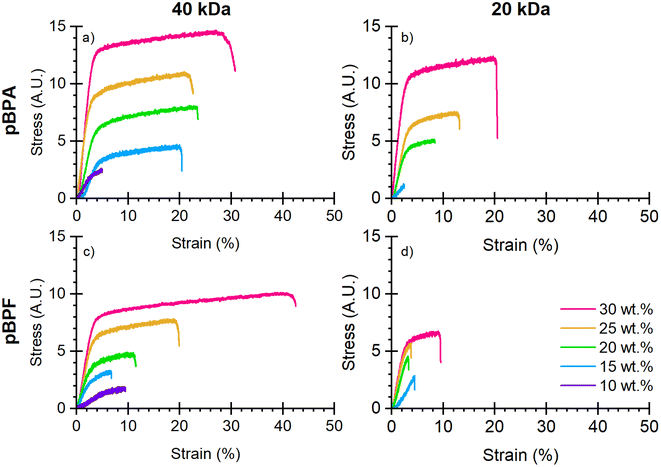 |
| | Fig. 5 Stress–strain curves for (a) 40 kDa pBPA, (b) 20 kDa pBPA, (c) 40 kDa pBPF, and (d) 20 kDa pBPF show an increase in mechanical properties with increased polymer loading and increased molecular weight. *These tests were completed on porous membranes, where the cross-sectional area may not be constant due to the porosity of the membrane. | |
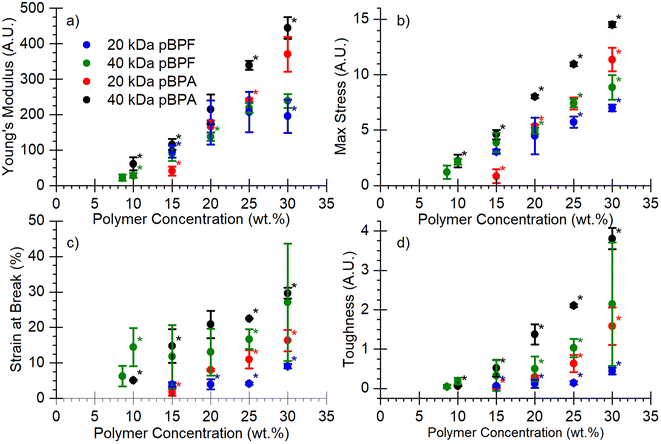 |
| | Fig. 6 (a) Young's modulus, (b) maximum stress, (c) strain at break, and (d) toughness for pBPF and pBPA membranes with varying molecular weight and polymer casting solution concentrations. *The asterisk denotes that differences in the data are statistically significant at 95% confidence. However, these tests were completed on porous membranes, where the cross-sectional area may not be constant due to the porosity of the membrane. | |
Pore morphology characterization
Because these membranes were fabricated via NIPS, the polymer concentration in the casting solution strongly influences the resulting pore structure. The cross-sectional morphology of membranes tested in the dead end cell under a pressure of 1 bar and membranes untested with no pressure applied were observed using SEM. Fig. 7 shows SEM images of the membrane cross-sections, revealing a range of pore morphologies which depend on polymer loading. During NIPS, higher polymer loadings increase solution viscosity and slow the solvent-nonsolvent exchange, promoting a more thermodynamically stable uniform phase separation with dense, sponge-like morphologies. In contrast, lower polymer concentrations accelerate phase separation, leading to the formation of finger-like pores due to rapid nonsolvent influx.21 For example, at 30 wt% for all polymers, a more sponge-like morphology dominated, whereas membranes cast from lower concentrations exhibited finger-like morphologies. Intermediate polymer loadings produced a mixture of sponge-like and finger-like-regions.
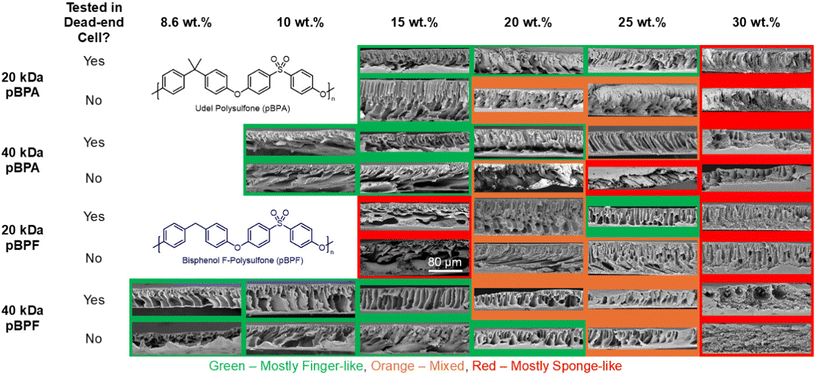 |
| | Fig. 7 Cross-section SEM images of each membrane tested that show the various membrane morphologies created. Red borders indicate mostly sponge-like pore morphologies, green borders indicate mostly finger-like pore morphologies and orange borders indicate mixed pore morphologies. | |
In Fig. 8, the measurements of pore sizes show no clear trends overall, with most pore diameters falling within a 1–5 μm range, which is within the microfiltration range. However, for the 40 kDa polymers a significant decrease in pore sizes is observed at 30 wt% polymer loading, a trend not seen in the 20 kDa polymers. Under applied pressure in the dead-end cell, many membranes exhibited thickness compaction, most notably in the 20 kDa polymers. Pressurization also produced significantly larger pore sizes, especially in the 40 kDa pBPF membranes, where larger pores were observed alongside the smaller sponge-like morphology. These findings confirm that both polymer concentration and molecular weight govern phase separation behavior and resulting pore morphology, crucially influencing both the membrane's mechanical and transport properties.
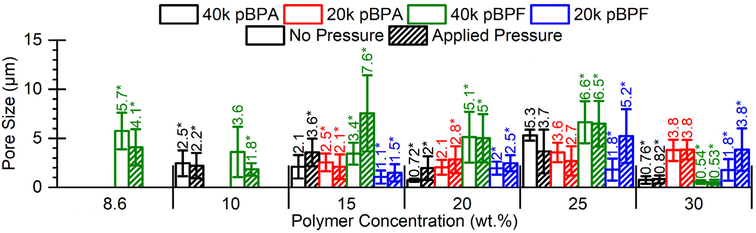 |
| | Fig. 8 Pore size measurements show no clear trends for all membranes. Membranes that were tested for permeance are labeled as “Applied Pressure”, while those that were not tested are labeled as “no pressure”. *The asterisk denotes that differences in the data are statistically significant for each membrane cast at specific polymer concentration at 95% confidence. | |
Membrane performance
To support potential membrane separations applications, this study implements a protocol for fabricating polysulfone membranes with variable polymer loading (10–20 wt%) and wet membrane thicknesses (75–150 μm). Deionized water (DI) permeance data in literature and illustrated in Fig. 9, has played a crucial role in determining that NMP is the optimal solvent for membrane fabrication, as it consistently provided high water flux across polymer loadings even at low operating pressures.
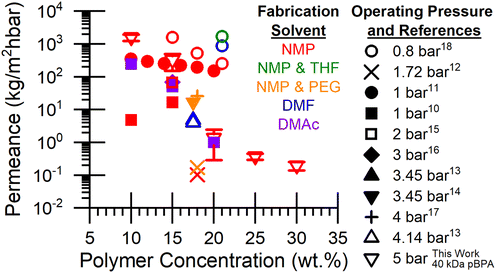 |
| | Fig. 9 Literature values and 40 kDa pBPA membranes measured in this work for DI water permeance through polysulfone membranes fabricated with various solvents such as dimethyl formamide (DMF), N-methyl-2-pyrrolidone (NMP), polyethylene glycol (PEG), dimethyl acetamide (DMAc), tetrahydrofuran (THF), and tested at various operating pressures. | |
The systematic variation of thickness of 40 kDa pBPA membranes in Fig. S3 demonstrates that DI water permeance decreases as thickness increases. A thickness of 150 µm was selected for its practicality (i.e., ease of handling) and adequate DI water permeance. Additionally, a 15 wt% polymer casting solution concentration was identified as optimal for testing across all polymers, as membranes prepared from 10 wt% solutions were generally too fragile to handle. The trend observed in Fig. 10 for 20 kDa pBPA, 40 kDa pBPF, and 20 kDa pBPF indicates that DI water permeance decreases as the polymer concentration in the casting solution increases. Interestingly, water permeance results collapse onto a single correlation with polymer loading; however, for 40 kDa pBPF, higher solution viscosity was observed without a corresponding decrease in permeance. Additionally, 20 kDa pBPA shows a higher permeance at 30 wt% than both 40 kDa pBPA and pBPF. At 15 wt% polymer loading, permeance remains relatively consistent across all polymers, making it the only loading considered for pure solvent permeance testing.
 |
| | Fig. 10 Pure water permeance vs. (a) specific viscosity of the polymer casting solution or (b) polymer concentration in the casting solution. Water permeance data for all casted polymers show similar performance for both pBPA and pBPF. *The asterisk denotes that differences in the data are statistically significant at 95% confidence. | |
Organic solvent permeance and uptake
Solvent permeance and uptake data reveal key structure–property relationships between molecular weight, polymer composition, and solvent interactions. As summarized in Fig. 11, these effects were evaluated across a series of solvents with varying viscosity and density to isolate the kinetic and thermodynamic factors governing transport. All membranes were prepared at 15 wt% polymer loading, selected for high water permeance and stable morphology, and tested with EtOH, BtOH, EG, and BDO to assess solvent-dependent swelling and permeance behavior. Water serves as a reference for comparing permeance and swelling across the solvent series.
 |
| | Fig. 11 Solvent permeance compared to solvent (a) viscosity51,52,57–60 and (b and c) swelling degree compared to the distance between solvent and polymer Hansen's solubility parameters53 at a transmembrane pressure drop of 5 bar for water, EtOH, BtOH, EG, and BDO through membranes cast from 15 wt% polymer solutions. | |
Across the solvent series, permeance exhibited a clear inverse correlation with viscosity (Fig. 11a and b). Solvents with a lower viscosity, such as EtOH (1.2 mPa s),51 showed the highest permeance, while more viscous solvents such as BDO (73.8 mPa s)52 displayed significantly reduced flux. This behavior reflects the increasing resistance to molecular diffusion through the membrane pores as solvent viscosity becomes more pronounced. Notably, water permeance through pBPF membranes was lower than EtOH and BtOH despite water's lower viscosity. The influence of molecular weight and polymer composition on transport depended strongly on the solvent. For water, permeance increased with molecular weight, where 20 kDa polymers showed lower permeance than 40 kDa polymers, with minimal differences between pBPA and pBPF. In contrast, organic solvents displayed the inverse phenomenon: 20 kDa membranes generally outperforming 40 kDa membranes. EtOH and EG permeance showed strong polymer composition dependence, with pBPF consistently showing significantly (p = 0.05) higher permeance than pBPA across both molecular weights, but minimal molecular weight effects within each polymer type. BtOH and BDO, conversely, exhibited both molecular weight and polymer composition dependencies, where 20 kDa membranes showed higher permeance than 40 kDa membranes, and pBPF outperformed pBPA. These results show that kinetic contributions of polymer free volume become increasingly dominant as solvent viscosity rises and that polymer chemistry modulates this behavior through differences in segmental mobility and solvent affinity. Fig. S6 compares solvent permeance to additional solvent properties, where no trends are observed.
To interpret solvent-membrane interactions, Hansen's solubility parameters (HSP) were calculated for both polymers using group contribution methods from Stefanis et al.54 and Enekvist et al.55 The distance between solvent and polymer parameters (Ra) provides insight into thermodynamic affinity, where lower Ra value corresponds to stronger compatibility, and typically, greater swelling.56 As shown in Fig. 11: solvent permeance compared to solvent (a) viscosity51,52,57–60 and (b and c) swelling degree compared to the distance between solvent and polymer Hansen's solubility parameters53 at a transmembrane pressure drop of 5 bar for water, EtOH, BtOH, EG, and BDO through membranes cast from 15 wt% polymer solutions.
Table 1, water exhibits the largest Ra values (∼43–45), indicating poor thermodynamic compatibility with both polymer compositions, while the organic solvents show progressively smaller Ra values (BtOH ∼16, EtOH ∼18, BDO ∼20, EG ∼23), suggesting increasingly favorable interactions. Consistent with these predictions, swelling increased substantially from water (∼50–160%) to organic solvents, reaching ∼255–410% for EG, ∼334–361% for BDO, ∼218–365% for BtOH, and ∼165–330% for EtOH (Fig. 11c). However, the swelling order did not precisely follow the Ra sequence, as shown in Fig. 11b. For example, EG induced the highest swelling despite its slightly larger Ra values, suggesting the limitations of using HSPs alone to predict complex polymer–solvent interactions. Moreover, Ra values of the organic solvents might be too similar to yield significant changes to swelling behavior but do show that they are different enough to exhibit high swelling compared to water. Notably, the degree of swelling did not correlate directly with solvent permeance for 15 wt% membranes (Fig. S6d), reinforcing the concept that the thermodynamic affinity and kinetic transport resistances are decoupled in these porous systems.
Table 1 Calculated Hansen's solubility parameters for pBPA and pBPF show parameters for pBPF are slightly higher than pBPA
| Polymer |
Method |
Hansen's solubility parameters |
Distance between solute to solvent parameters (Ra)53 |
|
δt
|
δp
|
δh
|
δd
|
| MPa1/2 |
MPa1/2 |
MPa1/2 |
MPa1/2 |
Water |
EtOH |
BtOH |
EG |
BDO |
| pBPA |
Stefanis et al.54 |
26.8 |
6.92 |
3.95 |
25.6 |
43.7 |
18.7 |
15.4 |
25.0 |
20.8 |
| Enekvist et al.55 |
23.5 |
7.68 |
1.28 |
22.1 |
41.5 |
18.0 |
16.4 |
23.4 |
19.3 |
| pBPF |
Stefanis et al.54 |
28.8 |
8.78 |
5.23 |
26.9 |
44.8 |
19.3 |
16.2 |
26.1 |
21.4 |
| Enekvist et al.55 |
25.9 |
9.80 |
3.54 |
23.7 |
41.6 |
17.8 |
16.6 |
23.6 |
18.9 |
Overall, solvent uptake and permeance trends indicate that solvent transport through these porous membranes is governed by a complex interplay of thermodynamic compatibility and kinetic resistance. HSP analysis provides qualitative insight into swelling behavior, where lower Ra values (∼16–23) significantly swelled the membranes compared to water (44). Permeance behavior is governed by viscosity as the dominant kinetic barrier, with higher viscosity solvents like BDO showing dramatically reduced transport despite favorable thermodynamic compatibility and substantial swelling. However, solvents such as EtOH and BtOH exhibit enhanced permeance through pBPF membranes, where favorable polymer–solvent interactions overcame viscosity limitations. The distinct behavior of organic solvents through pBPF vs. pBPA, compared to water's tendency to flow through higher molecular weight polymer membranes, highlights how subtle variations in polymer architecture influence free volume and solvent accessibility. These observations suggest that solvent transport in these systems is primarily kinetically driven, dictated by solvent viscosity and polymer microstructure.
Conclusions
This study presents a comprehensive analysis of the synthesis, characterization, and membrane performance of two polysulfones. A series of BPA and BPF membranes with molecular weights of 20 kDa or 40 kDa were fabricated and evaluated for mechanical, thermal, and rheological properties, pore morphology, and water, BDO, and BtOH permeance. Polymer synthesis successfully targeted the desired molecular weights, as confirmed by 1H NMR spectroscopy and SEC. Mechanical testing revealed that both higher molecular weight and increased polymer concentration in casting solutions enhanced membrane mechanical properties, with pBPA showing a much steeper increase than pBPF. Thermal analysis confirmed that all polymers possessed excellent thermal stability, with decomposition temperatures above 400 °C and glass transition temperatures that increased with molecular weight and were consistently higher for pBPA than pBPF. These findings indicate robust stability well above membrane operating conditions. Rheological characterization further demonstrated that solution viscosity increased with both polymer concentration and molecular weight, with entanglement occurring at lower concentrations for the higher molecular weight polymers. These rheological trends directly influenced membrane morphology, with higher polymer loadings yielding denser, sponge-like structures, moderate loadings producing mixed morphologies, and lower loadings leading to finger-like pores.
Water permeance testing highlighted the strong influence of polymer concentration in the casting solutions and the resulting membrane thickness on transport phenomena. Higher casting solution concentrations led to reduced permeance. Among the polymers, 20 kDa pBPA demonstrated superior water permeance across the range of casting solution concentrations. Based on membrane robustness and performance, a casting solution concentration of 15 wt% was identified as optimal for additional solvent permeance testing. Solvent uptake and permeance studies revealed the intertwined influence of thermodynamic and kinetic factors on transport. Across the series of solvents with varying viscosity, permeance decreased with increasing viscosity. The decline in Ra from water (∼43–45) to organic solvents (16–23) predicted the onset of significant swelling, but the narrow 16–23 range was too small to drive measurable differences in membrane swelling among the different organic solvents. This work explored the structure–property relationships for two different polysulfones fabricated into membranes, providing insight into their design and optimization for microfiltration separations. These results emphasize the critical interplay of polymer chemistry, molecular weight, and processing conditions in tailoring membrane performance to specific applications. Future studies could explore membrane longevity, antifouling properties, as well as functional modifications to expand the utility of these polymers further.
Conflicts of interest
M. D. G. is co-founder of NuAria, LLC and owns 50% equity interest in the company. M. D. G. and T. B. L. T. are co-founders of Zwitera, LLC and each own 50% equity interest in the company. The work of this manuscript is not directly related to the activities of either company.
Data availability
The data supporting this article have been included as part of the supplementary information (SI). Supplementary information is available. SI includes Polymer Thermal Data, Additional Solution Rheology Data, 40 kDa pBPA Membrane Thickness Comparison, 1H NMR Spectroscopy with integrations, Additional Comparison of Solvent Permeance to Solvent Density, Molecular Diameter, Carbon Number, and the distance between solvent and polymer Hansen Solubility Parameters. See DOI: https://doi.org/10.1039/d5lp00299k.
Acknowledgements
This material is based upon work supported by the National Science Foundation under Grant No. E3P-2132183, including multiple REM supplements. We acknowledge the use of facilities within the Biodesign Center for Sustainable Macromolecular Materials and Manufacturing (SM3) Shared Facility, supported in part by the Biodesign Institute and the National Institute of Standards and Technology (NIST).
References
- S. Kheirieh, M. Asghari and M. Afsari, Application and Modification of Polysulfone Membranes, Rev. Chem. Eng., 2018, 34(5), 657–693, DOI:10.1515/revce-2017-0011.
-
A. Abdelrasoul, H. Doan, A. Lohi and C. H. Cheng, Morphology Control of Polysulfone Membranes in Filtration Processes: A Critical Review, in ChemBioEng Reviews, Wiley-Blackwell, 2015, pp. 22–43. DOI:10.1002/cben.201400030.
- K. Majewska-Nowak, Synthesis and Properties of Polysulfone Membranes, Desalination, 1989, 71(2), 83–95, DOI:10.1016/0011-9164(89)80001-3.
-
A. Bhatnagar and D. B. Thomas, Process for Preparying a Poly(Aryl Ether Sulfone) (PAES) Polymer, WO2021/110954A1, 2021. chrome-extension://efaidnbmnnnibpcajpcglclefindmkaj/https://patentimages.storage.googleapis.com/58/3a/38/ea3ddffcd8b8f8/WO2021110954A1.pdf.
- M. M. Ngoma, M. Mathaba and K. Moothi, Removal of Cu2+, Fe2+, Ni2+, Zn2+ and Cl− from Industrial Wastewater Using a Polyethersulfone/Carbon Nanotube/Polyvinyl Alcohol Composite Membrane, Environ. Challenges, 2021, 4, 100116, DOI:10.1016/j.envc.2021.100116.
- S. C. Mamah, P. S. Goh, A. F. Ismail, N. D. Suzaimi, L. T. Yogarathinam, Y. O. Raji and T. H. El-badawy, Recent Development in Modification of Polysulfone Membrane for Water Treatment Application, J. Water Process Eng., 2021, 40, 101835, DOI:10.1016/j.jwpe.2020.101835.
- D. Song, J. Xu, Y. Fu, L. Xu and B. Shan, Polysulfone/Sulfonated Polysulfone Alloy Membranes with an Improved Performance in Processing Mariculture Wastewater, Chem. Eng. J., 2016, 304, 882–889, DOI:10.1016/j.cej.2016.07.009.
- I. G. Wenten, P. T. P. Aryanti, K. Khoiruddin, A. N. Hakim and N. F. Himma, Advances in Polysulfone-Based Membranes for Hemodialysis, J. Membr. Sci. Res., 2016, 2(2), 78–89, DOI:10.22079/jmsr.2016.19155.
- P. Anadão, R. R. Montes, H. S. De Santis and H. Wiebeck, Rheology Assessment of PSf/NMP Solution and Its Influence on Membrane Structure, Defect Diffus. Forum, 2012, 326–328(2012), 422–427, DOI:10.4028/www.scientific.net/DDF.326-328.422.
- Z. Zhang, Q. An, Y. Ji, J. Qian and C. Gao, Effect of Zero Shear Viscosity of the Casting Solution on the Morphology and Permeability of Polysulfone Membrane Prepared via the Phase-Inversion Process, Desalination, 2010, 260(1–3), 43–50, DOI:10.1016/j.desal.2010.05.002.
- Z. Liu, Y. Bai, D. Sun, C. Xiao and Y. Zhang, Preparation and Performance of Sulfonated Polysulfone Flat Ultrafiltration Membranes, Polym. Eng. Sci., 2015, 55(5), 1003–1011, DOI:10.1002/pen.23968.
- A. K. Ghosh and E. M. V. Hoek, Impacts of Support Membrane Structure and Chemistry on Polyamide-Polysulfone Interfacial Composite Membranes, J. Membr. Sci., 2009, 336(1–2), 140–148, DOI:10.1016/j.memsci.2009.03.024.
- G. Arthanareeswaran, D. Mohan and M. Raajenthiren, Preparation and Performance of Polysulfone-Sulfonated Poly(Ether Ether Ketone) Blend Ultrafiltration Membranes. Part I, Appl. Surf. Sci., 2007, 253(21), 8705–8712, DOI:10.1016/j.apsusc.2007.04.053.
- G. Arthanareeswaran, D. Mohan and M. Raajenthiren, Preparation, Characterization and Performance Studies of Ultrafiltration Membranes with Polymeric Additive, J. Membr. Sci., 2010, 350(1–2), 130–138, DOI:10.1016/j.memsci.2009.12.020.
- Y. Zhang, X. Gao, Y. Wang, Y. Zhang and G. Q. Lu, Study on the Build of Channels in Accurate Separation Membrane and Its Selective Mechanism, J. Membr. Sci., 2009, 339(1–2), 100–108, DOI:10.1016/j.memsci.2009.04.035.
- S. Zhao, Z. Wang, X. Wei, B. Zhao, J. Wang, S. Yang and S. Wang, Performance Improvement of Polysulfone Ultrafiltration Membrane Using Well-Dispersed Polyaniline-Poly(Vinylpyrrolidone) Nanocomposite as the Additive, Ind. Eng. Chem. Res., 2012, 51(12), 4661–4672, DOI:10.1021/ie202503p.
- S. S. Alias, Z. Harun and M. F. Shohur, Effect of Monovalent and Divalent Ions in Non-Solvent Coagulation Bath-Induced Phase Inversion on the Characterization of a Porous Polysulfone Membrane, Polym. Bull., 2019, 76(11), 5957–5979, DOI:10.1007/s00289-019-02689-z.
- M. Nur-E-Alam, S. A. Deowan, E. Hossain, K. S. Hossain, M. Y. Miah and M. Nurnabi, Fabrication of Polysulfone-Based Microfiltration Membranes and Their Performance Analysis, Water, Air, Soil Pollut., 2024, 235(1), 1–17, DOI:10.1007/s11270-023-06872-x.
- F. Denisa, A. Ficai, G. Voicu, B. S. Vasile, C. Guran and E. Andronescu, Polysulfone Based Membranes with Desired Pores Characteristics, Mater. Plast., 2010, 47(1), 24–27 Search PubMed.
- H. Zhang and Z. Guo, Fenton Photocatalytic Sponges for Rapid Separation of Emulsified-Oil/Dyes, RSC Appl. Polym., 2025, 916–925, 10.1039/d5lp00070j.
- A. A. Oduro, W. S. Seaneye, K. Miezah, W. W. Anku and E. S. Agorku, Defluorination of Borehole Water Using Activated Clay and Bauxite-Laden Polyvinyl Alcohol Hybrid Membranes, RSC Appl. Polym., 2025, 3(6), 1613–1628, 10.1039/d5lp00188a.
- M. Fang, R. Muñoz-olivas, C. Montoro and M. Semsarilar, Thiol–Ene Click Reaction: A New Pathway to Hydrophilic Metal–Organic Frameworks for Water Purificatio, RSC Appl. Polym., 2025, 469–479, 10.1039/d4lp00341a.
- M. Rist and A. Greiner, Bio-Based Electrospun Polyamide Membrane – Sustainable Multipurpose Filter Membranes for Microplastic Filtratio, RSC Appl. Polym., 2024, 642–655, 10.1039/d3lp00201b.
- G. Mahadevan and S. Valiyaveettil, Structure–Function Correlation of Branched and Linear Polyaramides for the Removal of Pollutants from Water, RSC Appl. Polym., 2025, 3(6), 1508–1530, 10.1039/d5lp00114e.
- A. R. Sujatha, S. Krishnan and C. V. Suneesh, Post-Synthetic Amination of Porous Hypercrosslinked Polymer for the Adsorptive Removal of Bisphenol-A from Water, RSC Appl. Polym., 2025, 3(6), 1482–1494, 10.1039/d5lp00208g.
- W. Ji, X. Li, Q. Xi, M. Song, X. Wu and P. Song, Preparation of Gradient Porous Polymer Membranes with Multifunctionality, RSC Appl. Polym., 2024, 816–820, 10.1039/d3lp00141e.
- J. D. Mota-morales, Ring-Opening Polymerization of Emulsion-Templated Deep Eutectic System Monomer for Macroporous Polyesters with Controlled Degradability, RSC Appl. Polym., 2024, 403–414, 10.1039/d3lp00232b.
- I. Borisov, V. Vasilevsky, D. Matveev, A. Ovcharova, A. Volkov and V. Volkov, Effect of Temperature Exposition of Casting Solution on Properties of Polysulfone Hollow Fiber Membranes, Fibers, 2019, 7(12), 1–16, DOI:10.3390/?b7120110.
- P. Arribas, M. C. García-Payo, M. Khayet and L. Gil, Heat-Treated Optimized Polysulfone Electrospun Nanofibrous Membranes for High Performance Wastewater Microfiltration, Sep. Purif. Technol., 2019, 226, 323–336, DOI:10.1016/j.seppur.2019.05.097.
- M. Rasouli, S. Pirsalami and S. M. Zebarjad, Optimizing the Electrospinning Conditions of Polysulfone Membranes for Water Microfiltration Applications, Polym. Int., 2019, 68(9), 1610–1617, DOI:10.1002/pi.5858.
- J. L. Shamshina, Chitin Nanowhiskers: A Review of Manufacturing, Processing, and the Influence of Content on Composite Reinforcement and Property Enhancement, RSC Appl. Polym., 2025, 1031–1123, 10.1039/d5lp00104h.
- S. Gunes-Durak, Development of Microfiltration Membranes Based on Polysulfone and Polyetherimide Blends, Water Sci. Technol., 2024, 89(9), 2558–2576, DOI:10.2166/wst.2024.135.
- G. R. Guillen, T. P. Farrell, R. B. Kaner and E. M. V. Hoek, Pore-Structure, Hydrophilicity, and Particle Filtration Characteristics of Polyaniline-Polysulfone Ultrafiltration Membranes, J. Mater. Chem., 2010, 20(22), 4621–4628, 10.1039/b925269j.
- P. P. Bavdane, S. Sreenath, D. Y. Nikumbe, B. Bhatt, C. M. Pawar, V. Dave and R. K. Nagarale, A Poly(2-Ethylaniline) Blend Membrane for Vanadium Redox Flow Batteries, RSC Appl. Polym., 2024, 87–97, 10.1039/d3lp00152k.
- M. A. U. R. Alvi, M. W. Khalid, N. M. Ahmad, M. B. K. Niazi, M. N. Anwar, M. Batool, W. Cheema and S. Rafiq, Polymer Concentration and Solvent Variation Correlation with the Morphology and Water Filtration Analysis of Polyether Sulfone Microfiltration Membrane, Adv. Polym. Technol., 2019, 2019, 8074626, DOI:10.1155/2019/8074626.
- C. W. Weyhrich, J. W. Will, K. V. Heifferon, J. R. Brown, C. B. Arrington, V. Meenakshisundaram, C. B. Williams and T. E. Long, 3D-Printing of Poly(Arylene Ether Sulfone)s: Functional High-Performance Polymers for Vat Photopolymerization, Macromol. Chem. Phys., 2023, 224(1), 1–10, DOI:10.1002/macp.202200240.
-
B. M. Mandal, Fundamentals Of Polymerization, World Scientific Publishing Company, Singapore, 2010 Search PubMed.
- G. R. Guillen, Y. Pan, M. Li and E. M. V. Hoek, Preparation and Characterization of Membranes Formed by Nonsolvent Induced Phase Separation: A Review, Ind. Eng. Chem. Res., 2011, 50(7), 3798–3817, DOI:10.1021/ie101928r.
- S. M. Mousavi and A. Zadhoush, Investigation of the Relation between Viscoelastic Properties of Polysulfone Solutions, Phase Inversion Process and Membrane Morphology: The Effect of Solvent Power, J. Membr. Sci., 2017, 532, 47–57, DOI:10.1016/j.memsci.2017.03.006.
- J. B. Ibieta, D. S. Kalika and L. S. Penn, Chain End Analysis of Bisphenol A Polysulfone and Its Relation to Molecular Weight, J. Polym. Sci., Part A: Polym. Chem., 1998, 36(8), 1309–1316, DOI:10.1002/(SICI)1099-0518(199806)36:8<1309::AID-POLA14>3.0.CO;2-A.
-
H. G. Barth, B. E. Boyes and C. Jackson, Size Exclusion Chromatography, 1994, vol. 66. https://pubs.acs.org/sharingguidelines Search PubMed.
- R. H. Colby, Official Symbols and Nomenclature of The Society of Rheology, J. Rheol., 2013, 57(4), 1047–1055, DOI:10.1122/1.4811184.
- D. J. Mohan and L. Kullová, A Study on the Relationship between Preparation Condition and Properties/Performance of Polyamide TFC Membrane by IR, DSC, TGA, and SEM Techniques, Desalin. Water Treat., 2013, 51(1–3), 586–596, DOI:10.1080/19443994.2012.693655.
- A. Mushtaq, H. B. Mukhtar and A. M. Shariff, Effect of Glass Transition Temperature in Enhanced Polymeric Blend Membranes, Procedia Eng., 2016, 148, 11–17, DOI:10.1016/j.proeng.2016.06.448.
- N. M. Ismail, N. R. Jakariah, N. Bolong, S. M. Anissuzaman, N. A. H. M. Nordin and A. R. Razali, Effect of Polymer Concentration on the Morphology and Mechanical Properties of Asymmetric Polysulfone (PSf) Membrane, J. Appl. Membr. Sci. Tech., 2017, 21(1) DOI:10.11113/amst.v21i1.107.
-
M. H. Lamm and L. R. Jarboe, Chemical Engineering Separations: A Handbook for Students, Ames, IA: Iowa State University Digital Press, 2021, https://iastate.pressbooks.pub/chemicalengineeringseparations/ (accessed 2022-01-11) Search PubMed.
- B. Zhang, C. Yi, D. Wu, J. Qiao and L. Zhang, A High-Permeance Organic Solvent Nanofiltration Membrane via Polymerization of Ether Oxide-Based Polymeric Chains for Sustainable Dye Separation, Sustainability, 2023, 15(4), 3446, DOI:10.3390/su15043446.
- R. H. Colby, Structure and Linear Viscoelasticity of Flexible Polymer Solutions: Comparison of Polyelectrolyte and Neutral Polymer Solutions, Rheol. Acta, 2010, 49(5), 425–442, DOI:10.1007/s00397-009-0413-5.
- R. H. Colby, L. J. Fetters and W. W. Graessley, Melt Viscosity-Molecular Weight Relationship for Linear Polymers, Macromolecules, 1987, 20(9), 2226–2237, DOI:10.1021/ma00175a030.
- M. T. Shaw and J. C. Miller, The Rheology of Polysulfone, Polym. Eng. Sci., 1978, 18(5), 372–377, DOI:10.1002/pen.760180507.
- The Engineering ToolBox. Ethanol - Dynamic and Kinematic Viscosity vs. Temperature and Pressure. https://www.engineeringtoolbox.com/ethanol-dynamic-kinematic-viscosity-temperature-pressure-d_2071.html (accessed 2025-01-11).
- L. Kong, B. Li, L. Zhao, R. Zhang and C. Wang, Density, Viscosity, Surface Tension, Excess Property and Alkyl Chain Length for 1,4-Butanediol (1) + 1,2-Propanediamine (2) Mixtures, J. Mol. Liq., 2021, 326, 115107, DOI:10.1016/j.molliq.2020.115107.
-
S. Abbott
, HSP Basics, Practical Solubility, https://www.stevenabbott.co.uk/practical-solubility/hsp-basics.php (accessed 2025-01-11).
- E. Stefanis and C. Panayiotou, Prediction of Hansen Solubility Parameters with a New Group-Contribution Method, Int. J. Thermophys., 2008, 29(2), 568–585, DOI:10.1007/s10765-008-0415-z.
- M. Enekvist, X. Liang, X. Zhang, K. Dam-Johansen and G. M. Kontogeorgis, Estimating Hansen Solubility Parameters of Organic Pigments by Group Contribution Methods, Chin. J. Chem. Eng., 2021, 31, 186–197, DOI:10.1016/j.cjche.2020.12.013.
-
C. M. Hansen, Hansen Solubility Parameters: A User's Handbook, 2nd edn, 2007. DOI:10.1201/9781420006834.
- The Engineering ToolBox, Water - Dynamic and Kinematic Viscosity at Various Temperatures and Pressures, https://www.engineeringtoolbox.com/water-dynamic-kinematic-viscosity-d_596.html (accessed 2025-01-11).
- M. S. Rahman, F. I. Chowdhury, M. S. Ahmed, M. M. H. Rocky and S. Akhtar, Density and Viscosity for the Solutions of 1-Butanol with Nitromethane and Acetonitrile at 303.15 to 323.15 K, J. Mol. Liq., 2014, 190, 208–214, DOI:10.1016/j.molliq.2013.11.011.
- G. A. Torín-Ollarves, J. J. Segovia, M. C. Martín and M. A. Villamañán, Thermodynamic Characterization of the Mixture (1-Butanol + Iso-Octane): Densities, Viscosities, and Isobaric Heat Capacities at High Pressures, J. Chem. Thermodyn., 2012, 44(1), 75–83, DOI:10.1016/j.jct.2011.08.012.
- T. Sun and A. S. Teja, Density, Viscosity, and Thermal Conductivity of Aqueous Ethylene, Diethylene, and Triethylene Glycol Mixtures between 290 K and 450 K, J. Chem. Eng. Data, 2003, 48(1), 198–202, DOI:10.1021/je025610o.
|
| This journal is © The Royal Society of Chemistry 2026 |
Click here to see how this site uses Cookies. View our privacy policy here. 
 Open Access Article
 This Open Access Article is licensed under a
  ab,
Rowen
Sadlier
c,
Kelly
Nguyen
ab,
Alexis
Powell
d,
Oshio
Oyageshio
e and
Matthew D.
Green
ab,
Rowen
Sadlier
c,
Kelly
Nguyen
ab,
Alexis
Powell
d,
Oshio
Oyageshio
e and
Matthew D.
Green

 is the number-average degree of polymerization,
  is the targeted number-average molecular weight,
  is the monomer molar mass, r is the stoichiometric ratio of monomers, and p is the conversion.37 In step-growth polymerizations, assuming full reaction of the limiting reagent (p = 1), the equation simplifies to:

 ) was determined by calculating the ratio of integration of the end group peaks to the backbone peaks,
 was then calculated based on the molecular weight of the end group (227.28 g mol−1 for pBPA and 198.22 g mol−1 for pBPF) and the molecular weight of the repeat unit (442.53 g mol−1 for pBPA and 414.47 g mol−1 for pBPF),

 , weight-average molecular weight (
 ), and z-average molecular weight (
 ).41 These values are calculated using the following equations


 were calculated from these flux values using the following relationship:

 of 14.4 kDa, while the 40 kDa Udel P-1700 has an
  of 42.6 kDa. Similarly, the 1H NMR spectral analysis for pBPF (Fig. 2b and S5) shows that the 20 kDa batch has an
  of 16.1 kDa and the 40 kDa batch has an
  of 43.7 kDa. SEC molecular weights, as shown in Fig. 3, are determined relative to polystyrene standards. The elution times are similar for the 20 kDa polymers, pBPA (25.1 kDa
  ) and pBPF (28.3 kDa
  ), and 40 kDa polymers, pBPA (58.5 kDa
  ) and pBPF (65.6 kDa
  ). Đ values range between 1.5 and 2 for all polymers.


