Synthesis of binary NiCo2O4/ZnO composites as efficient photocatalysts for methylene blue degradation under visible light
Received
7th August 2025
, Accepted 24th November 2025
First published on 24th November 2025
Abstract
NiCo2O4/ZnOx (x = 0.3 and 0.05) composites were prepared by a precipitation method and characterized using various analytical methods. The hexagonal wurtzite structure of the ZnO phase was retained after integration with NiCo2O4 due to the high crystallinity of ZnO. Through the multi-electron reduction of oxygen, the carrier trapping/detrapping of Co2+/Co3+ was quantitatively predicted to investigate the electron-transport process. As evidenced by its zeta potential (−52.5 mV), NiCo2O4/ZnO@0.05 has a higher adsorption capacity than ZnO, NiCo2O4 and NiCo2O4/ZnO@0.3. The improved photocatalytic activity of NiCo2O4/ZnO@0.05 corresponds to its broader light absorption. Besides, photoluminescence spectra suggested that NiCo2O4/ZnO@0.05 efficiently increased the rate of photoinduced electron generation and decreased the transfer resistance. The enhanced activity can be ascribed to the electrostatic adsorption between NiCo2O4/ZnO@0.05 and MB+ dye, with the optimal rate observed at pH 7. The oxidation potential of hydroxyl free radicals in an aqueous medium is substantially influenced by pH, which in turn may suppress the photocatalytic efficiency. Consequently, the generation of the hydroxyl free radicals in an aqueous medium is limited under both acidic (pH 3) and alkaline (pH 10) conditions. Furthermore, the influence of active species was evaluated by conducting trapping experiments to understand the possible photocatalytic mechanism. Liquid chromatography mass spectroscopy technique coupled with UV-visible absorption spectroscopy was used to analyze the degradation product. Results suggested that the removal of methyl groups from the molecule starts with the degradation of the MB dye.
1. Introduction
The harmful effects that dyes have on the environment can be reduced by breaking down these substances through effective photocatalytic degradation methods. This approach helps to minimize the pollution and ecological damage caused by hazardous dyes.1 Diverse synthetic dyes, which are commonly azo, anthraquinone, sulfur, indigoid, triphenylmethyl (trityl), and phthalocyanine derivatives, are present in wastewater released from industries. The use of synthetic dyes and organic pollutants in industries must be controlled as they have a huge impact on the environment, especially by causing water pollution. Polluted water has been treated via semiconductor photocatalysis for many years.2–7 The most outstanding characteristics of ZnO, a well-known metal oxide semiconductor, are its exceptional chemical stability and strength. ZnO exhibits analogous photocatalytic activity to TiO2, and under UV light, it is found to be as reactive as TiO2 (band gap energy of ∼3.2 eV).8–10 Nevertheless, ZnO has a few drawbacks, including photocorrosion when exposed to UV light and a solar spectrum exhibiting approximately 6% UV content, allowing photogenerated charge carriers to readily recombine and impede its activity.11,12 However, the photocatalytic performance of ZnO still needs to be enhanced for practical applications. Incorporating magnetic nanoparticles into ZnO is a good way to enhance its optical and electrical characteristics for energy and environmental applications.13,14 To tackle these issues, ZnO is combined with spinel metal oxide compounds, such as CoFe2O4,15 ZnFe2O4,16 CuFe2O4,17 Fe3O4,18 NiFe2O4,19 Co3O4![[thin space (1/6-em)]](https://www.rsc.org/images/entities/char_2009.gif) 20 and NiCo2O4.21
20 and NiCo2O4.21
In the inverse spinel structure of NiCo2O4, half of the Co2+ ions occupy the octahedral sites, while the remaining Co3+ ions stay in the tetrahedral sites. All of the Ni2+ ions occupy the tetrahedral sites in the lattice structure.22,23 NiCo2O4 was chosen because of its redox activity, particularly its capacity to store oxygen within the crystal lattice. As a result, NiCo2O4 is a great option for both producing hydrogen from water and decomposing environmentally dangerous contaminants when exposed to light.24–27 NiCo2O4/ZnO composites are rarely investigated in photocatalytic applications, and there are very few reports on them. Numerous surface and bulk changes, such as surface metallization and the insertion of different transition metal ions or metal oxide into the lattice, can occur. These changes depend on their ionic radii and oxidation states, with NiCo2O4 serving as a stable host lattice. The good magnetic properties of the particles have been found, which offer an additional benefit for their separation.21,28,29
In this work, we synthesize the NiCo2O4/ZnO composites using the precipitation method, with varied ZnO contents, and investigate their photocatalytic activity for the degradation of MB under visible light. The stability and surface charge properties of suspended particles in an MB solution are evaluated using the zeta potential. Electrochemical impedance spectra and Mott–Schottky analysis were carried out to explain the electron transfer mechanism of the NiCo2O4/ZnO composites. The trapping experiment was also conducted with an appropriate scavenger to verify the active role of free radicals, thereby indirectly predicting their active involvement. To investigate the mechanism in greater depth, the rate constant and photonic efficiency were computed.
2. Experimental procedure
2.1. Materials required
Zinc acetate dihydrate (Zn(CH3COO)2·2H2O), nickel nitrate hexahydrate (Ni(NO3)2·6H2O), cobalt nitrate hexahydrate (Co(NO3)2·6H2O), urea (CO(NH2)2), para-benzoquinone (C6H4O2) (p-BQ), disodium salt of ethylene diamine tetraacetic acid (C10H14N2Na2O8·2H2O) (Na2-EDTA), isopropyl alcohol (C3H8O) (IPA), ethylene glycol (C2H6O2), methylene blue (C16H18ClN3S) (MB) and ethanol (C2H5OH) were used in the experimental procedure. All the chemicals were laboratory grade and used without further purification.
2.2. Synthesis of ZnO
First, 5.0 g of Zn(CH3COO)2·2H2O was annealed in an alumina crucible for 2 h at 550 °C with a low ramping rate of 5 °C min−1.30 A fine powder was subsequently formed by grinding the resultant ZnO powder.
2.3. Synthesis of NiCo2O4
First, under constant magnetic stirring, 40 mL (1:1) of deionized water and ethylene glycol was used to dissolve 0.435 g of Ni(NO3)2·6H2O and 0.873 g of Co(NO3)2·6H2O. After that, 0.810 g of urea was added to the above suspension, and it was agitated for 30 min. The solution was then added into a 100 mL Teflon-lined autoclave and heated for 12 h at 160 °C. The resulting solution was collected and centrifuged with ethanol and deionised water when the autoclave naturally cooled to room temperature. It was then dried in an oven for 12 h at 60 °C.31 Finally, the product was calcined for 2 h at 350 °C to obtain the tiny stick particles of NiCo2O4.
2.4. Synthesis of the NiCo2O4/ZnO composites
Using ultrasonication, 0.30 g of the ZnO powder was added to 50 mL of deionized water. After mixing 0.29 g of Ni(NO3)2·6H2O (1 mmol), 0.58 g of Co(NO3)2·6H2O (2 mmol), and 1.80 g of urea, the mixture was agitated and allowed to settle in a water bath at 95 °C for 2 h. The mixed solution was collected, washed five times using ethanol and water, and then dried at 80 °C. After being further calcined for 2 h at 350 °C, the resultant product was a NiCo2O4/ZnO composite, named NiCo2O4/ZnO@0.3. Another NiCo2O4/ZnO composite was synthesized using the same method; in this case, 0.05 g of ZnO was used, and the mixture was named NiCo2O4/ZnO@0.05. The details of the catalyst characterization and photoelectrochemical analysis are provided in S1 and S2.
2.5. Photocatalytic activity test
The photocatalytic reaction was carried out in a Borosilicate glass reactor with a virgin Teflon TQR super taper top quartz window suitable for vertical light illumination. A central double UV/vis jacket was equipped with a dip tube to circulate water from the coolant tank through the condenser, maintaining the room temperature. A 450 W visible lamp (Lelesil innovative system Thane-400604) was utilised. The solar radiation as a function of wavelength was measured by photometry, which showed a maximum at 540 nm. The reactor contained 250 mL of a 10 ppm MB solution. Prior to illumination, 100 mg of the photocatalyst was dispersed in the aqueous suspension, and the reaction mixture was stirred for 30 min to attain the adsorption/desorption equilibrium. After the illumination, a 5 mL aliquot of the solution was drawn from the reactor every 15 min and centrifuged to separate the catalyst. The content of MB in the solution was measured by its absorbance as a function of wavelength, ranging from 200 to 800 nm, using UV-visible absorption spectroscopy.
3. Results and discussion
3.1. Powder X-ray diffraction (PXRD) technique
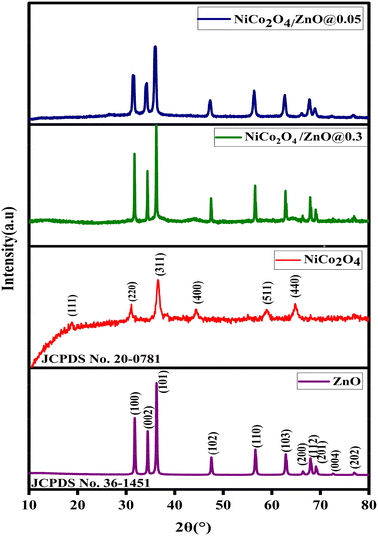
The PXRD patterns of ZnO, NiCo2O4, NiCo2O4/ZnO@0.3 and NiCo2O4/ZnO@0.05 are shown in Fig. 1. The peak positions at 2θ values of 31.75°, 34.48°, 36.25°, 47.51°, 56.70°, 62.98°, 66.46°, 68.06°, 69.26°, 72.74° and 77.07° correspond to the (100), (002), (101), (102), (110), (103), (200), (112), (201), (004) and (202) planes of the hexagonal wurtzite structure ZnO (JCPDS No. 36-1451), respectively.32 The peak positions at 18.85°, 31.01°, 36.59°, 44.43°, 58.91° and 64.88° correspond to the (111), (220), (311), (400), (511) and (440) planes of face-centred cubic NiCo2O4 (JCPDS card No. 01-0147), respectively.33 The high intensity peak of NiCo2O4 (311) is merged with ZnO (101), and all the hkl planes are shifted to a relatively low angle and broadened, indicating the lattice expansion and relatively low crystallite size in the NiCo2O4/ZnO@0.05 composite (Table 1). The average crystallite size (D) was determined using Scherrer's equation for all the photocatalysts (eqn (1)).| |  | (1) |
where ‘λ’ corresponds to the X-ray wavelength of Cu Kα (1.5406 Å), ‘βhkl’ is the full width at half maximum (FWHM) and ‘θ’ corresponds to Bragg's diffraction angle. The average crystallite sizes were found to be approximately 58.34, 34.27, 29.16 and 20.20 nm for ZnO, NiCo2O4, NiCo2O4/ZnO@0.3 and NiCo2O4/ZnO@0.05, respectively.
 |
| | Fig. 1 PXRD patterns of ZnO, NiCo2O4, NiCo2O4/ZnO@0.3 and NiCo2O4/ZnO@0.05. | |
Table 1 Calculation of the crystallite size, lattice strain and parameters for the prepared photocatalysts
| SI no |
Photocatalyst |
Crystallite size D (nm) |
Lattice strain (ε) |
Lattice parameter |
| a |
b |
c |
| 1 |
NiCo2O4 |
34.27 |
0.15 |
8.12 |
8.17 |
8.04 |
| 2 |
ZnO |
58.34 |
0.19 |
2.81 |
2.18 |
5.21 |
| 3 |
NiCo2O4/ZnO@0.3 |
29.16 |
0.38 |
2.81 |
2.39 |
5.21 |
| 4 |
NiCo2O4/ZnO@0.05 |
20.20 |
0.54 |
2.83 |
2.47 |
5.25 |
3.2. Fourier transform infrared (FTIR) spectroscopy
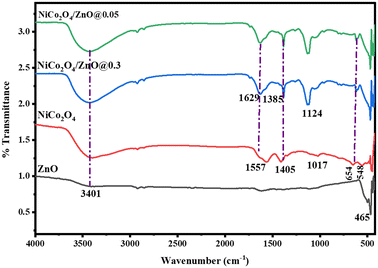
The FTIR spectra of ZnO, NiCo2O4, NiCo2O4/ZnO@0.3, and NiCo2O4/ZnO@0.05 are displayed in Fig. 2. The O–H stretching of the surface-adsorbed water molecules observed in all the samples is attributed to the band at 3401 cm−1. The O–H group bending vibrations of the surface-adsorbed moisture on NiCo2O4 and the composites are accountable for the bands at 1557 and 1629 cm−1, respectively. The bands at 1017 and 1124 cm−1 correspond to the Ni–O or Co–O lattice vibrations in the NiCo2O4 and composites, respectively. The shift in the band positions in the composites may be due to the formation of oxygen vacancies, electronic interaction, charge transfer and Zn–O–Ni/Zn–O–Co chemical bonding at the interface. The bands at 1385 and 1408 cm−1 were due to the NO3− anions.34 The band at 462 cm−1 was due to the Zn–O bond of ZnO, while the Co–O and Ni–O bonds of NiCo2O4 were determined to be the source of the bands at 654 and 555 cm−1.35,36 The band corresponding to Zn–O slightly shifted to 467 cm−1 in the NiCo2O4/ZnO composites, which indicated the chemical interaction between the ZnO and NiCo2O4 samples.
 |
| | Fig. 2 FTIR spectra of ZnO, NiCo2O4, NiCo2O4/ZnO@0.3 and NiCo2O4/ZnO@0.05. | |
| Band position in wavenumber (cm−1) |
Assignments |
| 3401 |
O–H stretching of the surface-adsorbed water for all the prepared samples |
| 1557 and 1629 |
The O–H group bending vibrations of the surface-adsorbed moisture on NiCo2O4 and the composites |
| 1017 and 1124 |
Ni–O or Co–O lattice vibrations in the NiCo2O4 and composites |
| 1385 and 1408 |
NO3− anions in the NiCo2O4 and composites |
| 462 |
Zn–O bond in ZnO |
| 654 and 555 |
Co–O and Ni–O bonds in NiCo2O4 |
3.3. Scanning electron microscopy (SEM)
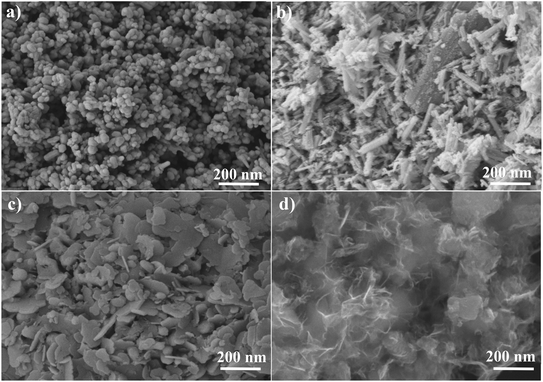
The morphological study was carried out using SEM analysis (Fig. 3). The spherical shape of the ZnO nanoparticles is seen in Fig. 3a. Fig. 3b depicts the small stick-like shape of NiCo2O4, whereas Fig. 3c displays the agglomerated sticky particles dispersed across the ZnO surface from NiCo2O4/ZnO@0.3. Fig. 3d shows that the low content of ZnO causes the spherical particles in NiCo2O4/ZnO@0.05 to completely disappear. Zn, Ni, Co, and O elements are confirmed from the EDS technique, and the percentage composition of each element is shown in Fig. S1.
 |
| | Fig. 3 SEM images of ZnO (a), NiCo2O4 (b), NiCo2O4/ZnO@0.3 (c) and NiCo2O4/ZnO@0.05 (d). | |
3.4. UV-vis diffused reflectance spectra (DRS)
The UV-vis DRS of the ZnO, NiCo2O4, NiCo2O4/ZnO@0.3, and NiCo2O4/ZnO@0.05 samples are displayed in Fig. 4. Strong UV absorption is observed in ZnO, which is indicative of a charge-transfer mechanism from the VB to the CB. The catalyst's absorption is extended to the visible region by the d–d transitions between t2g and eg (Oh) and eg and t2g (td), which can be observed in transition metal ions with d electrons. The d-d transitions employ Ni2+ and Co3+ electronic structures with two and four unpaired d-electrons, respectively. The Kubelka–Munk (KM) function [F(R∞)hυ]1/2vs. photon energy (eV) was plotted to analyze the bandgap. The measured bandgap values for ZnO, NiCo2O4, NiCo2O4/ZnO@0.3 and NiCo2O4/ZnO@0.05 were 3.23, 1.30, 2.44, and 2.28 eV, respectively. After integration with NiCo2O4, a decrease in the ZnO bandgap was noted in the NiCo2O4/ZnO composites.
 |
| | Fig. 4 UV-vis DRS of (a) ZnO, (b) NiCo2O4, (c) and (d) NiCo2O4/ZnO@0.05. Insets: corresponding bandgap energy (KM) plots. | |
3.5. Charge transfer analysis
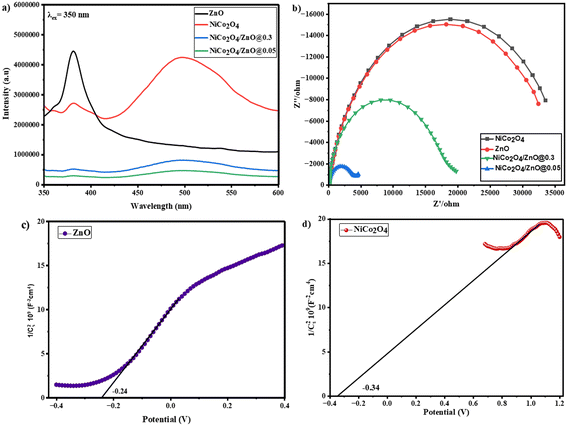
Fig. 5a shows the photoluminescence (PL) spectra of ZnO, NiCo2O4, NiCo2O4/ZnO@0.3 and NiCo2O4/ZnO@0.05 at an excitation wavelength of 350 nm. At 381 nm, the synthesized ZnO exhibits a prominent and intense emission peak. This UV emission is due to UV band-edge emissions, triggered by the recombination of free excitons through an exciton–exciton collision process. The 3d levels of Ni/Co build CB, while the VB of NiCo2O4 is formed by O 2p levels.37 The recombination reactions involving the Ni/Co levels should be responsible for the peak at 382 nm, whereas the recombination reactions between VB and CB generated the broad peak at 450–535 nm. As compared to NiCo2O4/ZnO@0.3, ZnO, and NiCo2O4, it is evident that the peak intensity of NiCo2O4/ZnO@0.05 decreased, suggesting a lower rate of electron and hole recombination.
 |
| | Fig. 5 PL (a) and EIS (b) spectra of the prepared photocatalysts, and M–S plots of ZnO and NiCo2O4 (c and d). | |
The electrochemical impedance spectra (EIS) were used to elucidate the charge carrier transport pathways. For the NiCo2O4/ZnO@0.05 electrode, the Nyquist plot showed the shortest arc radius, indicating a quicker charge shift via the electrode interface compared with other electrodes (Fig. 5b). The decline in the semicircle diameter indicates the enhanced mobility of charge carriers towards the interface and the decrease in resistance.38 The shortest arc radius for the NiCo2O4/ZnO@0.05 electrode conclusively suggests that the presence of a relatively low content of ZnO in the composite is effective in promoting the charge-carrier separation dynamics and offers the smooth migration of the charge carriers.
Mott–Schottky (M–S) plots were assessed using an impedance potential test at 10 kHz in a dark environment to address the electronic bandgap structure, semiconductor conductivity, and flat band potential.39 The M–S plot is composed of 1/C2vs. applied potential, where C stands for the semiconductor space charge capacitance.
The obtained flat band potential values were found to be −0.34 and −0.24 V for the NiCo2O4 and ZnO electrodes (Fig. 5c and d), respectively. By comparing the M–S plot and the bandgap values, the relative positions of the CB and VB of the NiCo2O4 and ZnO structures were examined (eqn (2) and (3)).
where
EVB and
ECB are the VB and CB edge potentials, respectively,
EFB is the flat band potential and
Eg is the semiconductor bandgap energy. The corresponding energy band locations in NiCo
2O
4 and ZnO determine the interfacial structure in NiCo
2O
4/ZnO@0.05. The potential values were calculated with Ag/AgCl electrodes as a reference. To convert the potential values to the standard scale, the following equation was used (
eqn (4)).
39,40| | | ENHE = EAg/AgCl + E0Ag/AgCl, | (4) |
where
E0(Ag/AgCl) = 0.197
V, the pH of the electrolyte was 7 at 25 °C and
EAg/AgCl is the working potential from the M–S plot. Accordingly, the calculated CB potentials are −0.24 and −0.14 V
vs. normal hydrogen electrode (NHE) for NiCo
2O
4 and ZnO, respectively. Similarly, the VB potentials derived from the values of CB and
Eg are found to be 1.05 and 3.08 V
vs. NHE for NiCo
2O
4 and ZnO, respectively.
3.6. X-ray photoelectron spectroscopy (XPS)
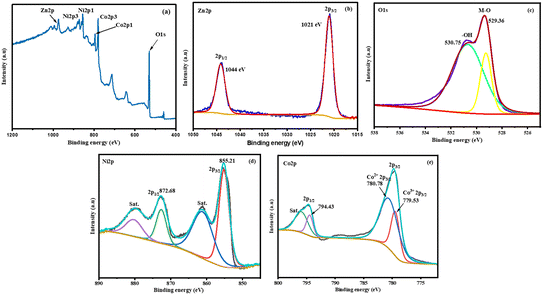
The survey spectrum displays the presence of Zn, Ni, Co and O elements in NiCo2O4/ZnO@0.05 (Fig. 6a). The deconvoluted high-resolution core-level Zn 2p XPS spectrum of NiCo2O4/ZnO@0.05 shows a doublet of Zn 2p1/2 and Zn 2p3/2, with the binding energies (B.E.) of 1044 and 1021 eV, respectively, and a difference in the B.E. of 23 eV, suggesting a +2 oxidation state (Fig. 6b).41 In the O 1s spectrum, the peak located at 529.36 eV is assigned to the metal–oxygen bond, and that at 530.75 eV is usually associated with defects and OH− adsorption (Fig. 6c).42 For Ni 2p, the peaks appeared at 872.75 and 855.21 eV, corresponding to 2p1/2 and 2p3/2, respectively, confirming the existence of Ni2+, and two satellite peaks can be observed at 879.29 and 861.25 eV (Fig. 6d). Fig. 6e shows Co 2p with a B.E. of 780.78 and 779.53 eV, corresponding to the Co2+ and Co3+ oxidation states of Co 2p3/2, respectively. The B.E. of 794 and 795.90 eV exhibits overlapping Co 2p1/2 components and non-defined satellite peaks. The Co 2p was deconvoluted for the Co2+ and Co3+ oxidation states using the CASAXPS software. Furthermore, the Co2+:Co3+ ratio was 6.6:3.4, and the percentage of Co2+ and Co3+ metal ions was found to be 66% and 34%, respectively. The relative ratio for the Ni2+/Ni3+ ions is difficult to calculate since Ni 2p has only Ni2+ in NiCo2O4/ZnO@0.05.
 |
| | Fig. 6 XPS survey spectra of NiCo2O4/ZnO@0.05 (a). High-resolution deconvoluted XPS spectra of Zn 2p (b), O 1s (c), Ni 2p (d), and Co 2p (e). | |
3.7. Zeta potential
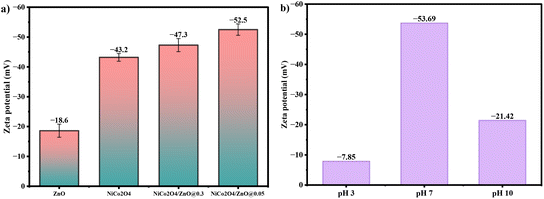
The 300 mL quartz glass gas reactor contained 250 mL of a 10 ppm MB solution, and the initial pH was found to be 6.8. The zeta potential verified at a specific pH of 6.8 was used to examine the stability of the prepared photocatalysts (Fig. 7). Three cycles of the zeta potential investigations were conducted at 25 °C. Each sample was ultrasonically homogenized for 30 s before the measurements. The prepared ZnO, NiCo2O4, NiCo2O4/ZnO@0.3 and NiCo2O4/ZnO@0.05 were found to have varying zeta potentials of −43.2, −18.6, −47.3, and −52.5 mV at pH 6.8, respectively. The increased charge density prompted the NiCo2O4/ZnO composites to shift to higher negative values in comparison to bare ZnO and NiCo2O4. The relatively neutral nanoparticles have zeta potentials between −10 and +10 mV, whereas the strongly cationic and strongly anionic nanoparticles have zeta potentials larger than +30 mV and less than −30 mV, respectively.43 A strong anionic behavior is indicated by the relatively high negative Zeta potentials of −47.3 and −52.5 mV for NiCo2O4/ZnO@0.3 and NiCo2O4/ZnO@0.05, respectively. This improves the adsorption interaction between MB and NiCo2O4/ZnO@0.05. Further, the zeta potential of NiCo2O4/ZnO@0.05 was recorded at different pH values of 3, 7 and 10. At pH 7, degradation is prolonged compared to the case at pH values of 3 and 10; this is due to the high negative charges on the surface of NiCo2O4/ZnO@0.05 that facilitate the degradation of cationic MB dyes.
 |
| | Fig. 7 a) Zeta potentials of ZnO, NiCo2O4, NiCo2O4/ZnO@0.3 and at pH 6.8 and b) zeta potentials of NiCo2O4/ZnO@0.05 at pH 3, 7 and 10. | |
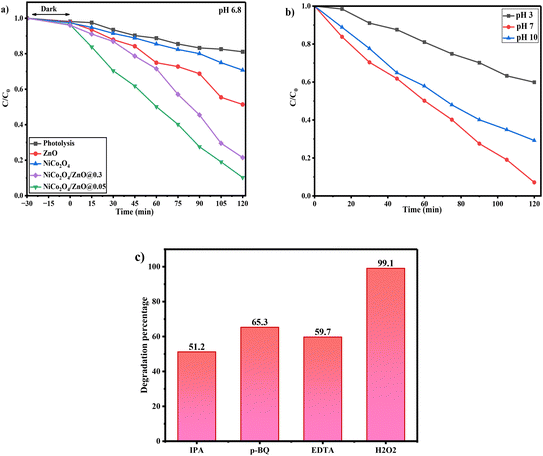
3.8. Photocatalytic activity
The ZnO, NiCo2O4, NiCo2O4/ZnO@0.3 and NiCo2O4/ZnO@0.05 photocatalysts were examined for the photocatalytic degradation of MB under visible light illumination for 120 min (Fig. 8a). The adsorption–desorption equilibrium was reached by stirring the aqueous suspension for 30 min prior to the illumination of the light source. The degradation rate for pure ZnO and NiCo2O4 was restrained because of the recombination of photogenerated charge carriers, and the binary composites of NiCo2O4/ZnO@0.3 and NiCo2O4/ZnO@0.05 exhibited enhanced activities of 78.53% and 89.15%, respectively. The resulting heterostructure, with its broad light-responsive property and enhanced photon absorption, improved the activity. The electrons from the CB of NiCo2O4 go to the CB of ZnO, and these electrons trap the oxygen molecule and generate a superoxide radical, which allows the MB dye to be oxidized. Co and Ni ions are transition metal ions that can exist in multiple oxidation states. Additionally, ground-state and photoexcited-state molecules will have distinct capacities for absorbing or donating electrons. Depending on whether the electron is being donated or accepted, both of these ions can exist in +3/+2 oxidation states. During the photochemical reactions, the photogenerated electrons that are trapped by either Co3+ or Ni2+ ions change this electronic configuration, and the ions will either trap or detrap the electrons. The reactive species that are involved in the degradation of MB are generated by the Co2+ ions or the Co3+ ions (eqn (5)–(10)).| | | NiCo2O4/ZnO + hv → NiCo2O4/ZnO(e− − h+), | (5) |
| | | NiCo2O4(h+) + HO− → ˙OH + NiCo2O4, | (6) |
| | | ZnO(e−) + Co3+ → Co2+ + ZnO, | (8) |
| | | Co2+ + H2O → Co3+ + ˙OH2 + e−, | (9) |
| | | ˙OH2 + e− → ˙OH + H+. | (10) |
 |
| | Fig. 8
C/C0 plot for the degradation of MB over a) ZnO, NiCo2O4, NiCo2O4/ZnO@0.3 and NiCo2O4/ZnO@0.05 at pH 6.8 and b) at different pH (3, 7 and 10) values. c) Trapping experiment in the presence of NiCo2O4/ZnO@0.05. | |
3.9. Effect of pH on the photocatalytic activity of the NiCo2O4/ZnO@0.05 composite
The rate of the photocatalytic degradation is significantly influenced by the pH of the aqueous suspension. However, the photocatalytic responses of NiCo2O4/ZnO@0.05 were investigated at three distinct pH levels (3, 7 and 10). Relatively high efficiency for the NiCo2O4/ZnO@0.05 composite was observed at pH 7. This results in a relatively high negative value, improved MB dye adsorption, and strong electrostatic attraction for the degradation of the cationic MB dye (Fig. 8). At the ideal pH of 7, the recombination of the photogenerated electron–hole pair is reduced. The degradation processes are fueled by the more reactive species of ˙OH and ˙O2− as a consequence. Additionally, the OH− ions in the solution are well-balanced, which makes it easy for the h+ to react and produce ˙OH radicals (eqn (11)).Moreover, the substantial drop in the degradation rate at pH 3 is caused by the excess H+ ions in the solution, which act as hydroxyl radical scavengers and restrict the oxidation efficiency (eqn (12)). The surface of NiCo2O4/ZnO@0.05 becomes positively charged, and MB is already a cationic dye; thus, the adsorption is reduced and electrostatic repulsion is yielded.At pH 10, excess Co3+ ions coagulate, and these coagulated Co3+ ions prevent the regeneration of Co2+ ions, which is required for sustaining the cyclic photocatalytic activity. The large number of OH− ions quench photogenerated charge carriers, while Co2+/3+ ions precipitate as hydroxide in the aqueous reaction media at high pH values. Additionally, surface hydroxylation may diminish active sites, leading to a recombination and a decrease in photocatalytic activities.
The rate of MB degradation dramatically increased with the addition of H2O2 to the reaction system. The photocatalytic activity of NiCo2O4/ZnO@0.05 was accelerated by the addition of H2O2 for the degradation of MB. The heterostructure trapping/detrapping oxidation states of Co3+/Co2+ affect the generation of ˙OH, and when the ˙OH interacts with H2O2, ˙OOH is produced. Conversely, a combination of NiCo2O4/ZnO@0.05 with EDTA, IPA and p-BQ decreases the photocatalytic degradation because of the trapping of h+, ˙OH, and ˙O2− (eqn (13)–(16)). Fig. 8c reveals that ˙OH radicals play a crucial role in the degradation of MB.
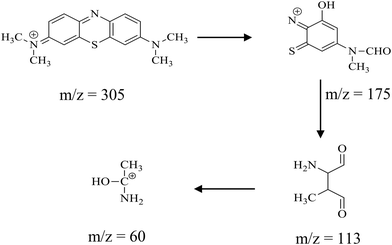
The degradation intermediates of the MB dye were analysed using the LC-MS technique for the degradation intervals of 0, 30, 60 and 120 min. During this analysis, various intermediate products were detected, identifiable by their distinct m/z values in the mass spectra (Fig. S2). The parent MB dye, with a standard m/z of 284, undergoes fragmentation due to high-energy electron exposure. A notable intermediate at m/z 305 suggests the formation of addition products during the initial photodegradation. A peak at m/z 175 corresponds to the removal of phenyl ring-substituted N,N-dimethyl groups with an m/z value of 113. Further, the desulfurization and breakdown of an aromatic ring to a hydroxyethylamine fragment (m/z 60) are observed. These transitions help trace the degradation pathway of the MB dye (Scheme 1).
 |
| | Scheme 1 Schematic of the photocatalytic MB degradation pathway. | |
The reusability of NiCo2O4/ZnO@0.05 was tested by recovering the catalysts after each experiment, washing them three times with distilled water, and drying for two hours at 60 °C. A gradual decline in the MB degradation was observed, dropping from 92.85% in the first cycle to 79.67% after three cycles for NiCo2O4/ZnO@0.05 (Fig. S3) and (Table 2).
| | | NiCo2O4(h+) + H2O2 → ˙OH + OH− + NiCo2O4, | (13) |
| | | ZnO(e−) + H2O2 → ˙OH + OH− + ZnO, | (14) |
| | | H2O2 + ˙OH → ˙OOH + H2O, | (15) |
| | | NiCo2O4/ZnO(e− + h+) + ˙OH + IPA → IPA+ + OH− + NiCo2O4/ZnO. | (16) |
Table 2 Photocatalytic degradation, rate constant and photonic efficiency of all the prepared photocatalysts
| Photocatalyst |
Visible light illumination |
| Degradation (%) |
Rate constant k (min−1) |
Photonic efficiency (×10−8) |
| NiCo2O4 |
25.04 |
0.0024 |
2.85 |
| ZnO |
48.60 |
0.0055 |
5.54 |
| NiCo2O4/ZnO@0.3 |
78.53 |
0.0128 |
8.95 |
| NiCo2O4/ZnO@0.05 |
89.78 |
0.0190 |
10.20 |
| NiCo2O4/ZnO@0.05 (pH 7) |
92.85 |
0.0219 |
10.60 |
| NiCo2O4/ZnO@0.05 (pH 3) |
40.12 |
0.0042 |
4.57 |
| NiCo2O4/ZnO@0.05 (pH 10) |
70.81 |
0.0102 |
8.07 |
4. Conclusion
The NiCo2O4/ZnO composites are synthesized using a precipitation method. A strong synergetic interaction exists at the interface of the NiCo2O4/ZnO@0.05 composite, which significantly improves the visible light absorption and charge carrier separation. At pH 7, there is an increase in the photocatalytic activity, which supports the rate constant and photonic efficiency. The high photocatalytic activity of NiCo2O4/ZnO@0.05 for the degradation of MB can be attributed to the high zeta potential and superior adsorption. At pH 3, more H+ ions are present in the solution, which inhibit the generation of reactive species, while at pH 10, cobalt precipitates as oxyhydroxides, lowering the concentration of the hydroxyl free radicals. The strong photocatalytic performance of the NiCo2O4/ZnO@0.05 photocatalyst is evidenced by its low resistance and low PL emission. ZnO can effectively absorb the photogenerated holes, quickly migrate to the surface of NiCo2O4, and separate electron–hole pairs from the heterostructure. The degradation efficiency of MB decreases by 13.18% after 3 cycles under visible light, implying that this photocatalyst has good stability. According to these experimental results, the possible photocatalytic pathways for MB degradation over NiCo2O4/ZnO composites under visible light have been proposed for environmental applications.
Conflicts of interest
All the authors declare no conflict of interest.
Data availability
No data has been reproduced from AI and ChatGPT-based tools. The Origin software was used for plotting the all the Figures. All the data are included in this manuscript and its supplementary information (SI) files.
Supplementary information is available. See DOI: https://doi.org/10.1039/d5lf00226e.
Acknowledgements
The authors would like to thank the Department of Chemistry and Centre for Nano and Functional Materials, RRC, REVA University (RU/R&D/SEED/CHE/2023/20). The authors are grateful to Dr. Sakthivel K for providing valuable inputs in electrochemical measurements.
References
- M. Danouche, H. EL Arroussi and N. El Ghachtouli, Environ. Sustainability, 2021, 4, 5–22 CrossRef CAS.
- H. Wu, L. Li, S. Wang, N. Zhu, Z. Li, L. Zhao and Y. Wang, Phys. Chem. Chem. Phys., 2023, 25, 25899–25924 RSC.
- M. A. Ahmed and A. A. Mohamed, RSC Adv., 2023, 13, 421–439 RSC.
- M. Abid, T. M. Howayek, O. Mazur, R. Viter, C. Badie, Z. E. Charif, A. A. Nada, D. Bezzerga, J. Hong, L. Santinacci, P. Miele, I. Iatsunskyi, E. Coy, G. Lesage, R. Habchi, D. Cornu and M. Bechelany, Adv. Powder Technol., 2025, 36, 104991 CrossRef CAS.
- M. Abid, T. M. Howayek, O. Mazur, R. Viter, M. F. Bekheet, A. A. Nada, D. Bezzerga, J. Hong, P. Miele, I. Iatsunskyi, E. Coy, G. Lesage, R. Habchi, D. Cornu and M. Bechelany, Colloids Surf., A, 2025, 709, 136077 CrossRef CAS.
- H. E. Gomaa, H. H. El-Maghrabi, F. A. Gomaa, P. Raynaud and A. A. Nada, Int. J. Hydrogen Energy, 2024, 86, 1010–1019 CrossRef CAS.
- H. H. El-Maghrabi, S. A. Younis, H. R. Ali and A. A. Nada, J. Environ. Chem. Eng., 2023, 11, 109477 CrossRef CAS.
- W. Raza, S. Mohammad Faisal, M. Owais, D. Bahnemann and M. Muneer, RSC Adv., 2016, 6, 78335–78350 RSC.
- D. Chen, Z. Wang, T. Ren, H. Ding, W. Yao, R. Zong and Y. Zhu, J. Phys. Chem. C, 2014, 118, 15300–15307 CrossRef CAS.
- N. M. Flores, U. Pal, R. Galeazzi and A. Sandoval, RSC Adv., 2014, 4, 41099–41110 RSC.
- N. Güy and M. Özacar, J. Photochem. Photobiol., A, 2019, 370, 1–11 CrossRef.
- X. Fu, M. Xie, P. Luan and L. Jing, ACS Appl. Mater. Interfaces, 2014, 6, 18550–18557 CrossRef CAS PubMed.
- J. Luo, Z. Yan, R. Liu, J. Xu and X. Wang, RSC Adv., 2017, 7, 23246–23254 RSC.
- Z. Zhu, F. Guo, Z. Xu, X. Di and Q. Zhang, RSC Adv., 2020, 10, 11929–11938 RSC.
- V. Jadhav, P. Chikode, G. Nikam and S. Sabale, Mater. Today: Proc., 2016, 3, 4121–4127 Search PubMed.
- Y. Li, Y. Li, Y. Yin, D. Xia, H. Ding, C. Ding, J. Wu, Y. Yan, Y. Liu, N. Chen, P. K. Wong and A. Lu, Appl. Catal., B, 2018, 226, 324–336 CrossRef CAS.
- B. Janani, A. Syed, A. M. Thomas, S. Al-Rashed, A. M. Elgorban, L. L. Raju and S. S. Khan, Phys. E, 2021, 130, 114664 CrossRef CAS.
- M. Jiang, J. Luo, M. Qiu, K. Peng, G. Wang, Y. Wang, X. Chen, Y. Wu and W. Liu, Biomass Bioenergy, 2025, 200, 108042 CrossRef CAS.
- T. Veeramani, C. Venkataraju, G. Ramesh, A. Dinesh, L. Gnanasekaran, R. P. Patil and M. Ayyar, Inorg. Chem. Commun., 2025, 171, 113615 CrossRef CAS.
- M. J. Enayat, J. Mater. Sci.: Mater. Electron., 2018, 29, 1510–1516 CrossRef CAS.
- S. Ali Hosseini Moradi, Chem. Phys., 2024, 587, 112396 CrossRef CAS.
- S. Liu, D. Ni, H.-F. Li, K. N. Hui, C.-Y. Ouyang and S. C. Jun, J. Mater. Chem. A, 2018, 6, 10674–10685 RSC.
- Y. Mouhib, M. Belaiche, M. Elansary, M. A. Lemine, B. Salameh and A. K. M. Alsmadi, New J. Chem., 2023, 47, 4888–4896 RSC.
- M. Bilal, A. Altaf, E. Bint-E-Khalid, H. Komal Zafar, N. Tahir, A. Nafady, M. A. Wahab, S. S. Ahmad Shah, T. Najam and M. Sohail, RSC Adv., 2023, 13, 23547–23557 RSC.
- W. Zhang, Y. Su, X. Zhang, Y. Yang and X. Guo, RSC Adv., 2016, 6, 64626–64633 RSC.
- T. Zhang, K. Yang, C. Wang, S. Li, Q. Zhang, X. Chang, J. Li, S. Li, S. Jia, J. Wang and L. Fu, Adv. Energy Mater., 2018, 8, 1801690 CrossRef.
- S. Chakrabarty, A. Mukherjee and S. Basu, ACS Sustainable Chem. Eng., 2018, 6, 5238–5247 CrossRef CAS.
- Q. Yue, T. Liu, Y. Mu, X. Chen and X.-T. Yin, Sens. Actuators, B, 2024, 410, 135666 CrossRef CAS.
- B. Brahimi, E. Mekatel, Y. Kadmi, M. Mellal, O. Baaloudj, M. Belmedani and M. Trari, Optik, 2022, 258, 168933 CrossRef CAS.
- L. He, Z. Tong, Z. Wang, M. Chen, N. Huang and W. Zhang, J. Colloid Interface Sci., 2018, 509, 448–456 CrossRef CAS PubMed.
- C. Hao, S. Zhou, J. Wang, X. Wang, H. Gao and C. Ge, Ind. Eng. Chem. Res., 2018, 57, 2517–2525 CrossRef CAS.
- J. Fan, W. Xing, Y. Huang, J. Dai, Q. Liu, F. Hu and G. Xu, J. Alloys Compd., 2020, 821, 153491 CrossRef CAS.
- S. Khalid, C. Cao, A. Ahmad, L. Wang, M. Tanveer, I. Aslam, M. Tahir, F. Idrees and Y. Zhu, RSC Adv., 2015, 5, 33146–33154 RSC.
- O. C. Pore, A. V. Fulari, C. D. Chavare, D. S. Sawant, S. S. Patil, R. V. Shejwal, V. J. Fulari and G. M. Lohar, Chem. Phys. Lett., 2023, 824, 140551 CrossRef CAS.
- S. Mangrio, A. Tahira, I. A. Mahar, M. Parveen, A. A. Hullio, D. A. Solangi, A. Khawaja, M. A. Bhatti, Z. A. Ibupoto, A. B. Mallah, A. Nafady, E. A. Dawi, A. Al Karim Haj Ismail, M. Emo, B. Vigolo and Z. H. Ibupoto, J. Nanopart. Res., 2023, 25, 195 CrossRef CAS.
- G. He, L. Wang, H. Chen, X. Sun and X. Wang, Mater. Lett., 2013, 98, 164–167 CrossRef CAS.
- D. Chu, Y. Masuda, T. Ohji and K. Kato, Langmuir, 2010, 26, 2811–2815 CrossRef CAS PubMed.
- J. Wang, F.-Y. Su and W.-D. Zhang, J. Solid State Electrochem., 2014, 18, 2921–2929 CrossRef CAS.
- K. Kalidasan, S. Mallapur and S. G. Kumar, J. Environ. Chem. Eng., 2024, 12, 113054 CrossRef CAS.
- A. A. Nada, B. O. Orimolade, H. H. El-Maghrabi, B. A. Koiki, M. Rivallin, M. F. Bekheet, R. Viter, D. Damberga, G. Lesage, I. Iatsunskyi, E. Coy, M. Cretin, O. A. Arotiba and M. Bechelany, Appl. Mater. Today, 2021, 24, 101129 CrossRef.
- M. Claros, M. Setka, Y. P. Jimenez and S. Vallejos, Nanomaterials, 2020, 10, 471 CrossRef CAS PubMed.
- Z. Xu, X. Li, S. Sun, Z. Wei, H. Li and S. Yin, Energy Fuels, 2021, 35, 9692–9704 CrossRef CAS.
-
J. D. Clogston and A. K. Patri, in Characterization of Nanoparticles Intended for Drug Delivery, ed. S. E. McNeil, Humana Press, Totowa, NJ, 2011, pp. 63–70 Search PubMed.
|
| This journal is © The Royal Society of Chemistry 2026 |
Click here to see how this site uses Cookies. View our privacy policy here. 
 Open Access Article
 This Open Access Article is licensed under a Creative Commons Attribution-Non Commercial 3.0 Unported Licence
 *
*


