A spectral microsensor applied in LIBS for heavy metal detection in water
Received
9th September 2025
, Accepted 27th October 2025
First published on 17th December 2025
Abstract
Heavy metal pollution in water poses a significant challenge in the field of environmental monitoring, representing a serious threat to both ecological systems and public health. Laser-Induced Breakdown Spectroscopy (LIBS) has emerged as an effective tool for monitoring trace heavy metal contaminants in water due to its rapid response, in situ detection capability, minimal sample preparation requirements, and simultaneous multi-element analysis. However, conventional LIBS systems typically rely on large and costly spectrometers as core detection devices, which limits their widespread application in field-based and long-term online water quality monitoring. To address these limitations, this study proposes a compact spectral acquisition system based on a miniature spectral sensor combined with ultra-narrowband filters. By optimizing the optical structure and signal acquisition pathway, the system significantly reduces both the size and cost of the equipment. Experimental results demonstrate that, compared to traditional spectrometer systems, the proposed miniaturized system achieves a reduction in volume by three orders of magnitude and a cost reduction of approximately two orders of magnitude. In terms of detection performance, the optimized design incorporating ultra-narrowband filters enables the system to achieve a significantly lower detection limit for Ca, reaching as low as 26.9% of that obtained with conventional systems, demonstrating excellent sensitivity. For practical applications, the detection limits for heavy metal elements such as Pb and Cu meet the requirements of relevant national standards, while high sensitivity and stability are maintained. This study provides a portable, economical, and efficient solution for LIBS-based detection of heavy metals in water, substantially advancing the potential of LIBS technology for practical environmental monitoring applications, particularly in scenarios requiring on-site rapid screening and long-term online monitoring.
1. Introduction
Heavy metal pollution in water bodies poses severe threats to human health due to its persistence, bioaccumulation, and toxicity even at trace levels, making it a global challenge in environmental governance.1–3 These pollutants enter aquatic environments through industrial discharges, agricultural irrigation, and other pathways, not only damaging aquatic ecosystems but also accumulating in the human body through the soil–crop–food chain transfer, leading to chronic poisoning, organ damage, and even carcinogenic risks.4,5 Compared to major elements, the concentrations of heavy metals in water are limited. However, the quantity of heavy metals required to regulate metabolic processes in animal species is much lower. Therefore, heavy metal concentrations have been proven to be of the greatest ecotoxicological significance.6 Although traditional detection techniques such as atomic absorption spectroscopy (AAS)7,8 and inductively coupled plasma mass spectrometry (ICP-MS)9,10 offer high detection accuracy, they generally require complex sample pretreatment and laboratory conditions, making in situ and rapid detection difficult.
Laser-induced breakdown spectroscopy (LIBS), as an advanced spectroscopic analysis technique, utilizes high-energy pulsed laser interaction with samples to generate high-temperature plasma, and achieves qualitative and quantitative elemental detection through the characteristic spectra emitted during plasma cooling.11 With advantages such as no need for complex sample preparation, capability for simultaneous multi-element detection, and broad applicability to solid,12 liquid,13,14 and gaseous15 samples, LIBS holds significant application value in environmental monitoring,16,17 industrial process control,18,19 and space exploration.20,21
However, the practical promotion of this technology in the detection of heavy metals in water bodies faces dual constraints from traditional spectrometers: firstly, traditional spectrometers are bulky, which is not conducive to field deployment; secondly, high-performance equipment is costly, driving up system expenses.22–24 Existing miniaturization solutions also have obvious shortcomings—miniature spectrometers (such as Hamamatsu C12880MA) have low resolution and are susceptible to spectral interference, while high-sensitivity detectors (Such as PMT/H11526-20-NF, APD/DET10A2) are expensive and have limited dynamic range, making it difficult to meet both high and low concentration detection requirements. These schemes often struggle to balance performance (e.g., resolution, dynamic range) and cost, where high-performance detectors are expensive, and low-cost miniature spectrometers often sacrifice spectral resolution and anti-interference ability. To address these issues, this study proposes a novel detection scheme combining a miniature spectral sensor with bandpass filters.
The schematic diagram of the micro-spectrum sensor AS7331 is shown in Fig. 1a. This sensor is a low-power, low-noise integrated optical device specifically designed for ultraviolet spectral detection. It features three independent detection channels covering the following wavelength ranges: Channel A (320–400 nm), Channel B (280–320 nm), and Channel C (200–280 nm). Fig. 1b displays the spectral responsivity of each channel. This parameter reflects the sensitivity of the sensor to optical signals of different wavelengths, defined as the output electrical signal strength per unit incident optical power.
 |
| | Fig. 1 (a) Schematic diagram of spectral microsensor AS7331, (b) spectral responsivity of the AS7331, (c) schematic diagram of the Avantes spectrometer, and (d) efficiency curve of the Avantes spectrometer. | |
The AS7331 employs UV-optimized photodiode design, enabling direct conversion of optical radiation signals into digital outputs and supports both continuous acquisition and external triggering modes. While maintaining excellent performance, the market price of the AS7331 micro-spectral sensor has been reduced by two orders of magnitude, and its package size is as compact as 3.65 × 2.6 × 1.09 mm. During actual spectral acquisition, plasma emission passes through specific optical filters that remove interfering wavelengths, allowing only the characteristic spectral lines of the target elements to be received by the sensor, thereby effectively enhancing signal specificity.
It is currently the smallest and lowest-cost acquisition system in the field of LIBS, with its core advantages closely aligning with the key requirements for cost reduction and miniaturization of sensors in LIBS-based heavy metal detection in water. Fig. 1c and d show the schematic diagram and efficiency curve of a traditional spectrometer commonly used in LIBS systems. The latter characterizes the efficiency with which the spectrometer converts incident photons into electrical signals at different wavelengths. By comparison, it can be seen that the AS7331 micro-spectral sensor system not only effectively overcomes the limitations of high cost and large size of traditional equipment, significantly enhancing the economic efficiency and portability of the system, but also provides flexible and efficient technical support for practical applications such as field environmental monitoring and industrial on-site detection. This greatly improves the capability for real-time on-site detection and promotes the widespread application of this technology in mobile monitoring, in situ analysis, and other scenarios.
2. Experimental setup and samples
2.1 Experimental setup
Fig. 2 shows a schematic diagram of the experimental setup, which consists of a laser irradiation system and a data acquisition system. The laser irradiation system employs a Nimma-400 laser (Beijing Lei Bao Optoelectronics Technology Co., Ltd) with a fundamental wavelength of 1064 nm, equipped with a frequency-doubling module to achieve 532 nm laser output. The laser energy was set to 100 mJ. The acquisition setup is divided into two parts: a conventional spectral acquisition setup and an AS7331-based spectral acquisition setup. In the conventional setup, plasma light is collected and directed into a Czerny–Turner spectrometer (Avantes, model AvaSpec-ULS-4096CL-EVO, Netherlands) via a combination of two plano-convex lenses (f = 75 mm, LBTEK Co., Ltd) and an optical fibre. The AS7331 spectral acquisition system uses optical lenses consistent with those in the spectrometer setup. A narrow-band filter for the target element is installed between the two focusing lenses. Both acquisition systems are triggered by a digital delay generator (HCLDG, Wuhan Huachuang Zhilian Optoelectronics Co., Ltd).
 |
| | Fig. 2 Schematic diagram of the experimental setup. | |
2.2 Samples
Prior to the experiment, standard aqueous solutions of Ca, Pb, and Cu were prepared by appropriately diluting 1000 mg L−1 standard solutions of Ca (GSB 04-1720-2004), Pb (GSB 04-1742-2004), and Cu (GSB 04-1725-2004). The specific concentrations of the solutions are detailed in Table 1.
Table 1 Ca, Pb and Cu concentrations of prepared standard solutions
| Sample no. |
1# |
2# |
3# |
4# |
5# |
6# |
| Ca (µg L−1) |
10 |
20 |
40 |
60 |
70 |
80 |
| Pb (µg L−1) |
250 |
500 |
1000 |
2000 |
3000 |
4000 |
| Cu (µg L−1) |
5 |
10 |
20 |
40 |
60 |
80 |
The sample pretreatment procedure is illustrated in Fig. 3a. A high-purity Si substrate was selected as the deposition substrate, primarily due to its low elemental background signal within the target spectral range and excellent thermal conductivity. A 10 µL aliquot of the solution was deposited onto a Si substrate. The substrate was then placed on a hotplate and dried at 70 °C to form a thin film containing the analytes on the silicon substrate.
 |
| | Fig. 3 (a) Preparation method of experimental samples, (b) scanning heatmap. | |
The dried samples were scanned using a 10 × 10 grid pattern with a 0.5 mm step size. For each concentration level, five droplets were prepared, and the signal intensities from the 100 spectra acquired per droplet were averaged, resulting in one data point per droplet and a total of 500 spectra per concentration. Fig. 3b displays the spectral intensity distribution of the Cu I 324.75 nm line at a concentration of 80 µg L−1.
2.3 Evaluation metric
In quantitative analysis, the performance of the calibration curve is typically evaluated comprehensively using multiple evaluation metrics, including the coefficient of determination (R2), root mean square error (RMSE), mean absolute error (MAE), and average relative error (ARE). The calculation formulas for these metrics are as follows:| |  | (1) |
| | 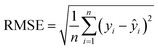 | (2) |
| | 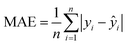 | (3) |
| |  | (4) |
where yi is the true concentration value of the measured sample, ŷi is the predicted concentration value of the measured sample, and n is the number of samples. The coefficient of determination (R2) is used to measure the model's ability to explain the variation of the dependent variable. A value closer to 1 indicates a better model fit. Root Mean Square Error (RMSE) measures the deviation between predicted and true values and is sensitive to large deviations; a smaller value indicates more accurate model predictions. Mean Absolute Error (MAE) measures the average absolute deviation between predicted and true values; a smaller value reflects more accurate model predictions. Average Relative Error (ARE) represents the average proportion of prediction error relative to the true value; a smaller value indicates better control of relative error in the model.
Additionally, Limit of Detection (LOD) is a key parameter in analytical chemistry, representing the lowest concentration of a given element that can be reliably detected by an analytical technique. The traditional calculation formula is:
| |  | (5) |
where
σ is the standard deviation of the LIBS signal for samples with zero analyte concentration, and
b is the slope (sensitivity) of the calibration curve. However, the traditional calculation formula fails to account for Type II errors, as 50% of the detection limit concentration would be misjudged as blank, leading to an underestimation of the detection limit. A study by researcher Palleschi proposed a modified LOD calculation formula adapted to the characteristics of LIBS data:
25.
| |  | (6) |
| | 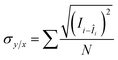 | (7) |
where
N represents the number of data points in the calibration curve. The term
σy/x is an estimate of the deviation of the signals
Îx from the value
I predicted by the calibration curve at that concentration, under the assumption of homoscedasticity (equal variance) of the signals near the critical limit of detection.
Ci are the concentrations of the standards and
![[C with combining macron]](https://www.rsc.org/images/entities/i_char_0043_0304.gif)
is the average of these concentrations. Consequently, compared to the traditional LOD formula, this formula is more suitable for LOD measurement.
3. Results and discussion
3.1 Parameter optimization
Prior to the formal experiment, an 80 µg L−1 Ca solution was used to optimize the acquisition delay and signal-to-background ratio parameters for both acquisition systems.
As shown in Fig. 4a and b, the signal-to-background ratio (SBR) increases with the acquisition delay. The Avantes spectrometer reaches its peak SBR at approximately 2.5 µs, while the AS7331 micro-spectral sensor achieves its peak at 2 µs. Beyond these points, the SBR decreases with further increases in acquisition delay. Therefore, the optimal acquisition delay is determined to be 2.5 µs for the Avantes spectrometer and 2 µs for the AS7331 micro-spectral sensor.
 |
| | Fig. 4 Optimization of acquisition delay for Ca detection using signal-to-background ratio (SBR): (a) Avantes spectrometer and (b) AS7331 spectral microsensor. | |
3.2 Comparison of calibration effects of ultra-narrowband filters
To evaluate the sensitivity improvement of the spectral micro-sensor acquisition system compared to traditional spectrometers, this experiment utilized an ultra-narrowband filter with a central wavelength of 393.44 nm and a bandwidth of 0.37 nm to calibrate the Ca solution. The characteristic spectral line of Ca and the corresponding efficiency curve of the filter are shown in Fig. 5a.
 |
| | Fig. 5 (a) Characteristic spectral lines of calcium and their corresponding filtering efficiency curves, and comparison of calibration results of (b) the Avantes spectrometer and (c) AS7331 spectral microsensors for Ca. The blue spectrum in the graph was acquired with an Avantes spectrometer, and the filter's transmittance curve was provided by the manufacturer. | |
After determining the optimal parameters, calibration experiments for Ca were conducted using two acquisition systems. Fig. 5b and c show the Ca calibration curves obtained with the Avantes spectrometer and the AS7331 micro-spectral sensor, respectively. Table 2 summarizes the evaluation parameters of the calibration curves for both systems. It can be observed that, compared to the spectrometer system, the micro-spectral sensor combined with an ultra-narrowband filter (bandwidth 0.37 nm) significantly improved all evaluation metrics for Ca and reduced the limit of detection (LOD) to 26.9% of that of the conventional spectrometer system. These results fully demonstrate that the micro-spectral sensor acquisition system is significantly superior to the traditional spectrometer system in terms of sensitivity. The primary reasons lie in its elimination of signal attenuation caused by optical components such as optical fibres, slits, and gratings, as well as its larger detector collection area, which collectively enhance signal collection efficiency.
Table 2 Comparison of calibration effect evaluation parameters for Ca
| Element |
Device |
R
2
|
RMSE (µg L−1) |
MAE (µg L−1) |
ARE (%) |
LOD (µg L−1) |
| Ca (0.37 nm) |
Avantes |
0.997 |
1.59 |
1.25 |
6.18 |
6.30 |
| AS7331 |
0.999
|
0.43
|
0.3
|
2.03
|
1.70
|
3.3 Application of heavy metal detection in water quality
In the practical application experiment for the detection of heavy metals in water, this study selected Pb and Cu as typical target elements for calibration experiments, both of which are common and representative heavy metal pollutants in water quality analysis. Considering the high cost of ultra-narrowband filters, ultra-narrowband filters were chosen in practical applications to balance system performance and cost-effectiveness. Specifically, a narrow bandpass filter with a centre wavelength of 405 nm and a bandwidth of 2 nm was used for the Pb calibration experiment; for the Cu calibration experiment, a filter with a centre wavelength of 325 nm and a bandwidth of 1.75 nm was employed. Fig. 6a and b respectively show the characteristic spectral lines of Pb and Cu and the transmission efficiency curves of their corresponding filters, demonstrating good spectral matching and filtering performance.
 |
| | Fig. 6 The characteristic spectral lines of (a) Pb and (b) Cu and their corresponding filter efficiency curves, and comparison of calibration results of (c) the Avantes spectrometer and (d) AS7331 spectral microsensors. The blue spectrum in the graph was acquired with an Avantes spectrometer, and the filter's transmittance curve was provided by the manufacturer. | |
Prior to the calibration experiments, the optimal acquisition delays for Pb and Cu were determined separately through parameter optimization. The Avantes spectrometer exhibited optimal delays of 3 µs for Pb and 4 µs for Cu, while the AS7331 spectral microsensor showed optimal delays of 4.5 µs for Pb and 5.5 µs for Cu. Calibration experiments for Pb and Cu were subsequently conducted using both acquisition systems under their respective optimized conditions. Fig. 6c and d present the calibration curves for Pb and Cu obtained from the two systems, respectively, while Table 3 summarizes the evaluation parameters of the corresponding calibration curves.
Table 3 Comparison of calibration effect evaluation parameters for Pb and Cu
| Element |
Device |
R
2
|
RMSE (µg L−1) |
MAE (µg L−1) |
ARE (%) |
LOD (µg L−1) |
| Pb (2 nm) |
Avantes |
0.994 |
95.04 |
87.29 |
10.34 |
387.42 |
| AS7331 |
0.998
|
56.12
|
50.64
|
7.4
|
196.18
|
| Cu (1.75 nm) |
Avantes |
0.995 |
2.39 |
1.85 |
19.32 |
9.86 |
| AS7331 |
0.998
|
1.12
|
0.95
|
7.15
|
4.57
|
The experimental results indicate that even with an increased filter bandwidth, the AS7331 micro-spectral sensor demonstrates superior calibration performance compared to the traditional spectrometer system. Its LOD was significantly reduced relative to the Avantes spectrometer, with the LOD for Pb and Cu decreasing to 50.63% and 46.34% of the latter, respectively. These results fully demonstrate that the AS7331 micro-spectral sensor acquisition system offers higher sensitivity in the detection of heavy metals in water, indicating its significant technical advantages and application potential in practical environments.
Fig. 7 Presents a comparative analysis of the Avantes spectrometer and the AS7331 miniature spectral sensor across several key evaluation metrics. Compared to the Avantes spectrometer, the AS7331 sensor demonstrates significant improvements in the performance of calibration curves for all tested elements, indicating superior detection accuracy and stability. This sensor system effectively meets the detection requirements for heavy metals Pb and Cu in water, with detection limits complying with relevant national standards: specifically, the detection limit for total Pb meets the 0.2 mg L−1 threshold stipulated in GB 5084-2021, and the detection capability for total Cu complies with the 1.0 mg L−1 limit specified in GB 5749-2022.
 |
| | Fig. 7 Comparison of various evaluation indicators between the Avantes spectrometer and AS7331 spectral microsensors. | |
The parameter comparison between the spectral microsensor acquisition system and the traditional spectrometer-based system is shown in Table 4. It can be observed that the spectral microsensor exhibits significant advantages in terms of cost, size, weight, power consumption, and data processing load. In contrast to conventional spectrometers, which are often hindered by bulky instrumentation, high cost, large energy consumption, and poor portability, the spectral microsensor greatly enhances system portability and practicality through its miniaturization, low power consumption, and low cost, making it more suitable for on-site rapid detection and mobile applications. Meanwhile, the system maintains a high level of detection sensitivity, sufficient to meet the requirements for heavy metal detection in water quality monitoring. In summary, employing a spectral microsensor as the acquisition system provides an efficient, economical, and easily deployable solution for heavy metal detection in water, achieving a favourable balance among portability, cost-effectiveness, and detection sensitivity.
Table 4 Comparison of basic indicators between spectrometer and AS7331 spectral microsensors
| Index |
Spectrometer |
AS7331 |
| Cost |
$ 103 |
$ 10 |
| Volume |
20 × 20 × 10 cm |
2 × 1 × 1 cm |
| Weight |
5–15 kg |
<100 g |
| Power consumption |
5–50 W |
<50 mW |
| Data processing volume |
Large |
Low |
It should be noted that while narrow-band filters were employed for the detection of Pb and Cu in this study, an ultra-narrowband filter was utilized for Ca detection. Despite the differences in filter bandwidth, the micro-sensor system demonstrated performance advantages across all scenarios. We anticipate that further improvements in detection limits (LODs) and other performance parameters could be achieved by adopting ultra-narrowband filters for Pb and Cu in future work, which represents a key direction for subsequent research.
4. Conclusion
This study proposes a portable and low-cost method for detecting heavy metals in water using LIBS based on the AS7331 spectral micro-sensor. The method replaces the traditional spectrometer-based acquisition system with a combination of a spectral sensor and optical filters. This approach reduces the size of the LIBS acquisition system to the cubic centimetre level and lowers the cost by more than two orders of magnitude. Furthermore, it significantly enhances the sensitivity of heavy metal detection. When combined with ultra-narrowband filters, the detection limit can be reduced to 26.9% of that achieved with traditional spectrometer-based acquisition systems. This provides a portable and economical solution for instruments designed to detect heavy metals in water.
Author contributions
Zixiao Wang: writing – original draft, investigation, data curation. Honghua Ma: conceptualization, writing – review & editing. Weihua Huang: writing – original draft, methodology. Lianbo Guo: conceptualization, writing – review & editing, resources. Wen Cheng: writing review & editing.
Conflicts of interest
There are no conflicts to declare.
Data availability
The data for this article can be found at https://github.com/wangzixiao1999/A-Spectral-Microsensor-Applied-in-LIBS-for-Heavy-Metal-Detection-in-Water_.git on GitHub.
Acknowledgements
This work is supported by National Key R&D Program of China (No. 2022YFE0118700) and National Natural Science Foundation of China (No. 62375101).
References
- S. Ali, S. K. Thakur, A. Sarkar and S. Shekhar, Environ. Chem. Lett., 2016, 14, 291–315 CrossRef CAS.
- S. S. Huang, Q. L. Liao, M. Hua, X. M. Wu, K. S. Bi, C. Y. Yan, B. Chen and X. Y. Zhang, Chemosphere, 2007, 67, 2148–2155 CrossRef CAS PubMed.
- Q. Wang and Z. Yang, Environ. Pollut., 2016, 218, 358–365 CrossRef CAS PubMed.
- R. Dong, Z. Jia and S. Li, Process Saf. Environ. Protect., 2018, 113, 275–281 CrossRef CAS.
- C. Tokatli, Environ. Earth Sci., 2021, 80, 156 CrossRef CAS.
- S. N. Mazhar and S. Ahmad, Groundwater Sustain. Dev., 2020, 10, 100304 CrossRef.
- T. M. Taiwo and T. O. Ogunbode, Front. Environ. Sci., 2025, 12, 1496960 CrossRef.
- F. Afolabi, J. T. Adeleke, G. O. Oyeleke, R. O. Opatokun-Saliu, O. Afolabi and T. K. Samson, Water, Air, Soil Pollut., 2025, 236, 678 CrossRef CAS.
- A. Kumar, A. Pandey, S. Kumar, M. Pandey, S. Sharma, A. Singh and A. Tripathi, J. Exp. Zool. India, 2025, 28, 991–997 Search PubMed.
- X. Gao, G. Han, S. Zhang and J. Zeng, Water, 2025, 17, 224 CrossRef CAS.
- R. S. Harmon and G. S. Senesi, Appl. Geochem., 2021, 128, 104929 CrossRef CAS.
- X. Niu, F. Guan, Z. Li, S. Fan, Z. Xiong, J. Nie, D. Zhang and L. Guo, Talanta, 2025, 293, 128106 CrossRef CAS PubMed.
- I. Goncharova, D. Guichaoua, S. Taboukhat, A. Tarbi, T. Chtouki, H. Erguig and B. Sahraoui, Spectrochim. Acta, Part B, 2024, 217, 106943 CrossRef CAS.
- Z. Yan, J. Shi, W. Huang, L. Guo, X. Niu and T. Lai, Microchem. J., 2024, 207, 112276 CrossRef CAS.
- Z. Ouyang, C. Niu, Y. Liu, Z. Hu and L. Guo, Talanta, 2025, 283, 127091 CrossRef CAS PubMed.
- Y. Zhang, T. Zhang and H. Li, Spectrochim. Acta, Part B, 2021, 181, 106218 CrossRef CAS.
-
S. S. Golik, O. A. Bukin, A. A. Il’in and V. I. Tsarev, in Laser Applications in Medicine, Biology, and Environmental Science, SPIE, 2003, vol. 5149, pp. 223–230 Search PubMed.
- M. Gaft, L. Nagli, Y. Groisman and A. Barishnikov, Appl. Spectrosc., 2014, 68, 1004–1015 CrossRef CAS PubMed.
- J. D. Pedarnig, S. Trautner, S. Gruenberger, N. Giannakaris, S. Eschlboeck-Fuchs and J. Hofstadler, Appl. Sci.-Basel, 2021, 11, 9274 CrossRef CAS.
- J.-H. Yang and J.-I. Yoh, J. Korean Soc. Aeronaut. Space Sci, 2020, 48, 479–487 Search PubMed.
- R. Shu, H. Qi, G. Lue, D. Ma, Z. He and Y. Xue, Chin. Opt. Lett., 2007, 5, 58–59 CAS.
- C. P. Bacon, Y. Mattley and R. DeFrece, Rev. Sci. Instrum., 2004, 75, 1–16 CrossRef CAS.
- P. K. Morgan, J. R. Scott and I. Jovanovic, Spectroc. Acta Pt. B-Atom. Spectr., 2016, 116, 58–62 CrossRef CAS.
- A. Li, C. Yao, J. Xia, H. Wang, Q. Cheng, R. Penty, Y. Fainman and S. Pan, Light-Sci. Appl., 2022, 11, 174 CrossRef CAS PubMed.
- F. Poggialini, S. Legnaioli, B. Campanella, B. Cocciaro, G. Lorenzetti, S. Raneri and V. Palleschi, Appl. Sci., 2023, 13, 3642 CrossRef CAS.
Footnote |
| † These authors contributed equally to this work. |
|
| This journal is © The Royal Society of Chemistry 2026 |
Click here to see how this site uses Cookies. View our privacy policy here. 
 *b and
Wen
Cheng
*a
*b and
Wen
Cheng
*a


