Optimization of extraction parameters for bioactive compounds from Sargassum cinereum using ultrasound-assisted extraction with insights into their chemical and nutritional composition
Received
26th November 2025
, Accepted 9th March 2026
First published on 10th March 2026
Abstract
Marine organisms, particularly macroalgae, are globally recognized as key sources of valuable biomolecules with applications in the agricultural and pharmaceutical sectors. They are also an inexpensive source in developing countries with high population density, such as India, where pressing demands conflict with the sustainable use of resources. The abundance of Sargassum spp. in India could provide an opportunity to create cost-effective marine-derived natural products, and the implementation of an optimized extraction and scaling process could contribute to overcoming sustainability issues. Thus, the present study examines the nutritional, mineral, and fatty acid composition of Sargassum cinereum J. Agardh from the Karnataka coast. Ultrasound-assisted extraction (UAE) was used to optimize the yield of bioactive compounds using the Response Surface Methodology (RSM) with the Box–Behnken design (BBD). Carbohydrates were the most abundant (53.15%) macronutrients, followed by fiber (20%) and protein (13.35%) on a dry-weight basis. Fatty acid composition showed abundance of palmitic acid, with a varied mineral composition, similar to other macroalgae already in use as a feed ingredient. RSM-BBD analysis underscored the impacts of solvent concentration, extraction time, and the solid-to-solvent ratio on the yields of total phenolic content, total flavonoid content, and antioxidant activity. The optimized parameters provide clear evidence of the interaction effect, presented through second-order polynomial equations. Although differences may arise depending on sample processing techniques, geographical variability, storage conditions, and the possible degradation of sensitive compounds, the data obtained herein highlight the need for future studies, given the potential of Sargassum spp., which grows abundantly, is nutritionally and chemically rich, and can be a high-value compound and used for multiple purposes.
Sustainability spotlight
Marine ecosystems, though vast and biodiverse, remain underutilized despite their immense potential to support emerging food resources and strengthen the blue economy. Seaweeds such as Sargassum cinereum offer sustainable alternatives to synthetic additives through their rich nutritional profile and diverse bioactive molecules, directly supporting goals related to health, nutrition, and responsible production. With rising global demand for natural antioxidants, optimizing green extraction methods, such as ultrasound-assisted extraction, enables the efficient, low-impact utilization of marine biomass. Exploring and valorizing abundant macroalgae along the Karnataka coast aligns strongly with SDGs on zero hunger, good health, sustainable industry, and the conservation of ocean resources, promoting a balanced and future-ready marine-based economy.
|
Introduction
Terrestrial ecosystems are far more explored and studied for their resources than marine habitats, which remain underexplored despite covering the majority (about 70%) of Earth's surface.1 Advancements in technology with respect to modern manned submersibles, remotely operated autonomous underwater and hybrid vehicles, gliders, landers, profilers, and scuba diving, has unlocked the scientific exploration of marine environments. At the same time, the growing interest in natural products to replace synthetic products towards health promotion and disease prevention has boosted the exploration of structurally diverse molecules from marine organisms for multiple purposes.2–4
Marine ecosystems are extremely rich in biodiversity and are composed of a complex community of interacting organisms, including bacteria, protozoans, algae, chromists, fungi, animals, and plants.5 Although the search for marine natural products has mainly focused on marine invertebrates, seaweeds have emerged as a promising and inexpensive source due to their abundance of bioactive compounds with high potential. Their ability to withstand adverse conditions, such as variations in salinity, pressure, light, and nutrient availability, together with the chemical defense mechanisms developed against predation, makes them highly interesting for producing structurally diverse and innovative bioactive compounds.6,7 In the marine environment, there are mainly two types of algae: microalgae (microscopic and mostly planktonic) and macroalgae, which are macroscopic and benthic in nature.8
Marine macroalgae are classified into green, brown and red algae based on their pigmentation and they are also called as seaweeds, due to their size, multicellular organization, and attachment to substrata.9 There are 1200 green, 2000 brown, and 6000 red microalgal species globally, associated with an estimated annual production of 6![[thin space (1/6-em)]](https://www.rsc.org/images/entities/char_2009.gif) 756521 tons of biomass and a global market value of US$ 5.5–6 billion per year. As India has a long coastline, around 11098 km with a 2.5 million km2 economic zone and 0.13 million km2 shelf area, that provides an opportunity for the blue economy, which has gained global attention.10–13 The Karnataka region covers 343 km of coastline in the West Central region of India, including estuaries and accessible coastlines. A recent study by Chippalakatti et al.14 revealed that Sargassum, Gracilaria, and Ulva spp. are abundant marine macroalgae in Karnataka with considerable economic potential. They are a significant source of minerals, proteins, carbohydrates, vitamins, fatty acids, and numerous valuable compounds, such as ascorbic acid, carotenoids, tocopherols, chlorophyll derivatives, polyphenols, phlorotannins, and mycosporine-like amino acids.15Sargassum spp. have gained increased research interest because of their richness in bioactive molecules, such as sargaquinoic acids, sargachromenol, and pheophytin, which are esteemed for their antioxidant effects and potential applications in functional foods, nutraceuticals, and natural food preservatives.16,17 The demand for natural antioxidants is rising amid concerns about the health risks of synthetic additives, and the growing consumer shift towards sustainable alternatives, further making it an industrial and scientific priority to identify and optimize their extraction process.18
756521 tons of biomass and a global market value of US$ 5.5–6 billion per year. As India has a long coastline, around 11098 km with a 2.5 million km2 economic zone and 0.13 million km2 shelf area, that provides an opportunity for the blue economy, which has gained global attention.10–13 The Karnataka region covers 343 km of coastline in the West Central region of India, including estuaries and accessible coastlines. A recent study by Chippalakatti et al.14 revealed that Sargassum, Gracilaria, and Ulva spp. are abundant marine macroalgae in Karnataka with considerable economic potential. They are a significant source of minerals, proteins, carbohydrates, vitamins, fatty acids, and numerous valuable compounds, such as ascorbic acid, carotenoids, tocopherols, chlorophyll derivatives, polyphenols, phlorotannins, and mycosporine-like amino acids.15Sargassum spp. have gained increased research interest because of their richness in bioactive molecules, such as sargaquinoic acids, sargachromenol, and pheophytin, which are esteemed for their antioxidant effects and potential applications in functional foods, nutraceuticals, and natural food preservatives.16,17 The demand for natural antioxidants is rising amid concerns about the health risks of synthetic additives, and the growing consumer shift towards sustainable alternatives, further making it an industrial and scientific priority to identify and optimize their extraction process.18
The blue economy not only underscores the economic potential of the marine ecosystem but also recommends ensuring the responsible and equitable exploitation of oceanic resources.19 Optimization of extraction procedures for bioactive compounds, such as phenolics and flavonoids, also warrants sustainable resource utilization. Ultrasound-Assisted Extraction (UAE) is an emerging modern technique that reduces solvent consumption and gives higher yields within a shorter time while preserving bioactivity, thus making it a sustainable alternative to conventional extraction techniques.20,21 The present study focuses on Sargassum cinereum J. Agardh, an abundantly distributed brown macroalga along the rocky intertidal regions of the Karnataka coast, where high standing-stock populations have been reported.14 Despite the growing research interest in several Sargassum species, comprehensive studies addressing nutritional profiling, fatty acid composition, and systematic optimization of bioactive compound extraction from S. cinereum remain limited. Given its regional abundance and potential for sustainable biomass availability, scientific evaluation and process optimization are essential to support its valorization in nutraceutical, functional food, and feed applications. Herein, we investigate its chemical and nutritional composition and fatty acid profile, and optimize bioactive extraction using the Response Surface Methodology (RSM) based on a Box–Behnken Design (BBD).
Experimental
Marine macroalgae collection, identification, and processing
As part of a diversity study, marine macroalgae were collected from the rocky shores of coastal Karnataka between 2022 and 2023.14,22 Among the specimens collected, Sargassum sp., a brown alga, was found to be growing abundantly at Hadin Eco Beach, Bhatkal, Uttara Kannada, Karnataka, India (latitude: 13.949164; longitude: 74.548845; Fig. 1). The idea of adding value to an abundant natural resource led us to explore the economic potential of Sargassum spp., collect large quantities of its biomass, and transfer it to the laboratory in an insulated ice box. The sample was washed in running tap water to remove debris, sand particles, and epiphytes. Morphological observations were made, and a herbarium was prepared and deposited at Karnatak University in Dharwad, Karnataka, India. The marine macroalga was identified as Sargassum cinereum J. Agardh. The sample was shade-dried for a week and then made into powder using a mechanical blender. Macroalgal powder was then packed in an airtight container for further analysis.
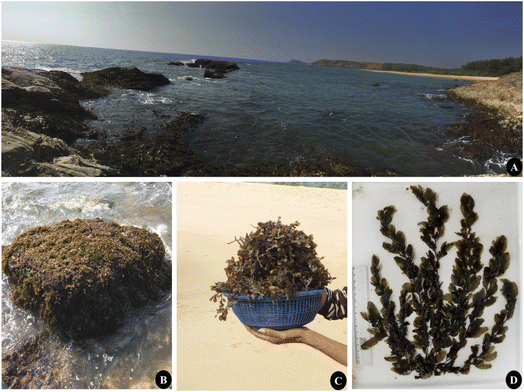 |
| | Fig. 1 The habitat and collection of Sargassum cinereum from the rocky shores of the Uttara Kannada district, Karnataka, India. (A) Panoramic view of the Bhatkal coastline. (B) High standing-stock population of S. cinereum attached to a rocky intertidal surface. (C) Bulk biomass collected for subsequent processing and analysis. (D) Representative thallus morphology of S. cinereum used for taxonomic identification. | |
Chemicals and reagents
All solvents used in the study, such as methanol, ethanol, chloroform, and hexane, were of analytical grade. Chemicals, namely aluminium chloride, boron trifluoride, hydrochloric acid, nitric acid, perchloric acid, potassium hydroxide, sodium carbonate, sodium hydroxide, and sulphuric acid, and standards, such as ascorbic acid, gallic acid, quercetin, and minerals along with reagents, like bromocresol green, 2,2-diphenyl-1-picrylhydrazyl (DPPH), Folin–Ciocalteu (FC), molybdenum blue, and zirconium oxychloride, were obtained from HiMedia Laboratories Private Limited, Mumbai, India, and Sigma-Aldrich, Bengaluru, India. Double-distilled water was used throughout the study for chemical preparation.
Nutritional and mineral composition of S. cinereum
The nutrient composition, including protein, lipid, carbohydrate, ash and moisture, was analyzed using the standard AOAC guidelines with slight modifications. After the analyses, Atwater factors were used to calculate the energy value in kcal per 100 g. The moisture content was determined by taking a pre-weighed fresh sample, drying it at 105 °C in an oven until it attained a constant weight. Weight differences were used for calculations. Ash content was analyzed using the AOAC23 protocol. Briefly, 2 g of dried macroalgal sample was placed in a preheated silica crucible and kept at 550 °C for 4 h in a muffle furnace, after which it was cooled in a desiccator. Residual weight was used to calculate the ash percentage. Crude protein content was calculated by multiplying the conversion factor of 6.25 by the total nitrogen quantity, as determined by the Kjeldahl distillation method.24 Crude lipids were extracted from the macroalgal powder using a Soxhlet apparatus with a chloroform: methanol solvent mixture at a ratio of 2:1 (v/v), as described by Wong and Cheung.25 Then, the contents of crude lipids were gravimetrically determined after oven-drying at 80 °C. Crude fiber content of the sample was determined by digesting the sample with 1.25% H2SO4 and 1.25% NaOH, according to the AOAC.23 protocol. The sample was dried in an oven at 105 °C, then the ash was obtained by burning it at 525 °C in a muffle furnace overnight, after which it was cooled in a desiccator. Weight differences were then noted and calculated. The results of these parameters were then converted to a fresh-weight basis and used to calculate the carbohydrate content by subtracting the sum of the percentages of ash, moisture, protein, fiber, and lipid in hundredths, as given in a report by Wirenfeldt et al.26
Mineral composition of S. cinereum
The mineral composition was determined via acid digestion of the sample. The major minerals, like sodium and potassium, were quantified using a flame photometer, as reported by Manivannan et al.27 Phosphorus was determined based on molybdenum blue coloration using the spectrophotometric method. Magnesium and calcium were determined by titration using bromocresol green and zirconium oxychloride solution, following the method described by Yadav.28 Other minerals, such as copper, zinc, iron, and manganese, were analyzed using an atomic absorption spectrophotometer (NOVA 400, Analytic Jena, Jena, Germany), equipped with single hollow cathode lamps and an air-acetylene burner, using respective standards.29
Fatty acid profiling by gas chromatography and flame ionization detector
Lipid extracted for nutrient analysis was subjected to esterification, converting the fatty acids into methyl FAME as per the AOCS30 protocol, with modifications in the quantity of sample as follows: 150 mg of lipid was subjected to saponification by adding 3.75 mL of 0.5 N methanolic KOH, followed by transesterification using 3 mL boron trifluoride–methanol, incubated at 60 °C for 30 min, and instantly cooled for 5 min in an ice bath. The solution was mixed with 1 mL each of hexane and distilled water and vortexed. Then, the undisturbed upper layer containing methyl esters was collected in GC vials. Analysis was carried out using a GC Clarus 480 PerkinElmer instrument equipped with a silica capillary column (60 m × 0.25 mm, I.D., 0.25 µm film), and an FID, as described by Berneira et al.31 The operation features, such as the injector with detector temperature, were set to 250 °C. The temperature of the column was initially set at 80 °C for 2 min, then increased to 200 °C over 10 min at a rate of 6 °C min−1, and further increased to 220 °C over an additional 30 min at a rate of 2 °C min−1. FAMEs were analyzed using a GC equipped with an FID. Identification of individual FAMEs was performed by comparing their retention times with those of a certified multi-component FAME reference standard analyzed under identical chromatographic conditions.
Ultrasound-assisted extraction (UAE) of phytochemicals from S. cinereum
Ethanol was selected as the solvent without any preliminary screening due to its eco-friendly, less hazardous, and more convenient nature.32 Different quantities of macroalgal powder were ultrasonicated in an ultrasonic water bath for different times and at different concentrations of ethanol, as mentioned in the optimization experimental design. Ultrasonicated samples were filtered using a muslin cloth, followed by 10 min of centrifugation at 5000 rpm. The supernatant was collected and stored at 4 °C for further analysis.33,34
Experimental design for UAE optimization
The extraction efficiency is influenced by multiple operational and material-related factors, including ultrasonic intensity, frequency, temperature, pressure, and sample characteristics, such as particle size and moisture content.35–37 Nevertheless, solvent concentration, extraction time, and solid-to-solvent ratio remain the most universally impactful variables across extraction methods and are therefore considered critical parameters for optimization. In the present study, independent variables such as solvent concentration (X1), time (X2), and solid-to-solvent ratio (X3) were considered for optimization of the phytochemical extraction process. The experimental ranges of the selected variables were determined based on published literature and prior laboratory investigations on other macroalgae by Thangadurai et al.38 These limits were chosen to encompass a statistically meaningful and practically feasible operating window, enabling effective bioactive extraction under controlled extraction time and solvent usage. Other parameters, such as temperature, were held constant, as was the ultrasonic frequency (50 kHz), ultrasonic power (60 W) and 100% amplitude. Optimization was conducted using a three-factor, quadratic, randomized BBD model in RSM, with the aim of maximizing the responses, such as total phenolic content (Y1), total flavonoid content (Y2), and antioxidant capacity (Y3), based on the designs of Liyana-Pathirana and Shahidi39 and Zhang et al.40 with slight modifications. Variables were fixed at three levels, coded as −1, 0, and +1, and the lower and upper limits of the variables were chosen to maximize the extraction of phenolic and flavonoid compounds, and their DPPH inhibition capacity from a smaller sample quantity in a shorter time period. Table 1 summarizes the natural and coded values for all three independent variables used in the experiments. The experimental matrix, along with its response values, is recorded in the results and discussion section. The extraction yield was analyzed using the BBD within a response surface regression (eqn (1)) framework and fitted to a second-order polynomial model:| |  | (1) |
where Y = predicted responses, such as total phenolics, total flavonoids, and DPPH inhibition %; β0 = constant coefficient; βi = linear coefficient; βii = quadratic coefficient; βij = cross-product coefficient; Xi and Xj = independent variables. The model was validated by comparing experimental and predicted values.
Table 1 Coded values and actual values of the upper and lower limits of the independent variables to be optimized for bioactive compound extraction
| Independent variables |
Actual values |
Coded values |
| Solvent concentration (%) |
40 |
−1 |
| 70 |
0 |
| 100 |
+1 |
| Time (min) |
5 |
−1 |
| 10 |
0 |
| 15 |
+1 |
| Solid-to-solvent ratio (mg mL−1) |
25 |
−1 |
| 50 |
0 |
| 75 |
+1 |
Total phenolic content analysis
The total phenolic content (TPC) of S. cinereum extracts obtained was determined using the Folin–Ciocalteu method described by Wolfe et al.41 with minor modifications to the quantities of reagents and extracts used. Briefly, reaction mixtures were prepared by adding distilled water (50 µL), extract (12.5 µL), and Folin–Ciocalteu reagent (12.5 µL) to a 96-well microtiter plate. After incubating the reaction mixture for 10 min at room temperature, 7% saturated sodium carbonate (125 µL) and distilled water (100 µL) were added. The mixture was again incubated for 90 min in the dark at room temperature. After the color developed, the absorbance (OD) was measured at 760 nm in a 96-well microtiter Multiskan Sky spectrophotometer (Thermo Scientific). Gallic acid was used as a standard phenolic compound to obtain a calibration curve. The TPC of the extracts was then calculated and the results expressed as milligrams of gallic acid equivalents per gram of dry weight of the sample (mg GAE per g DW).
Estimation of total flavonoid content
The total flavonoid content (TFC) of the extracts was analyzed using the protocol by Madar et al.,42 which is a modified version of the protocol reported by Luximon-Ramma et al.43 In brief, 1.5 mL of 2% methanolic AlCl3 was mixed with 1.5 mL of the algal extract, shaken vigorously to ensure proper mixing and then incubated for 10 min in the dark at room temperature. Absorbance was then measured at 367 nm using a 96-well microtiter Multiskan Sky spectrophotometer. The calibration curve obtained for the standard quercetin was used to determine the TFC of the sample, and the results were expressed as milligrams of quercetin equivalents per gram of dry weight of the sample (mg QE per g DW).
Antioxidant assay by DPPH inhibition
The antioxidant activity was assessed using the DPPH inhibition method adopted by Magdum et al.44 In brief, a reaction mixture was prepared by adding 10 µL of each extract to 290 µL of the DPPH solution, which was incubated at room temperature for 30 min in the dark. The absorbance was then read at 517 nm using a 96-well microtiter Multiskan Sky spectrophotometer. A decrease in the absorbance of DPPH with both the extract and the control (DPPH solution with methanol in the case of the extract) was noted. The DPPH inhibition % of each extract was analyzed by comparing its absorbance with that of the control using eqn (2).| |  | (2) |
Statistical analysis and software tools
Proximate and mineral composition analyses were carried out in triplicate, using Excel, and the results are expressed as mean ± standard deviation. The Design Expert software version 13 (Stat-Ease, Inc., Minneapolis, MN, USA) was used for the optimization experiment, regression analysis, and statistics involved in the RSM-BBD case. The same software was also used to develop all the graphs and pictures.
Results and discussion
Herein, we aimed to analyze the chemical and nutritional composition, including mineral and fatty acid profiles, of the brown seaweed S. cinereum, an abundant natural marine resource from coastal Karnataka, India. The main objective of this study was to optimize the extraction process for bioactive components. The independent parameters chosen were solvent concentration (medium-dependent parameter) X1 (%), time of extraction (equipment-based parameter) X2 (min), and the solid-to-solvent ratio (matrix-dependent parameter) X3 (mg mL−1), as these are well-known factors that greatly affect the quantity of bioactives extracted by each extraction technique. Updated techniques, such as pressurized liquid extraction, enzyme-assisted extraction, microwave-assisted extraction, supercritical fluid extraction, and UAE, have more advantages than disadvantages, especially UAE, which has gained attention due to its extraction efficiency, minimal solvent use and thermal degradation, and cost-effectiveness.45 We conducted an optimization experiment to recover bioactives, such as phenolic and flavonoid compounds having DPPH-inhibiting capabilities, using ethanol as a solvent. This study employed mathematical modelling, using the Box–Behnken design of surface response methodology. We conducted a total of 17 experimental runs at five central points with different combinations of independent variables, for all three responses, such as TPC (Y1), TFC (Y2), and DPPH inhibition % (Y3).
Nutrient and mineral composition of S. cinereum
Determination of the nutritional and mineral composition of the organic matter is important. Specifically, regarding marine macroalgae, the composition varies depending on the species, season, temperature, climate, geographic area, water, and even sea conditions. S. cinereum collected from the Karnataka coast has a balanced composition of nutrients and minerals, as shown in Tables 2 and 3. The results of the present study revealed that S. cinereum has a moisture content of about 80.2%. Of all the nutritional components, carbohydrates are the most abundant, accounting for 10.52% of the wet weight, followed by fiber at 3.96%. Similar quantities of protein (2.48%) and ash (2.64%) were also recorded, whereas lipids were the least abundant component (0.19% of the wet weight). The nutritional profile obtained in this study aligns with previously reported values for Sargassum horneri and other brown macroalgae reported by Murakami et al.46 and Premarathna et al.47 The estimated energy value (274.73 kcal per 100 g DW) is consistent with the range reported for Sargassum tenerrimum and Sargassum asperum,48 indicating comparable calorific potential among these taxa.
Table 2 Nutritional composition of S. cinereuma
| Components (%) |
Dry-weight basis |
Wet-weight basis |
|
All the values represent the means with the standard deviation of triplicate measurements.
|
| Moisture |
— |
80.20 ± 0.19 |
| Ash |
12.52 ± 0.46 |
2.48 ± 0.09 |
| Crude protein |
13.35 ± 0.41 |
2.64 ± 0.07 |
| Crude lipid |
00.97 ± 0.02 |
0.19 ± 0.005 |
| Crude fiber |
20.00 ± 0.47 |
3.96 ± 0.13 |
| Carbohydrate |
53.15 ± 0.28 |
10.52 ± 0.04 |
| Energy (kcal per100 g) |
274.73 |
54.35 |
Table 3 Mineral composition of the brown macroalgae S. cinereuma
| Components |
Quantity (mg per g DW) |
|
All the values represent the means with the standard deviation of triplicate measurements.
|
|
Macrominerals
|
| Nitrogen |
22.10 ± 0.13 |
| Phosphorous |
0.239 ± 0.01 |
| Potassium |
15.26 ± 0.14 |
| Sodium |
11.46 ± 0.05 |
| Sulphur |
11.69 ± 0.11 |
| Calcium |
40.00 ± 0.25 |
| Magnesium |
16.50 ± 0.06 |
|
|
Microminerals
|
| Boron |
0.48 ± 0.00 |
| Zinc |
3.41 ± 0.00 |
| Iron |
9.71 ± 0.00 |
| Manganese |
7.88 ± 0.00 |
| Copper |
5.81 ± 0.00 |
Regarding mineral composition, calcium was the most abundant macro mineral at 40 mg g−1, suggesting its potential as a natural supplement. Nitrogen was the second most abundant (22.1 mg g−1), indicating the presence of a good quantity of protein. The remaining minerals, potassium, magnesium, sodium, and sulphur, were present in moderate but significant amounts. Phosphorus was the least abundant mineral (0.239 mg g−1). In the case of micro-minerals, iron was found to be present at a relatively high level (9.71 mg g−1), followed by manganese (7.88 mg g−1). Copper and zinc were present in moderate quantities, whereas boron was present in trace amounts (0.48 mg g−1). These results highlight the importance of these minerals as feed and food ingredients. Higher iron levels support respiration in both animals and humans, while manganese and copper levels are within the functional range of enzyme activity and bone development. The sodium-to-potassium ratio was also within the tolerable range for maintaining electrolyte balance.49,50 Despite their good nutritional composition, macroalgae are not widely accepted as human food. They are not economically exploited due to their unfamiliarity, taste, texture, and availability, but they are gaining huge importance and attention in the animal feed industry.51–53 Marín et al.54 tested Sargassum spp. as a feed ingredient for sheep and recommended its use in tropical and subtropical regions, as it did not affect the sheep's feed intake when incorporated at 50%. A recent report by Carrillo-Domínguez et al.55 also suggested that Sargassum spp. biomass could be used as an animal feed ingredient due to its mineral, amino acid, fatty acid and bioactive compound content. However, it is recommended for use in lower concentrations as it contains high levels of fiber, salts, and complex carbohydrates. The presence of toxic minerals should also be considered, and every natural sample should be analyzed unless it is artificially cultured.
Fatty acid composition of S. cinereum
GC-FID analysis was used to assess the fatty acid profile of S. cinereum. Palmitic acid, a saturated fatty acid (SFA), accounted for nearly half of the total composition (48.01%), followed by oleic acid (17.38%), a monounsaturated fatty acid (MUFA). Palmitic acid, along with stearic and myristic acids, constituted 58.79% of the total SFA, indicating that stable lipids constitute a large portion of the sample. Polyunsaturated fatty acids (PUFA), such as linoleic, α-linolenic, and arachidonic acids, accounted for 6.01%, 4.30%, and 6.33%, respectively. These essential fatty acids highlight the nutritional, therapeutic, and industrial potentials of S. cinereum. The clear dominance of SFA, followed by MUFA and PUFA, is a common trend reported in marine macroalgae. Similar results were observed in most Sargassum spp., with a descending order of abundance for SFA, MUFA and PUFA, with most studies showing that palmitic and oleic acids are predominant56,57 (Table 4).
Table 4 Fatty acid composition of S. cinereum
| Fatty acid name |
Formula |
Retention time |
Area % |
| Myristic acid |
C14:0 |
16.035 |
6.512 |
| Palmitic acid |
C16:0 |
19.366 |
48.012 |
| Palmitoleic acid |
C16:1 |
19.689 |
5.694 |
| Stearic acid |
C18:0 |
22.442 |
4.267 |
| Oleic acid |
C18:1n |
22.657 |
17.381 |
| Linoleic acid |
C18:2 |
23.263 |
6.006 |
| α-Linolenic acid |
C18:3n6 |
24.117 |
4.295 |
|
Cis-11-Eicosaenoic acid |
C20:1 |
25.544 |
1.507 |
| Arachidonic acid |
C20:4n6 |
26.657 |
6.327 |
| Total |
|
|
100 |
Optimization of UAE parameters for bioactives from S. cinereum
Extraction process modeling.
The actual values of the experimental design for each of the three levels of the experimental runs, along with the respective response results, including the values predicted by the model, are shown in Table 5. The TPC of S. cinereum ranged from 0.1649 to 1.14 mg per g GAE in experimental runs 7 and 11 but was predicted to be 0.2507 and 1.07 mg per g GAE, respectively. In the case of TFC, the amount varied from 0.9010 to 4.10 mg per g QE in runs 3 and 8, respectively, where the model predicted values of 1.36 and 3.43 mg per g QE. Similarly, the inhibition percentage for the antioxidant activity by the DPPH assay ranged from 1.64% to 18.51% in the actual results and from 2.11% to 18.58% in the predicted results at runs 2 and 3. These experimental results were subjected to ANOVA and regression analysis, which helped to identify the effects of the parameters on the response yields using Design Expert software. Fit summaries of the second-order polynomial model showed that the linear model fits best for Y1 and Y2, which had an insignificant lack of fit, as required, with a low standard deviation of about 0.1233 and a regression coefficient (R2) of 0.8614 for Y1. The respective values were higher for Y2 at 0.6112 and 0.6033. Also, the quadratic model was the highest-order polynomial with the maximum number of significant terms and an insignificant lack of fit for Y3, with an R2 value of 0.9761. ANOVA and regression analysis were performed on the experimental data to determine statistical significance. The results, along with the regression coefficients of the predicted second-order polynomial models, are summarized in Tables 6 and 7. The linear models for Y1 and Y2, with F-values of 26.93 and 6.59, respectively, implied the significance of the models. The pronounced effects of ethanol concentration X1 and solid-to-solvent ratio X3 on total phenolic content Y1 can be found due to polarity-mediated solubilization and mass transfer dynamics. Phenolic compounds encompass a wide range of structures with varying polarity, and hydroethanolic systems are widely recognized for enhancing their extraction by optimizing solvent polarity and improving cell wall permeability.58,59 Adjusting ethanol concentration modifies the dielectric properties of the solvent system, thereby influencing phenolic solubility and diffusion into the extraction medium. Furthermore, the solid-to-solvent ratio X3 plays a critical role in establishing an effective concentration gradient between the algal matrix and solvent, thereby enhancing mass transfer and facilitating greater release of phenolic compounds.35 An increased solvent volume relative to sample mass improves contact surface area and reduces saturation effects, leading to improved extraction efficiency. In contrast, total flavonoid content Y2 was predominantly influenced by the solid-to-solvent ratio X3. Flavonoids exhibit considerable structural diversity, including glycosylated and polymeric forms, which may display differential solubility behavior in hydroethanolic systems.58 Consequently, solvent availability and diffusion efficiency become more critical determinants than solvent polarity alone. Thus, an adequate solvent volume, relative to biomass, enhances mass transfer and facilitates the improved recovery of flavonoid compounds. However, the DPPH inhibition percentage with the quadratic model has more significant terms, such as X1, X3, X1X3, X12, X22, and X32. Kadam et al.60 stated that an adequate fit is necessary to avoid poor results in response surface optimization. The adequate precision required for this model is supposed to be greater than 4. The values of 16.957, 8.469, and 19.854 for Y1, Y2, and Y3, respectively, ensure the adequacy of the proposed model. Eqn (3), (4), and (5) describe the relationships between the independent factors and response values:| | | Y1 = 1.59482 − 0.011981X1 + 0.009929X2 − 0.005900X3 | (3) |
| | | Y2 = 2.8671 + 0.006104X1 + 0.080417X2 − 0.034130X3 | (4) |
| | | Y3 = 7.65480 − 0.577575X1 + 1.47100X2 + 0.723499X3 +0.007003X1X2 − 0.003065X1X3 + 0.000348X2X3 + 0.003568X12 − 0.096550X22 − 0.004421X32 | (5) |
Table 5 RSM-BBD experimental design for the optimization of UAE parameters for the extraction of bioactives from S. cinereum with independent variables and their respective responses
| Run |
Independent variables (X) |
Responses (Y) |
| Solvent concentration % (X1) |
Time min (X2) |
Solid:solvent (mg mL−1) (X3) |
TPC (mg per g GAE) (Y1) |
TFC (mg per g QE) (Y2) |
DPPH inhibition (%) (Y3) |
| Actual |
Predicted |
Actual |
Predicted |
Actual |
Predicted |
| 1 |
70 |
15 |
75 |
0.3380 |
0.4626 |
2.01 |
1.94 |
6.57 |
6.10 |
| 2 |
70 |
5 |
25 |
0.4641 |
0.6583 |
2.04 |
2.84 |
1.64 |
2.11 |
| 3 |
40 |
10 |
75 |
0.8327 |
0.7724 |
0.9010 |
1.36 |
18.51 |
18.58 |
| 4 |
70 |
5 |
75 |
0.1776 |
0.3633 |
0.9102 |
1.14 |
5.02 |
5.54 |
| 5 |
100 |
10 |
75 |
0.1892 |
0.0535 |
1.74 |
1.72 |
4.44 |
4.31 |
| 6 |
40 |
15 |
50 |
0.8345 |
0.9695 |
2.60 |
2.61 |
13.66 |
14.06 |
| 7 |
100 |
15 |
50 |
0.1649 |
0.2507 |
2.21 |
2.98 |
5.89 |
6.49 |
| 8 |
100 |
10 |
25 |
0.3125 |
0.3485 |
4.10 |
3.43 |
5.46 |
5.39 |
| 9 |
40 |
5 |
50 |
0.9157 |
0.8702 |
2.18 |
1.81 |
16.28 |
15.68 |
| 10 |
70 |
10 |
50 |
0.6693 |
0.5604 |
3.14 |
2.39 |
8.65 |
9.24 |
| 11 |
40 |
10 |
25 |
1.14 |
1.07 |
2.81 |
3.06 |
10.34 |
10.46 |
| 12 |
70 |
10 |
50 |
0.5736 |
0.5604 |
1.54 |
2.39 |
9.18 |
9.24 |
| 13 |
70 |
15 |
25 |
0.7994 |
0.7576 |
3.43 |
3.65 |
3.02 |
2.50 |
| 14 |
70 |
10 |
50 |
0.6983 |
0.5604 |
3.13 |
2.39 |
7.76 |
9.24 |
| 15 |
70 |
10 |
50 |
0.5359 |
0.5604 |
2.88 |
2.39 |
9.45 |
9.24 |
| 16 |
100 |
5 |
50 |
0.1823 |
0.1514 |
1.91 |
2.17 |
4.30 |
3.91 |
| 17 |
70 |
10 |
50 |
0.6983 |
0.6676 |
3.13 |
2.39 |
11.14 |
9.24 |
Table 6 ANOVA and regression coefficients of second-order polynomial models of the RSM-BBD optimization experiment
| Type of effects |
Source |
Sum of squares |
df
|
Mean square |
F-Value |
p-Value |
Regression coefficients |
|
TPC (linear model)
|
| Linear |
Model |
1.23 |
3 |
0.4091 |
26.93 |
<0.0001 |
Intercept 0.5604 |
|
X
1
|
1.03 |
1 |
1.03 |
68.02 |
<0.0001 |
−0.3594 |
|
X
2
|
0.0197 |
1 |
0.0197 |
1.30 |
0.2752 |
0.0496 |
|
X
3
|
0.1741 |
1 |
0.1741 |
11.46 |
0.0049 |
−0.1475 |
|
|
Residual |
0.1975 |
13 |
0.0152 |
|
|
|
| Lack of fit |
0.1748 |
9 |
0.0194 |
3.41 |
0.1247 |
|
| Pure error |
0.0228 |
4 |
0.0057 |
|
|
|
| Cor total |
1.42 |
16 |
|
|
|
|
|
|
TFC (linear model)
|
| Linear |
Model |
7.39 |
3 |
2.46 |
6.59 |
0.0060 |
Intercept 2.39 |
|
X
1
|
0.2683 |
1 |
0.2683 |
0.7183 |
0.4120 |
0.1831 |
|
X
2
|
1.29 |
1 |
1.29 |
3.46 |
0.0855 |
0.4021 |
|
X
3
|
5.82 |
1 |
5.82 |
15.59 |
0.0017 |
−0.8533 |
|
|
Residual |
4.86 |
13 |
0.3735 |
|
|
|
| Lack of fit |
2.95 |
9 |
0.3278 |
0.6881 |
0.7062 |
|
| Pure rrror |
1.91 |
4 |
0.4764 |
|
|
|
| Cor total |
12.24 |
16 |
|
|
|
|
|
|
DPPH inhibition % (quadratic)
|
| Linear |
Model |
333.96 |
9 |
37.11 |
31.70 |
<0.0001 |
Intercept 9.24 |
|
X
1
|
187.17 |
1 |
187.17 |
159.89 |
<0.0001 |
−4.84 |
|
X
2
|
0.4538 |
1 |
0.4538 |
0.3877 |
0.5533 |
0.2382 |
|
X
3
|
24.77 |
1 |
24.77 |
21.16 |
0.0025 |
1.76 |
| Interaction |
X1X2 |
4.41 |
1 |
4.41 |
3.77 |
0.0933 |
1.05 |
| X1X3 |
21.13 |
1 |
21.13 |
18.05 |
0.0038 |
−2.30 |
| X2X3 |
0.0076 |
1 |
0.0076 |
0.0065 |
0.9382 |
0.0435 |
| Quadratic |
X
1
2
|
43.42 |
1 |
43.42 |
37.09 |
0.0005 |
3.21 |
|
X
2
2
|
24.53 |
1 |
24.53 |
20.96 |
0.0026 |
−2.41 |
|
X
3
2
|
32.14 |
1 |
32.14 |
27.46 |
0.0012 |
−2.76 |
|
|
Residual |
8.19 |
7 |
1.17 |
|
|
|
| Lack of fit |
2.03 |
3 |
0.6760 |
0.4385 |
0.7379 |
|
| Pure error |
6.17 |
4 |
1.54 |
|
|
|
| Cor total |
342.15 |
16 |
|
|
|
|
Table 7 Fit statistics for the RSM-BBD model for the optimization process for extracting bioactives from S. cinereum
| Responses |
TPC |
TFC |
DPPH inhibition % |
|
R
2
|
0.8614 |
0.6033 |
0.9761 |
|
R
adj
2
|
0.8294 |
0.5118 |
0.9453 |
|
R
pred
2
|
0.7441 |
0.3741 |
0.8770 |
| Adeq precision |
16.9568 |
8.4689 |
19.8536 |
| CV% |
21.99 |
25.55 |
13.02 |
|
Model strength
|
Moderate to good |
Moderate |
Strong |
Relationships among the variables and effects on responses
Graphs were generated to illustrate the relationship between different variables, including single factors, interactions among the factors, contour plots, and 3D surface plots. A negative linear effect was observed: as the concentration of ethanol increased, the TPC decreased significantly. This suggests that a moderate concentration of ethanol is optimal for extracting phenolic compounds, possibly due to a balance between polarity and solubility. Higher ethanol concentrations might reduce the solubility of polar phenolic compounds. The solid-to-solvent ratio showed a slight negative slope, i.e., higher solid loading reduces TPC yield, likely due to solvent saturation. In contrast, the curve was almost flat, indicating that the extraction time (5–15 min) does not drastically influence TPC within this range. Shorter times may already be sufficient for phenolic extraction due to their solubility (Fig. 2A–C). In the case of TFC, a positive correlation was observed with solvent concentration, indicating that flavonoids may require a higher ethanol concentration for efficient solubilization due to their moderate hydrophobicity. A positive linear effect was also observed, suggesting that these compounds require slightly longer times for efficient diffusion; however, a negative slope was observed in the solid-to-solvent ratio for TFC, as was seen for TPC (Fig. 2D–F). The DPPH inhibition (%) response was influenced by both interaction effects and individual variables. A quadratic response pattern was particularly evident in the interaction between time and the solid-to-solvent ratio, where DPPH activity initially increased with increasing extraction time and solvent availability, followed by a decline beyond the optimal range. This trend may be attributed to the establishment of equilibrium between solute concentration in the matrix and solvent phase, limiting further enhancements in antioxidant recovery. DPPH activity decreased at higher ethanol concentrations, possibly due to reduced extraction efficiency of more polar antioxidant constituents. A similar trend was observed for total phenolic content. The decline in response at extended extraction times or higher solvent concentrations may be associated with a reduced mass-transfer efficiency or the potential instability of certain antioxidant compounds under prolonged processing conditions. Contour plots (Fig. 3) and 3D response surface graphs (Fig. 4) were used to visualize these interaction effects. Elliptical contours, particularly for the interaction between time and solid-to-solvent ratio, indicate a significant interaction effect, whereas less elongated patterns suggest comparatively weaker interactions. The response surface plots demonstrated that moderate ethanol concentration, optimal extraction time, and an appropriate solid-to-solvent ratio resulted in maximum DPPH inhibition, highlighting the presence of an optimal extraction window rather than a simple linear relationship. The desirability function confirmed these findings, supporting the effectiveness of response surface methodology in identifying the most favorable extraction conditions.
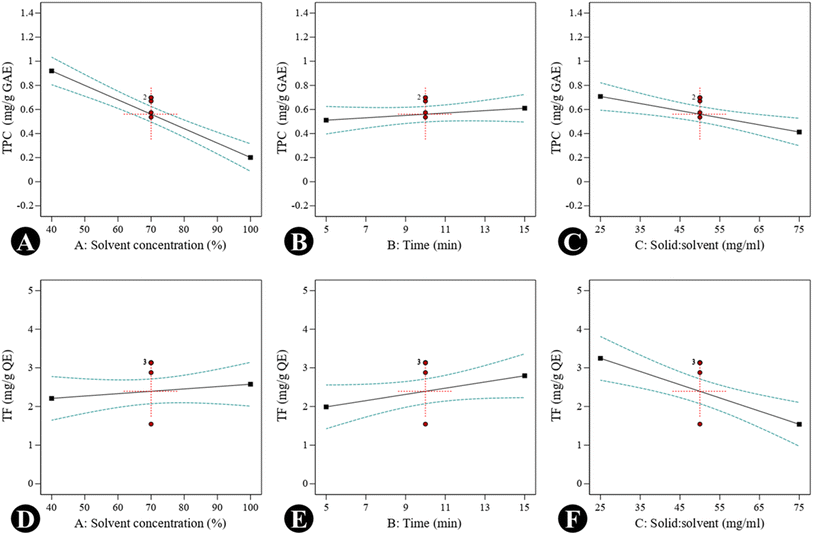 |
| | Fig. 2 RSM model graphs of UAE optimization for bioactives from S. cinereum, showing the effects of individual independent variables X1, X2, and X3 on response values (A–C) TPC and (D–F) TFC. | |
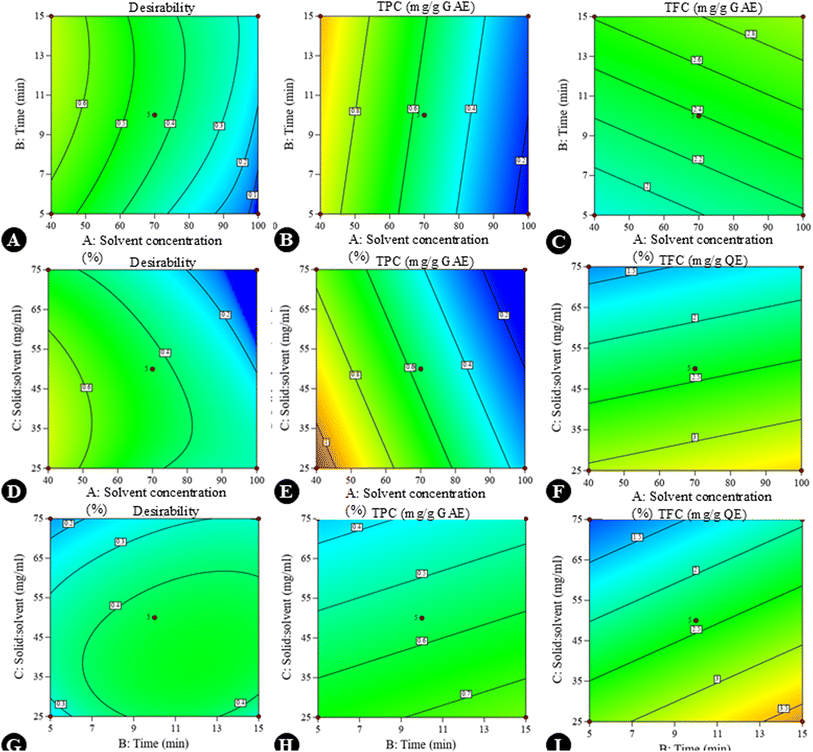 |
| | Fig. 3 Contour graphs showing the effects of interaction among the variables on response values TPC and TFC in the extraction optimization process, along with desirability. The effects of (A–C) interaction between the solvent concentration and time, (D–F) interaction between the solvent concentration and the solid-to-solvent ratio, and (G–I) interaction between time and the solid-to-solvent ratio (in each interaction plot, the third independent variable was maintained at its central level as specified in Table 1). | |
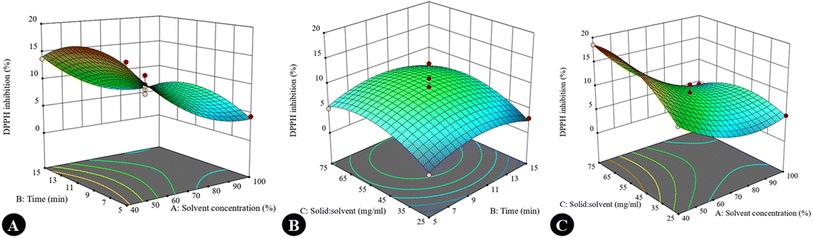 |
| | Fig. 4 3D-response graphs showing the effects of interactions between variables on the DPPH inhibition % of the S. cinereum extract: (A) solvent concentration and time, (B) time and solid-to-solvent ratio, and (C) solvent concentration and solid-to-solvent ratio (in each interaction plot, the third independent variable was maintained at its central level, as specified in Table 1). | |
Optimum parameters for UAE of antioxidant phenolics
All three response variables (Y1, Y2, and Y3) were successfully optimized to extract the maximum quantities of TPC, TFC, and antioxidants in the shortest possible time using the parameters mentioned in Table 8, with additional confirmatory runs. The optimized extraction conditions predicted by the RSM model were experimentally validated, and the obtained values were in close agreement with model predictions. The percentage deviations between predicted and experimental values were 6.99% for TPC, 8.11% for TFC, and 9.51% for DPPH inhibition, indicating satisfactory predictive accuracy and confirming the reliability of the developed models. Although the highest yields of each response were obtained in different runs with different combinations of independent variables, this optimization process revealed that an ethanolic concentration of 40% with 36.35 mg mL−1 of material subjected to ultrasonication for 12.32 min could efficiently and reliably yield all three responses, i.e., TPC, TFC, and DPPH inhibition %. The experimental results showed 1.09495 mg per g GAE of TPC, 2.6289 mg per g QE of flavonoids, and 12.0711% DPPH inhibition, whereas the predicted values were 1.0234, 2.86115, and 13.3404, respectively, with an overall desirability of 0.72 on a scale of 0 to 1, indicating that the chosen set of extraction conditions provides a fairly good compromise for maximizing all three responses simultaneously (Fig. 5). Here, the TPC of S. cinereum extract under optimized conditions was lower than that of various Korean Sargassum spp.61 The TPC obtained in the present study was higher than that obtained in previous research on U. lactuca conducted by Pappou et al.62 and Amini et al.63 but lower than that on Ascophyllum nodosum.60 In relation to other food sources, the TPC and TFC are equivalent to the levels found in millets, as explained by Bheemaiah et al.64 Furthermore, the % DPPH inhibition of the various runs with different combinations of independent variables in the present study falls within the range of Sargassum horneri extract.65 However, the overall responses are comparatively lower, which may be due to various factors, such as the composition of the seaweed, which is not only dependent on the species, but also on its growth stage, maturity, environmental conditions at the sampling stations, season and other extraction conditions of the different methods and protocols used for estimation. Widyaswari et al.66 noted that differential light exposure and nutrients influence the growth and chemical composition of seaweeds, leading to variations in bioactive substances, even within the same species. The coefficient of variation (CV%) ranged from 13.02% to 25.55% across the studied responses. Among the models, the DPPH model exhibited the lowest CV% (13.02%) and a high R2 value (0.976), indicating strong agreement between the experimental and predicted values. Although TPC and TFC showed relatively higher dispersion, their adequate precision values (>4) and reasonable agreement between the adjusted and predicted R2 confirm the reliability of the developed models for optimization purposes. Overall, the method and models accurately predicted the optimal parameters for extracting antioxidant phenolics, eliminating the need for preliminary analysis in future extraction works.
Table 8 Optimized parameters of ultrasound-assisted extraction for bioactive compounds from S. cinereum
| Independent variables |
Optimum parameters |
Responses |
| (Y1) TPC (mg per g GAE) |
(Y2) TFC (mg per g QE) |
(Y3) DPPH inhibition (%) |
| Coded levels |
Actual levels |
Experimental |
Predicted |
Experimental |
Predicted |
Experimental |
Predicted |
| Solvent concentration (X1) |
−1 |
40.0 |
1.09495 |
1.0234 |
2.6289 |
2.86115 |
12.0711 |
13.3404 |
| Time (X2) |
0.464 |
12.32 |
| Solid-to-solvent ratio (X3) |
−0.546 |
36.35 |
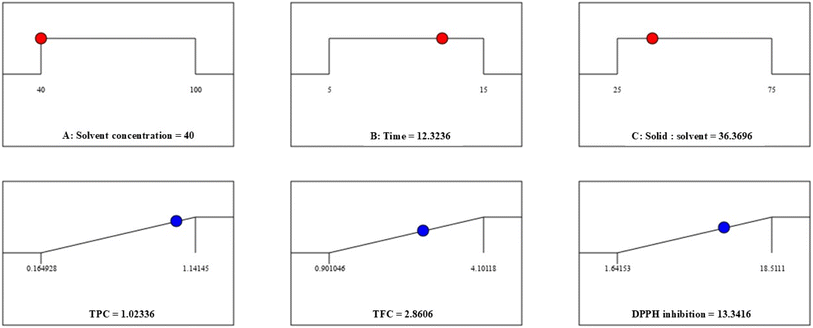 |
| | Fig. 5 Optimization desirability solution graph from RSM-BBD for the UAE of bioactives from S. cinereum. | |
Conclusion
Sargassum cinereum occurs abundantly in the coastal area of Karnataka, India. This natural marine resource has high potential for valorization as a useful product in the nutraceutical and animal feed industries due to its nutritional composition, which includes high levels of carbohydrates and proteins. It could be a potent source of pharmaceuticals, due to its bioactive and antioxidant properties that highlight its potential for functional food and related value-added applications. Thus, optimization is a necessary step for economic viability. The response surface methodology effectively optimized UAE conditions, confirming that moderate solvent strength, extraction time, and solid-to-solvent ratio enhance the recovery of phenolic compounds and antioxidant activity. The developed models show satisfactory predictive capability, particularly for antioxidant response, supporting their suitability for process optimization. These optimized parameters could be used as the standard for future economic levels of extraction. However, variations in the nutrient composition of marine macroalgae, due to their higher absorption capacity with respect to geographic area and conditions, may affect the potential utilization of brown macroalgae S. cinereum in functional food and feed industries. The currently identified limitations and gaps provide opportunities for future research.
Author contributions
P. C.: conceptualization, data curation, formal analysis, investigation, and writing the first version of the manuscript. D. T., M. N., N. C.-M. and P. M.: supervision, data curation, and methodology, writing – review and editing, methodology, conceptualization, resources. All authors reviewed and validated the final version of the manuscript.
Conflicts of interest
The authors declare no conflict of interest.
Data availability
No external data were used in this manuscript; all the data were generated from experimental analysis.
Acknowledgements
The authors acknowledge the Incubation and Training Centre, Department of Botany, Shivaji University, Kolhapur, Maharashtra, India, for providing the necessary facilities to carry out the work. PC would like to acknowledge the financial support received from the Backward Class Welfare Department, Government of Karnataka, India. NCM is grateful to the Foundation for Science and Technology (FCT) for support through the institutional scientific employment program-contract CEECINSTLA/00012/2022.
References
-
J. H. Stel, in Ocean Literacy: Understanding the Ocean, ed. K. C. Koutsopoulos and J. H. Stel, Springer, Cham, 2021, pp. 65–92, DOI:10.1007/978-3-030-70155-0_4.
- C. Alves, J. Silva, S. Pinteus, H. Gaspar, M. C. Alpoim, L. M. Botana and R. Pedrosa, Front. Pharmacol, 2018, 9, 777, DOI:10.3389/fphar.2018.00777.
- W. Cui, L. Lian and G. Pan, J. Mar. Sci. Eng., 2023, 11, 715, DOI:10.3390/jmse11040715.
- A. H. Banday, N. ul Azha, R. Farooq, S. A. Sheikh, M. A. Ganie, M. N. Parray and M. A. Lone, Phytochem. Lett., 2024, 59, 124–135, DOI:10.1016/j.phytol.2024.01.001.
-
M. A. El Regal and S. Satheesh, in Marine Ecosystems: A Unique Source of Valuable Bioactive Compounds, ed. H. A. Ibrahim and M. M. El-Sheekh, Bentham Science Publishers, UAE, 2023, pp. 1–42, DOI:10.2174/97898150519951230301.
-
M. Abbas, F. Saeed and H. A. R. Suleria, in Plant- and Marine-Based Phytochemicals for Human Health, ed. M. R. Goyal and D. N. Chauhan, Apple Academic Press, USA, 2018, pp. 61–82, DOI:10.1201/9781351251983.
- D. Giordano, Mar. Drugs, 2020, 18, 640, DOI:10.3390/md18120640.
- A. A. El Gamal, Saudi Pharm. J., 2010, 18, 1–25, DOI:10.1016/j.jsps.2009.12.001.
-
A. I. Neto and I. S. Pinto, in Marine Macro- and Microalgae, ed. F. X. Malcata, I. S. Pinto and A. C. Guedes, 2019, pp. 1–19 Search PubMed.
- M. C. M. Ebarvia, J. Ocean Coast Econ., 2016, 2, 7, DOI:10.15351/2373-8456.1051.
- C. Wan-Loy and P. Siew-Moi, Mar. Drugs, 2016, 14, 222, DOI:10.3390/md14120222.
-
M. Palanisamy and S. K. Yadav, Seaweed Flora of Karnataka Coast, Botanical Survey of India, India, 2022, pp. 1–170 Search PubMed.
- R. R. Remya, A. V. Samrot, S. S. Kumar, V. Mohanavel, A. Karthick, V. K. Chinnaiyan, D. Umapathy and M. Muhibbullah, Adsorpt. Sci. Technol., 2022, 1–13, DOI:10.1155/2022/9104835.
- P. Chippalakatti, D. Thangadurai, J. Sangeetha and A. V. Waghmode, J. Aquat. Biol. Fish., 2025, 13, 66–78 Search PubMed , https://www.jabf.in/article/196.
-
R. Anbuchezhian, V. Karuppiah and Z. Li, in Algal Biorefinery: an Integrated Approach, ed. D. Das, Springer, Cham, 2015, pp. 195–217, DOI:10.1007/978-3-319-22813-6_9.
- S. R. Yende, U. N. Harle and B. B. Chaugule, Pharmacogn. Rev., 2014, 8, 1–7, DOI:10.4103/0973-7847.125514.
- Saraswati, P. E. Giriwono, D. Iskandriati, C. P. Tan and N. Andarwulan, Mar. Drugs, 2019, 17, 590, DOI:10.3390/md17100590.
- K. Bouizgma, N. Rabbah, Z. Abbas and A. Abourriche, Sep. Sci. Technol., 2025, 60, 657–683, DOI:10.1080/01496395.2025.2452411.
- J. Elston, H. Pinto and C. Nogueira, Sustainability, 2024, 16, 11141, DOI:10.3390/su162411141.
- K. Vilkhu, R. Mawson, L. Simons and D. Bates, Innovative Food Sci. Emerging Technol., 2008, 9, 161–169 CrossRef CAS.
- L. Wen, Z. Zhang, D. W. Sun, S. P. Sivagnanam and B. K. Tiwari, Crit. Rev. Food Sci. Nutr., 2019, 60, 1826–1841, DOI:10.1080/10408398.2019.1602823.
- P. Chippalakatti, J. Sangeetha, D. Thangadurai, P. Mookkan and A. V. Waghmode, Nelumbo, 2024, 66, 105–110, DOI:10.20324/nelumbo/v66/2024/173410.
-
AOAC, in Official Methods of Analysis of AOAC International, ed. W. Horwitz, AOAC International, Gaithersburg, MD, 18th edn, 2005 Search PubMed.
- J. Magura, R. Moodley and S. B. Jonnalagadda, J. Environ. Sci. Health, Part B, 2016, 51, 525–533, DOI:10.1080/03601234.2016.1163842.
- K. H. Wong and P. C. K. Cheung, Food Chem., 2000, 71, 475–482, DOI:10.1016/S0308-8146(00)00175-8.
- C. B. Wirenfeldt, D. B. Hermund, A. H. Feyissa, G. Hyldig and S. L. Holdt, J. Appl. Phycol., 2024, 36, 2795–2805, DOI:10.1007/s10811-024-03210-4.
- K. Manivannan, G. K. Devi, G. Thirumaran and P. Anantharaman, Am.-Eurasian J. Bot., 2008, 1, 58–67 Search PubMed.
-
G. G. Yadav, PhD thesis, Karnatak University, Dharwad, India, 2023, https://hdl.handle.net/10603/560748.
- P. Rupérez, Food Chem., 2002, 79, 23–26 CrossRef.
-
AOCS, in Official Methods of Analysis, AOAC International, Gaithersburg, MD, 18th edn, 2005 Search PubMed.
- L. Berneira, C. da Silva, T. Poletti, M. Ritter, M. dos Santos, P. Colepicolo and C. M. P. de Pereira, J. Appl. Phycol., 2020, 32(5), 3319–3329 Search PubMed.
- S. K. Y. Aron, M. Palanisamy and N. Savithra, Biomass Convers. Biorefin., 2023, 15, 2223–2241, DOI:10.1007/s13399-023-05001-2.
- S. Chakraborty, R. Uppaluri and C. Das, Food Bioprocess Technol., 2020, 120, 114–122, DOI:10.1016/j.fbp.2020.01.003.
- M. Hanula, J. Wyrwisz, M. Moczkowska, O. K. Horbańczuk, E. Pogorzelska-Nowicka and A. Wierzbicka, Appl. Sci., 2020, 10, 8325, DOI:10.3390/app10238325.
- J. Azmir, I. S. M. Zaidul, M. M. Rahman, K. M. Sharif, A. Mohamed, F. Sahena, M. H. A. Jahurul, K. Ghafoor, N. A. Norulaini and A. K. Omar, J. Food Eng., 2013, 117(4), 426–436 CrossRef CAS.
- C. Wen, J. Zhang, H. Zhang, C. S. Dzah, M. Zandile, Y. Duan, H. Ma and X. Luo, Ultrason. Sonochem., 2018, 48, 538–549, DOI:10.1016/j.ultsonch.2018.07.018.
- S. A. Siddiqui, A. Ali Redha, M. Salauddin, I. A. Harahap and H. V. Rupasinghe, Crit. Rev. Anal. Chem., 2025, 55(1), 139–160, DOI:10.1080/10408347.2023.2266846.
- D. Thangadurai, P. Chippalakatti, M. Nimbalkar, J. Sangeetha, R. Hospet and N. Cruz-Martins, Innovative Food Sci. Emerging Technol., 2025, 106, 104295 CrossRef CAS.
- C. Liyana-Pathirana and F. Shahidi, Food Chem., 2005, 93, 47–56, DOI:10.1016/j.foodchem.2004.08.050.
- H. Zhang, H. Li, Z. Zhang and T. Hou, J. Food Sci., 2021, 86, 306–318 CrossRef CAS PubMed.
- K. Wolfe, X. Wu and R. H. Liu, J. Agric. Food Chem., 2003, 51, 609–614, DOI:10.1021/jf020782a.
- U. Madar, S. S. Bhat, S. Shinde, D. Thangadurai, P. Chippalakatti, N. R. Banapurmath, I. A. Badruddin and S. Kamangar, Sci. Rep., 2025, 15, 14866, DOI:10.1038/s41598-025-93271-3.
- A. Luximon-Ramma, T. Bahorun, M. A. Soobrattee and O. I. Aruoma, J. Agric. Food Chem., 2002, 50, 5042–5047, DOI:10.1021/jf0201172.
- A. B. Magdum, R. S. Waghmode, K. V. Shinde, M. P. Mane, M. V. Kamble, R. S. Kamble and M. S. Nimbalkar, Catal. Commun., 2024, 187, 106865, DOI:10.1016/j.catcom.2024.106865.
- I. Usman, M. Hussain, A. Imran, M. Afzaal, F. Saeed, M. A. Javed and S. Saewan, Int. J. Food Prop., 2022, 25, 1215–1233, DOI:10.1080/10942912.2022.2074030.
- K. Murakami, Y. Yamaguchi, K. Noda, T. Fujii, N. Shinohara, T. Ushirokawa, Y. Sugawa-Katayama and M. Katayama, J. Food Compos. Anal., 2011, 24(2), 231–236 CrossRef CAS.
- A. D. Premarathna, R. Tuvikene, P. H. P. Fernando, R. Adhikari, M. C. N. Perera, T. H. Ranahewa, M. M. Howlader, P. Wangchuk, A. P. Jayasooriya and R. P. V. J. Rajapakse, Sci. Rep., 2022, 12, 19610, DOI:10.1038/s41598-022-23609-8.
- M. T. Hossain, A. A. M. Sohag, M. N. Haque, M. Tahjib-Ul-Arif, R. Dash, M. T. H. Chowdhury, M. A. Hossain, I. S. Moon and M. A. Hannan, J. Aquat. Food Prod. Technol., 2021, 30(2), 217–227 CrossRef CAS.
- K. O. Soetan, C. O. Olaiya and O. E. Oyewole, Afr. J. Food Sci., 2010, 4, 200–222 CAS.
-
NASEM, Dietary Reference Intakes for Sodium and Potassium, National Academies Press, Washington, DC, 2019, DOI:10.17226/25353.
- C. P. Rocha, D. Pacheco, J. Cotas, J. C. Marques, L. Pereira and A. M. M. Gonçalves, Int. J. Environ. Res. Public Health, 2021, 18, 4968, DOI:10.3390/ijerph18094968.
- G. M. González-Meza, J. H. Elizondo-Luevano, S. P. Cuellar-Bermudez, J. E. Sosa-Hernández, H. M. Iqbal, E. M. Melchor-Martínez and R. Parra-Saldívar, Plants, 2023, 12, 3609, DOI:10.3390/plants12203609.
- M. Rombach and D. L. Dean, Foods, 2024, 13, 1300, DOI:10.3390/foods13091300.
- A. Marín, M. Casas-Valdez, S. Carrillo, H. Hernández, A. Monroy, L. Sanginés and F. Pérez-Gil, Rev. Biol. Trop., 2009, 57, 1271–1281 Search PubMed.
- S. Carrillo-Domínguez, R. E. Rodríguez-Martínez, M. Díaz-Martínez, E. Magaña-Gallegos and M. Cuchillo-Hilario, J. Appl. Phycol., 2023, 35, 433–444, DOI:10.1007/s10811-022-02877-x.
- B. Narayan, K. Miyashita and M. Hosakawa, J. Aquat. Food Prod. Technol., 2005, 13, 53–70, DOI:10.1300/J030v13n04_05.
- M. A. Alamsjah and A. R. Md Nor, J. Aquacult. Fish Health, 2024, 13, 46–55, DOI:10.20473/jafh.v13i1.49943.
- J. Dai and R. J. Mumper, Molecules, 2010, 15(10), 7313–7352 Search PubMed.
- F. Chemat, N. Rombaut, A. G. Sicaire, A. Meullemiestre, A. S. Fabiano-Tixier and M. Abert-Vian, Ultrason. Sonochem., 2017, 34, 540–560 Search PubMed.
- S. U. Kadam, B. K. Tiwari, T. J. Smyth and C. P. O'Donnell, Ultrason. Sonochem., 2015, 23, 308–316, DOI:10.1016/j.ultsonch.2014.10.007.
- S. H. Baek, L. Cao, S. J. Jeong, H. R. Kim, T. J. Nam and S. G. Lee, J. Food Qual., 2021, 2021, 6640789, DOI:10.1155/2021/6640789.
- S. Pappou, M. M. Dardavila, M. G. Savvidou, V. Louli, K. Magoulas and E. Voutsas, Appl. Sci., 2022, 12, 2117, DOI:10.3390/app1204211.
-
H. W. Amini, P. Suryaningrum, I. Puspitasari, Z. Mumtazah, B. A. Fachri, M. F. Rizkiana and I. Rahmawati, in 8th Int. Conf. Food, Agric. Nat. Res. and Second Int. Conf. Sustainable Ind. Agric., Atlantis Press, Netherlands, 2024, pp. 181–196, DOI:10.2991/978-94-6463-451-8_17.
- B. S. Bheemaiah, N. A. N. Gowda, J. Subbiah, S. Chakraborty, P. V. V. Prasad and K. Siliveru, Foods, 2024, 13, 3684, DOI:10.3390/foods13223684.
- A. Javed, M. B. Alam, M. Naznin, R. Ahmad, C. H. Lee, S. Kim and S.-H. Lee, Antioxidants, 2024, 13, 690, DOI:10.3390/antiox13060690.
- S. G. Widyaswari, M. Metusalach, K. Kasmiati and N. Amir, Biodiversitas J. Biol. Diversity, 2024, 25, 1 Search PubMed.
|
| This journal is © The Royal Society of Chemistry 2026 |
Click here to see how this site uses Cookies. View our privacy policy here. 
 Open Access Article
 This Open Access Article is licensed under a
  a,
Devarajan
Thangadurai
a,
Devarajan
Thangadurai


