
 Open Access Article
 This Open Access Article is licensed under a Creative Commons Attribution-Non Commercial 3.0 Unported Licence
Portable Raman spectroscopy combined with machine learning for highly sensitive and rapid detection of food pollutants with flexible Ag@TiO2@polyester SERS substrates
Yingying
Huang
ab,
Daqian
Lu
d,
Sihang
Zhang
e,
Shouxiang
Jiang
*bc,
Yonghui
Zhou
a and
Jiangtao
Xu
 *ab
*ab
aCollege of Materials and Energy, South China Agricultural University, Guangzhou, 510640, China. E-mail: jiangtao.xu@scau.edu.cn
bSchool of Fashion and Textile, The Hong Kong Polytechnic University, Hong Kong, 999077, China. E-mail: kinor.j@polyu.edu.hk
cResearch Institute for Intelligent Wearable Systems, The Hong Kong Polytechnic University, Hung Hom, Kowloon, Hong Kong 999077, China
dSchool of Optometry, The Hong Kong Polytechnic University, Hong Kong, 999077, China
eSchool of Food Science and Engineering, Hainan University, Haikou, 570228, China
First published on 8th December 2025
Abstract
Surface-enhanced Raman spectroscopy (SERS) holds promise as a sensing technique, yet it faces challenges in precisely identifying trace contaminants in food due to limitations in substrate sensitivity and high surface purity. This study presents an SERS substrate enabling the precise and ultrasensitive identification of multiple pollutants combined with machine learning algorithms and a portable Raman spectrometer. The substrate achieves an enhancement factor of up to 1.02 × 10⁸. This enhancement is attributed to the synergistic effects of Ag nanoparticles (NPs) and a porous TiO2 layer on the substrate. Leveraging its high surface purity and exceptional sensitivity, the substrate successfully distinguishes between multiple hazardous pollutants with similar geometries and ultralow concentrations in aquatic products, aided by principal component analysis (PCA). Consequently, this effective SERS substrate, combined with artificial intelligence, advances the application of SERS technology in accurately identifying trace contaminants in the field of food safety.
Sustainability spotlightThe significance of the present study lies in its multifaceted contribution to the sustainability of food safety detection and green sensing technology. This study addresses the critical concern of human health and aquatic ecosystem risks posed by trace illegal pollutants in aquatic products as well as the potential environmental hazards of toxic chemical reagents in traditional SERS substrate synthesis, by fabricating flexible Ag@TiO2@PET SERS substrates via magnetron sputtering, a physical deposition method that avoids toxic chemicals and ensures high material utilization. The prepared substrate exhibits excellent sensing performance, with an enhancement factor of up to 1.02 × 10⁸ and an ultralow detection limit (down to 10−9 M), and when combined with portable Raman spectroscopy and PCA, it enables on-site, real-time and accurate identification of trace pollutants. Hence, the fabricated SERS substrate and detection strategy have the potential to advance sustainable food safety supervision while supporting environmentally friendly sensing practices, making a valuable contribution to responsible food production and consumption. |
Introduction
Sensitive identification of analyte molecules is of paramount importance in diverse fields such as chemical sensing, medicinal and biological detection, food safety and environmental analysis.1–3 Surface-enhanced Raman spectroscopy (SERS) has gradually emerged as an effective technique due to its unique vibrational fingerprints and single-molecule-level sensitivity.4 However, extracting and recognizing meaningful information from the rich signal of complex matrices or similar components also require continuous endeavour. In general, SERS substrates and chemical analytes are two key factors for performing SERS analysis with high accuracy, sensitivity and selectivity.Raman scattering is the inelastic scattering of photons, in which the frequencies of the incident photon and scattered photon are different during the interaction of light with molecules, providing vibrational and rotational information and other low-frequency transitions in molecules.5 Therefore, the Raman spectrum is an intrinsic fingerprint for molecular identification. However, the spontaneous Raman scattering effect is typically weak, which remains a major drawback of Raman spectroscopy. To resolve the inherent low-sensitivity problem of Raman spectroscopy, surface-enhanced Raman scattering (SERS) was proposed.6 According to numerous studies on the principle of SERS enhancement, there are two main mechanisms that contribute to the SERS effect: electromagnetic enhancement (EM) and chemical enhancement (CE). The EM theory proposes that the mechanism is the excitation of a localized surface plasma (LSPR), whereas CE proposes the formation of charge transfer (CT) from a complex system.7,8
The performance of single nanomaterials has limitations; therefore, composite materials have been developed and have considerable application value.9 Compared with single nanomaterials, composite materials composed of two or more materials have a greatly improved performance, an improved application value, and wider application fields.10 It is difficult to achieve strong SERS enhancement with simple semiconductor materials. Therefore, the development of precious metal and semiconductor composite materials can expand the theoretical and application development of SERS technology.6,11 The design and development of new composite SERS-active substrates are beneficial for theoretical and applied studies on SERS. Precious metals have been compounded with traditional semiconductor materials and have become a hotspot in SERS research due to their relatively simple recovery and excellent performance.12 In noble metal–semiconductor structures, noble metals exhibit a strong SPR effect in the visible region, which can expand light absorption. At the same time, noble metals generally have a lower Fermi level than semiconductors, and they can promote the separation effect of photogenerated electrons and holes and contribute to the promotion of the CT efficiency between metals.13 Semiconductor–metal hybrids have been widely discussed for SERS applications. For example, an intuitive 1T-2H mixed-phase magnetic molybdenum disulfide probe and a 2D graphitic carbon nitride substrate were prepared and used as a SERS-based recyclable immunoassay of CA125. The enhancement factor of 7 × 10⁸ was reached.14 Besides, nanostructures like Fe3O4@TiO2@Ag were also reported, and a limit of detection as low as 16.25 pg mL−1 was achieved.15
In addition, Raman spectroscopy can provide abundant information about molecular vibration modes;16 however, it is still too subjective to identify the Raman spectral features of each molecule, especially to distinguish between molecules with similar structures and spectral peak positions by visual inspection. Specifically, if the environmental detection object is analytes in food or biological samples, interference derived from various substances in the matrix makes it more difficult to effectively discriminate between molecules with analogous geometries. In order to precisely recognize chemical molecules by Raman spectra, the data analysis approach combined with machine learning can lead to more objective and accurate analysis results.
In this work, we have fabricated a SERS substrate by coating TiO2 and Ag nanoparticles (NPs) on PET fabric, which is subsequently applied for mixture detection using a portable Raman spectrometer. A porous layer of TiO2 is first constructed on the PET fabric using magnetron sputtering, followed by a process of Ag NP coating to generate dense and uniform hotspot areas. The present study is valuable and helpful for expanding the applications of SERS in the semiconductor material field as well as for developing novel semiconductor-based SERS-active substrates. Moreover, the magnetron sputtering-based substrate preparation improves material utilization and efficiency, while the process itself is easy and reproducible. The solvent-free physical vapor deposition process avoids residual chemical contaminants, e.g. citrates and polymers, which can generate interfering background signals and compromise detection. In addition, we have used machine learning techniques, i.e., a principal component analysis (PCA) model, to identify dependent variables and validate the dual selectivity of the sensor.
Experimental
Materials
Polyethylene terephthalate (PET) fabrics were used as the substrate, while high-purity silver (Ag, 99.99%) and titanium targets (Ti, 99.995%) were obtained from Beijing Zhongnuo New Materials Co., Ltd. Malachite green (MG, C23H25ClN2), crystal violet (CV, C25H30ClN3) and rhodamine 6G (R6G, C28H31N2O3Cl) powders were purchased from Shanghai Aladdin Biochemical Polytron Technologies Inc. All chemicals were used without further treatment.Fabrication of the porous Ag@TiO2@PET fabric
The Ag@TiO2@PET substrates were synthesized using radio frequency (RF) magnetron sputtering technology. The PET fabric was first cleaned using ultrasonic treatment and washed with an acetone solution before TiO2 deposition onto the PET samples. The fabrics were then cut into 10 cm × 10 cm pieces and attached to a sample holder. TiO2 was deposited onto the woven PET fabric using a magnetron sputtering system (ZZG/JT-350; AOYI) to fabricate the porous TiO2@PET fabric at a power of 200 W, with varying magnetron sputtering times (30 min, 60 min, and 90 min). The argon to oxygen ratio was maintained at 3![[thin space (1/6-em)]](https://www.rsc.org/images/entities/char_2009.gif) :7, i.e. 60 sccm and 140 sccm, respectively. The resulting TiO2@PET SERS substrates with various sputtering times were named TiO2@PET-30, TiO2@PET-60, and TiO2@PET-90, respectively.
:7, i.e. 60 sccm and 140 sccm, respectively. The resulting TiO2@PET SERS substrates with various sputtering times were named TiO2@PET-30, TiO2@PET-60, and TiO2@PET-90, respectively.
Next, Ag NPs were sputtered onto the PET fabric at room temperature, with the work pressure and base pressure sustained at 0.2 Pa and 5×10⁻³ Pa, respectively. The argon flow rate and sputtering power were maintained at 100 sccm and 100 W, respectively, and the deposition time was 7 min. The resulting Ag NP-coated fabrics with different substrates were named Ag@PET, Ag@TiO2@PET-30, Ag@TiO2@PET-60, and Ag@TiO2@PET-90, respectively.
SERS measurements
The MG powder was dissolved in deionized water to prepare different concentrations of MG solutions. The fabricated SERS substrates were cut into 10 × 10 mm2 pieces, and 10 µL of an MG aqueous solution was added to the surface of each sample and dried at room temperature for 5 min. The resulting small pieces were then analyzed using a Renishaw confocal micro-Raman spectrometer with a 785-nm laser.Additionally, the Ag@TiO2@PET SERS substrates were used to collect Raman signals of CV and R6G using a portable Raman spectrometer (Anton Paar, Cora5001) equipped with a 785-nm excitation laser. Principal component analysis (PCA) was performed to identify the mixed CV and R6G solution.
Characterization
The prepared samples were attached to a conductive tape and coated with gold before morphological observations were made using field-emission scanning electron microscopy (FESEM, TESCAN MAIA3). The crystal structure was analyzed using X-ray diffraction (XRD, Rigaku Smart Lab) in the normal mode with Cu Kα radiation (λ = 0.154 nm) at an accelerating voltage of 45 kV and a current of 200 mA within the scan range from 10° to 80° at a scanning speed of 10° min−1.Before elemental analysis, the samples were attached to a conductive tape with the same weight (5 mg) and then analyzed using X-ray photoelectron spectroscopy (XPS, Thermo Fisher Nexsa) with monochromatic and focused 12 kV aluminum Kα X-ray (hν = 1486.6 eV). The C 1s peak located at a binding energy of 284.8 eV was used for charge calibration, and the final obtained spectra were plotted and analyzed using Origin software. The absorbance was recorded using a UV-Vis spectrophotometer (Cary 300) in the wavelength range of 200–800 nm.
Principal component analysis (PCA)
Principal component analysis was employed to discriminate SERS spectra of different analytes and their mixtures. SERS spectra in the range of 100–2300 cm−1 were compiled into a data matrix (rows: individual spectra; columns: intensity at each wavenumber). Prior to PCA, the spectral data were autoscaled (mean-centered and variance-scaled) to ensure equal weighing of all spectral features. No baseline correction was applied due to the high surface purity of the Ag@TiO2@PET substrates and minimal background fluorescence.PCA was performed using the prcomp() function in R with the scale = TRUE parameter. The first two principal components (PC1 and PC2), which collectively explained over 50% of the total spectral variance, were visualized in two-dimensional score plots. Each spectrum was represented as a point in the PC1–PC2 space, with samples grouped by the analyte type and concentration. Confidence ellipses (95%) were drawn around each group using the ggbiplot package to assess clustering and separation. Complete separation between ellipses indicated the successful discrimination of different sample types based on their SERS spectral signatures.
Results and discussion
Material characterization
As shown in Fig. 1(a), Ag@TiO2@PET substrates were fabricated by two steps, which were the sputtering of the TiO2 layer and the Ag layer. After the successful completion of each step, the optical properties of each product changed, as shown in Fig. 1(b). The colors of PET, TiO2@PET, Ag@PET, and Ag@TiO2@PET substrates changed from white to yellow to silver grey, which suggests that Ag@TiO2@PET substrates have been successfully fabricated. The developed SERS substrates, combined with the PCA method, enable the composition of solvent mixtures to be analyzed using the portable Raman spectrometer illustrated in Fig. 1(c) and (d). | ||
| Fig. 1 (a) Schematic of the fabrication process of SERS substrates; (b) photographs of PET, TiO2@PET, Ag@PET, and Ag@TiO2@PET fabric; (c) portable Raman equipment; and (d) SERS detection of the mixed probe molecules with PCA analysis. | ||
The original PET fabric, Ag@PET, TiO2@PET, and Ag@TiO2@PET substrates were characterized using SEM, as shown in Fig. 2. In this work, the porous structure of TiO2 was altered by varying the deposition time. The original PET fabric had a smooth surface, while the deposition of TiO2 resulted in the formation of a porous structure with the pore size decreasing as the deposition time increased. The network veins became thicker and more granular after the deposition of Ag NPs. The porous TiO2 structure can be attributed to the oxygen partial pressure during deposition, which affects the dissociation rate of argon and, consequently, the deposition rate. Under high oxygen partial pressure, oxygen dissociation blocks argon ions from bombarding the target material, leading to a decrease in the nucleation density, an increase in the grain size, and the formation of fewer and irregular grains.17 These factors promote the formation of a TiO2 layer with a porous and rough columnar structure.
 | ||
| Fig. 2 SEM images of the (a) pure PET fabric, (b–d) TiO2@PET-30, TiO2@PET-60 and TiO2@PET-90, respectively, (e) Ag@PET substrate, and (f–h) Ag@TiO2@PET-30, Ag@TiO2@PET-60, and Ag@TiO2@PET-90, respectively. | ||
Additionally, the EDS mapping of the Ag@TiO2@PET substrate showed the presence of carbon, oxygen, titanium, and silver, as depicted in Fig. 3(a). These elements were uniformly distributed throughout the substrate, indicating the successful construction of Ag@TiO2@PET SERS sensors using magnetron sputtering. The TiO2 film deposited using magnetron sputtering is known to exist in either an amorphous or anatase phase, depending on the temperature of the cavity at the time of deposition. At low temperatures, the film is amorphous, while around 200 °C, it is partially crystallized.18,19 The oxygen content during sputtering also affects the crystallization process. Fig. 3(b) shows that no characteristic TiO2 peaks were observed, most likely indicating that the TiO2 porous layer deposited on the flexible textile substrate existed in an amorphous form. The amorphous TiO2 films observed in this study may be due to the lack of thermal treatment during the deposition process as well as the discontinuity of the PET fabric. The non-heated deposition process is suitable for most flexible textile substrates that are susceptible to high-temperature environments, resulting in the preparation of flexible, amorphous TiO2 coatings that adhere well to the textile substrate.
 | ||
| Fig. 3 (a) SEM EDS element mapping of the Ag NPs@TiO2@PET substrate; (b) X-ray diffraction patterns of the PET, TiO2@PET substrates, Ag@PET substrates, and Ag@TiO2@PET substrates; (c) high-resolution XPS spectra, and the (d) Ag3d 1s, (e) Ti 2p, and (f) O 1s spectra. | ||
As shown in Fig. 3(c–f), XPS studies were performed to determine the existence of silver and the oxidation state of titanium on the surface of the films and to assess the ability of the titanium dioxide layer to adsorb hydroxyl groups and water molecules. Fig. 3(b) presents the Ag 3d XPS spectrum of the Ag@TiO2@PET composite. Two characteristic peaks are observed at 368.4 eV and 374.4 eV, corresponding to the Ag 3d5/2 and Ag 3d3/2 orbitals, respectively, with a splitting energy of 6 eV. This result confirms that silver exists in a metallic state (Ag0).20 The position of the Ti2p doublet and the binding energy separation between the Ti2p3/2 and Ti2p1/2 peaks indicated that titanium was in the highest +4 oxidation state.21 Moreover, the area ratio of peaks associated with Ti2p3/2 and Ti2p1/2 was equal to 2:1, thus confirming the good stoichiometry of the coating. The results for the O 1s state revealed the ability of Ag@TiO2@PET to absorb hydroxyl radicals (OH−).22,23
SERS performance
Noble metal NPs are known to exhibit LSPR, which is associated with electric field enhancement. The LSPR characteristics and the spatial distribution of hotspots are strongly influenced by factors such as the composition, size, and shape of the particles, as well as the surrounding medium or substrate. Therefore, the Raman enhancement performance of the fabricated samples with different deposition times was investigated, and MG was selected as a probe molecule, which is a triphenylmethane dye and commonly used to dye cotton, silk, leather, and paper. However, MG has been illegally used in aquaculture systems as an antibacterial agent and a pesticide due to its strong effect, low cost, and lack of alternatives. Unfortunately, MG is easily absorbed by aquatic animals such as fish and crustaceans and causes respiratory poisoning. In addition, it has been found that MG is mutagenic, teratogenic, and carcinogenic for animals and humans. Therefore, the ultrasensitive detection of MG residues in food and environmental samples is of great interest. The Raman spectrum of the commercially available MG powder showed characteristic peaks at 1174 cm−1 (in-plane modes of C–H bending), 1219 cm−1 (C–H rocking), 1368 cm−1 (N-phenyl stretching) and 1399 cm−1 (N-phenyl stretching), which are consistent with the reported literature.24 As shown in Fig. 4(a–c), Ag@TiO2@PET-30 exhibited a higher SERS intensity of the characteristic peaks (1174 cm−1, 1219 cm−1, 1368 cm−1, and 1399 cm−1) than the other prepared substrates. In addition, the SERS enhancement factor (EF) was calculated based on the Raman data using the following formula: | (1) |
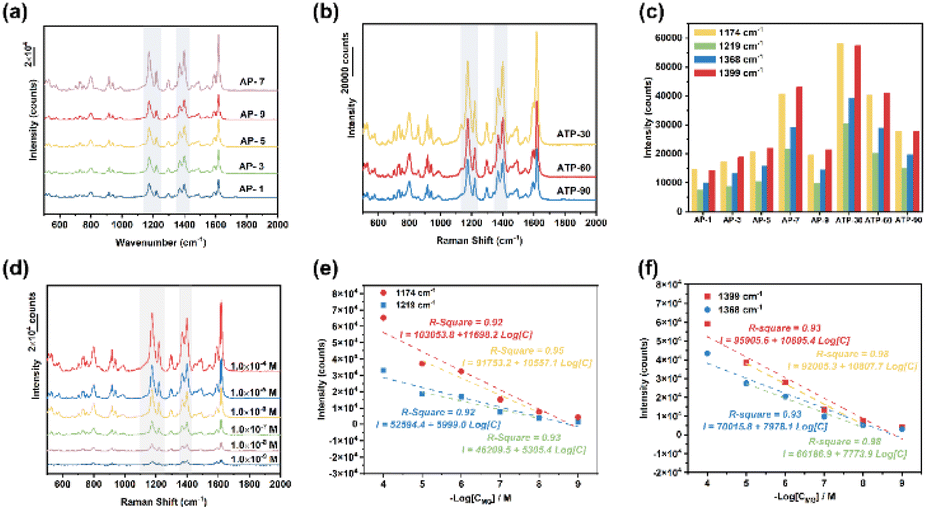 | ||
| Fig. 4 (a) Raman spectra of 10−3 M MG collected on the Ag@PET substrates; (b) Raman spectra of 10−3 M MG collected on the Ag@TiO2@PET substrates; (c) the signal intensity of 10−3 M MG at 1174 cm−1, 1219 cm−1, 1368 cm−1, and 1399 cm−1 collected on the Ag@PET and Ag@TiO2@PET substrates; (d) SERS spectra of MG detected on the Ag@TiO2@PET substrate in the concentration range from 10−4 to 10−9 M; and (e) and (f) quantitative relationship curves between the Raman intensity and the logarithm of the MG concentration. | ||
In this formula, CRaman and IRaman are the concentration and peak intensity at a selected Raman peak (1174 cm−1) of MG probe molecules for regular Raman measurements collected on pure PET substrates, respectively. ISERS and CSERS are the concentration and intensity of MG collected on the Ag@TiO2@PET SERS substrate, respectively. The Raman intensity of 10−2 M MG collected on PET substrates was 430 counts, and the SERS intensity of 10−9 M MG collected on SERS substrates was 4394 counts under identical experimental conditions. Therefore, the EF value was calculated to be 1.02 × 10⁸.
Subsequently, the fabricated samples were immersed in MG solutions with concentrations ranging from 1.0 × 10⁻⁴ M to 1.0 × 10⁻⁹ M, and the characteristic peaks of MG were clearly observed, as shown in Fig. 4(d). Even at a low concentration of 1.0 × 10⁻⁹ M, the characteristic bands at 1174 cm−1, 1219 cm−1, 1368 cm−1 and 1399 cm−1 could still be detected and clearly distinguished. Based on the linear curves in Fig. 4(e) and (f), for the characteristic peak at 1174 cm−1, the square of the correlation coefficient was calculated to be 0.92 within the MG concentration range from 1.0 × 10⁻⁴ M to 1.0 × 10⁻⁹ M using the linear regression equation I = 103053.8 + 11698.2log[C]; for the characteristic peak at 1219 cm−1, the square of the correlation coefficient was calculated to be 0.92 within the MG concentration range from 1.0 × 10⁻⁴ M to 1.0 × 10⁻⁹ M using the linear regression equation I = 52594.4 + 5999.0log[C]; for the characteristic peak at 1368 cm−1, the square of the correlation coefficient was calculated to be 0.93 within the MG concentration range from 1.0 × 10⁻⁴ M to 1.0 × 10⁻⁹ M using the linear regression equation I = 70015.8 + 7978.1log[C]; and for the characteristic peak at 1399 cm−1, the square of the correlation coefficient was calculated to be 0.93 within the MG concentration range from 1.0 × 10⁻⁴ M to 1.0 × 10⁻⁹ M using the linear regression equation I = 95905.6 + 10895.4log[C].
The reproducibility of the SERS signal is an important criterion for evaluating the quality of a freshly made substrate. To check the reproducibility of the SERS signal, 40 random points were tested on the entire substrate using a 1.0 × 10⁻³ M MG solution with a laser power of 1% and an integration time of 10 s. As shown in Fig. 5(a), the characteristic band of MB showed almost the same intensity. The relative standard deviations of Ag@TiO2@PET were calculated to be 5.6%, 7.2%, 11.5%, and 9.8% based on the measured Raman data in Fig. 5(b) and (c). The calculated relative standard deviation of 5.6% demonstrated a high degree of signal uniformity across the substrate, a critical attribute for reliable quantitative analysis. Apart from the reproducibility, the stability of the spectrum is also an important indicator of the SERS substrate. The prepared substrates were stored in a dark environment for 0, 10, 20, 30, 40, 50 and 60 days. Then, the SERS spectra were measured using a 1.0 × 10⁻³ M MG solution and the same experimental conditions as before. For the vibration bands of MG at 1174 cm−1, 1219 cm−1, 1368 cm−1 and 1399 cm−1, the Raman intensities changed from 57970.1 counts to 46448.8 counts, from 30314.3 counts to 25573.8 counts, from 39216.4 counts to 35177.7 counts, and from 57408.7 counts to 52246.4 counts after 60 days, respectively, as shown in Fig. 5(d) and (e). After 60 days, the peak intensity at 1174 cm−1, 1219 cm−1, 1368 cm−1 and 1399 cm−1 obtained for the Ag@TiO2@PET SERS substrates dropped 19.9%, 15.6%, 10.3%, and 9.0%, respectively. We reached a preliminary conclusion that the electronic transfer compensation provided by TiO2 could effectively protect Ag NPs from oxidation and endow Ag@TiO2@PET with long-term stability. The optical microscopic image and corresponding 2D Raman mapping of Ag@TiO2@PET SERS substrates are shown in Fig. 5(f), revealing that the high-density hot spots (red region) were highly uniformly distributed throughout the Ag@TiO2@PET substrate. This further demonstrated the good reproducibility of Ag@TiO2@PET, which is due to the compact PET fabric, porous TiO2 structure, and uniform distribution of Ag NPs.
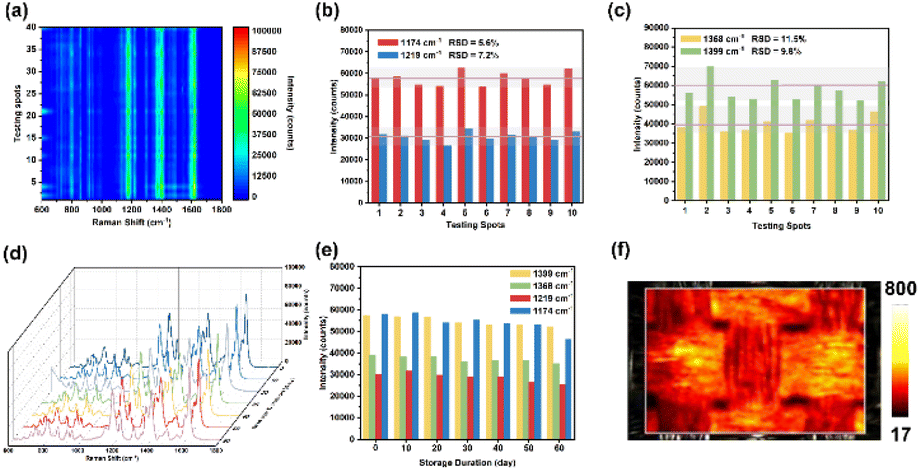 | ||
| Fig. 5 Reproducibility and stability of the Ag@TiO2@PET SERS substrate. (a) SERS contour plots of 10−3 M MG recorded at 40 random locations on Ag@TiO2@PET; (b) corresponding histograms of the Raman intensity at 1174 cm−1 and 1219 cm−1 for 10 random locations; (c) corresponding histogram of the Raman intensity at 1368 cm−1 and 1399 cm−1 for 10 random locations; (d) SERS spectra of 10−3 M MG detected on the fresh Ag@TiO2@PET SERS substrate after various storage times; (e) corresponding histogram of the Raman intensity at 1174 cm−1, 1219 cm−1, 1368 cm−1 and 1399 cm−1 for different storage times; and (f) 2D Raman intensity mapping of MG at 1174 cm−1 detected on the Ag@TiO2@PET SERS substrate under a 785-nm laser. | ||
Mechanisms
For a better understanding of the SERS performance of Ag@TiO2@PET SERS substrates, the distribution of the EM field intensity was simulated. The normalized electric field distributions (E/E0) from the front view of the TiO2@PET, Ag@TiO2@PET nanocavity structure and Ag nanoparticles are plotted in Fig. 6(a–c), respectively, using the 3D finite difference time-domain (FDTD) method.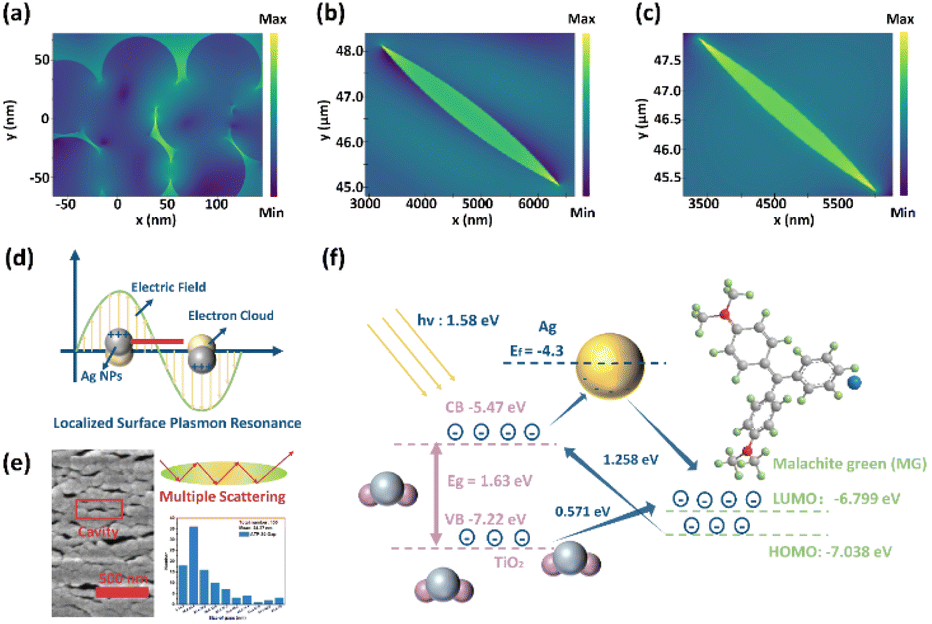 | ||
| Fig. 6 FDTD simulation (a–c); (d) LSPR; (e) light-matter coupling; and (f) charge transfer. | ||
This section discusses the use of microcavities to enhance the sensitivity of localized plasmonic exciton sensors, combining photonic microcavities with localized equipartitioned excitons in nanostructures. Therefore, it is necessary to investigate the electric field distribution of neighboring plasma nanoparticles. Here, silver nanoparticles with a diameter of 76.24 nm were used as a research model for simulations. The FDTD simulations of the electric field distribution of an AgNP-based SERS substrate in the x–y plane under a 785-nm excitation laser are shown in Fig. 6(a). A strong electric field exists in the nanogap between neighboring Ag nanoparticles, which is generated by the strong coupling effect of the LSPR of the plasmonic nanoparticles. Moreover, to gain a deeper insight into the nature of cavity structures with semiconductors and semiconductor–metals, the normalized electric field distributions (E/E0) from the front view of the TiO2@PET and Ag@TiO2@PET nanocavity structure are plotted in Fig. 6(b) and (c), respectively, using the FDTD method. These simulation results show that SERS hot spots can be formed in the nanocavity structure of metal-semiconductor materials and the nanogap between neighboring noble metal nanoparticles. Photon-plasmonic systems typically provide significantly higher detection sensitivity than photonic microcavity-based devices. Moreover, the mechanism of EM and the schematic of light-matter coupling in the TiO2 cavity are shown in Fig. 6(d) and (e), respectively.
The enhancement of substrate–molecule vibronic coupling, particularly the efficient execution of photoinduced charge transfer (PICT), is a decisive factor for the operational efficacy of nonmetal SERS technology. A meticulous investigation of the PICT pathways in molecule-semiconductor (MG-TiO2) systems (Fig. 6(f)) was conducted to unearth their contribution to this process. In agreement with prior studies, the highest occupied molecular orbital (HOMO) energy levels of MG are determined to be −7.038 eV, with the HOMO–lowest unoccupied molecular orbital (LUMO) gap of MG calculated to be 6.799 eV.25 The band gap of TiO2, as indicated in Fig. S6, is found to be 1.75 eV. The valence band (VB) of TiO2 was determined through valence-band XPS (Fig. S6), indicating a VB value of −7.22 eV for TiO2. The conduction band (CB) value of TiO2 is −5.47 eV.26
This is evident in the thermodynamically feasible processes in the system: (1) an exciton electron transfers from the VB state to the surface defect state; (2) a photoinduced electron transition occurs from the molecule's ground state to the CB state; and (3) a photoinduced electron transition occurs from the surface defect state to the molecule's excited state.
In the second process, the energy difference is lower than the energy of the excitation laser (785 nm, 1.58 eV) in the MG-TiO2 system, which promotes efficient PICT between MG and TiO2. It is important to note that while the PICT in the MG-TiO2 system can be facilitated, it may not be sufficient for sensitive SERS detection. Therefore, the SPR effect of Ag NPs is crucial, and the MG-Ag-TiO2 system can exhibit stronger SERS activity.
Mixed solution detection
The SERS spectra of CV and R6G were collected from their single standard solutions with different concentrations using portable Raman equipment. CV exhibited three main Raman characteristic peaks at 420 cm−1 (out-of-plane vibrations of phenyl-C-phenyl), 1174 cm−1 (C-phenyl and C–H in-plane antisymmetric stretching) and 1380 cm−1 (C–N and phenyl-C-phenyl antisymmetric stretching),27 and R6G exhibited four main Raman characteristic peaks at 614 cm−1 (C–C–C in-plane vibration), 1310 cm−1 (aromatic C–C stretching vibration mode), 1362 cm−1 (aromatic C–C stretching vibration mode), and 1510 cm−1 (aromatic C–C stretching vibration mode).28 The LOD is a common evaluation parameter in detection research; the LOD for CV and R6G was 10−7 M, as shown in Fig. 7(a) and (d). Fig. 7(b) and (e) show the intensity at the Raman characteristic peaks of CV and R6G. | ||
| Fig. 7 (a) SERS spectra of CV detected on the Ag@TiO2@PET substrate in the concentration ranging from 10−3 to 10−7 M; (b) the signal intensity of 10−3 M CV at 420 cm−1, 1174 cm−1, and 1380 cm−1 collected on the Ag@TiO2@PET substrates; (c) quantitative relationship curve between the Raman intensity and the logarithm of the CV concentration; (d) SERS spectra of R6G detected on the Ag@TiO2@PET substrate in the concentration range from 10−3 to 10−7 M; (e) the signal intensity of 10−3 M R6G at 614 cm−1, 1310 cm−1, 1362 cm−1, and 1510 cm−1 collected on the Ag@TiO2@PET substrates; and (f) quantitative relationship curve between the Raman intensity and the logarithm of the R6G concentration. | ||
The calibration curve between the SERS intensity at 420 cm−1, 1174 cm−1 and 1380 cm−1 and the concentration of CV is shown in Fig. 7(c). The calibration curve between the SERS intensity at 614 cm−1, 1310 cm−1, 1362 cm−1 and 1510 cm−1 and the concentration of R6G is shown in Fig. 7(f). Both revealed a good linear relationship in the concentration range from 10−3 M to 10−7 M. CV and R6G have different Raman characteristic peaks, which may be detected simultaneously due to the ultranarrow peak width and sharp peak of SERS technology, as shown in Fig. S7.
PCA analysis
To provide analytical identification via SERS spectra, PCA was performed on these spectra. PCA is a common multivariate data analysis tool, wherein the original correlated variables (e.g., raw SERS spectra) are transformed into a set of linearly uncorrelated variables called principal components (PCs). Among the PCs, the first PC normally explains the largest data variability, while each succeeding PC gradually accounts for less of the variance. Thus, through PCA, each recorded SERS spectrum of R6G, CV, MG and mixed molecules was projected as a single point in the two-dimensional (2D) coordinates of the first two PCs. Fig. 8(a–c) presents 10−5 M concentrations of CV and R6G and their mixed solutions. Fig. 8(d–f) presents 10−6 M concentrations of CV and R6G and their mixed solutions. As shown in Fig. 8, the PCA clustering plots illustrated that R6G and CV mixed molecules with different ratios could be clearly separated from pure R6G and CV solutions into individual clusters. Generally, no overlap among the clusters manifested that these samples were distinguishable. Furthermore, by comparison of the intracluster spacing, it was noticed that CV formed the tightest cluster, agreeing with the fact that it has the most distinctive SERS spectrum (Fig. 8(a–c)). The PCA result demonstrated the feasibility of our as-fabricated Ag NPs@TiO2@PET substrate for the discriminative analysis of these various analytes. | ||
| Fig. 8 Principal component analysis (PCA) plot for 10−5 M CV and 10−5 M R6G in different ratios: (a) 1:1, (b) 2:1 and (c) 1:2; PCA analysis plot for 10−6 M CV and 10−6 M R6G in different ratios: (d) 1:1, (e) 2:1 and (f) 1:2. | ||
MG has excellent antimicrobial ability and has been widely used in aquaculture to prevent roe from being infected with germs or to treat parasites, fungi, and protozoa. In addition, it is inexpensive and easy to obtain; hence, it has been widely used in aquaculture since the 1930s. Animal experiments have proven that MG harms liver function; leads to anemia, thyroid, and tumors; affects fetal growth; and carries risks of carcinogenicity, mutagenicity and teratogenicity. Therefore, many countries have banned the use of this substance in animal and aquatic products for human consumption. CV, in an organism after transformation, is also reduced to a fat-soluble, colorless reduction of crystal violet (leucocrystal violet). Because of the risks of carcinogenicity, genetic mutation, and teratogenicity, it has long been classified as a prohibited drug by regulations. As we all know, there is a significant overlap in the Raman spectra of MG and CV molecules. Hence, PCA was also employed for analytical identification using the SERS spectra obtained from simulated contaminated shrimp. PCA transforms correlated variables (raw SERS spectra) into uncorrelated principal components (PCs). The clustering plots in Fig. 9 illustrate the separation of 10−5 M concentrations of mixed MG and CV solutions into distinct clusters from pure MG and CV solutions. The tight cluster formed by CV correlates with its distinctive SERS spectrum (Fig. 9). The PCA results underline the potential of the Ag NPs@TiO2@PET substrate for differentiating various analytes.
 | ||
| Fig. 9 PCA plots for 10−5 M CV and 10−5 M MG in different ratios: (a) 1:1; (b) 1:2; and (c) 2:1. Application images (d) extraction of contaminants from shrimps and (e) portable Raman equipment. | ||
Conclusions
In conclusion, a clean and ultrasensitive SERS substrate was developed to accurately determine contaminants, aided by machine learning. The ATP substrate displayed higher SERS sensitivity (an EF of 1.02 × 10⁸) than single PET due to synergistic and cascading enhancement through resonant coupling and light trapping in the porous Ag–TiO2 layer. The substrate's green preparation distinguished it from composite substrates produced through chemical synthesis. Ultimately, the substrate's application enabled the precise differentiation of ultralow-concentration pollutants with similar geometrical structures using the PCA model. This clean and efficient SERS substrate holds significant potential in various fields, including food, environment, pharmaceuticals, and electrochemistry.Author contributions
Yingying Huang: conceptualization, investigation, formal analysis, methodology, visualization, writing – original draft, writing – review & editing. Daqian Lu: conceptualization, investigation, validation, formal analysis, methodology, writing – review & editing. Sihang Zhang: conceptualization, investigation, validation, formal analysis, methodology, visualization, writing – review & editing. Shouxiang Jiang: resources, supervision, writing – review & editing. Yonghui Zhou: methodology, visualization, writing – review & editing. Jiangtao Xu: conceptualization, resources, project administration, supervision, writing – review & editing.Conflicts of interest
There are no conflicts to declare.Data availability
The data will be made available on request.Supplementary information (SI): the figures of UV-vis spectra, Raman spectra of MG and PET, size statistics of cavity from random 100 points, VB calculation based on XPS spectra, image and Raman spectra of CV, image and Raman spectra of MG, Raman spectra of (a–c) mixed CV and R6G with the concentration of 10−5 M and (d–f) mixed CV and R6G with the concentration of 10−6 M. See DOI: https://doi.org/10.1039/d5fb00802f.
Acknowledgements
J. Xu thanks the financial supports from the Start-Up Fund of the South China Agricultural University, the Youth Project of Guangdong Provincial Department of Science and Technology (2023A1515110351), and the Youth Doctoral Program of Guangzhou Science and Technology Bureau (SL2023A04J00628).Notes and references
- T. Itoh, M. Procházka, Z.-C. Dong, W. Ji, Y. S. Yamamoto, Y. Zhang and Y. Ozaki, Chem. Rev., 2023, 123, 1552–1634 CrossRef CAS PubMed.
- D. Kukkar, M. Chhillar and K.-H. Kim, Biosens. Bioelectron., 2023, 232, 115311 CrossRef CAS PubMed.
- H. Pu, T. Fang, Z. Wu and D.-W. Sun, Trends Food Sci. Technol., 2023, 138, 697–707 CrossRef CAS.
- J. Zhou, Q. Lan, W. Li, L.-N. Ji, K. Wang and X.-H. Xia, Nano Lett., 2023, 23, 2800–2807 CrossRef CAS.
- J. Moon, M. Li, A. J. Ramirez-Cuesta and Z. Wu, in Springer Handbook of Advanced Catalyst Characterization, ed. I. E. Wachs and M. A. Bañares, Springer International Publishing, Cham, 2023, pp. 75–110, DOI:10.1007/978-3-031-07125-6_4.
- X. Wang and L. Guo, Angew. Chem., Int. Ed., 2020, 59, 4231–4239 CrossRef CAS PubMed.
- S. M. Quarin, A. C. Macke, L. N. Kissell, M. S. Kelly, A. Dayananda, J. Ungvary, G. Stan, R. I. Dima and P. Strobbia, ACS Sens., 2023, 8, 2000–2010 CrossRef CAS PubMed.
- J. Jin, Z. Guo, D. Fan and B. Zhao, Mater. Horiz., 2023, 10, 1087–1104 RSC.
- L.-L. Tan, M. Wei, L. Shang and Y.-W. Yang, Adv. Funct. Mater., 2021, 31, 2007277 CrossRef CAS.
- C. Zhang, S. Chen, J. Wang, Z. Shi and L. Du, Adv. Mater. Interfaces, 2022, 9, 2102468 CrossRef CAS.
- Y. Liu, H. Ma, X. X. Han and B. Zhao, Mater. Horiz., 2021, 8, 370–382 RSC.
- D. Kim, J. Kim, J. Henzie, Y. Ko, H. Lim, G. Kwon, J. Na, H.-J. Kim, Y. Yamauchi and J. You, Chem. Eng. J., 2021, 419, 129445 CrossRef CAS.
- O. Guselnikova, H. Lim, H.-J. Kim, S. H. Kim, A. Gorbunova, M. Eguchi, P. Postnikov, T. Nakanishi, T. Asahi, J. Na and Y. Yamauchi, Small, 2022, 18, 2107182 CrossRef CAS PubMed.
- R. Wang, H. Liu, T. Xu, Y. Zhang, C. Gu and T. Jiang, Biosens. Bioelectron., 2023, 227, 115160 CrossRef CAS PubMed.
- Y. Du, H. Liu, Y. Chen, Y. Tian, X. Zhang, C. Gu, T. Jiang and J. Zhou, Appl. Surf. Sci., 2020, 528, 146953 CrossRef CAS.
- R. Chikkaraddy, A. Xomalis, L. A. Jakob and J. J. Baumberg, Light: Sci. Appl., 2022, 11, 19 CrossRef CAS PubMed.
- S. Sai Guru Srinivasan, B. Govardhanan, P. Aabel, M. Ashok and M. C. Santhosh Kumar, Sol. Energy, 2019, 187, 368–378 CrossRef CAS.
- S. Tuckute, S. Varnagiris, M. Urbonavicius, M. Lelis and S. Sakalauskaite, Appl. Surf. Sci., 2019, 489, 576–583 CrossRef CAS.
- J. D. Liu, Z. W. Liu, Z. Q. Chen, H. J. Zhang and B. J. Ye, Appl. Surf. Sci., 2019, 496, 143527 CrossRef CAS.
- C. A. Huerta-Aguilar, Y. S. García Gutiérrez and P. Thangarasu, Chem. Eng. J., 2020, 394, 124286 CrossRef CAS.
- K. Sakamoto, F. Hayashi, K. Sato, M. Hirano and N. Ohtsu, Appl. Surf. Sci., 2020, 526, 146729 CrossRef CAS.
- M. Chi, X. Sun, G. Lozano-Blanco and B. J. Tatarchuk, Appl. Surf. Sci., 2021, 570, 151147 CrossRef CAS.
- L. Wang, B. Cheng, L. Zhang and J. Yu, Small, 2021, 17, 2103447 CrossRef CAS PubMed.
- Y. Zhang, Y. Huang, Y. Kang, J. Miao and K. Lai, Food Control, 2021, 130, 108367 CrossRef CAS.
- D. R. Rout, S. Chaurasia and H. M. Jena, J. Environ. Manage., 2022, 318, 115449 CrossRef CAS.
- X. Wang, W. Shi, S. Wang, H. Zhao, J. Lin, Z. Yang, M. Chen and L. Guo, J. Am. Chem. Soc., 2019, 141, 5856–5862 CrossRef CAS PubMed.
- C. Ebert, L. Tuchscherr, N. Unger, C. Pöllath, F. Gladigau, J. Popp, B. Löffler and U. Neugebauer, J. Raman Spectrosc., 2021, 52, 2660–2670 CrossRef CAS.
- J. Wang, J. Li, C. Zeng, Q. Qu, M. Wang, W. Qi, R. Su and Z. He, ACS Appl. Mater. Interfaces, 2020, 12, 4699–4706 CrossRef CAS PubMed.
| This journal is © The Royal Society of Chemistry 2026 |