
 Open Access Article
 This Open Access Article is licensed under a Creative Commons Attribution-Non Commercial 3.0 Unported Licence
Retracted Article: Microwave-assisted drying kinetics of cocoa pod husk (Theobroma cacao L.): physicochemical, techno-functional and phytochemical analysis
Esteban Jurado-Beizaga *
*
Department of Pharmacology, Bromatology and Toxicology, Faculty of Pharmacy and Biochemistry, Universidad Nacional Mayor de San Marcos, Lima 15001, Peru. E-mail: esteban.jurado@unmsm.edu.pe
First published on 12th December 2025
Abstract
This study explored microwave-assisted drying (MAD) as a sustainable strategy for the valorisation of cocoa pod husk (CPH), an important agro-industrial by-product. Drying kinetics were described using a Fick-based diffusion model for flat geometry, while the effective diffusivity (Deff) was modelled as a function of the mass-power ratio expressed in grams per watt (g W−1) using a modified Arrhenius equation, which allowed the kinetic parameters Deff, activation energy (Ea) and pre-exponential factor (D0) to be estimated to elucidate moisture transport under microwave irradiation. Moisture transfer followed Fick's law, with an exponential increase in Deff (3.74 × 10⁻⁷ to 7.44 × 10⁻⁷ m2 s−1) as g W−1 decreased. The Arrhenius fit (R2 = 0.93) yielded a low Ea (14.94 kJ mol−1) and D0 (9.23 × 10⁻⁷ m2 s−1), consistent with the experimental range, confirming efficient volumetric heating. Page's model provided the best fit (R2 = 0.99). The physicochemical properties (pH, °Brix) remained stable, while MAD conditions significantly influenced the functional and colour parameters, where higher powers reduced water retention capacity, but increased solubility and induced colour changes from reddish (0.26 g W−1) to yellowish (0.16 g W−1) tones. From a phytochemical point of view, the mildest condition (0.52 g W−1) achieved the highest retention of phenols (TPC), flavonoids (TFC), and antioxidant activity (FRAP, DRSC, ARSC), while excessive power caused degradation. Overall, MAD proved to be an efficient, controllable, and environmentally friendly technique for producing high-value CPH flour (<53 µm), supporting its potential application in functional and nutraceutical formulations within the sustainable valorisation of cocoa by-products.
Sustainability spotlightThis study advances the United Nations Sustainable Development Goals (SDGs) – Responsible Consumption and Production (SDG 12) and Industry, Innovation and Infrastructure (SDG 9) - by establishing microwave-assisted drying as an agile and energy-efficient technology to valorise cocoa pod husk (CPH), a globally abundant by-product. The process, which operates with an optimal power-to-mass ratio, drastically reduces drying time and preserves phytochemical integrity, allowing nutrient-rich CPH flour to be integrated into circular food systems. By minimising waste and maximising bioactive retention with antioxidant activity, this approach aligns with climate-smart processing principles, offering a replicable strategy for waste valorisation across agri-food value chains. |
1 Introduction
Cocoa beans rank among the most significant agricultural commodities worldwide. According to the International Cocoa Organization (ICCO), global production is projected to reach approximately 4.84 million metric tonnes during the 2024/25 period,1 underscoring its considerable economic relevance.The importance of cocoa extends beyond chocolate production, encompassing a range of by-products. Chief among these is the cocoa pod husk (CPH), which constitutes between 52% and 80% of the fruit's fresh weight.2–8 For every tonne of dried cocoa beans, around ten tonnes of wet CPH are generated,8 resulting in an estimated global output of approximately 48.4 million metric tonnes. This not only poses environmental concerns but also reflects a substantial underutilisation of a resource often treated as waste by the cocoa and chocolate industries. Effective management of CPH is essential for reducing food loss and promoting circular economy strategies within the food-energy-water (FEW) nexus.9 Rich in bioactive compounds, including polyphenols, flavonoids, methylxanthines, and dietary fibres, CPH exhibits antioxidant, anti-inflammatory, and cardioprotective properties.10–17 Its valorisation could mitigate environmental impact while enabling sustainable applications such as bioenergy generation, water recovery, functional materials, and the extraction of antioxidant-rich compounds for use in food, cosmetics, and pharmaceuticals.9,18
Agro-industrial by-products such as CPH should therefore be recognised as valuable secondary raw materials with economic, ecological, and social benefits. Transforming organic waste into reusable inputs fosters closed-loop systems and aligns with contemporary sustainability goals.17 Current waste management approaches increasingly focus on repurposing and valorising such by-products through innovative techniques, including their incorporation as functional ingredients.
In this context, microwave-assisted drying (MAD) has emerged as a green and efficient technology that reduces processing time, conserves energy, and preserves nutritional quality. The MAD process comprises three distinct phases: (i) an initial heating stage where microwave energy is absorbed by the moist material, raising its temperature until internal vapour pressure exceeds ambient levels; (ii) a rapid drying phase characterised by stable temperature and efficient moisture evaporation; and (iii) a falling-rate period where residual moisture is minimal, and excess microwave energy may lead to overheating or charring.19
Microwave penetration in biological materials is governed by their dielectric properties, primarily influenced by water content.20–22 Water acts as an effective dielectric medium, facilitating microwave transmission and internal heating.23 Under microwave irradiation, molecular dipoles rotate and disrupt hydrogen bonds, generating heat and increasing porosity, which accelerates the release of moisture.24
This study aims to investigate the drying kinetics of CPH under MAD conditions, using grams per watt (g W−1) as a key process variable. A dimensionless model based on Fick's second law for flat slab geometry is applied to describe moisture transfer.25 Additionally, the effective diffusivity (Deff) is modelled as a function of the charge density (m P−1) using a modified Arrhenius equation tailored to microwave systems.26–29 This approach enables the determination of Deff, activation energy (Ea), and pre-exponential factor (D0), providing a mechanistic understanding of moisture migration under microwave irradiation.
Finally, the resulting CPH flour (CPHF) is comprehensively characterised in terms of its physicochemical composition, techno-functional attributes, and phytochemical profile, offering critical insights into its potential as a value-added functional ingredient.
2 Materials and methods
2.1 Chemicals and reagents
All chemicals used in this study were of analytical grade including: gallic acid, trolox, (+)-catechin hydrate, 100% acetic acid (glacial), aluminium chloride hexahydrate, aluminium chloride trihydrate, iron(III) chloride hexahydrate, 2,20-Azino-bis (3-ethylbenzothiazoline-6-sulfonic acid) (ABTS), Folin–Ciocalteu reagent, 2, 4, 6-tripyridyl-s-triazine (TPTZ), and 2,2-diphenyl-1-picryl-hydrazil (DPPH), which were purchased from Merck KGaA (Darmstadt, Germany). Anhydrous sodium carbonate, sodium acetate trihydrate, and potassium persulfate were purchased from J.T.Baker (USA). NaOH was purchased from Macron Fine Chemicals (USA).2.2 Sample preparation
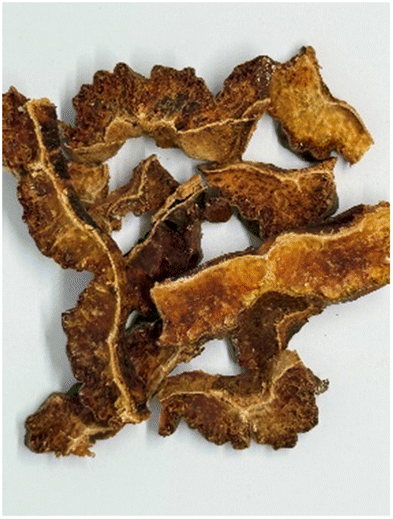
CPH was obtained from fine aroma cocoa of Amazon origin (Theobroma cacao L.) of the Forastero variety, provided by Kuyay chocolates, located in the Jahuanga zone, Bagua Grande district, Utcubamba province, Amazonas region, Peru (5°46′19.6′ “S 78°32′57.4′ ”W, 605 m altitude). The fresh CPH were washed and disinfected, then pulped and immediately prepared for the experimental drying design (Fig. 1). The initial moisture content was determined gravimetrically by drying representative samples in an oven at 105 ± 2 °C for 24 h until a constant weight, following the AOAC 925.10 method. The samples were not stored. | ||
| Fig. 1 Fresh sample of cocoa pod husk. | ||
2.3 Microwave-assisted drying (MAD) procedure
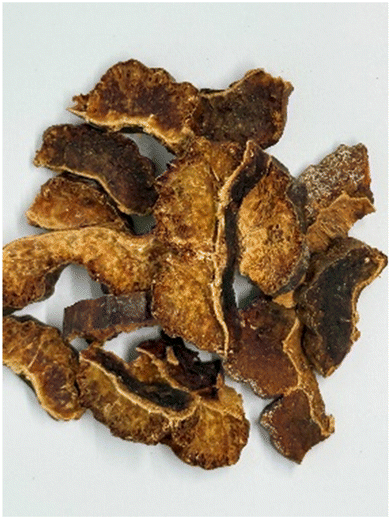
MAD was performed following the methodology described by Sianoun et al.30 with slight modifications, using a domestic microwave oven (Samsung MG40J5133AT, 95−950 W, 2450 MHz). Fresh CPH was manually cut with a stainless-steel knife to obtain slices with a thickness of 5 ± 0.3 mm. The samples were arranged in a single layer on a glass turntable to ensure a uniform distribution of radiation, avoiding overlap to promote uniform drying (Fig. 2). The experimental variable was defined as the mass-to-power ratio expressed in grams per watt (g W−1), with three levels: 0.16, 0.26, and 0.52 g W−1, corresponding to 16.66 ± 0.01 g, 25.08 ± 0.02 g, and 50.11 ± 0.03 g of sample mass, respectively, at a fixed power of 95 W. | ||
| Fig. 2 Fresh CPH sheets with a thickness of 5 ± 0.3 mm on a glass turntable. | ||
Drying was monitored at one-minute intervals until equilibrium moisture content was reached (defined as a variation of <0.01 g in three consecutive measurements).
2.4 Drying kinetics and mathematical modelling
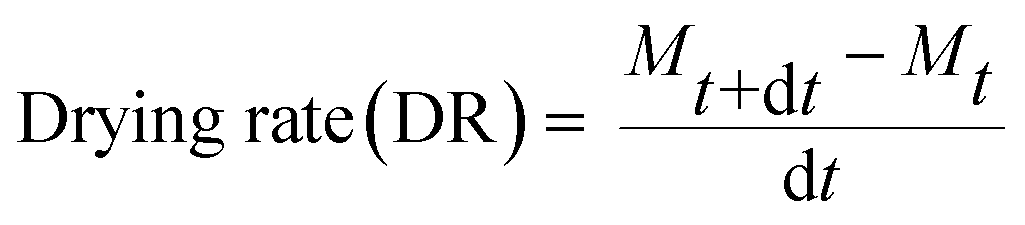
Drying curves were obtained by plotting the moisture ratio (MR) versus drying time, and drying rate as a function of the moisture ratio (MR) at different grams of CPH per watt.28 The MR of the CPH during drying was calculated using eqn (1):
 | (1) |
The drying rate was calculated as eqn (2):
 | (2) |
The drying curves were fitted using Lewis and Page thin-layer drying models.31,32 The Lewis model (Newton) can be considered a simplification of the Henderson and Pabis model, under the assumption that the food has a reduced thickness and that the air conditions remain uniform throughout the drying process. The model eqn (3) is expressed as follows:
| MR = exp(−kt) | (3) |
On the other hand, Page's model introduces an additional parameter (n) that improves the flexibility of the adjustment. The model eqn (4) is expressed as follows:
| MR = exp(−ktn) | (4) |
2.5 Calculation of effective diffusivity (Deff), activation energy (Ea), and pre-exponential factor (D0)
To describe the internal moisture transfer, a dimensionless parameter based on Fick's second law was used for a flat slab with one-dimensional symmetry,25 as shown in eqn (5) below:
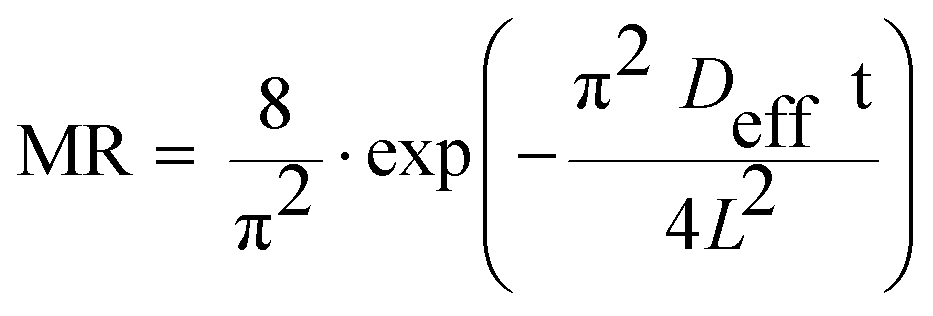 | (5) |
Eqn (5) was linearized as:
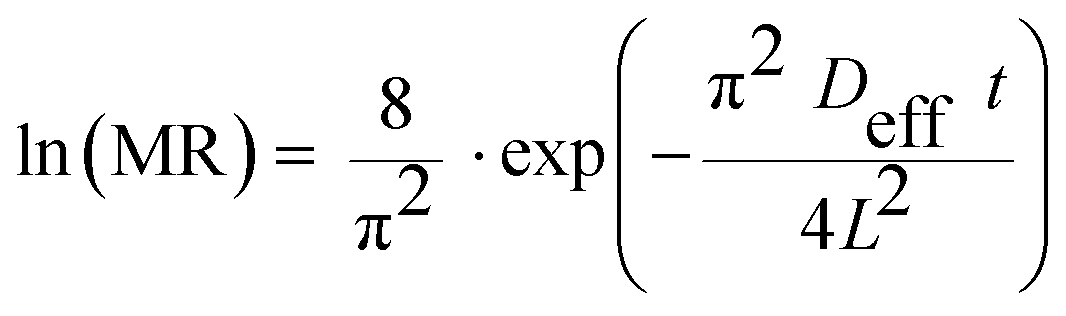 | (6) |
The value of Deff was estimated from the slope (k) of the linear regression between ln(MR) and time, using the following eqn (6):
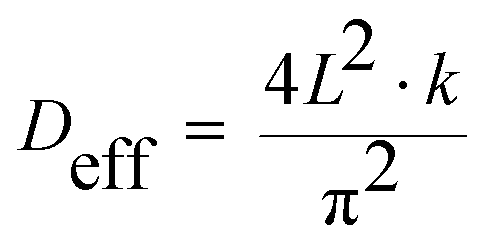 | (7) |
A modified version of the Arrhenius equation, suitable for systems subjected to microwaves, was used to represent the effect of charge density (m P−1) on internal moisture transport.27,28 The relationship is expressed by the following eqn (7):
 | (8) |
Eqn (7) was linearized as:
 | (9) |
From the linear regression of ln(Deff) as a function of 1/(m/P), the following parameters were estimated:
| Ea = − (slope); D0 = eintercept | (10) |
This model allows the quantification of how increasing the specific power (lower g W−1) reduces the energy barrier for moisture migration, increases Deff, and accelerates drying.
2.6 Physicochemical and techno-functional property determination
Total soluble solids (TSS) were determined according to the method (AOAC 932.12) with slight modifications. The samples in a 1![[thin space (1/6-em)]](https://www.rsc.org/images/entities/char_2009.gif) :10 ratio were homogenized with a vortex at maximum level for 1 min and then heated to 50 °C in a water bath for 5 min, followed by sample measurement using a digital refractometer (Kruss DR201-95, Germany) previously calibrated with distilled water.
:10 ratio were homogenized with a vortex at maximum level for 1 min and then heated to 50 °C in a water bath for 5 min, followed by sample measurement using a digital refractometer (Kruss DR201-95, Germany) previously calibrated with distilled water.
Colour was measured using a spectrophotometric method based on the CIELAB colour space (L*, a* and b*), employing a Bioevopeak SP-CRL301 device. In this system, the L* value represents lightness, the a* axis indicates a shift from red (+a*) to green (−a*), and the b* axis reflects the transition from yellow (+b*) to blue (−b*)
2.6.2. Techno-functional analysis
The water solubility index (WSI) and water holding capacity (WHC) of CPHF were determined according to Rodriguez Ambriz et al.33 with minor modifications. First, 1.00 g of CPHF (P0) was dispersed in 35 mL of distilled water at room temperature and vortexed for 5 min. The suspension was then transferred to a pre-weighed 50 mL centrifuge tube and left to stand for 1 h. The mixture was then centrifuged at 4390 rpm for 20 min, and the supernatant was carefully decanted into a pre-weighed Petri dish and dried at 105 °C for 12 h to obtain the dry soluble fraction (P1). The residue remaining in the centrifuge tube was drained at an angle of 45° for 10 min and weighed to determine the mass of the hydrated residue (P2). WSI and WHC were calculated using eqn (8) and (9), respectively:
 | (11) |
 | (12) |
The oil holding capacity (OHC) and swelling capacity (SWC) of CPHF were evaluated following the procedure described by Delgado-Ospina et al.5 with minor modifications.
To determine the OHC, the sample (0.5 g) was placed in a graduated cylinder and mixed with 5 mL of oil using a vortex mixer at maximum speed for 3 min. The mixture was allowed to rest for 24 h. Subsequently, the unabsorbed oil was separated by centrifugation at 3000 rpm for 20 min. The outcome was expressed as the volume change and g of oil retained per gram of sample (w/w).
For SWC assessment, the sample (0.5 g) was combined with 10 mL of water in a graduated cylinder. The mixture was vortexed at full speed for 3 min and allowed to stand for 24 h. The swelling capacity was reported as the increase in volume per gram of sample (v/w).
2.7 Ultrasound-assisted extraction (UAE)
The extracts of bioactive compounds from CPH were carried out using UAE according to the methodology described by Laurenti et al.34 with slight modifications. Two types of samples were evaluated: fresh CPH cut into 5 ± 0.3 mm thick slices and CPHF (<53 µm fraction) obtained after MAD at different charge densities (0.16, 0.26, and 0.52 g W−1). For each extraction, a 0.5 g sample (fresh and CPHF) was mixed with 25 mL of 50% ethanol (v/v), maintaining a solid–liquid ratio of 1:50. Extractions were carried out for 60 min at 50 ± 1 °C. After extraction, the mixtures were centrifuged at 5000 rpm for 5 min, and the volume of the supernatant was adjusted to 25 mL with the same solvent. All experiments were performed in triplicate. The UAE was selected for its high efficiency, low solvent requirements, and ability to promote cell matrix disruption, thereby facilitating the release of phenolic compounds and antioxidants.35 In addition, this technique favoured the recovery of heat-sensitive metabolites by minimising thermal stress and oxidation during the process.35 This approach is in line with the objective of evaluating how MAD influences the recovery and preservation of bioactive compounds in CPH, providing a comparative framework between fresh and MAD-treated samples.
2.8 Determination of phytochemical compounds and antioxidant activity
The TFC was determined following the modified method of Nguyen et al.12 Absorbance was measured at 510 nm using catechin as the standard and solvent as the control. The calibration curve was linear from 200 to 1000 µg mL−1 catechin, and the TFC values were expressed as mg CE per g DS.
2.8.2. Determination of antioxidant activity
The antioxidant activity of the CPH extracts was tested using ABTS Radical Scavenging Capacity (ARSC), DPPH Radical Scavenging Capacity (DRSC), and Ferric Reducing Antioxidant Power (FRAP). The ARSC assay was adapted from a method described by Re et al.37 Absorbance was recorded at 734 nm using ethanol as the control and Trolox as the reference standard. The calibration curve spanned from 0 to 300 µmol Trolox, and the ARSC results were reported as micromoles of Trolox equivalents per gram of dried sample (µmol TE g−1 DS). The DRSC analysis was based on the procedure described by Brand-Williams et al.38 Measurements were performed at 515 nm, with Trolox serving as the standard. The linear range of the calibration curve was extended from 60 to 600 µmol Trolox, and the results were expressed as µmol TE g−1 DS. The FRAP assay was performed following the protocol described by Benzie et al.,39 by measuring the absorbance at 593 nm. Trolox was used as the standard, and the solvent was used as the control. The standard curve was linear between 40 and 400 µmol Trolox, and the FRAP values were expressed in µmol TE g−1 DS.2.9 Statistical analysis
Statistical evaluation was performed of the effect of the grams per watt (g W−1) ratio on effective diffusivity (Deff), ln(Deff), and physicochemical, techno-functional, and phytochemical properties using analysis of variance (ANOVA) with a significance level of p < 0.05. When significant differences were found, comparisons of means between g W−1 levels were performed using Tukey's honest significant difference (HSD) test (p < 0.05). The results were reported as mean values and standard deviations (SD). All experiments were performed in triplicate. Model parameters were estimated by nonlinear regression analysis, using the Levenberg–Marquardt algorithm implemented through the minpack.lm package in the RStudio© environment (R Core Team, 2025). To assess the quality of fit, we mainly used the coefficient of determination (R2), complemented by the root mean square error (RMSE), reduced chi-square (χ2), Akaike information criterion (AIC), and difference in AIC (ΔAIC). These indicators were calculated using their respective equations. A good fit was reflected in the high values of R2 and reduced values of RMSE, χ2, and AIC. High values of ΔAIC were interpreted as strong evidence in favour of the model with a lower AIC, according to the model selection criteria.3 Results and discussion
3.1 Drying curves
The kinetics of microwave-assisted drying (MAD) of CPH with a thickness of 5 ± 0.3 mm was investigated at three specific mass-power ratios (0.52, 0.26, and 0.16 g W−1), corresponding to specific microwave powers of 1.90, 3.79, and 5.73 W g−1, respectively. The initial weights of the samples were 50.11 ± 0.03 g, 25.08 ± 0.02 g, and 16.66 ± 0.01 g, with corresponding final weights of 9.59 ± 0.48 g, 4.57 ± 0.26 g, and 4.38 ± 0.25 g. The initial moisture contents were 4.24 ± 0.23, 4.50 ± 0.27, and 2.81 ± 0.18 g of water per g of dry matter, equivalent to 80.9 ± 1.0%, 81.8 ± 0.8% and 73.8 ± 1.2% on a wet basis. At apparent equilibrium, the final moisture contents were 0.04 ± 0.05, 0.02 ± 0.00, and 0.04 ± 0.00 g of water/g of dry matter for each treatment, respectively. The slightly lower initial moisture content observed at 0.16 g W−1 compared to the other treatments reflects the inherent variability of the raw material rather than a methodological inconsistency. It is important to note that this difference did not affect the comparative evaluation of drying performance, as demonstrated by the final moisture indices (MR < 0.05) for all treatments.On the other hand, increasing the specific microwave power (decreasing the mass-power ratio) significantly reduced the average drying time, from 114 ± 12.72 min at 0.52 g W−1 (1.90 W g−1) to 87 ± 2.51 min at 0.26 g W−1 (3.79 W g−1) and 53 ± 1.52 min at 0.16 g W−1 (5.73 W g−1), which are shown in Fig. 3A, calculated using eqn (1). This inverse relationship follows a quasi-hyperbolic trend, in line with previous reports on microwave drying, in which increasing the specific power (or reducing the mass-power ratio) significantly accelerates moisture removal.40–42 In contrast, the drying-rate profiles shown in Fig. 3B, calculated using eqn (2), exhibited the expected behaviour for microwave drying under fixed-power conditions. At the beginning of the process (MR ≈ 1.0–0.8), the drying rate remained low but progressively increased as the material absorbed microwave energy and its internal temperature rose. After reaching this initial activation stage, all treatments entered a predominantly falling-rate period, with the drying rate gradually decreasing as moisture was depleted.
 | ||
| Fig. 3 Drying curves (A), drying time; (B), drying rate). Abbreviation: g W−1, grams per watt; DM, dry matter; DR, drying rate. | ||
As anticipated, the 0.16 g W−1 treatment, corresponding to the highest specific microwave power (5.73 W g−1), displayed the highest drying rates throughout the process, reflecting greater energy availability per unit mass and more efficient moisture removal. Intermediate behaviour was observed at 0.26 g W−1 (3.79 W g−1), whilst the 0.52 g W−1 treatment (1.90 W g−1) showed the lowest drying rates, consistent with reduced energy density and shallower microwave penetration depth when larger sample masses were used. At low moisture ratios (MR < 0.2), all treatments exhibited very small drying-rate values (≈0.001–0.005 g water per g DM·min), which is characteristic of the final stage of MAD, where only strongly bound water remains.
These results highlight the fundamental role played by the load-power ratio in optimising the MAD kinetics. This trend coincides with that observed by Nguyen et al.,43 who reported shorter drying times for CPH of 4−5 mm when increasing the specific powers of 0.77, 1.29, and 2.06 W g−1 (1.81, 1.24, and 0.83 h, respectively), demonstrating that higher energy intensities accelerate moisture migration and shorten drying time. Consistently, Valadez-Carmona et al.44 achieved rapid drying of a 1−3 mm thick CPH paste in just 11 min at 595 W, highlighting the advantage of high fixed power in thin-layer geometries. In contrast, Nieto-Figueroa et al.45 observed significantly longer drying times (105 min) at 220 W for similar configurations, demonstrating the combined effect of the field intensity and diffusion path length. Compared with conventional drying technologies, MAD is significantly faster. Valadez-Carmona et al.44 reported 24 h for freeze-drying and hot-air drying of CPH paste, while Nguyen et al.43 observed drying times ranging from 6 to 23.75 h for solar, hot-air, vacuum, and infrared methods. Overall, the results demonstrate that lower g W−1 ratios, equivalent to higher specific powers, improved water mobility, reduced internal diffusion resistance, and dramatically shortened the total drying time, offering a clear kinetic advantage for CPH valorisation processes.
3.2 Determination of effective diffusivity (Deff), activation energy (Ea), and pre-exponential factor (D0)
To quantitatively describe moisture transfer during CPH MAD, a dimensionless model based on Fick's second law for flat geometry was applied. Deff coefficients were estimated from the experimental moisture loss data using a linear regression of ln(MR) versus drying time, as shown in Table 1 for each mass-power ratio expressed in grams per watt (g W−1) using eqn (5) and (6). All experiments were performed in triplicate.| Treatment (g W−1) | Deff (m2 s−1) | ln(Deff) | Ea (kJ mol−1) | ln(D0) | D0 (m2 s−1) |
|---|---|---|---|---|---|
| a Results are presented as mean ± SD; a–c values in the same column denote significant differences (p < 0.05). Abbreviations: g W−1, grams per watt; Deff, effective diffusivity. ln, logarithm natural; Ea, activation energy; D0, pre-exponential factor. | |||||
| 0.52 | 3.74 × 10⁻⁷ ± 3.91 × 10⁻⁸ a | −14.80 ± 0.10a | 14.94 | −13.895 | 9.23 × 10⁻⁷ |
| 0.26 | 5.26 × 10⁻⁷ ± 1.93 × 10⁻⁸ b | −14.46 ± 0.04b | |||
| 0.16 | 7.44 × 10⁻⁷ ± 6.46 × 10⁻⁸ c | −14.11 ± 0.09c | |||
As the g W−1 ratio decreased (indicating a higher specific microwave power), the Deff values increased accordingly. Specifically, the average Deff rose from 3.74 × 10⁻⁷ m2 s−1 at 0.52 g W−1, to 5.26 × 10⁻⁷ m2 s−1 at 0.26 g W−1, and reached 7.44 × 10⁻⁷ m2 s−1 at 0.16 g W−1. This trend is also evident in the natural logarithm of Deff, which increased from −14.80 to −14.11, reflecting an exponential enhancement in moisture diffusivity with increasing energy input.
These results suggest that lower g W−1 ratios promote greater water mobility within the plant matrix, thereby accelerating the internal diffusion. This effect could be attributed to the volumetric heating of microwave radiation, which breaks the bonds that retain moisture and generates pronounced internal concentration gradients, improving the mass transfer from the interior to the surface.46,47
Consequently, the MAD efficiency depends not only on the surface heat transfer but also on the internal moisture diffusion, which is directly influenced by the intensity of the applied energy. This highlights the relevance of Deff as a key parameter for modelling microwave drying kinetics.
The Deff values obtained in this study (3.74 × 10⁻⁷ to 7.44 × 10⁻⁷ m2 s−1) represent a substantial improvement in water mobility compared to conventional thermal methods. Sianoun et al.30 observed much lower Deff values (7.97 × 10⁻¹⁰ to 13.29 × 10⁻¹⁰ m2 s−1) for hot-air drying of CPH at 50−70 °C, up to three orders of magnitude lower, which the authors attributed to the increase in operating temperature that generated higher Deff values, resulting in a reduction in drying time. This superiority is consistent with that of other plant matrices. For instance, Amer et al.48 reported Deff values of 1.35 × 10⁻¹⁰ to 7.88 × 10⁻¹⁰ m2 s−1 in hot-air dried banana slices (40–70 °C), suggesting that differences in results could be attributed to initial moisture content, material shape and composition, as well as drying temperature, pre-treatments, and drying equipment. For example, Sobowale et al.49 found Deff values ranging from 9.32 × 10⁻¹⁰ to 8.02 × 10⁻⁹ m2 s−1 to 8.39 × 10⁻⁹ m2 s−1 white onion and from 8.91 × 10⁻¹⁰ to 8.39 × 10⁻⁹ m2 s−1 for red onions for samples between 2, 4 and 6 mm at temperatures of 40, 50 and 60 °C, which they attribute to better moisture movement in thinner slices compared to thicker ones. Similarly, Turan et al.50 reported Deff values of 2.59 × 10⁻⁹, 5.18 × 10⁻⁹, 7.69 × 10⁻⁹, and 1.28 × 10⁻⁸ m2 s−1 for thyme dried in a conventional oven. These comparisons highlight the consistent advantage of MAD in enhancing mass transfer efficiency by increasing Deff, reducing energy barriers, and shortening drying times through volumetric heating.
To characterise the dependence of Deff on the mass-to-power ratio (g W−1), a modified Arrhenius-type model was applied using a dimensionless formulation, through eqn (7). This approach enabled the estimation of Ea and D0. The linear fit (Fig. 4) yielded a high coefficient of determination (R2 = 0.9383), confirming that the charge density (g W−1) effectively describes the internal diffusion behaviour under microwave heating. The negative slope of the regression line (−1.7974) indicates that as the g W−1 ratio decreases (specific power increases), the exponential term in the Arrhenius equation increases, resulting in higher Deff values, which is consistent with the empirical trend observed in Table 1. The estimated pre-exponential factor (D0 = 9.23 × 10⁻⁷ m2 s−1) is of the same order of magnitude as the experimental Deff values, suggesting that the model is well-calibrated to the actual mass transport dynamics within the plant matrix. The apparent Ea was found to be 14.94 kJ mol−1, indicating a relatively low energy barrier for moisture migration under microwave conditions. This implies that less additional energy is required to initiate water diffusion at lower g W−1 ratios, which enhances the internal moisture gradients and increases Deff. This mechanism would help explain the significant reduction in drying time from 114 ± 12.7 min at 0.52 g W−1 to 53 ± 1.5 min at 0.16 g W−1. The low Ea value obtained in this study (14.94 kJ mol−1) is notably lower than those reported for conventional drying methods. For instance, Sianoun et al.30 reported 70.48 kJ mol−1 for convective drying of CPH, Turan et al.50 found 21.40 kJ mol−1 for thyme, Amer et al.48 reported 34.29 kJ mol−1 for banana slices, and Sobowale et al.49 observed values between 55.98 and 65.68 kJ mol−1 for white and red onions. These comparisons highlight the enhanced efficiency of MAD, in which reduced energy barriers facilitate faster dehydration. The estimated D0 = 9.23 × 10⁻⁷ m2 s−1 also reflects the high mass transfer potential under microwave irradiation. However, this value was lower than that typically reported for convective methods. For example, Sianoun et al.30 reported a D0 of approximately 4.81 × 10⁻⁶ m2 s−1 for hot-air drying at 50–70 °C. Such discrepancies may arise from methodological differences, including the linearization approach used for the Arrhenius equation, the considered temperature range, and unique effects of dielectric heating in microwave systems.
 | ||
| Fig. 4 Linear fit of the Arrhenius equation modified by charge density (g W−1). | ||
3.3 Fitting mathematical models
The performances of the mathematical models at each experimental level are shown in Fig. 5, calculated using eqn (3) and (4). The Page model closely followed the experimental data across all drying stages, whereas the Newton model overestimated the moisture ratio (MR) during the final phase of drying. | ||
| Fig. 5 Fitting of the mathematical models (Newton and Page) at each experimental level (A), 0.52 g W; (B), 0.26 g W; (C), 0.16 g W−1). | ||
Table 2 presents the fitting parameters for both models, describing the behaviour of the MR in the CPH during the MAD. In both models, the drying rate constant (k) increased as the g W−1 ratio decreased, quantitatively confirming the accelerated drying at a higher specific power. This trend aligns with the observed increase in Deff and reduction in drying time, reinforcing the direct relationship between microwave power, internal diffusion, and moisture removal rate. Regarding the model exponent (n), the Page model yielded the Page model yielded values between 1.46 and 1.62, which is indicative of a falling-rate period dominated by internal resistance to moisture migration. This is consistent with the low Ea = 14.94 kJ mol−1 determined earlier, suggesting that internal diffusion is the rate-limiting mechanism.
| g W−1 | Model | Constants | R2 | χ2 | RMSE | SSE |
|---|---|---|---|---|---|---|
| a Abbreviations: g W−1, grams per watt; k, drying constant; t, time; n, empirical parameter; R2, coefficient of determination; χ2, chi-square; RMSE, root mean square error; SSE, sum of squares error. | ||||||
| 0.52 | Newton | k = 0.01875 | 0.9302 | 9.77014 | 0.08506 | 2.50364 |
| Page | k = 0.00153 | 0.9935 | 1.56041 | 0.02586 | 0.23138 | |
| n = 1.62209 | ||||||
| 0.26 | Newton | k = 0.03163 | 0.9603 | 4.67375 | 0.06282 | 1.04599 |
| Page | k = 0.00612 | 0.9991 | 0.24294 | 0.00911 | 0.02201 | |
| n = 1.45840 | ||||||
| 0.16 | Newton | k = 0.04558 | 0.9537 | 2.9444 | 0.06792 | 0.75668 |
| Page | k = 0.01054 | 0.9943 | 0.5104 | 0.23701 | 0.09212 | |
| n = 1.46006 | ||||||
The statistical indicators further confirmed the superiority of Page's model, which achieved R2 values between 0.993 and 0.999, with RMSE and SSE values between 3 and 10 times lower than those of Newton's model. In addition, the AIC and ΔAIC values clearly favoured Page's model, with a ΔAIC greater than 340 at all experimental levels, well above the threshold of 10, which is normally used to indicate a significantly better model (Table 3).
| Treatment (g W−1) | AIC_Newton | AIC_Page | Δ_AIC | |
|---|---|---|---|---|
| a Abbreviations: g W−1, grams per watt; Δ, delta. | ||||
| 0.52 | 0.52 | −719.4213 | −1541.3873 | 821.9660 |
| 0.26 | 0.26 | −710.6755 | −1731.8219 | 1021.1464 |
| 0.16 | 0.16 | −412.6898 | −756.0367 | 343.3468 |
These results are consistent with those of previous studies on plant matrices. In this regard, Sianoun et al.30 reported an R2 > 0.99 for the Page model in CPH hot-air drying. Similarly, Turan et al.50 reported strong agreement with the Page model (R2 = 0.98–0.99) in thyme, while Sobowale et al.49 also observed superior performance of the Page model (R2 = 0.97–0.98) with a low residual SSE in white and red onions. Among other models, Amer et al.48 found excellent fits using the Midilli–Kucuk model for banana slices, with a high R2 and low RMSE and χ2 values.
3.4 Physicochemical properties of cocoa pod husk flour
MAD at different specific powers (0.52, 0.26, and 0.16 g W−1) exerted a clear modulatory effect on the physicochemical and techno-functional properties of CPHF from the Forastero variety, particularly in the ultrafine fraction (<53 µm). The results, summarized in Table 4, reveal that while some properties remained stable across treatments, others were significantly altered by the applied energy density.| Treatment | 0.52 g W−1 | 0.26 g W−1 | 0.16 g W−1 |
|---|---|---|---|
| a Results are presented as means ± SD; a–c values in the same row denote significant differences (p < 0.05). Abbreviations: g W−1, grams per watt; MAD, microwave-assisted drying; CPHF, cocoa pod husk flour; L*, lightness; a*, -red (+) and green (−); b*, -yellow (+) and blue (−). WHC, water holding capacity (g g−1); OHC, oil holding capacity (g g−1); SWC, swelling capacity (%) and WSI, water index solubility (%). | |||
| MAD | 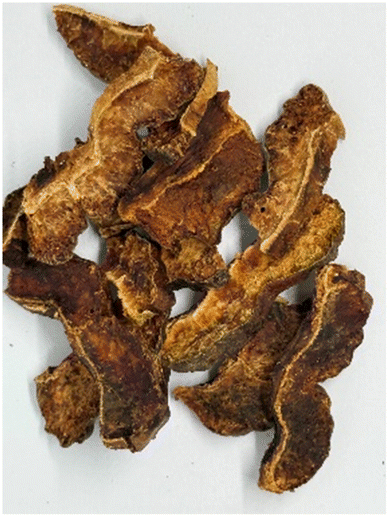 |
 |
 |
| CPHF (<53 µm) | 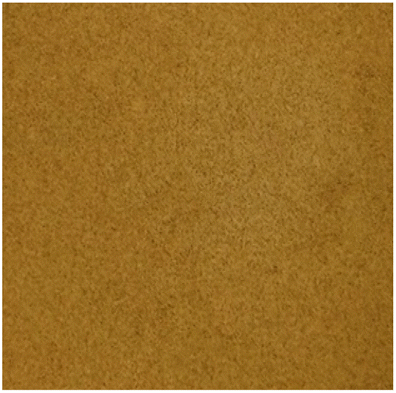 |
 |
 |
|
|||
| Physicochemical | |||
| pH | 5.49 ± 0.01a | 5.48 ± 0.01a | 5.47 ± 0.02a |
| °Brix | 2.00 ± 0.20a | 2.10 ± 0.10a | 2.00 ± 0.10a |
|
|||
| Colour | |||
| L* | 66.66 ± 1.76a | 64.79 ± 1.32b | 66.29 ± 0.65c |
| a* | 10.22 ± 0.46b | 11.34 ± 0.70b | 10.87 ± 0.42a |
| b* | 31.80 ± 0.50b | 31.64 ± 0.70b | 34.57 ± 0.89a |
|
|||
| Techno-functional | |||
| WHC | 15.36 ± 0.91a | 9.88 ± 0.54b | 6.39 ± 0.27c |
| OHC | 1.45 ± 0.04a | 1.55 ± 0.05a | 1.54 ± 0.05a |
| SWC | 0 ± 0a | 0 ± 0a | 0 ± 0a |
| WSI | 16.87 ± 0.77a | 22.41 ± 0.66b | 25.02 ± 0.39c |
From a physicochemical standpoint, both pH and soluble solids content (°Brix) remained statistically unchanged across all treatments (pH 5.47–5.49; °Brix ≈ 2.0), with no significant differences (p > 0.05). This stability suggests that microwave-induced dielectric heating did not promote acid hydrolysis or the formation of organic acids, nor did it cause volatilisation or caramelisation of soluble solutes-because of the moderate internal temperatures reached (<80 °C). These findings are consistent with those reported by Delgado-Ospina et al.,5 who observed similar pH values in freeze-dried CPH (Cuatrecasas 13377 COL), and by Jaimes et al.51 and Murillo-Baca et al.,52 who reported comparable values in conventionally dried CPH of the CCN-51 and Criollo varieties. Notably, the ultrafine particle size used in this study (<53 µm) did not appear to increase susceptibility to thermal degradation, despite its higher surface area.
In terms of chromatic properties, microwave power also influenced the visual appearance of the flour, as reflected in the CIELAB colour parameters. The intermediate treatment (0.26 g W−1) produced the darkest and most reddish flour (L* = 64.79 ± 1.32; a* = 11.34 ± 0.70), likely due to a favourable balance between temperature and residence time that enhanced Maillard reactions without causing excessive browning. At the highest power (0.16 g W−1), the b* value peaked at 34.57 ± 0.89, indicating a more yellowish hue, possibly due to the release of carotenoids or the formation of early-stage melanoidins.53 By contrast, the lowest power (0.52 g W−1) preserved the original luminance (L* = 66.66) and yielded the lowest a* and b* values, suggesting minimal pigment formation.
These colour trends are consistent with those reported by Delgado-Ospina et al.,5 who found that bleaching and pre-treatments influence CPHF colour, and Valadez-Carmona et al.,44 who linked MAD with colour preservation owing to less structural damage to the matrix. Murillo-Baca et al.52 reported lighter colours in coarser fractions (L* = 70.63–71.17), further highlighting the combined influence of particle size and thermal exposure on chromatic outcomes.
3.5 Techno-functional properties of cocoa pod husk flour
The techno-functional properties were significantly affected by the MAD conditions. In this respect, significant differences (p < 0.05) were found for WSI and WHC, which were calculated using eqn (8) and (9) respectively, whereas for OHC and SWC the different MAD treatments did not show significant differences (Table 4). WHC decreased significantly with increasing specific power, falling from 15.36 ± 0.91 g g−1 at 0.52 g W−1 to 6.39 ± 0.27 g g−1 at 0.16 g W−1. This decrease could reflect the collapse of the cellular microstructure and the loss of hydrophilic sites under high energy density. In this regard, drying studies that included microstructural analysis by scanning electron microscopy (SEM) conclude that MAD would better preserve the microstructure of CPH,44 possibly owing to pressure gradients that form dry layers from the inside out.54 Conversely, WSI increased from 16.87 ± 0.77% at 0.52 g W−1 to 25.02 ± 0.39% at 0.16 g W−1, suggesting behaviour indicative of the thermal fragmentation of polysaccharides and proteins, which would generate low molecular weight soluble fractions.55–58 On the other hand, SWC was zero in all treatments, probably because of the absence of macrostructural porosity in the ultrafine fraction, which coincides with what has been reported for fractions < 150 µm of CPHF, in which relatively low swelling values (2.41 g g−1) were observed.59 Furthermore, in complex matrices, it has been reported that swelling is directly determined by porosity and by the volume available for capillary expansion of water.60 In contrast, OHC remained relatively stable in all treatments (1.45–1.54 g g−1), suggesting that lipid binding capacity is less sensitive to both particle size and microwave intensity, although some reduction would be expected because of the limited formation of porous networks in ultrafine flours.60Similar trends have been reported for CPHF, which includes different fractions, varieties, and drying treatments. In this regard, Delgado-Ospina et al.,5 found significant differences in the values of WHC 27.2–29 g g−1, SWC 12.4–17.8 and OHC 1.81–2.22 g g−1 for CPHF in the Criollo Cuatrecasas 13377 variety (COL) in the three pre-treatments used (freezing, blanching and enzymatic browning) and freeze-drying (24 h) in the 0.5 mm (500 µm) fraction, where they found that freezing obtained higher values for WHC and OHC, and lower SWC, highlighting that prior blanching would have favoured the opening of internal cavities and, improved retention, but also weakened the structure, limiting expansion. In addition, it highlights that in enzymatic browning, this effect was intensified by the enzymatic action of expansins,61 which degraded the cell wall and exposed polar groups, increasing OHC but reducing SWC. In contrast to Martínez et al.,62 they found lower WHC values of 5.81 to 5.86 g g−1, SWC 5.70–5.81 mL g−1 and OHC 1.8–1.20 g g−1 in CPHF in the Taura and Cone varieties, with a washing pre-treatment to minimise the loss of soluble fibres and dried by air tunnel at 60 °C (12 h) in the 220–640 µm fraction, where they highlight that these values would be related to the chemical structure of the polysaccharide components and other factors such as porosity, particle size, ionic form, pH, temperature, ionic strength, type of ions in solution, and stresses on the fibres.63 Similarly, Yapo et al.16 found values of WHC 6.5 g g−1, SWC 7.3 mL g−1, and OHC 1.9 g g−1 for oven-dried CPHF at 40–45 °C in the 0.25 mm (250 µm) fraction, attributing these values to the amount of soluble dietary fibre and its hydration properties.
These findings, in line with previous studies, highlight the importance of controlling drying conditions as a technological tool for modulating specific functional characteristics of CPHF, with potential application in the development of functional ingredients and innovations in food formulations.
Furthermore, they reinforce the potential of MAD as a versatile and adjustable technology for the valorisation of cocoa by-products, such as CPH, as previously proposed by Delgado-Ospina et al.,5 Nguyen et al.,43 and Valadez-Carmona et al.44
3.6 Phytochemical characterisation and antioxidant activity of cocoa pod husk flour based on microwave-assisted drying kinetic levels
MAD had a notable impact on the phytochemical composition and antioxidant potential of CPHF, with different results observed at the different specific power levels applied (0.52, 0.26, and 0.16 g W−1), as detailed in Table 5.| Treatment | FS | g W−1 | ||
|---|---|---|---|---|
| 0.52 | 0.26 | 0.16 | ||
| a Results are presented as means ± SD; a–d values in the same row denote significant differences (p < 0.05). Abbreviations: g W−1, grams per watt; FS, untreated fresh sample; TPC, total phenol content; TFC, total flavonoid content; DRSC, DPPH radical scavenging capacity; ARSC, ABTS radical scavenging capacity; FRAP, ferric reducing antioxidant power; GAE, gallic acid equivalent; CE, catechin equivalent; TE, Trolox equivalent. | ||||
| TPC (mg GAE g−1) | 1.50 ± 0.00a | 2.40 ± 0.13b | 2.32 ± 0.03b | 1.26 ± 0.07c |
| TFC (mg CE g−1) | 0.22 ± 0.00a | 2.97 ± 0.15b | 2.70 ± 0.03c | 1.67 ± 0.10d |
| DRSC (µmol TE g−1) | 3.28 ± 0.13a | 11.40 ± 0.46b | 9.38 ± 0.19c | 4.24 ± 0.06d |
| ARSC (µmol TE g−1) | 3.39 ± 0.06a | 7.35 ± 0.38b | 6.87 ± 0.24b | 4.17 ± 0.05c |
| FRAP (µmol TE g−1) | 3.40 ± 0.02a | 6.61 ± 0.29b | 5.72 ± 0.25c | 3.52 ± 0.03a |
The mildest condition (0.52 g W−1) produced the highest retention of bioactive compounds, with a TPC reaching 2.44 ± 0.13 mg GAE g−1 DS and TFC of 2.97 ± 0.15 mg CE g−1 DS, representing a 1.6 and 13.5 fold increase for TPC and TFC, respectively, compared to the fresh matrix. In contrast, the most intense treatment (0.16 g W−1) resulted in notable reductions (TPC = 1.26 ± 0.07 mg GAE g−1 DS; TFC = 1.67 ± 0.10 mg GAE g−1 DS), which could suggest that an excess of microwave energy per gram of sample may accelerate thermal degradation and oxidative loss of polyphenols, despite the shorter drying time used.19
In contrast, antioxidant activity followed a similar pattern. The 0.52 g W−1 treatment produced the highest values in all tests: ARSC (7.35 ± 0.38 µmol TE g−1 DS), DRSC (11.40 ± 0.46 µmol TE g−1 DS), and FRAP (6.61 ± 0.29 µmol TE g−1 DS), being 2.16, 3.47, and 1.94 times higher for ARSC, DRSC, and FRAP respectively, compared to the fresh sample. The intermediate condition (0.26 g W−1) maintained high antioxidant levels, while the highest energy input (0.16 g W−1) produced values only slightly higher than the fresh sample, being statistically significant (p < 0.05) for DRSC and ARSC, unlike FRAP.
The values for TPC, TFC, and antioxidants (ARSC, DRSC, and FRAP) obtained in this study, although significantly improved compared to the fresh sample, were lower than those documented under different drying conditions and post-drying extraction methods. For example, Nguyen et al.43 reported that various dehydration methods (solar, hot-air, vacuum, infrared, and MAD) significantly affected (p < 0.05) TPC values in the Trinitario CPH (fraction ≤ 1.4 mm). In this study, microwave drying at 720 W for 0.83 h produced the highest TPC (12.22 mg GAE g−1 DS). This could be explained by differences in CPH variety, particle size, solvent type (water vs. hydroalcoholic), and extraction conditions (water bath). This study also highlighted the role of MAD in preserving heat-sensitive compounds and maintaining cell integrity, as SEM showed that microwave drying treatment at 720 W preserved the cell microstructure more effectively, which could facilitate the subsequent release of phenolic compounds.43
In a related study, Nguyen et al.12 reported higher values for TPC 29.01 mg GAE g−1 DS and TFC 49.93 mg CE per g DS, under identical drying conditions (MAD at 720 W), variety and particle fraction, indicating that the post-MAD extraction method, such as microwave-assisted extraction (MAE), could substantially improve the extraction of TPC and TFC. This improvement is likely due to rapid internal heating, pressure-induced cell rupture, and improved mass transfer typical of MAE, in combination with optimised process variables (microwave power, time, and liquid–solid ratio).64,65 Similarly, Nguyen et al.,11 focusing on saponin extraction using MAE, reported intermediate TPC values (15.69 mg GAE per g DS) but significantly higher TFC values (115.50 mg CE per g DS) under the same MAD conditions and particle fraction. Therefore, these findings highlight the synergistic effect between MAD and advanced extraction techniques such as MAE, which can improve the efficiency of bioactive compound recovery compared to UAE.66 However, this increased efficiency could also be related to the use of intermediate polarity solvents, such as methanol, which have high microwave energy absorption and good penetration into lignocellulosic matrices, facilitating the solubilisation of phenolic compounds.67 In this regard, Valadez-Carmona et al.44 observed significant differences (p < 0.05) in TPC in finely ground CPH (≤0.425 mm) using various drying methods (hot-air, freeze-drying and MAD), where the latter at 595 W reached the highest value (3000 mg GAE/100 g DS) in only 11.5 min with a ternary solvent system (acetone:water:acetic acid) and stirring, which also resulted in an increase in ARSC and DRSC activities, highlighting the importance of solvent choice in terms of extraction efficiency after MAD. Similarly, Delgado-Ospina et al.5 and Vargas-Arana et al.10 reported significantly higher antioxidant values after freeze-drying (DRSC = 36–133, ARSC = 32.9–140, FRAP = 53–181 µmol TE g−1 DS) and hot-air drying (DRSC = 87.42, ARSC = 155.38, FRAP = 127.44 µmol TE g−1 DS), respectively, especially when polar or acidified solvents were used.
In summary, the results obtained showed that MAD is an efficient tool for preserving and concentrating bioactive compounds and antioxidant activity in CPHF, with the g W−1 ratio possibly being a decisive factor in this behaviour. Likewise, comparison with other studies shows that the recovery efficiency can be enhanced when MAD is combined with advanced extraction techniques, such as MAE, and solvents of intermediate polarity, which would facilitate the release and solubilisation of phenolic compounds. These results also highlight the decisive influence of cocoa variety and particle fraction, as both variables would modulate the cell structure, accessibility of metabolites, and efficiency of the drying and extraction process. In short, MAD not only represents a fast and efficient drying alternative, but also a key stage in optimising integrated processes for the valorisation of agro-industrial by-products, contributing to the sustainable use of CPH and the development of functional ingredients with high added value.
4 Conclusion
This study confirmed that microwave-assisted drying (MAD), controlled by the mass-power ratio expressed in grams per watt (g W−1), is an effective and adjustable strategy for modulating the drying kinetics, techno-functional behaviour, and phytochemical stability of CPHF. The exponential increase in the effective diffusivity and excellent fit of the modified Arrhenius and Page models revealed efficient coupling between microwaves and the matrix and a drying regime dominated by internal diffusion.Physicochemical stability was maintained, while colour changes suggested pigment release and early Maillard reactions modulated by the energy density. From a functional point of view, higher power reduces the water retention capacity and improved solubility, resulting in flours suitable for specific food applications. The mildest condition (0.52 g W−1) preserved phenolic compounds and flavonoids and maximised antioxidant capacity, while excessive intensity caused degradation, confirming that g W−1 is a critical variable that balances efficiency and bioactive retention.
The main experimental challenge was to handle the ultrafine particle fraction (<53 µm) in physicochemical, techno-functional, and phytochemical analysis, as they exhibited high cohesion and electrostatic behaviour. Despite this limitation, the results proved to be robust and were verified in triplicate.
Therefore, MAD is emerging as a sustainable approach to the valorisation of cocoa by-products, supporting eco-friendly processing and circular economy initiatives. These findings suggest that MAD is an environmentally friendly, scalable, and high-performance technique for the valorisation of CPH, supporting circular economy models and the generation of functional ingredients for the food, nutraceutical, and cosmetic industries.
Future research should integrate MAD with extraction-assisted technologies, evaluate the microstructural-dielectric interactions, and assess the technical and economic feasibility of scaling up this eco-friendly drying process.
Author contributions
Esteban Jurado-Beizaga (E. J. B.) conceived and designed the experimentation. E. J. B. performed the experiments and E. J. B. wrote the original manuscript.Conflicts of interest
The authors declare no conflicts.Abbreviations
| CPH | Cocoa pod husk |
| CPHF | Cocoa pod husk flour |
| MAD | Microwave-assisted drying |
| DS | Dried sample |
| FS | Fresh sample |
| M | Moisture content at any given time |
| M0 | Initial moisture content |
| Mt | Moisture content any time |
| Me | Equilibrium moisture content |
| dt | Differential time |
| MR | Moisture ratio |
| RM | Relative moisture |
| DM | Dry matter |
| g W−1 | Grams per watt |
| m P−1 | Charge density |
| Deff | Effective diffusivity |
| L | Average sample thickness |
| ln(MR) | Logarithm natural of moisture ratio |
| D0 | Pre-exponential factor |
| Ea | Activation energy |
| TSS | Total soluble solids |
| WHC | Water holding capacity |
| WSI | Water solubility index |
| OHC | Oil holding capacity |
| SWC | Swelling capacity |
| UAE | Ultrasound-assisted extraction |
| TPC | Total phenol content |
| TFC | Total flavonoid content |
| ARSC | ABTS radical scavenging capacity |
| DRSC | DPPH radical scavenging capacity |
| FRAP | Ferric reducing antioxidant power |
| RMSE | Root mean square error |
| RSS | Root square error |
| AIC | Akaike information criterion |
| ΔAIC | Delta Akaike information criterion |
| SD | Standard deviations |
| R2 | Coefficient of determination |
| χ2 | Chi-square |
Data availability
The data supporting the findings of this study are available in the article and its electronic supplementary information (SI). Additional datasets are available from the authors upon reasonable request. Supplementary information is available. See DOI: https://doi.org/10.1039/d5fb00565e.Acknowledgements
The authors acknowledge the support of the Agro-industrial Technologies and Processes Research Group (ITEPA), the Pontifical Catholic University of Peru (PUCP), and the National University of San Marcos (UNMSM). This research was funded by the National Program for Scientific Research and Advanced Studies (PROCIENCIA) of the National Council of Science, Technology and Technological Innovation (CONCYTEC) through the project with agreement PE501086489-2024-PROCIENCIA, entitled: Development of functional micro and nano additives for the food and cosmetics industry from cocoa (Theobroma cacao L.) waste, applying the circular economy approach.References
- Statistics - International Cocoa Organization, https://www.icco.org/statistics/, (accessed 29 June 2025).
- L. F. Zambrano-Mite, Y. Villasana, M. L. Bejarano, C. Luciani, D. Niebieskikwiat, W. Álvarez, D. F. Cueva, D. Aguilera-Pesantes and L. M. Orejuela-Escobar, Heliyon, 2023, 9, e17258 CrossRef CAS PubMed.
- S. B. Anoraga, R. Shamsudin, M. H. Hamzah, S. Sharif and A. D. Saputro, Heliyon, 2024, 10, e35537 CrossRef CAS PubMed.
- L. Porto de Souza Vandenberghe, K. Kley Valladares-Diestra, G. Amaro Bittencourt, A. Fátima Murawski de Mello, Z. Sarmiento Vásquez, P. Zwiercheczewski de Oliveira, G. Vinícius de Melo Pereira and C. Ricardo Soccol, Bioresour. Technol., 2022, 344, 126252 CrossRef CAS PubMed.
- J. Delgado-Ospina, R. Lucas-González, M. Viuda-Martos, J. Fernández-López, J. Á. Pérez-Álvarez, M. Martuscelli and C. Chaves-López, Heliyon, 2021, 7, e06799 CrossRef CAS PubMed.
- F. Lu, J. Rodriguez-Garcia, I. Van Damme, N. J. Westwood, L. Shaw, J. S. Robinson, G. Warren, A. Chatzifragkou, S. McQueen Mason, L. Gomez, L. Faas, K. Balcombe, C. Srinivasan, F. Picchioni, P. Hadley and D. Charalampopoulos, Curr. Opin. Green Sustainable Chem., 2018, 14, 80–88 CrossRef.
- N. Muñoz-Almagro, L. Valadez-Carmona, J. A. Mendiola, E. Ibáñez and M. Villamiel, Carbohydr. Polym., 2019, 217, 69–78 Search PubMed.
- L. C. Vriesmann and C. L. de Oliveira Petkowicz, Int. J. Biol. Macromol., 2017, 101, 146–152 CrossRef CAS PubMed.
- K. M. Kibler, D. Reinhart, C. Hawkins, A. M. Motlagh and J. Wright, Waste Manage., 2018, 74, 52–62 CrossRef.
- G. Vargas-Arana, C. Merino-Zegarra, M. Tang, M. W. Pertino and M. J. Simirgiotis, Antioxidants, 2022, 11, 595 CrossRef CAS.
- V. T. Nguyen, M. D. Le, T. T. T. Nguyen, T. T. Khong, V. H. Nguyen, H. N. Nguyen, B. N. D. Huynh, H. T. M. Tran and T. S. Trang, J. Food Process. Preserv., 2021, 45, e15134 CAS.
- V. T. Nguyen, A. X. Tran and V. A. T. Le, Powder Technol., 2021, 386, 136–143 CrossRef CAS.
- L. Valadez-Carmona, A. Ortiz-Moreno, G. Ceballos-Reyes, J. A. Mendiola and E. Ibáñez, J. Supercrit. Fluids, 2018, 131, 99–105 CrossRef CAS.
- R. Campos-Vega, K. H. Nieto-Figueroa and B. D. Oomah, Trends Food Sci. Technol., 2018, 81, 172–184 CrossRef CAS.
- G. I. Edo, P. O. Samuel, G. O. Oloni, G. O. Ezekiel, F. O. Onoharigho, O. Oghenegueke, S. C. Nwachukwu, O. A. Rapheal, M. O. Ajokpaoghene, M. C. Okolie, R. S. Ajakaye, W. Ndudi and P. C. Igbodo, Nat. Resour. Hum. Health, 2023, 3, 426–448 CrossRef CAS PubMed.
- B. M. Yapo, V. Besson, B. B. Koubala and K. L. Koffi, Am. J. Food Nutr., 2013, 1, 38–46 CAS.
- J. Korhonen, A. Honkasalo and J. Seppälä, Ecol. Econ., 2018, 143, 37–46 CrossRef.
- Z. S. Vásquez, D. P. de Carvalho Neto, G. V. M. Pereira, L. P. S. Vandenberghe, P. Z. de Oliveira, P. B. Tiburcio, H. L. G. Rogez, A. Góes Neto and C. R. Soccol, Waste Manage., 2019, 90, 72–83 CrossRef PubMed.
- M. Zhang, J. Tang, A. S. Mujumdar and S. Wang, Trends Food Sci. Technol., 2006, 17, 524–534 CrossRef CAS.
- C. Gabriel, S. Gabriel, E. H. Grant, B. S. J. Halstead and D. Michael P Mingos, Chem. Soc. Rev., 1998, 27, 213–224 RSC.
- S. Wang, J. Tang, J. A. Johnson, E. Mitcham, J. D. Hansen, G. Hallman, S. R. Drake and Y. Wang, Biosyst. Eng., 2003, 85, 201–212 CrossRef.
- V. Meda, V. Orsat and V. Raghavan, The Microwave Processing of Foods: 2nd edn, 2017, 23–43 Search PubMed.
- M. Viveknanda, M. Yogesh and H. S, Pharmacogn. Rev., 2007, 1(1), 7–18 Search PubMed.
- W. Routray, V. Orsat and Y. Gariepy, Drying Technol., 2014, 32, 1888–1904 CrossRef CAS.
- J. Crank, The Mathematics of Diffusion, Clarendon Press, Oxford, 2nd edn, 1975 Search PubMed.
- G. Dadali, D. K. Apar and B. Özbek, Drying Technol., 2007, 25, 917–924 CrossRef.
- G. Dadali, D. K. Apar and B. Özbek, Drying Technol., 2007, 25, 1445–1450 CrossRef.
- B. Özbek and G. Dadali, J. Food Process Eng., 2007, 83, 541–549 CrossRef.
- H. Darvihsi, A. Banakar and M. Zarein, Global Journal of Science Frontier Research Mathematics and Decision Sciences, 2012, 12(7), 57–64 Search PubMed.
- N. Sianoun, P. Pongyeela, N. Chairerk and J. Chungsiriporn, Eng. J., 2023, 27(8), 1–12 CrossRef CAS.
- G. E. Page, Factors influencing the maximum rates of air drying shelled corn in thin layers, PhD thesis, Purdue University, 1969.
- W. K. Lewis, Ind. Eng. Chem., 1921, 13, 427–432 CrossRef CAS.
- S. L. Rodríguez-Ambriz, J. J. Islas-Hernández, E. Agama-Acevedo, J. Tovar and L. A. Bello-Pérez, Food Chem., 2008, 107, 1515–1521 CrossRef.
- E. J. G. Laureanti, T. S. Paiva, L. M. de Matos Jorge and R. M. M. Jorge, Int. J. Biol. Macromol., 2023, 253, 126969 CrossRef CAS PubMed.
- K. S. Ojha, R. Aznar, C. O'Donnell and B. K. Tiwari, TrAC, Trends Anal. Chem., 2020, 122, 115663 CrossRef CAS.
- V. L. Singleton, R. Orthofer and R. M. Lamuela-Raventós, Methods Enzymol., 1999, 299, 152–178 CAS.
- R. Re, N. Pellegrini, A. Proteggente, A. Pannala, M. Yang and C. Rice-Evans, Free Radicals Biol. Med., 1999, 26, 1231–1237 CrossRef CAS PubMed.
- W. Brand-Williams, M. E. Cuvelier and C. Berset, LWT–Food Sci. Technol., 1995, 28, 25–30 Search PubMed.
- I. F. F. Benzie and J. J. Strain, Anal. Biochem., 1996, 239, 70–76 CrossRef CAS PubMed.
- F. Wang, N. Tian, C. Li, K. Zhang, H. Zhang and Y. Zhang, ACS Omega, 2024, 9(29), 31986–31997 Search PubMed.
- E. G. Silva, R. S. Gomez, J. P. Gomes, W. P. Silva, K. Y. N. Porto, F. D. Rolim, J. E. F. Carmo, R. O. Andrade, I. B. Santos, R. A. A. Sousa, D. D. S. Diniz, M. M. C. A. Aragão and A. G. B. Lima, Agriculture, 2021, 11, 8 CrossRef.
- J. Dhara, S. Kumar Saha, M. Saha and R. Chakraborty, Sustainable Food Technol., 2023, 1, 590 RSC.
- V. T. Nguyen, T. G. Tran and N. Le Tran, Drying Technol., 2022, 40, 2021–2033 CrossRef CAS.
- L. Valadez-Carmona, C. P. Plazola-Jacinto, M. Hernández-Ortega, M. D. Hernández-Navarro, F. Villarreal, H. Necoechea-Mondragón, A. Ortiz-Moreno and G. Ceballos-Reyes, Innovative Food Sci. Emerging Technol., 2017, 41, 378–386 CrossRef CAS.
- K. H. Nieto-Figueroa, N. V. Mendoza-García, M. Gaytán-Martínez, A. Wall-Medrano, M. Guadalupe Flavia Loarca-Piña and R. Campos-Vega, Food Res. Int., 2020, 137, 109725 CrossRef CAS PubMed.
- H. Xu, K. Wang, S. Hong, Y. Huo, C. Wen, Y. Man, J. Tong, T. Wang, S. Wang and H. Xu, Energies, 2022, 16, 441 CrossRef.
- Q. Hu, Y. He, F. Wang, J. Wu, Z. Ci, L. Chen, R. Xu, M. Yang, J. Lin, L. Han and D. Zhang, China's Med., 2021, 16, 87 CrossRef CAS PubMed.
- B. M. A. Amer, M. M. Azam and A. G. Saad, Processes, 2023, 11, 1771 CrossRef.
- S. Sobowale, O. A. Adebo, O. P. Olatidoye and A. Floribert Mulaba-Bafubiandi, in Proceedings of the 5hReFoSTS of NIFST Western Chapter, 2019 Search PubMed.
- O. Y. Turan and F. E. Firatligil, Czech J. Food Sci., 2019, 37, 128–134 CrossRef CAS.
- Y. Villamizar Jaimes, J. León Castillo and J. Rodríguez Guerrero, Cuad Act, 2016, 9, 65–75 Search PubMed.
- S. Murillo-Baca, F. Ponce-Rosas and M. Huamán-Murillo, Manglar, 2020, 17, 67–73 CrossRef.
- J. Song, X. Wang, D. Li and C. Liu, Int. J. Food Prop., 2017, 20, S632–S643 CrossRef CAS.
- C. Mei, W. Yong-Zhou, L. Guang and W. Xiao-Ping, J. Appl. Polym. Sci., 2012, 126, 1808–1813 CrossRef.
- L. Pezo, X. Huang, Z. Zhang, Y. Li, Y. Yang, A. Mulati, D. Shataer and J. Wang, Foods, 2025, 14, 3435 CrossRef PubMed.
- S. Tsubaki, M. Nakauchi, Y. Ozaki and J. I. Azuma, Food Sci. Technol. Res., 2009, 15, 307–314 CrossRef CAS.
- S. Mao, Y. Zhou, B. Song, Y. Wu, Y. Wang, Y. Wang, Y. Liu, X. Xu, C. Zhao and J. Liu, Foods, 2024, 13, 207 CrossRef CAS PubMed.
- M. Guruprasad, J. Gada Chengaiyan, F. Ahmad, S. Haque, E. Capanoglu and D. Rajoriya, ACS Omega, 2024, 9, 15143–15150 CrossRef CAS PubMed.
- A. Mauricio, H. Posso, J. Carlos, M. Silva, J. Pablo, C. Niño, J. Herminsul, M. Hernandez, L. Del Pilar and F. Cabrera De Lima, Polymers, 2024, 16, 1608 CrossRef PubMed.
- B. P. Adhikari and B. R. Bhandari, Food Properties Handbook, CRC Press, 2nd edn, 2009 Search PubMed.
- R. E. Quiroz-Castañeda and J. L. Folch-Mallol, Biotecnol. Apl., 2011, 28, 205–215 Search PubMed.
- R. Martínez, P. Torres, M. A. Meneses, J. G. Figueroa, J. A. Pérez-Álvarez and M. Viuda-Martos, Food Res. Int., 2012, 49, 39–45 CrossRef.
- M. Elleuch, D. Bedigian, O. Roiseux, S. Besbes, C. Blecker and H. Attia, Food Chem., 2011, 124, 411–421 CrossRef CAS.
- G. V Barbosa-Cánovas, A. Board, X. D. Chen and R. W. Hartel, J. Food Eng., 2013, 4, 24–29 Search PubMed.
- F. H. Mashuni, M. Hamid, L. O. Kadidae, M. Jahiding, L. O. Ahmad and D. Saputra, AIP Conf. Proc., 2020, 2243, 030013 CrossRef.
- A. G. Pereira, L. Cruz, L. Cassani, F. Chamorro, C. Lourenço-Lopes, V. Freitas, P. Otero, M. Fraga-Corral, M. A. Prieto, J. Simal-Gandara and R. Perez-Gregorio, Eng. Proc., 2023, 37, 124 Search PubMed.
- A. Kumar, R. Gehlot, A. Saini and R. Phogat, J. Food Sci., 2024, 89, 9317–9335 CrossRef CAS PubMed.
| This journal is © The Royal Society of Chemistry 2026 |