
 Open Access Article
 This Open Access Article is licensed under a Creative Commons Attribution-Non Commercial 3.0 Unported Licence
Comparing the energy and climate impacts of conventional lithium-ion and all-solid-state batteries
Zhu Zhua and
Rebecca E. Ciez *ab
*ab
aSchool of Sustainability Engineering and Environmental Engineering, Purdue University, West Lafayette, Indiana 47907, USA. E-mail: rciez@purdue.edu
bSchool of Mechanical Engineering, Purdue University, West Lafayette, Indiana 47907, USA
First published on 16th March 2026
Abstract
All-solid-state batteries (ASSBs) are emerging as next-generation, high energy density and safer alternatives to lithium-ion batteries (LIBs), yet their environmental impacts, especially during recycling, remain underexplored. Conventional LIBs dominate today's EV market, but their production is energy- and resource-intensive. This study develops a prospective recycling process for ASSBs with NMC811 cathodes, lithium-metal anodes, and Li3PS4 electrolyte, and compares their life cycle energy and climate impacts with those of NMC811/graphite LIBs. The use phase dominates impacts for both battery chemistries. Using a Monte Carlo analysis to consider uncertain impacts, we find that on a per-cell basis, ASSBs exhibit higher environmental burdens during recycling than LIBs. When normalized with lifetime energy delivered, energy consumption depends strongly on lifespan: ASSBs show significantly higher energy use if their lifetime is half that of LIBs, whereas comparable or extended lifetimes yield no significant reduction in energy use. Grid carbon intensity and vehicle fuel economy play a substantial role in overall environmental impact, as they directly influence the energy use and greenhouse gas emissions associated with battery use. ASSBs can be a more sustainable option if used for lightweighting or aerodynamic vehicle designs, but do not offer significant environmental benefits over conventional LIBs at the battery cell level. From a policy perspective, realizing the sustainability potential of ASSBs depends less on chemistry alone and more on system-level efficiency improvements, supportive integration frameworks, and realistic performance lifetimes.
Broader contextElectric vehicles are critical to global decarbonization strategies, but the batteries that power them are still energy and resource intensive to produce and recycle. Although all-solid-state batteries (ASSBs) are widely promoted as safer, higher-energy-density alternatives to current lithium-ion batteries (LIBs), their life cycle environmental impacts, especially given the early stage of recycling technologies, remain underexplored. This work evaluates the life cycle energy use and greenhouse gas emissions of ASSBs relative to conventional LIBs using a prospective recycling design and uncertainty analysis. We find that the environmental performance of ASSBs depends strongly on their operational lifetime and on how they are deployed. Simply replacing LIBs with ASSBs does not guarantee climate benefits, and using their higher energy density only to extend driving range offers limited environmental advantages. However, when paired with strategies that improve vehicle efficiency, such as lightweighting and aerodynamic design, ASSBs can support lower life cycle emissions. These insights are relevant to policymakers, industries, and researchers developing next-generation batteries, highlighting the need to align battery innovation, recycling capability, and vehicle efficiency standards to deliver meaningful climate benefits. |
1. Introduction
Electric vehicles (EVs) can improve public health and help mitigate climate change by reducing urban air pollution and greenhouse gas (GHG) emissions.1 Reflecting this potential, global EV sales have grown rapidly over the past decade, reaching over 17 million vehicles in 2024 and accounting for 20% of all new car sales that year.2Among various battery technologies used in electric vehicles, lithium-ion batteries (LIBs) currently dominate EV applications due to their reliability, lifespan, energy, and power density.3 However, their production processes are highly energy- and resource-intensive, contributing substantially to overall life cycle environmental impacts. Recycling can recover a fraction of the materials, yet the recycling processes themselves also demand considerable energy and resources.4,5 All-solid-state batteries (ASSBs) have recently emerged as a promising next-generation technology. In contrast to conventional LIBs, ASSBs use solid rather than liquid electrolytes, which enables the use of lithium metal anodes, resulting in higher energy density, improved safety, and greater stability.6,7 At the vehicle level, this could translate to battery packs with the same volumetric footprint, but increased energy storage capacity, increasing the vehicle range. However, these technological advances raise an important question: can ASSBs deliver better environmental outcomes than conventional LIBs? To address this question, life cycle assessment (LCA) provides a widely applied framework to evaluate environmental impacts, identify critical hotspots, and guide sustainable battery development.8
Previous LCA studies have extensively examined the environmental impacts from the production and recycling of conventional LIBs.5,9–17 However, LCAs of ASSBs remain underexplored.18 A few studies have assessed the material requirements and environmental impacts of producing ASSBs with lithium-metal anodes and various cathode chemistries (e.g., layered oxides, lithium iron phosphate), combined with sulfide-based19–21 or oxide-based19,22–26 solid electrolytes. The system boundaries of these studies generally extend from cradle (raw material extraction) to the factory gate (manufactured battery cells), without considering the use phase or end-of-life recycling. One reason for this omission is that ASSB recycling has not yet been established and remains at an early research stage.21,27
Compared to LIBs, ASSBs present unique recycling challenges: lithium-metal anodes are highly reactive, and the adhesive nature of lithium foil prevents practical mechanical separation; composite cathodes are tightly integrated with solid electrolytes and protective coatings, complicating selective recovery; and solid electrolytes themselves pose difficulties, as polymers exhibit low conductivity, oxides require energy-intensive sintering and rely on scarce elements, and sulfides are highly moisture-sensitive and can release toxic gases.28 Some studies propose potential recycling strategies by assuming that the lithium anode is fully depleted at the end of battery life, thereby avoiding the challenges of reactive lithium metal and simplifying subsequent separation and recovery.29,30 However, the assumption is idealized and may not reflect practical scenarios. If any residual lithium remains, it can cause severe safety issues. Another study suggests reacting residual lithium metal with CO2 to form stable lithium carbonate.31 Yet, partial conversion generates a Li2CO3 passivation layer that slows further reaction, leaving residual Li with ignition risks and obstructing subsequent processing.32,33
Given the absence of established recycling methods and the corresponding LCAs for ASSBs, this study proposes a potential process design that integrates safety measures, material separation, and recovery pathways. Building on this design, this study performs cradle-to-cradle LCAs with Monte Carlo simulations to evaluate and compare the energy and climate impacts of ASSBs and LIBs across raw material extraction, manufacturing, use, and recycling. This study also examines multiple retirement scenarios defined by battery state-of-health (SOH) thresholds and lifespan variations to assess the effect of lifetime assumptions on environmental performance. From the LCA results, this study identifies key environmental hotspots and proposes targeted sustainability interventions to mitigate these burdens.
This study thus provides one of the first systematic assessments of prospective recycling pathways for ASSB cells, offering insights into their life cycle environmental implications. The results can inform policymakers and industry stakeholders about the comparative environmental performance of next-generation ASSBs relative to conventional LIBs. This study also underscores the importance of integrating recyclability considerations into early-stage ASSB design and evaluating the feasibility of emerging recycling technologies.
2. Materials and methods
This study conducts a comparative LCA of conventional LIB and ASSB cells, following the four-step framework outlined in ISO 14040 and 14044. Monte Carlo simulation is employed to capture uncertainties in the variables, while scenario analysis is used to examine the effects of retirement timing and battery lifespan. The variables used in the Monte Carlo analysis come from established impact factors, such as the energy and emission intensities reported in GREET, BatPaC, and published LCAs, and from material and energy consumption data describing the bill of materials, process energy use, and recycling requirements reported in production datasets and experimental studies.2.1. Scope
This study assumes nickel manganese cobalt oxide (NMC-811; 80% Ni, 10% Mn, 10% Co) as the cathode for both battery cells. The anode is modeled as graphite in LIBs and lithium metal in ASSBs, while the electrolytes are LiPF6 in LIBs and Li3PS4 in ASSBs. These assumptions reflect configurations widely adopted in commercial practice and in prior studies.5,20 To ensure a consistent cell sizing basis, this study assumes a nominal 100 kWh battery system consisting of 400 cells, corresponding to a nominal cell energy of 250 Wh per cell. The analysis, however, focuses exclusively on individual cells, and pack-level components are excluded from the system boundary.The system boundary of this LCA study is shown in Fig. 1. It begins with the raw material production phase of the battery cell components, including the extraction and processing of electrode materials, electrolytes, separators, and other auxiliary materials. It then covers the cell manufacturing stage, where active and supporting materials are assembled into complete cells. The use phase accounts for electricity consumption over the operational lifetime of the cells. Finally, the end-of-life stage is modeled as a recycling process in which recovered materials are reintegrated into the production of new batteries. Transportation-related impacts are excluded from the system boundary because their contributions are negligible relative to other processes.5 This cradle-to-cradle framework enables a consistent and comprehensive comparison of LIB and ASSB cells across all life cycle stages.
 | ||
| Fig. 1 Cradle-to-cradle system boundary for this battery LCA. | ||
The environmental impact indicators assessed are greenhouse gas emissions (GWP100, reported as kg CO2e) and energy consumption (kWh). This study uses four functional units: impacts per cell, per lifetime kilowatt hour delivered, per lifetime mile driven, and per kWh battery capacity. The product-based functional unit (per cell) provides an absolute measure of material and energy flows across the battery life cycle, enabling direct technological comparison. The service-based functional unit (per lifetime kWh delivered) normalizes impacts by total energy throughput, thereby accounting for differences in battery lifetime and avoiding comparisons between systems delivering unequal service. Impacts per lifetime mile driven further translate results into a mobility-service perspective relevant to end users and policy analysis. Finally, normalization per kWh battery capacity facilitates comparison with existing battery LCA studies, where this metric is commonly reported.
2.2. Life cycle inventory
Separately, our study explores the influence of the upper-cutoff voltage (UCV) for both LIBs and ASSBs. Increasing the UCV can enhance specific capacity and reduce the cost and mass of cells and packs,39 but it also accelerates structural degradation of the cathode active material and decomposition of electrolytes.35,40 In the BatPaC model, UCV directly influences electrode sizing and specific energy calculations, thereby affecting the resulting material quantities in the BoM. To capture this energy–degradation trade-off, a triangular distribution is applied to the UCV parameter, with the lower UCV serving as both the baseline and minimum case due to its higher stability. For each UCV scenario, the corresponding cell design and BoM are internally recalculated using BatPaC.
Table 1 summarizes the parameter modifications used to approximate ASSB configurations within BatPaC. Key cell-level parameters, including mass, volume, nominal capacity, nominal energy, and voltage limits, are provided in Table S2. The corresponding components and BoMs for LIBs and ASSBs are listed in Tables S3 and S4, while the embodied energy consumption and emission factors of materials are reported in Tables S5–S7.
| Parameters | LIB | ASSB |
|---|---|---|
| Upper cutoff voltage (V) | 4.25 to 4.8 | 4.37 to 4.87 |
| Average voltage (V) | 3.71 to 3.75 | 3.83 to 3.86 |
| Active cathode material specific capacity (mAh g−1) | 214 to 235 | 216 to 235 |
| Active anode material specific capacity (mAh g−1) | 360 | 3600 |
| N/P ratio | 1.1 | 1 |
| Negative porosity | 0.25 | 0 |
| Separator porosity | 0.5 | 0 |
| Electrolyte density (g cm−3) | 1.2 | 1.5 |
| Separator density (g cm−3) | 0.47 | 1.5 |
| Separator thickness (μm) | 15 | 25 |
| Base area-specific impedance at 50% (Ω cm2) | 14.6 to 15.2 | 50 |
![[thin space (1/6-em)]](https://www.rsc.org/images/entities/char_2009.gif) 34 provides detailed processes and the energy consumption for manufacturing an LIB cell. First, positive and negative electrode materials are prepared and mixed, followed by electrode coating and calendaring to achieve the desired density and porosity. The electrodes are then notched to the required dimensions and subjected to vacuum drying to remove residual solvents and moisture. After drying, the electrodes are slit, stacked, and connected through current collector welding. The assembled cells undergo X-ray inspection to ensure structural integrity before being inserted into their containers. Electrolyte filling and cell sealing are performed in a controlled dry room environment to minimize contamination by moisture. Finally, formation cycling is carried out to stabilize electrochemical performance and establish a solid electrolyte interphase (SEI) on the electrodes. This sequence of processes ensures that LIB cells meet the necessary requirements for energy density, safety, and long-term cycling stability. The electricity consumption of each step is shown in Table S8, based on data from a factory producing 500000 batteries with the same configuration as those in this study.34,41
34 provides detailed processes and the energy consumption for manufacturing an LIB cell. First, positive and negative electrode materials are prepared and mixed, followed by electrode coating and calendaring to achieve the desired density and porosity. The electrodes are then notched to the required dimensions and subjected to vacuum drying to remove residual solvents and moisture. After drying, the electrodes are slit, stacked, and connected through current collector welding. The assembled cells undergo X-ray inspection to ensure structural integrity before being inserted into their containers. Electrolyte filling and cell sealing are performed in a controlled dry room environment to minimize contamination by moisture. Finally, formation cycling is carried out to stabilize electrochemical performance and establish a solid electrolyte interphase (SEI) on the electrodes. This sequence of processes ensures that LIB cells meet the necessary requirements for energy density, safety, and long-term cycling stability. The electricity consumption of each step is shown in Table S8, based on data from a factory producing 500000 batteries with the same configuration as those in this study.34,41The manufacturing process for ASSB cells is derived from a previous study21 and shares several similarities with the steps used in LIB cell production. Lithium foil for the anode is prepared through thermal evaporation,42 while the cathode and the sulfide solid electrolyte are mixed and coated onto current collectors, followed by calendaring to optimize density and interfacial contact. The coated layers are slit and notched, after which the electrodes and electrolyte are stacked into multilayer assemblies, pressed to improve ionic conductivity, and welded and sealed following insertion into containers. Quality assurance is performed by X-ray inspection, and because the solid electrolyte is already integrated, no liquid filling is required. All steps are carried out under dry-room conditions to prevent moisture contamination, and formation cycling is performed as the final quality control step prior to ageing. Table S9 specifies the electricity consumption calculation in each step.

where Echarge, total and Edischarge, total are the total charging and discharging energies (kWh), V is the average voltage (3.74 V), IC is the initial capacity (66.92 Ah), SOHi is the state of health at cycle i, and EEi is the energy efficiency (%) at cycle i. The energy efficiency is further calculated using the empirical relationship:45

| EE = 95.82 − 0.2303 × (1 − SOH). |
The SOH–cycle number relationship at room temperature for LIBs is derived from a previous experimental study,46 using NMC/graphite electrodes, the same configuration adopted in this study. Data on the aging behavior of ASSBs are much less common, with most studies focusing on shorter-term cycling or using rapid aging approaches under high-temperature conditions (100 °C),47 so we cannot directly model an SOH–cycle number relationship for long-term cycling of ASSBs from ASSB empirical data. Our study therefore applies an alternative approach: the aging curve of ASSBs at room temperature is assumed to follow the shape of the curve measured at 100 °C, while the lifespan (defined as the cycle number to reach 80% SOH) is taken to be half, equal to, or twice that of LIBs. We consider three lifespan scenarios because, although the objective of ASSBs is to achieve stable, long-term cyclability, today their lifespan may be shorter due to lithium metal anodes being susceptible to solid-phase dendrite growth and interfacial instability, which can limit battery performance.48 In addition, four retirement scenarios are considered for each battery type, with retirement occurring at SOH thresholds between 80% and 65%. Such thresholds are widely applied in practice: 80% SOH is typically used as the end-of-life criterion for EV applications,49 while lower thresholds may be acceptable in certain cases. By combining the three lifespan assumptions with the four retirement thresholds, a total of 12 scenarios are modeled to systematically explore how aging and replacement strategies affect unit environmental impacts.
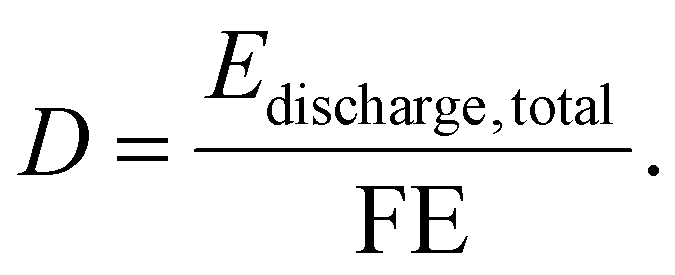
The lifetime miles driven (D) are calculated from the fuel economy (FE, kWh per mile) and the total discharging energy (kWh) using the following equation:
The fuel economy of EVs is derived from FuelEconomy.gov,50 which provides representative efficiency data for 2026 model-year all-electric vehicles. The detailed fuel economy data are shown in Table S1. In this study, the lower quartile of fuel economy (0.34 kWh per mile) is defined as the low energy consumption scenario, the median value (0.39 kWh per mile) represents the median scenario, and the upper quartile (0.43 kWh per mile) characterizes the high energy consumption scenario.
For ASSBs, where recycling supply chains do not yet exist, we use a literature-informed model based on previously reported selective extraction and precipitation reactions. The spent battery is first discharged, after which we propose a component separation method based on successive solvent extractions and precipitation reactions. Metallic lithium is first dissolved in a solution of naphthalene (Naph) and 1,2-dimethoxyethane (DME), after which the mixture is filtered to isolate the Li–naphthalene solution53–55 from the residual black mass. Notably, prior studies report that the Naph–DME solution selectively dissolves the lithium anode while leaving the Li3PS4 solid electrolyte mostly intact, without inducing degradation.56,57 Excess FeCl358 is then introduced into the Li–Naph solution, followed by thorough stirring and the addition of water, which produces a reduced Fe precipitate that is removed by filtration. The resulting filtrate is subsequently treated with NaOH to form a solid Fe-species by-product, which is collected by filtration. Addition of Na2CO3 to the remaining solution yields a Li2CO3 precipitate that is washed with water and retained. Finally, the solvent mixture is subjected to vacuum distillation, enabling recovery of DME (85 °C) and naphthalene (220 °C).
The residual black mass, separated from the Li–Naph solution, is rinsed with DME and dried at 90 °C to remove organic solvent residues. The dried material is then treated with N-methylformamide (NMF) to selectively dissolve Li3PS4,57 followed by filtration. The filtrate is subjected to controlled solvent evaporation to induce recrystallization of Li3PS4, which is subsequently collected and dried. The remaining solid fraction (mainly cathode paste, Al, and Cu) is rinsed with ethanol and dried again at 90 °C. The remaining solid is recycled using the same hydrometallurgical method as for LIBs. Fig. 2 illustrates the proposed recycling flow for all-solid-state batteries (ASSBs). Gray boxes represent spent cells (feedstocks), yellow boxes indicate auxiliary materials or additives, blue boxes denote intermediates formed during the process, and green boxes show the recovered products. The detailed process, along with material and energy inputs and the corresponding environmental impact factors, is provided in Text S2 and Table S11.
 | ||
| Fig. 2 Proposed recycling process flowchart for ASSBs. | ||
3. Results and discussion
3.1. Energy and GHG emissions per battery cell
Fig. 3 compares the life-cycle energy consumption and GHG emissions of LIBs and ASSBs per cell retiring at 80% SOH. Each bar is decomposed into three components: use phase (orange), other phases (teal; including raw-material extraction, manufacturing, and end-of-life recycling), and recovered materials (green; shown as credits). The dots and error bars indicate the median and 95% confidence interval of the total net environmental impacts, after accounting for the recovered-material credits. The ASSB is assumed to have a comparable lifetime to that of a conventional LIB. | ||
| Fig. 3 Life-cycle energy consumption (a) and GHG emissions (b) per battery cell for conventional LIBs and ASSBs retiring at 80% SOH. | ||
The median net energy consumption per cell is 291 kWh for the LIB and 229 kWh for the ASSB. For both batteries, the use phase dominates the life-cycle energy demand, accounting for more than 80% of the total. The higher use-phase burden of the LIB arises from its slower degradation rate, which means that LIBs deliver more lifetime stored energy, which leads to greater energy consumption during the use phase compared with ASSBs. When the use phase is excluded, the remaining life-cycle energy consumption is slightly lower for the LIB (40 kWh) than for the ASSB (45 kWh).
Similarly, for GHG emissions, the median net values are 111 kg CO2e per cell for the LIB and 84 kg CO2e for the ASSB. In both cases, the use phase constitutes the dominant contributor. The range of the 95% confidence interval for net GHG emissions is larger than that for net energy consumption, which can be attributed to the substantial variation in regional grid carbon intensity in the US.
Fig. 4 shows a breakdown of life-cycle energy consumption per battery cell by phase and component. The error bars represent the 95% confidence intervals derived from Monte Carlo simulations. The results shown exclude the use phase to better highlight differences in upstream and end-of-life processes. In each group, the left bar corresponds to the LIB and the right hatched bar corresponds to the ASSB. For visual clarity, the recovered-material contributions, which are negative values in the life-cycle inventory, are plotted above the x-axis.
 | ||
| Fig. 4 Breakdown of life-cycle energy consumption per cell by phase and battery component for LIBs and ASSBs. | ||
Excluding the use phase, raw-material extraction represents the largest contributor to life-cycle energy consumption for both LIB and ASSB cells, with total values of approximately 39 kWh and 36 kWh, respectively. The similar magnitude of energy demand in this phase arises because the major mass-contributing components, including the cathode, terminal, and container materials, are composed of comparable substances in both batteries. ASSBs show reduced impacts because the transition to lithium metal offsets the need for a graphitic carbon anode material, which is a larger saving than the additional energy required to produce the solid-state electrolyte. The manufacturing stage shows a similar level of energy demand for the two chemistries, around 7 to 9 kWh per cell, indicating that the additional process steps for solid-electrolyte integration in ASSBs do not substantially increase total manufacturing energy.
In contrast, the EoL recycling stage shows a more pronounced difference between the two systems. The ASSB requires about 19 kWh per cell, nearly three times that of the LIB (7 kWh per cell). This higher recycling energy demand results from the greater number of materials involved and the more complex process steps, which make the overall recovery procedure both material- and energy-intensive. In particular, the separation of the anode and solid electrolyte requires additional solvent treatment, crystallization, distillation, drying, and filtration steps, all of which significantly increase electricity and thermal energy use. Nevertheless, the ASSB also yields a larger quantity of recovered products, especially from the electrolyte and anode, which are largely discarded as waste in the LIB system. As a result, the higher recycling energy demand of the ASSB is partially compensated by its greater recovered-material credit (−19 kWh vs. −13 kWh).
In the raw material extraction, EoL recycling, and recovered-material phases, cathode materials, mainly NMC811, dominate the energy profile of both batteries, accounting for the majority of total energy consumption. The high energy contribution of NMC811 arises from four main factors. First, its composition features high nickel and lithium contents, and the mining, refining, and precursor production of these metals are highly energy intensive.59,60 Second, NMC811 is synthesized through a co-precipitation process followed by high-temperature calcination,61 which further increases electricity and thermal energy demand. Third, the cathode is the heaviest component in the cell, so even moderate specific energy requirements translate into a large total contribution. Finally, during recycling, the acid leaching, separation, and recrystallization steps involved in hydrometallurgical processes are themselves energy intensive,51 further amplifying the life-cycle energy burden associated with NMC811.
In manufacturing, the formation cycling process is the primary driver of energy use. This step involves multiple low-current charge–discharge cycles to stabilize the electrode–electrolyte interface and form a robust solid-electrolyte interphase,62,63 resulting in significant electricity consumption. While this process is essential for ensuring cell performance and quality, it represents one of the most energy-intensive operations in the battery manufacturing chain.
3.2. Energy consumption and GHG emissions per kWh delivered and per lifetime mile traveled
Fig. 5 compares the unit lifetime energy consumption per kWh of electricity delivered across four LIB retirement scenarios (80%, 75%, 70%, and 65% SOH) and three ASSB lifetime assumptions (0.5×, 1×, and 2× relative to the LIB baseline). The LIB case retiring at 80% SOH serves as the baseline, and all other results are expressed as differences relative to it. Positive values indicate higher unit lifetime energy consumption per kWh delivered compared with LIB 80%. The error bars represent the 95% confidence intervals of these differences, obtained from Monte Carlo simulations. | ||
| Fig. 5 Unit lifetime energy consumption per kWh delivered for LIBs and ASSBs, relative to the energy consumption of an LIB retired at 80% SOH. | ||
Within each battery type, variations in unit energy consumption across different retirement SOH levels are minor, indicating that the retirement threshold has a limited effect compared with lifetime differences. When comparing across technologies, ASSBs with a short (0.5×) lifetime exhibit the highest unit energy consumption on average, followed by ASSBs with a nominal (1×) lifetime, LIBs, and ASSBs with an extended (2×) lifetime.
For ASSBs with a short (0.5×) lifetime, their unit energy consumption per kWh delivered is significantly higher than that of the baseline across nearly all retirement thresholds, except when retired at 65% SOH. The 95% confidence interval at 65% SOH is predominantly positive and only marginally overlaps zero, suggesting that unit energy consumption is likely higher than the baseline, with limited evidence supporting a reversed outcome. In all other cases, including ASSBs with 1× and 2× lifetimes of LIBs and conventional LIBs retiring at different SOH levels, no statistically significant differences from the energy used by baseline, conventional LIBs retired at 80% SOH are observed.
We also considered what conditions may induce changes in lifetime energy consumption trends for ASSBs. If we assume an optimistic end-of-life recycling scenario for ASSBs, where we assume that the recycling process and all associated material inputs to the recycling process have no climate or energy impacts, with no impact on the amount of material recovered, the 0.5× lifetime case, which was originally significantly worse than the baseline LIB under realistic recycling burdens, no longer exhibits statistically higher unit lifetime energy consumption. Under the same optimistic recycling assumption, extending the ASSB lifetime to 2× or even 5× the baseline does not lead to statistically lower unit lifetime energy consumption relative to the LIB retired at 80% SOH. The main reason is the substantial variation in batteries’ aging curves; differences in degradation are more pronounced with increasing cycle count, causing the differences in total deliverable energy among cells of the same battery type to widen at longer lifetimes. These results indicate that even under highly favorable end-of-life conditions, lifetime extension alone yields limited gains. Moreover, achieving such prolonged service life would present considerable technological challenges, not only in terms of electrolyte, interface, and mechanical stability within the battery itself, but also in ensuring that other EV subsystems maintain durability over the extended operating period.
Fig. 6a illustrates how unit GHG emissions per kWh of electricity delivered from the batteries vary under three representative grid scenarios: California (relatively low-emitting), Minnesota (moderate), and Tennessee (carbon-intensive), which correspond roughly to the upper-quartile, median, and lower-quartile carbon intensities of the U.S. power mix. The heat-map colors deepen from left to right with increasing grid carbon intensity, indicating that life cycle GHG emissions scale strongly with the carbon intensity of electricity generation. Vertically, darker colors from the bottom to top reveal a consistent ranking among battery technologies within each grid scenario: ASSBs with 2× the cycle life of conventional LIBs retiring at 65% SOH have the lowest emissions, while ASSBs with 0.5× the cycle life of LIBs retiring at 80% SOH have the highest emissions per kWh. We also see that the variation in the U.S. grid emissions has a larger impact than battery technology and lifetime: the most emitting batteries operated in California's low-emitting grid still have lower emissions than the lowest-emitting battery system operating in Minnesota's more average grid. The same pattern holds when comparing Minnesota and Tennessee grids. The scenario enclosed by the dashed box (LIBs retiring at 80% SOH) serves as the baseline for comparison across all cases. The results highlight the critical role of grid decarbonization in achieving deep emission reductions from EV batteries.
 | ||
| Fig. 6 Comparison of unit environmental impacts under different grid carbon intensity (a) and vehicle energy consumption (b) scenarios. | ||
Fig. 6b presents unit energy consumption per lifetime mile driven under three vehicle fuel economy cases: low, medium, and high energy consumption. As vehicle energy consumption per mile increases from left to right, the heat-map colors deepen, indicating higher unit life-cycle energy use. Within each fuel economy case, ASSBs with shorter lifetimes show higher unit energy consumption than LIBs or longer-lived ASSBs. When comparing fuel economy scenarios, we do see that ASSBs can have lower lifetime energy consumption per mile, compared to conventional LIBs, if the electric vehicle has a lower energy consumption per mile traveled. For example, an ASSB with the same lifetime as an LIB in a high-efficiency vehicle has an energy consumption of 0.45 kWh per mile, while a conventional LIB in a moderately efficient vehicle retired at 80% SOH uses 0.48 kWh per mile. This is potentially significant if the energy density of ASSBs enables some electric vehicle lightweighting or other aerodynamic efficiency improvements because of the smaller pack volume requirements.
In summary, these results indicate that improvements in gravimetric or volumetric energy density do not automatically translate into proportional reductions in service-based environmental impacts. While higher energy density may reduce per-cell material intensity, the manufacturing-stage impacts observed in this study remain comparable between LIBs and ASSBs. Moreover, the dominant contribution of the use phase, particularly electricity consumption over the operational lifetime, limits the extent to which energy density alone determines life cycle performance when impacts are normalized per kWh delivered or per mile driven. Under service-based functional units, degradation behavior, grid carbon intensity, and vehicle fuel economy play a more decisive role than marginal gains in cell-level energy density.
This observation is not specific to ASSBs but reflects a broader methodological consideration in battery life cycle assessment. Environmental outcomes can vary substantially depending on whether product-based or service-based functional units are applied. Therefore, evaluating emerging battery technologies requires careful interpretation of energy density improvements within a broader system context.
3.3. Comparison with other EV battery LCA studies
Fig. 7 summarizes the comparison between this study and prior LIB LCA studies across the three life-cycle phases. The blue circular markers represent values reported in the literature, while the red star markers indicate the median results from this study, with error bars showing the 95% confidence intervals from the Monte Carlo simulation. Panel (a) compares energy consumption and panel (b) compares GHG emissions per kWh of battery capacity. The EoL phase represents the net impact of recycling, calculated as the environmental burdens of the recycling processes minus the credits from the recovered materials, consistent with common practice in the literature. For visualization, these net values were multiplied by −1 so that positive values in the figure correspond to net environmental benefits at the end of life. Only studies involving NMC-type oxide cathodes were included in the comparison. A detailed summary of the literature results is provided in Table S12. | ||
| Fig. 7 Comparison of energy consumption (a) and GHG emissions (b) per kWh of battery capacity between this study and other conventional LIB LCA studies. | ||
Overall, the results from this study fall within the range of previously reported values, although they tend to lie toward the lower end of the distribution. A few reasons may explain. First, the battery modeled in this study has a relatively high specific energy (190 Wh kg−1), compared with the 120 Wh kg−1 value commonly assumed in earlier studies. Higher specific energy reduces the mass of active materials required per kWh of capacity and therefore lowers the associated environmental burdens. This trend is consistent with the study of Mohr et al.,64 which assumes a similar specific energy (170 Wh kg−1) and reports impact estimates close to ours. Second, the electricity mix used in our assessment has a lower carbon intensity than those reported by Kallitsis et al., Kim et al., Sun et al., and Ellingsen et al.65–68 For example, the study of An et al.62 relies on a coal-intensive grid mix, which substantially increases manufacturing-stage GHG emissions.
Table 2 summarizes the comparison between this study and previously published LCA assessments of ASSBs across the material extraction and manufacturing phases. The EoL phase is excluded due to the lack of corresponding data in prior studies.
| Reference | Cathode–electrolyte–anode | Specific energy | Energy consumption (kWh) and GHG emissions (kg CO2e) per kWh of battery | |
|---|---|---|---|---|
| Material extraction | Manufacturing | |||
| Lastoskie and Dai71 | NMC111–LiPON–Li | 270 Wh kg−1 | 189 kWh | 57 kWh |
| 38 kg | 12 kg | |||
| Rietdorf et al.72 | NMC811–LiPS–Li | 317 Wh kg−1 (cell only) | NA | NA |
| 93 kg | 35 kg | |||
| Rietdorf et al.72 | NMC622–LiPS–Li | 285 Wh kg−1 (cell only) | NA | NA |
| 109 kg | 39 kg | |||
| Degen et al.26 | NMC900–LATP–Li | 360 Wh kg−1 (cell only) | 614 kWh | 38 kWh |
| 122 kg | 6 kg | |||
| Degen et al.26 | NMC900–LATP–Li | 430 Wh kg−1 (cell only) | 461 kWh | 29 kWh |
| 83 kg | 5 kg | |||
| Pell and Lindsay69 | NMC811–sulfide–Li | 400 Wh kg−1 | NA | NA |
| 46 kg | 14 kg | |||
| Pell and Lindsay69 | NMC811–oxide–Li | 400 Wh kg−1 | NA | NA |
| 44 kg | 14 kg | |||
| This study | NMC811–LiPS–Li | 239 Wh kg−1 | 144 kWh [129, 159] | 35 kWh [34, 35] |
| 43 kg [38, 50] | 14 kg [3, 26] | |||
The results obtained in this study are broadly consistent with previously reported values. In particular, our estimates align closely with those of the study of Pell and Lindsay,69 which uses a similar battery cell configuration. The environmental impacts of raw material extraction reported in the study of Degen et al.26 are substantially higher than the values obtained in this study. This discrepancy can be primarily attributed to the synthesis route of the LATP solid electrolyte used in the study of Degen et al.,26 which involves high-temperature calcination at approximately 900 °C.70 Such thermal processing is highly energy-intensive, thus elevating both the energy demand and associated GHG emissions during precursor production. In contrast, the Li3PS4 solid electrolyte modeled in this study requires comparatively lower-temperature (300 °C) synthesis steps, resulting in reduced environmental burdens.
3.4. Limitations and perspectives
This study is subject to several limitations. The prospective recycling pathway proposed for ASSBs has not yet been validated experimentally. Although each individual step has been demonstrated as feasible in prior studies, laboratory implementation of the integrated process would improve the practical assessment of recyclability and enhance the accuracy of future LCAs. Further experimental work could therefore help confirm process viability and refine associated environmental estimates. In addition, recovery efficiencies were adopted from literature-informed baseline values and were not independently varied. Given the emerging and system-dependent nature of ASSB recycling technologies, experimentally validated recovery data under industrially relevant conditions remain limited. In the modeled scenarios, recycling credits are predominantly driven by cathode material recovery, consistent with LIB recycling systems, while contributions from other components are comparatively minor. Therefore, moderate deviations in recovery efficiencies of non-dominant components are unlikely to substantially alter the comparative life cycle outcomes. More comprehensive validation of integrated recycling processes and recovery performance would nevertheless reduce uncertainty and further enhance the robustness of future prospective LCAs.In addition, comprehensive aging data for ASSBs under realistic operating conditions remain limited. In this study, we approximated degradation by fixing the retirement point and interpolating between the initial and end-of-life states using the shape of a high-temperature (100 °C) accelerated aging curve. We acknowledge that degradation in ASSBs involves multiple concurrent mechanisms, including interfacial instability, electrolyte decomposition, lithium dendrite growth, and microstructural evolution, many of which may exhibit complex and potentially non-linear temperature dependencies.73 As a result, assuming that the aging-curve shape remains unchanged across temperatures represents a simplifying assumption and implicitly presumes no substantial shift in dominant degradation pathways. This approximation is adopted as a pragmatic modeling strategy for prospective life cycle assessment, where comprehensive, long-term aging datasets across temperature ranges are currently limited. The objective of this study is not to establish a mechanistic degradation model but to provide a system-level lifetime representation suitable for environmental assessment. More detailed characterization of ASSB aging behavior under practical cycling conditions and multiple temperatures would enhance the robustness of lifetime predictions and refine evaluations of use-phase performance.
Moreover, ASSB manufacturing and recycling require inert-gas-controlled (e.g. N2 or Ar) environments due to the high reactivity of the solid electrolyte and lithium metal anode.74 The additional energy and material demand required to produce and maintain this environment for some manufacturing stages were not included in this study due to the lack of data, and if they add significant energy demands beyond the typical dry room conditions, they could further increase the energy required for the ASSB manufacturing and recycling. As manufacturing technologies mature and more detailed process information becomes available, incorporating these requirements will be essential for producing more realistic and comprehensive life cycle assessments. Ultimately, doing so will be crucial for determining whether ASSBs truly deliver measurable environmental advantages over conventional LIB technologies.
3.5. Sustainability interventions
A number of strategies can further reduce the life cycle energy and climate impacts of both conventional LIBs and ASSBs. First, decarbonizing the electricity grid is among the most effective levers, as it directly lowers GHG emissions from both the manufacturing and use phases. Additionally, improving vehicle fuel economy is highly beneficial because it reduces the unit energy demand, thereby decreasing the substantial use-phase GHG emissions associated with battery charging.Second, extending the battery lifetime can reduce unit environmental burdens by distributing production-related impacts over a larger amount of delivered energy or vehicle miles traveled. Several strategies have been demonstrated to enhance ASSB long-term stability. For instance, because sulfide solid electrolytes oxidize at potentials as low as 2.6 V, electronically insulating coatings such as LiNbO3 or LiNb0.5Ta0.5O3 are often applied to cathode particles to mitigate interfacial degradation.75,76 In addition, employing single-crystal NMC811 instead of polycrystalline counterparts eliminates intergranular cracking and preserves stable solid–solid contact during cycling, thereby improving structural integrity and extending battery life.77 Furthermore, constructing robust artificial SEI layers can homogenize Li+ flux, suppress dendrite formation on lithium metal surfaces, and markedly enhance the long-term cycling stability of solid-state and metal-anode batteries.78 Developing techniques to extend ASSB battery lifetimes to meet or exceed conventional LIBs is critical to ensuring environmental benefits from the technology.
Third, because a substantial share of cradle-to-gate impacts originates from the NMC811 cathode, promoting spent battery recycling is essential for long-term sustainability. Efficient recovery of transition metals can substantially reduce the energy and emissions associated with primary material production, while also improving supply-chain resilience by lowering dependence on resource-intensive mining.
We see that if ASSBs are unable to match the lifetime of conventional LIBs, the lifetime energy consumed per kWh of stored energy delivered is significantly higher than that of conventional LIBs. Conversely, even under an extreme scenario in which the ASSB lifetime is assumed to be five times longer than that of conventional LIBs, the results still do not show substantially lower energy consumption per kWh of stored energy delivered over the battery lifetime. Similarly, under an optimistic end-of-life recycling scenario in which the recycling process and any associated material inputs used in the recycling process are assumed to have zero environmental impact, the 0.5× lifetime case, which previously exhibited higher environmental burdens than the baseline LIB under realistic recycling assumptions, no longer exhibits statistically higher unit lifetime energy consumption. However, extending the ASSB lifetime to 2× or even 5× the baseline still does not result in statistically lower unit lifetime energy consumption relative to the LIB retired at 80% SOH. One possible area for environmental improvement is that ASSBs enable higher fuel economy through vehicle lightweighting. The pack-level specific and volumetric energy densities of ASSBs are approximately 20% higher than those of conventional LIBs (239 vs. 190 Wh kg−1 and 388 vs. 327 Wh L−1 in this study), which can directly reduce battery pack mass. Because the battery pack constitutes a substantial fraction of the total vehicle curb weight, reductions at the pack level translate meaningfully to vehicle-level mass savings. Prior studies have shown that a 10% reduction in vehicle mass can yield a 6%–8% improvement in fuel economy,79 suggesting that mass savings enabled by ASSBs could produce measurable use-phase energy and climate benefits. The reduced volumetric footprint may also enable additional aerodynamic design adjustments to reduce drag and improve fuel economy. If ASSBs are to increase vehicle range instead of leveraging them as a lightweighting or aerodynamic design strategy, they do not offer significant environmental benefits over conventional LIBs.
4. Conclusions
This study introduces a prospective recycling pathway for sulfide based ASSBs and compares their cradle-to-cradle energy and climate impacts with those of conventional LIBs. The results show that the use phase remains the dominant contributor to life cycle impacts for both technologies, which highlights the critical role of electricity grid decarbonization and vehicle-level efficiency in determining net environmental outcomes. While the proposed recycling pathway enables safe material recovery from ASSBs, Monte Carlo analysis indicates that ASSB recycling currently imposes greater environmental burdens than established LIB processes on a per-cell basis. When normalized by lifetime energy delivered, the environmental performance of ASSBs is highly sensitive to their operational lifetime: shorter lifetimes substantially increase unit energy use relative to LIBs, whereas comparable or extended lifetimes do not necessarily yield strong per-kWh improvements.These findings suggest that the sustainability advantages of ASSBs are unlikely to emerge from cell-level material substitutions or material recycling advances alone. Instead, their sustainability advantages are more likely to be realized when system-level design benefits are leveraged. The higher gravimetric and volumetric energy densities of ASSBs can enable vehicle lightweighting and potentially improved aerodynamics, both of which can measurably reduce use-phase energy demand and greenhouse gas emissions. They could also enable electrification of vehicle classes and transport systems that are highly weight- or volume-constrained and therefore difficult to electrify using conventional lithium-ion batteries, such as certain aviation, electric vertical take-off and landing, or long-range heavy-duty transport applications. In contrast, using ASSBs primarily to increase the driving range of light-duty vehicles without the corresponding efficiency gains offers limited environmental benefits relative to conventional LIBs.
From a policy and design perspective, our results underscore the importance of aligning next-generation battery innovation with vehicle efficiency strategies. Policies that emphasize energy consumption per distance traveled, rather than simply extending the driving range, could more effectively incentivize the integration of higher-energy-density batteries in ways that maximize climate benefits. At the same time, advancing durable ASSB chemistries, enhancing interfacial stability, and improving recyclability remain critical to ensuring long-term sustainability advantages.
Overall, this work provides one of the first life cycle assessments of prospective ASSB recycling and highlights both the opportunities and constraints associated with ASSB deployment from a sustainability perspective. As ASSB manufacturing and recycling technologies mature and more empirical data become available, refining these analyses will be essential for determining whether ASSBs can deliver meaningful environmental improvements over conventional LIB technologies.
Author contributions
R. E. C. and Z. Z. conceived and designed the study. R. E. C. and Z. Z. defined the system boundaries and key stages of the LCA. Z. Z. performed the LCA modelling and calculations. Z. Z. organized the data and wrote the manuscript. R. E. C. and Z. Z. discussed the results and revised the manuscript. All authors approved the final version of the manuscript.Conflicts of interest
There are no conflicts to declare.Data availability
The data supporting this article have been included as part of the supplementary information (SI). Supplementary information is available. See DOI: https://doi.org/10.1039/d6eb00058d.All codes used in this study are available at: https://github.com/samuel5874-zz/ASSB-vs-LIB.git.
Acknowledgements
Zhu Zhu acknowledges support from a William Uffman Fellowship.References
- US Department of Transportation, Benefits to Communities, https://www.transportation.gov/rural/ev/toolkit/ev-benefits-and-challenges/community-benefits, (accessed 29 July 2025).
- International Energy Agency, Trends in electric car markets, https://www.iea.org/reports/global-ev-outlook-2025/trends-in-electric-car-markets-2, (accessed 29 July 2025).
- Argonne National Laboratory, EV BATTERIES AND RECYCLING, https://www.anl.gov/sites/www/files/2022-12/EV_Batteries_Recycling_FINAL%2012-14-22.pdf, (accessed 30 July 2025).
- D. A. Notter, M. Gauch, R. Widmer, P. Wäger, A. Stamp, R. Zah and H. J. Althaus, Environ. Sci. Technol., 2010, 44, 7744 CrossRef CAS.
- R. E. Ciez and J. F. Whitacre, Nat. Sustainability, 2019, 2, 148–156 CrossRef.
- A. Alkhalidi, M. K. Khawaja and S. M. Ismail, Sci. Talks, 2024, 11, 100382 CrossRef.
- S. C. Mun, J. H. Won, J. Liu, F. Meng and Y. Sun, Crystals, 2021, 11, 1013 CrossRef CAS.
- Z. Zhu and S. A. Miller, Resour., Conserv. Recycl., 2025, 218, 108236 CrossRef CAS.
- F. Hanna, C. Somers and A. Anctil, Environ. Sci. Technol., 2025, 59, 14432–14443 CrossRef CAS PubMed.
- L. Peiseler, V. Schenker, K. Schatzmann, S. Pfister, V. Wood and T. Schmidt, Nat. Commun., 2024, 15, 1–13 Search PubMed.
- R. Ma, S. Tao, X. Sun, Y. Ren, C. Sun, G. Ji, J. Xu, X. Wang, X. Zhang, Q. Wu and G. Zhou, Nat. Commun., 2024, 15, 1–14 Search PubMed.
- B. Zhang, Q. Xin, S. Chen, B. Wang, H. Li, Z. Wang and P. Bansal, Nat. Commun., 2025, 16, 1–15 Search PubMed.
- H. Zhang, B. Xue, S. Li, Y. Yu, X. Li, Z. Chang, H. Wu, Y. Hu, K. Huang, L. Liu, L. Chen and Y. Su, Sci. Rep., 2023, 13, 1–12 CAS.
- M. L. Machala, X. Chen, S. P. Bunke, G. Forbes, A. Yegizbay, J. A. de Chalendar, I. L. Azevedo, S. Benson and W. A. Tarpeh, Nat. Commun., 2025, 16, 1–14 Search PubMed.
- A. R. Ali, N. Bartie, J. Husmann, F. Cerdas, D. Schröder and C. Herrmann, Resour., Conserv. Recycl., 2024, 202, 107384 CrossRef CAS.
- A. Fahimi, H. Solorio, R. K. Nekouei and E. Vahidi, J. Power Sources, 2023, 580, 233425 CrossRef CAS.
- S. Zhao and F. You, ACS Sustainable Chem. Eng., 2019, 7, 5082–5094 CrossRef CAS.
- A. Machín, M. C. Cotto, F. Díaz, J. Duconge, C. Morant and F. Márquez, Batteries, 2024, 10, 255 CrossRef.
- Z. Liu, X. Li, H. Zhang, K. Huang and Y. Yu, J. Cleaner Prod., 2024, 447, 141452 CrossRef CAS.
- A. Keshavarzmohammadian, S. M. Cook and J. B. Milford, J. Cleaner Prod., 2018, 202, 770–778 CrossRef CAS.
- J. L. Popien, C. Thies, A. Barke and T. S. Spengler, Int. J. Life Cycle Assess., 2023, 28, 462–477 CrossRef CAS.
- A. Schreiber, M. Rosen, K. Waetzig, K. Nikolowski, N. Schiffmann, H. Wiggers, M. Küpers, D. Fattakhova-Rohlfing, W. Kuckshinrichs, O. Guillon and M. Finsterbusch, Green Chem., 2023, 25, 399–414 RSC.
- S. Troy, A. Schreiber, T. Reppert, H. G. Gehrke, M. Finsterbusch, S. Uhlenbruck and P. Stenzel, Appl. Energy, 2016, 169, 757–767 CrossRef.
- L. Smith, T. Ibn-Mohammed, D. Astudillo, S. Brown, I. M. Reaney and S. C. L. Koh, Adv. Sustainable Syst., 2021, 5, 2000241 CrossRef CAS.
- J. Zhang, X. Ke, Y. Gu, F. Wang, D. Zheng, K. Shen and C. Yuan, Int. J. Life Cycle Assess., 2022, 27, 227–237 CrossRef CAS.
- F. Degen, M. Mitterfellner and A. Kampker, J. Ind. Ecol., 2025, 29, 113–128 CrossRef CAS.
- S. Doose, J. K. Mayer, P. Michalowski and A. Kwade, Metals, 2021, 11, 291 CrossRef CAS.
- M. Ahuis, S. Doose, D. Vogt, P. Michalowski, S. Zellmer and A. Kwade, Nat. Energy, 2024, 9, 373–385 CrossRef CAS.
- D. H. S. Tan, A. Banerjee, Z. Chen and Y. S. Meng, Nat. Nanotechnol., 2020, 15, 170–180 CrossRef CAS PubMed.
- D. H. S. Tan, P. Xu, H. Yang, M.-C. Kim, H. Nguyen, E. A. Wu, J. M. Doux, A. Banerjee, Y. S. Meng and Z. Chen, MRS Energy Sustainability, 2020, 7, E23 CrossRef.
- L. Azhari, S. Bong, X. Ma and Y. Wang, Matter, 2020, 3, 1845–1861 CrossRef.
- G. Zhuang, Y. Chen and P. N. Ross, Surf. Sci., 1998, 418, 139–149 CrossRef CAS.
- A. Etxebarria, A. Etxebarria, D. J. Yun, D. J. Yun, M. Blum, M. Blum, Y. Ye, Y. Ye, Y. Ye, M. Sun, K. J. Lee, K. J. Lee, H. Su, H. Su, M. Á. Muñoz-Márquez, P. N. Ross, E. J. Crumlin and E. J. Crumlin, ACS Appl. Mater. Interfaces, 2020, 12, 26607–26613 CrossRef CAS PubMed.
- Argonne National Laboratory, BatPaC: Battery Manufacturing Cost Estimation, https://www.anl.gov/partnerships/batpac-battery-manufacturing-cost-estimation, (accessed 19 September 2025).
- Argonne National Laboratory, Parametric Study of Lithium-Ion Batteries using BatPaC, 2023 Search PubMed.
- K. W. Knehr, J. J. Kubal, D. W. Dees and S. Ahmed, J. Power Sources, 2025, 631, 236286 CrossRef CAS.
- C. S. Kim, K. M. Jeong, K. Kim and C. W. Yi, Electrochim. Acta, 2015, 155, 431–436 CrossRef CAS.
- J. Oh, D. Kwon, S. H. Choi, N. Lee, Y. Sohn, T. Lee, T. Lee, J. Y. Kim, K. Y. Bae and J. W. Choi, Adv. Energy Mater., 2025, 15, 2404817 CrossRef CAS.
- S. Ahmed, S. E. Trask, D. W. Dees, P. A. Nelson, W. Lu, A. R. Dunlop, B. J. Polzin and A. N. Jansen, J. Power Sources, 2018, 403, 56–65 CrossRef CAS.
- S. H. Park, D. Jun, G. H. Lee, S. G. Lee and Y. J. Lee, J. Mater. Chem. A, 2021, 9, 14656–14681 RSC.
- Argonne National Laboratory, Battery Performance and Cost Modeling for Electric-Drive Vehicles-A Manual for BatPaC v5.0, https://www.anl.gov, (accessed 26 September 2025).
- M. Burton, S. Narayanan, B. Jagger, L. F. Olbrich, S. Dhir, M. Shibata, M. J. Lain, R. Astbury, N. Butcher, M. Copley, T. Kotaka, Y. Aihara and M. Pasta, Nat. Energy, 2025, 10, 135–147 CrossRef.
- Y. F. Guo, K. Huang and X. Y. Hu, J. Energy Storage, 2021, 36, 102372 CrossRef.
- Z. Lin, D. Li and Y. Zou, J. Energy Storage, 2023, 74, 109386 CrossRef.
- E. Redondo-Iglesias, P. Venet and S. Pelissier, IEEE Trans. Ind. Appl., 2019, 55, 1932–1940 CAS.
- T. Baumhöfer, M. Brühl, S. Rothgang and D. U. Sauer, J. Power Sources, 2014, 247, 332–338 CrossRef.
- K. Ando, T. Matsuda, T. Miwa, M. Kawai and D. Imamura, Battery Energy, 2023, 2, 20220052 CrossRef CAS.
- Y. Zhong, X. Yang, R. Guo, L. Zhai, X. Wang, F. Wu, C. Wu and Y. Bai, Electrochem. Energy Rev., 2024, 7, 1–53 Search PubMed.
- S. Tao, R. Ma, Y. Chen, Z. Liang, H. Ji, Z. Han, G. Wei, X. Zhang and G. Zhou, J. Power Sources, 2024, 597, 234156 CrossRef CAS.
- United States Department of Energy, Fuel Economy of 2026 All-Electric Vehicles, https://www.fueleconomy.gov/feg/byfuel/EV2026.shtml, (accessed 19 November 2025).
- K. Davis and G. P. Demopoulos, RSC Sustainability, 2023, 1, 1932–1951 RSC.
- J. B. Dunn, L. Gaines, M. Barnes, J. L. Sullivan and M. Wang, Material and Energy Flows in the Materials Production, Assembly, and End-of-Life Stages of the Automotive Lithium-Ion Battery Life Cycle, https://www.osti.gov/servlets/purl/1177517/, (accessed 26 September 2025).
- K. M. Short, A. Wei and P. Padungros, Encycl. Reagents Org. Synth., 2014, 1–6 CAS.
- T. Tabuchi, H. Yasuda and M. Yamachi, J. Power Sources, 2006, 162, 813–817 CrossRef CAS.
- B. Q. Xiong, S. Chen, X. Luo, Q. Nian, X. Zhan, C. Wang and X. Ren, Adv. Sci., 2022, 9, 2105924 CrossRef CAS PubMed.
- M. Duchardt, M. Diels, B. Roling and S. Dehnen, ACS Appl. Energy Mater., 2020, 3, 6937–6945 CrossRef CAS.
- K. Wissel, L. M. Riegger, C. Schneider, A. I. Waidha, T. Famprikis, Y. Ikeda, B. Grabowski, R. E. Dinnebier, B. V. Lotsch, J. Janek, W. Ensinger and O. Clemens, ACS Appl. Energy Mater., 2023, 6, 7790–7802 CrossRef CAS.
- A. Reiß, C. Donsbach and C. Feldmann, Dalton Trans., 2021, 50, 16343–16352 RSC.
- M. Wang, Y. Guo, H. Hu and S. Ding, Sustainable Prod. Consumption, 2023, 42, 380–391 CrossRef.
- F. Degen, M. Winter, D. Bendig and J. Tübke, Nat. Energy, 2023, 8, 1284–1295 CrossRef CAS.
- T. Le Thi, T. Phan Van, B. Nguyen Van, N. To Van, T. Nguyen Van, T. P. Doan, T. L. Ngo, N. H. Vu, T. T. Nguyen, H. N. Nguyen, V. A. D. Nguyen and M. T. Dang, ACS Omega, 2023, 8, 45414–45427 CrossRef CAS PubMed.
- S. J. An, J. Li, Z. Du, C. Daniel and D. L. Wood, J. Power Sources, 2017, 342, 846–852 CrossRef CAS.
- F. Schomburg, B. Heidrich, S. Wennemar, R. Drees, T. Roth, M. Kurrat, H. Heimes, A. Jossen, M. Winter, J. Y. Cheong and F. Röder, Energy Environ. Sci., 2024, 17, 2686–2733 RSC.
- M. Mohr, J. F. Peters, M. Baumann and M. Weil, J. Ind. Ecol., 2020, 24, 1310–1322 CrossRef CAS.
- E. Kallitsis, A. Korre, G. Kelsall, M. Kupfersberger and Z. Nie, J. Cleaner Prod., 2020, 254, 120067 CrossRef CAS.
- H. C. Kim, T. J. Wallington, R. Arsenault, C. Bae, S. Ahn and J. Lee, Environ. Sci. Technol., 2016, 50, 7715–7722 CrossRef CAS PubMed.
- X. Sun, X. Luo, Z. Zhang, F. Meng and J. Yang, J. Cleaner Prod., 2020, 273, 123006 CrossRef CAS.
- L. A. W. Ellingsen, G. Majeau-Bettez, B. Singh, A. K. Srivastava, L. O. Valøen and A. H. Strømman, J. Ind. Ecol., 2014, 18, 113–124 CrossRef CAS.
- R. Pell and J. J. Lindsay, COMPARATIVE LIFE CYCLE ASSESSMENT STUDY OF SOLID STATE AND LITHIUM-ION BATTERIES FOR ELECTRIC VEHICLE APPLICATION IN EUROPE, https://www.minviro.com, (accessed 13 November 2025).
- F. Öksüzoğlu, Ş. Ateş, O. M. Özkendir, G. Çelik, Y. R. Eker and H. Baveghar, Ceram. Int., 2024, 50, 31435–31441 CrossRef.
- C. M. Lastoskie and Q. Dai, J. Cleaner Prod., 2015, 91, 158–169 CrossRef CAS.
- C. Rietdorf, C. De la Rúa, S. Kiemel and R. Miehe, Int. J. Life Cycle Assess., 2024, 29, 1992–2003 CrossRef CAS.
- C. Li, Z. Y. Wang, Z. J. He, Y. J. Li, J. Mao, K. H. Dai, C. Yan and J. C. Zheng, Appl. Energy, 2025, 386, 125546 CrossRef.
- F. Baakes, R. Song, T. Bernet, J. Valenzuela, G. de León, G. Jackson, C. S. Adjiman, A. Galindo and U. Krewer, J. Power Sources, 2025, 640, 236619 CrossRef CAS.
- N. Ohta, K. Takada, I. Sakaguchi, L. Zhang, R. Ma, K. Fukuda, M. Osada and T. Sasaki, Electrochem. Commun., 2007, 9, 1486–1490 CrossRef CAS.
- C. Wang, J. Liang, S. Hwang, X. Li, Y. Zhao, K. Adair, C. Zhao, X. Li, S. Deng, X. Lin, X. Yang, R. Li, H. Huang, L. Zhang, S. Lu, D. Su and X. Sun, Nano Energy, 2020, 72, 104686 CrossRef CAS.
- S. Y. Kim, H. Cha, R. Kostecki and G. Chen, ACS Energy Lett., 2022, 8, 521–528 CrossRef.
- J. Chen, D. Li, K. Lin, X. Ke, Y. Cheng and Z. Shi, J. Power Sources, 2022, 540, 231603 CrossRef CAS.
- F. Yang, A. Brooker, S. Kleinbaum and D. Gotthold, Environ. Res. Commun., 2024, 6(10), 101017 CrossRef.
| This journal is © The Royal Society of Chemistry 2026 |