

 Open Access Article
 This Open Access Article is licensed under a Creative Commons Attribution-Non Commercial 3.0 Unported Licence
Different dimerization affinity and orientation of fluorescent proteins eGFP and eYFP
Yuna Kinoshitaa,
Yusuke Nakasone b,
Masahide Terazimab and
Haruko Hosoi*a
b,
Masahide Terazimab and
Haruko Hosoi*a
aDepartment of Biomolecular Science, Faculty of Science, Toho University, Funabashi, Chiba, Japan. E-mail: haru@biomol.sci.toho-u.ac.jp
bDepartment of Chemistry, Graduate School of Science, Kyoto University, Kyoto, Japan
First published on 19th May 2026
Abstract
Oligomerization of fluorescent proteins (FPs) is critical for imaging but is poorly understood. We investigated the dimerization of enhanced green fluorescent protein (eGFP) and enhanced yellow fluorescent protein (eYFP), which differ by only five residues. Size exclusion chromatography (SEC) confirmed a monomer–dimer equilibrium for both eGFP and eYFP. Using analytical ultracentrifugation (AUC), the dissociation constant (Kd) was determined to be 340 µM for eGFP, indicating a significantly lower affinity than eYFP (Kd = 20 µM). Time-resolved fluorescence anisotropy revealed that intra-dimer homo-Förster resonance energy transfer (FRET) is completed faster than 20 ps for both FPs. Importantly, by analyzing concentration-dependent anisotropy signals, we independently determined that the Kd values are 740 µM for eGFP and 36 µM for eYFP, providing more reliable estimates for FPs with low affinity. Furthermore, we determined that the transition dipole moment angles within the homodimers are 32° for eGFP and 49° for eYFP. These findings demonstrate that subtle sequence variations can significantly alter both interfacial affinity and relative orientation. This study contributes to the rational design of FRET sensors by enabling the independent control of dimerization affinity and relative orientation.
Introduction
Since the discovery of green fluorescent protein (GFP) from the jellyfish Aequorea victoria,1–3 numerous fluorescent proteins (FPs) have been engineered and widely utilized to visualize protein localization, conformational changes, and interactions in living cells.4–11 For high-performance imaging, understanding the photophysical properties of FPs is crucial. FPs typically consist of 230–240 amino acids and form a β-barrel structure with a central chromophore.4,12 Although sequence identity is often high within the same species, subtle differences can lead to pronounced changes in photophysical properties. Therefore, identifying general principles that determine FP behavior is critical for the strategic development of high-performance FP sensors.Among the various photophysical properties of FPs, oligomerization is particularly important, because it can be either detrimental or beneficial depending on the application. Jellyfish-derived FPs generally form weak dimers, whereas coral- and sea anemone-derived FPs often form tight tetramers.13 Unintended oligomerization may perturb the localization or function of fusion proteins,14 and mutations that suppress dimerization are therefore frequently introduced into jellyfish-derived FPs.14,15 In contrast, dimerization can be advantageous in Förster resonance energy transfer (FRET)-based sensors, in which efficiency is governed by the distance and relative orientation of the donor and acceptor.16,17 For example, the calcium indicator Yellow Cameleon 3.60 (YC3.60) achieves a high dynamic range by optimizing the relative orientation of the Aequorea-derived donor and acceptor FPs.18,19 Other studies have also shown that FRET efficiency can be improved by using circular permutations.20–22 Furthermore, FP dimerization has found significant applications in optogenetics, where the light-dependent dimerization of Dronpa is utilized to reversibly control protein activity.8,23 However, FP sensor development still relies largely on trial and error, mainly because the conformations of functional FP sensors are difficult to determine directly. Thus, quantitative knowledge of the intrinsic oligomerization behavior of FPs remains essential.
Despite its importance, quantitative information on FP oligomerization remains scarce. In particular, only limited dissociation constant (Kd) data are available.15,24,25 Although the organized smooth endoplasmic reticulum (OSER) assay enables quantitative evaluation of oligomerization tendencies in cells,13,26 it does not directly report the intrinsic oligomerization properties of FPs. Likewise, while the transition dipole moments (TDMs) of individual FPs have been investigated,27,28 the relative orientation between two FPs is usually inferred by mapping these vectors onto crystal structures.29–31 These limitations arise largely from the lack of methods that directly probe FP association and orientation in solution.
Previously, we investigated the fluorescence mechanism of enhanced yellow fluorescent protein (eYFP), one of the most used FPs from Aequorea victoria,4,6,32 and quantitatively characterized its dimerization affinity.25 Furthermore, using time-resolved fluorescence anisotropy, we revealed that two distinct homo-FRET processes occur: intermolecular homo-FRET between monomers and intra-dimer homo-FRET.25 To expand these findings, this study examines enhanced green fluorescent protein (eGFP),4,33–35 a precursor of eYFP. The amino acid sequence identity of eGFP and eYFP is 97.9%, differing in only five of the 239 residues (Fig. 1(a), (b)36 and Fig. S1 (SI)). Their chromophores are structurally identical (Fig. 1(c) and (d)); the 4-(p-hydroxy-benzylidene)imidazolidin-5-one chromophore is derived from residues Thr65/Tyr66/Gly67 in eGFP and Gly65/Tyr66/Gly67 in eYFP. The difference at the 203rd position (Thr in eGFP vs. Tyr in eYFP) is particularly important; in eYFP, Tyr203 forms a π–π stacking with the chromophore, causing a red-shift in fluorescence emission from green to yellow. The similarity makes eGFP an ideal system to assess how subtle sequence variations influence not only dimerization affinity but also the relative orientation of TDMs. Clarifying these dimerization properties is essential, as they are the fundamental factors of FRET efficiency and sensor performance. Notably, among the five differing residues, only the 203rd residue is located on the protein surface; however, its side chain is oriented toward the interior of the β-barrel. The other four residues are on the central α-helix within the barrel and are not exposed on the surface.
 | ||
| Fig. 1 Crystal structures of (a) eGFP (PDB ID: 2Y0G34) and (b) YFP (PDB ID: 1YFP36), shown as a structural model for eYFP. Residues differing between eGFP (Leu64/Thr65/Val68/Ser72/Thr203) and eYFP (Phe64/Gly65/Leu68/Ala72/Tyr203), and Ala206 are shown as sticks. Residues on the central α-helices are shown in orange. Acid–base equilibria between the anionic and neutral forms of the chromophores in (c) eGFP and (d) eYFP. | ||
Here, we quantitatively characterize the affinity and relative orientation of eGFP and eYFP homodimers by analyzing homo-FRET signals utilizing time-resolved fluorescence anisotropy. This technique is well suited for probing depolarization dynamics such as energy transfer.37–45 We demonstrate that eGFP and eYFP homodimers exhibit distinct affinities and relative orientations. Furthermore, anisotropy measurements at high protein concentrations enabled us to determine the angle between the TDMs of the chromophores within the homodimer. Our analysis suggests that subtle sequence variations can significantly alter the quaternary structure. This methodology is widely applicable to other FPs. Ultimately, the knowledge would lead to independent control of dimerization affinity and orientation, enabling the rational development of high-performance FRET sensors.
Experimental
Site-directed mutagenesis and protein expression
The pRSET B plasmids containing the eGFP and eYFP genes (Clontech) inserted between the BamHI and EcoRI sites were kindly provided by Dr Satoshi Shimozono and Dr Atsushi Miyawaki (RIKEN). The pRSET B plasmid containing the eYFP A206K gene was prepared previously.25 Site-directed mutagenesis was performed according to a previously reported procedure.35 The primer sequences were 5′-CACCCAGTCCAAACTGAGCAAAG-3′ for eGFP A206K, and 5′-CTACCTGAGCACCCAGTCCGCC-3′ for eYFP Y203T. The prepared plasmids were transformed into JM109(DE3) E. coli cells (Promega). The transformed cells were grown in 200 mL of Luria–Bertani (LB) medium supplemented with ampicillin (100 µg mL−1) and incubated for 72 h at 20 °C. Protein expression was achieved by basal expression without induction. After cultivation, cells were lysed by freeze–thaw cycles in liquid nitrogen. The proteins were purified using Ni-NTA affinity resin (Qiagen) and eluted with PBS (10 mM Na2HPO4, 1.76 mM KH2PO4, 137 mM NaCl, 2.7 mM KCl, pH 7.4). For measurements at pH values other than 7.4, proteins were eluted with phosphate buffer containing 140 mM NaCl at the desired pH (KH2PO4/NaOH). All measurements were performed using His-tagged proteins.Protein concentrations were determined from the absorbance at 277 nm using molar extinction coefficients at 277 nm (ε277) of tryptophan (5.55 × 10³ ± 80 M−1 cm−1) and tyrosine (1.34 × 10³ ± 50 M−1 cm−1) in PBS (pH 7.4). These values were slightly revised from those reported in a previous study46 based on our measurements. eGFP, eGFP A206K, and eYFP Y203T contain one tryptophan (Trp) and ten tyrosine (Tyr) residues (excluding Tyr66 which forms the chromophore), yielding an ε277 value of 18![[thin space (1/6-em)]](https://www.rsc.org/images/entities/char_2009.gif) 950 M−1 cm−1. Similarly, eYFP and eYFP A206K contain one Trp and eleven Tyr residues, yielding an ε277 value of 20290 M−1 cm−1.
950 M−1 cm−1. Similarly, eYFP and eYFP A206K contain one Trp and eleven Tyr residues, yielding an ε277 value of 20290 M−1 cm−1.
The concentration determined by absorbance at 277 nm differs from that calculated using the chromophore's extinction coefficient determined by a NaOH denaturation method. Based on the protein concentrations determined by UV absorbance at 277 nm, the molar extinction coefficients for the chromophore of eGFP (489 nm) and eYFP (514 nm) are calculated to be 33400 M−1 cm−1 and 61600 M−1 cm−1, respectively. On the other hand, Cranfill et al. determined the values to be 56000 M−1 cm−1 for eGFP and 110000 M−1 cm−1 for Venus, an eYFP analog, using the denaturation method.13 Using these literature values, the concentrations of 10 µM eGFP or eYFP in this study correspond to 6 µM. In this study, the protein concentration was determined based on absorbance at 277 nm because several different values have been reported for the absorption coefficient of the chromophore.
Absorption and fluorescence spectra
Absorption spectra were measured using a spectrophotometer (UH5210, Hitachi) with a quartz cuvette of 10 mm path length. The pH was monitored using a pH meter (F-71, Horiba).Steady-state fluorescence spectra were acquired using a spectrofluorometer (SPEX Fluorolog-3, Horiba). The sensitivity of the detection system was calibrated using a standard lamp (Ushio). The excitation wavelength was 480 nm. Samples were prepared at a concentration of 0.5 µM in PBS (pH 7.4) and placed in a 10 mm path-length quartz cell. Fluorescence was collected at 90° relative to the excitation light. All measurements were conducted at 25 °C.
Size exclusion chromatography (SEC) measurements
The oligomeric states of eYFP and eGFP in solution (PBS, pH 7.4) were assessed by SEC using a Superdex 200 Increase 3.2/300 column (Cytiva).47 The column was equilibrated with PBS at a flow rate of 0.075 mL min−1, and measurements were performed at 4 °C. The injected sample volume was 10 µL, and elution was monitored by UV absorbance at 277 nm. Samples were analyzed at injection concentrations of 10, 20, 50, 100, and 200 µM for eGFP and eYFP, and at 10 and 200 µM for eGFP A206K and eYFP A206K.Sedimentation equilibrium analytical ultracentrifugation (AUC) measurements
Sedimentation equilibrium experiments were performed for eGFP, eGFP A206K, eYFP, and eYFP A206K in PBS (pH 7.4) using a Beckman Optima XL-A analytical ultracentrifuge equipped with six-channel equilibrium cells at 25 °C. For eGFP, concentrations of 8, 12, 17, and 22 µM were centrifuged at 20000 rpm, and concentrations of 11, 18, 21, and 26 µM were centrifuged at 25000 rpm; the 11 µM sample was measured in two different channels at different radial positions. For eGFP A206K, eYFP, and eYFP A206K, concentrations of 17, 14, and 19 µM, respectively, were centrifuged at 20000 rpm. The radial scan range was 5.8–7.3 cm, monitoring absorbance at 280 nm. Data were analyzed using the Optima XL-A/XL-I data analysis software (version 6.04, Beckman) and a custom fitting procedure utilizing Igor Pro (WaveMetrics). The partial specific volume ![[v with combining macron]](https://www.rsc.org/images/entities/i_char_0076_0304.gif) was determined to be 0.730 mL g−1 using Sednterp (version 20130813). The theoretical molar masses of eGFP, eGFP A206K, eYFP, and eYFP A206K were calculated as 30679.48, 30736.58, 30729.54, and 30786.64 g mol−1, respectively. The molar extinction coefficient at 280 nm (ε280) for eGFP was taken as 17880 M−1 cm−1.
was determined to be 0.730 mL g−1 using Sednterp (version 20130813). The theoretical molar masses of eGFP, eGFP A206K, eYFP, and eYFP A206K were calculated as 30679.48, 30736.58, 30729.54, and 30786.64 g mol−1, respectively. The molar extinction coefficient at 280 nm (ε280) for eGFP was taken as 17880 M−1 cm−1.
Time-resolved fluorescence lifetime and anisotropy measurements
Fluorescence lifetime and anisotropy measurements were performed using a streak camera system (C11200, Hamamatsu Photonics) as described previously.19,25,35 Briefly, a Ti:sapphire mode-locked oscillator (Chameleon Ultra-II, 80 MHz, Coherent) was used as the light source, with the repetition rate reduced to 20 MHz using an electro-optic (EO) modulator (Model 350-160 and Model 25D, Conoptics). Excitation was performed using the second harmonic of the output pulse (500 nm for eGFP and its mutants; 520 nm for eYFP and its mutants). For fluorescence collection, scattered excitation light and the Raman signal of water were rejected using two Y52 filters (for eGFP and its mutant) or two O54 filters (for eYFP and its mutants). Fluorescence signals were spectrally integrated over 520–580 nm for eGFP and its mutant, and 540–620 nm for eYFP and its mutants. The time resolution was 20 ps and 300 ps (FWHM) for sweep ranges of 1 ns and 20 ns, respectively. The excitation polarization was controlled using a half-wave plate. For magic-angle measurements, the angle between the excitation and detection polarizations was set to 54.7°. Data were acquired for 20 min.For anisotropy measurements, fluorescence intensities parallel (I‖(t)) and perpendicular (I⊥(t)) to the excitation polarization were acquired sequentially, with an acquisition time of 20 min for each polarization. The measurements were repeated until a sufficient signal-to-noise ratio was achieved. To ensure the reliability of the data, we carefully verified that the decay curves are not distorted by high counting rates. Specifically, we confirmed that the anisotropy decay curves perfectly match regardless of whether they are measured with low or high excitation light intensity. Typical I‖(t) and I⊥(t) signals are shown in Fig. S2 (SI). The time-resolved anisotropy r(t) was calculated as follows:16,17
| r(t) = (I‖(t) − G·I⊥(t))/(I‖(t) + 2G·I⊥(t)) | (1) |
Quartz cells with path lengths of 0.1 and 10 mm were used: 10 mm cells for concentrations of 0.2, 1, and 10 µM, and 0.1 mm cells for concentrations of 100 µM and above. All measurements were performed at 25 °C.
Results and discussion
Absorption and fluorescence spectra
Fig. 2(a) shows the absorption spectrum of eGFP. The band at 489 nm and the shoulder at around 400 nm are assigned to the S1 ← S0 electronic transitions of the anionic and neutral forms of the chromophore (Fig. 1(c)), respectively. The intense band at 489 nm indicates that the chromophore exists primarily in the anionic form. | ||
| Fig. 2 Absorption spectra of (a) eGFP and eGFP A206K and (b) eYFP and eYFP A206K. Fluorescence emission spectra of (c) eGFP and eGFP A206K and (d) eYFP and eYFP A206K. The excitation wavelength was 480 nm. Protein concentrations were 10 µM for absorption and 0.5 µM for fluorescence measurements. All spectra were measured in PBS (pH 7.4). | ||
The fluorescence emission maximum for the anionic species was observed at 509 nm (Fig. 2(c)). Similarly, absorption bands at 514 nm and 400 nm for eYFP (Fig. 2(b)) correspond to the S1 ← S0 electronic transitions of the anionic and neutral forms (Fig. 1(d)), respectively. The anionic form is dominant, as indicated by the intense 514 nm band. The fluorescence emission of eYFP was observed at 528 nm (Fig. 2(d)). The absorption and fluorescence bands are red-shifted relative to those of eGFP, primarily attributed to the π–π stacking interaction between the chromophore and Tyr203.
We also characterized eGFP A206K and eYFP A206K for comparison. The A206K mutation has been reported to suppress dimerization.15 The absorption and fluorescence spectra of eGFP A206K and eYFP A206K are nearly identical to those of eGFP and eYFP, respectively (Fig. 2). This confirms that the A206K mutation does not alter the electronic states or the acid–base equilibrium of the chromophore.
Monomer–dimer equilibrium of eGFP and eYFP
We investigated the oligomerization properties of eGFP and eYFP using size-exclusion chromatography (SEC). Fig. 3(a) and (b) illustrate the concentration-dependent elution profiles. For eGFP, the apparent molecular mass is 28 kDa at an injection concentration of 10 µM, indicating that only monomers exist. As the concentration increases to 200 µM, the apparent molecular mass shifts to 32 kDa, indicating partial dimer formation. The observation that the single peak shifts with concentration suggests that the monomer and dimer are in fast exchange on the SEC time scale. eYFP exhibits qualitatively similar behavior but with a more pronounced shift in apparent molecular mass (from 31 kDa to 40 kDa), indicating a higher propensity for dimerization compared to that for eGFP. | ||
| Fig. 3 Size-exclusion chromatography (SEC) profiles. Concentration dependence of (a) eGFP and (b) eYFP. Comparison of eGFP, eYFP, eGFP A206K, and eYFP A206K (c) at 10 µM and (d) at 200 µM. In (d), the inset shows the intensity on a fivefold-expanded scale. | ||
Fig. 3(c) compares the elution profiles of eGFP, eYFP, eGFP A206K, and eYFP A206K at an injection concentration of 10 µM. The profiles are nearly identical, confirming that they exist primarily as monomers. Even at 200 µM, the A206K mutants exist as monomers (Fig. 3(d)). Furthermore, in all profiles, a weak shoulder was observed around 1.63 mL (∼68 kDa), suggesting the presence of a different, minor dimeric species that is in slow exchange on the SEC time scale. The shoulder also appeared in the A206K mutants, suggesting that this minor dimeric species forms without the involvement of the 206th residue. Furthermore, additional minor peaks appeared at 1.53 mL (∼120 kDa) and 1.32 mL (∼300 kDa). These peaks are likely due to higher-order oligomers, such as tetramers and octamers, which are also in slow exchange on the SEC time scale. Given their very low relative intensities, the contribution of these minor species is considered negligible.
Determination of the dissociation constant of eGFP by AUC experiments
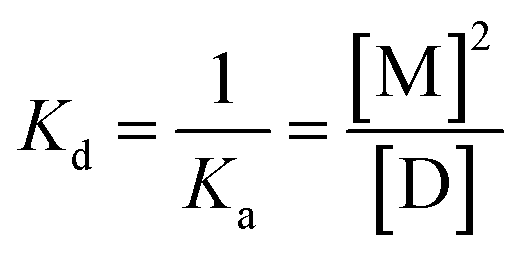
The SEC measurements revealed that the monomer and dimer are in equilibrium for both eGFP and eYFP. The dissociation constant (Kd) and the association constant (Ka) for the monomer–dimer equilibrium (eqn (2)) are defined by eqn (3) using the molar concentrations of the monomer [M] and dimer [D]:| D ⇌ 2M | (2) |
 | (3) |
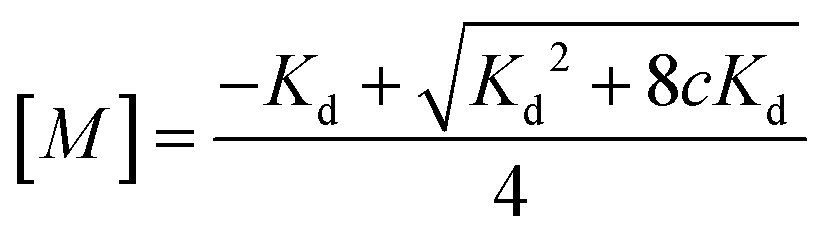 | (4) |
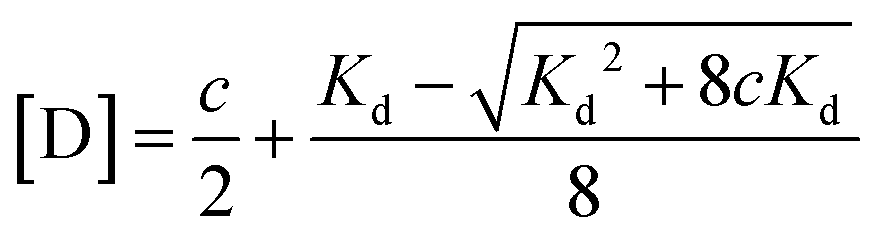 | (5) |
 | ||
| Fig. 4 Results of sedimentation equilibrium analytical ultracentrifugation (AUC) measurements. Radial absorbance profiles at 280 nm for (a) eGFP (17 µM) and eGFP A206K (17 µM), and (b) eYFP (14 µM) and eYFP A206K (19 µM). Data were obtained by sedimentation equilibrium at 20000 rpm. | ||
To determine the Kd value of eGFP, we performed AUC measurements at various concentrations and rotor speeds (Fig. 5). The data were globally fitted to a model describing reversible self-association in an ideal solution (eqn (6)).48,49
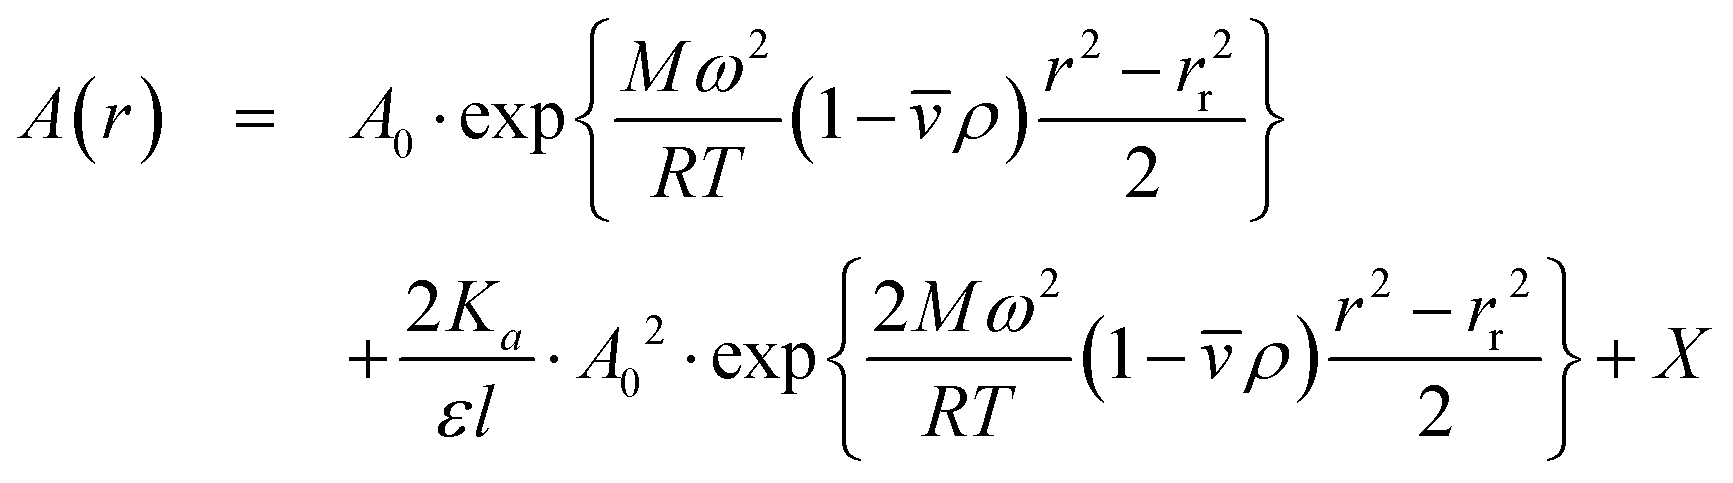 | (6) |
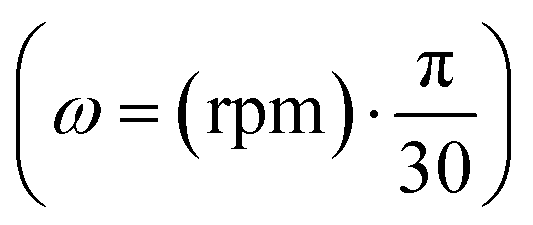 , R is the gas constant, T is the temperature, is the partial specific volume (0.73 mL g−1), ρ is the buffer density (1.0 g mL−1), l is a path length (1 cm), ε is the molar extinction coefficient, and the offset X accounts for baseline absorbance.
 | ||
| Fig. 5 Global analysis of AUC data for eGFP. Radial absorbance profiles at 280 nm were measured at various concentrations and rotor speeds: (a) 26 µM, (b) 18 µM, (c) 25 µM, (d) 11 µM, (e) 21 µM, (f) 11 µM at 25000 rpm; (g) 22 µM, (h) 12 µM, (i) 17 µM, and (j) 8 µM at 20000 rpm. The solid green lines indicate the observed data, and the dotted black lines indicate the global fits using eqn (6). The solid black and dashed black lines represent the calculated contributions from the monomer and the dimer, respectively. The residuals of the fit are shown in the upper panels. | ||
Fig. 5 also shows the fitted curves using eqn (6) with Ka as a global fitting parameter. The obtained parameters are listed in Table S2 (SI). The dissociation constant Kd was determined to be 340 ± 5 µM (Ka = 2930 ± 40 M−1). This value is significantly larger than that of eYFP (20 ± 1 µM25), confirming that eGFP has a much lower tendency to form dimers. However, the reliability of the determined Kd value for eGFP is limited because the maximum eGFP concentration in the measurements (26 µM) is much lower than Kd.
Fluorescence anisotropy of eGFP, eYFP, and their A206K mutants
To elucidate the difference in the dimerization property of eGFP and eYFP, we performed time-resolved fluorescence anisotropy measurements. We found that the anisotropy decay curves at 100 µM and 200 µM of eYFP and eYFP A206K reported in our previous study25 were affected by reabsorption. In this study, we eliminated the reabsorption effect by using a cell with an optical pathlength of 0.1 mm (Fig. S5, SI).Fig. 6 illustrates the concentration-dependent fluorescence anisotropy decay curves for eGFP, eYFP, and their A206K mutants. The absence of pH dependence confirmed that only the anionic species contributes to the observed decay curves (Fig. S7, SI). The decay curves for eGFP A206K (Fig. 6(b)) and eYFP A206K mutants (Fig. 6(d)) are nearly identical across all concentrations, indicating that their dynamics are the same. In contrast, the decay profiles of eGFP (Fig. 6(a)) and eYFP (Fig. 6(c)) are different from those of their respective A206K mutants. Furthermore, the decay curves of eGFP and eYFP differ from each other, suggesting that the contribution of the dimers is different between eGFP and eYFP.
 | ||
| Fig. 6 Fluorescence anisotropy decay curves (PBS, pH 7.4). (a) eGFP and (b) eGFP A206K (excited at 500 nm; emission monitored at 520–580 nm). (c) eYFP and (d) eYFP A206K (excited at 520 nm; emission monitored at 540–620 nm). The data were obtained at various concentrations. | ||
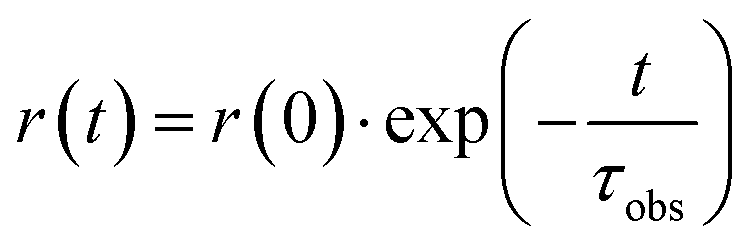
The anisotropy decay curve r(t) at time t can be reproduced by a single exponential function:
 | (7) |
| eGFP | eGFP A206K | |||||
|---|---|---|---|---|---|---|
| Concentration (µM) | τ (ns) | r(0) | τobs (ns) | τ (ns) | r(0) | τobs (ns) |
| a Excited at 500 nm; emission monitored at 520–580 nm.b Excited at 520 nm; emission monitored at 540–620 nm. | ||||||
| 0.2 | — | 0.40 | 16.1 | — | 0.40 | 17.3 |
| 1 | 2.47 | 0.40 | 16.4 | 2.46 | 0.40 | 16.4 |
| 10 | 2.47 | 0.40 | 15.9 | 2.50 | 0.40 | 15.5 |
| 100 | 2.51 | 0.39 | 16.1 | 2.50 | 0.40 | 14.6 |
| 200 | 2.55 | 0.38 | 16.6 | 2.52 | 0.41 | 14.4 |
| eYFP | eYFP A206K | |||||
|---|---|---|---|---|---|---|
| Concentration (µM) | τ (ns) | r(0) | τobs (ns) | τ (ns) | r(0) | τobs (ns) |
| 0.2 | — | 0.41 | 17.3 | — | 0.41 | 16.5 |
| 1 | 3.12 | 0.41 | 16.9 | 3.10 | 0.41 | 15.8 |
| 10 | 3.19 | 0.36 | 16.3 | 3.11 | 0.41 | 15.5 |
| 100 | 3.21 | 0.29 | 18.8 | 3.15 | 0.40 | 14.5 |
| 200 | 3.19 | 0.27 | 18.4 | 3.20 | 0.40 | 13.4 |
As mentioned above, the anisotropy decay curves of eGFP A206K (Fig. 6(b)) and eYFP A206K (Fig. 6(d)) are nearly identical across all concentrations. The determined r(0) values of approximately 0.4 (Table 1) indicate that the TDMs for absorption and fluorescence are parallel, indicating that the excited molecules fluoresce without any dynamics.
Furthermore, the observed decay time constants (τobs ≈ 16 ns) at concentrations up to 10 µM are the typical rotational correlation time reported for FP monomers.25,50,51 These results confirm that both eGFP A206K and eYFP A206K exist solely as monomers at these concentrations. At 100 and 200 µM, the decay time constants decrease slightly. This additional depolarization can be attributed to intermolecular homo-FRET between monomers.25
The average distance d between fluorophores is calculated using 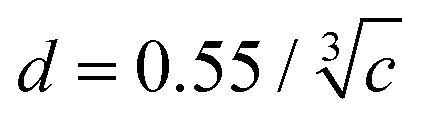 , where c is the concentration.52 The d values were calculated as 12 nm at 100 µM and 9 nm at 200 µM. The diffusion distance Δr of eYFP in the excited state was estimated to be 1.3 nm, calculated by (Δr)2 = 6Dτ,16 where D is the translational diffusion constant and D = 8.7 × 10⁻⁷ cm2 s−1 for GFP S65T53 and τ is the fluorescence lifetime. Since the diffusion distance is significantly shorter than the average distance, there should be no encounters between the fluorescent proteins during the excited-state lifetime.
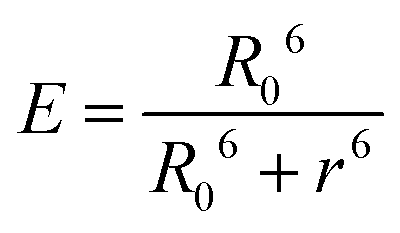
Nevertheless, intermolecular homo-FRET can occur without collisional encounters. Assuming a random orientation of the donor and acceptor (the orientation factor κ2 = 2/3), the Förster distance R0 (the distance at which energy transfer efficiency is 50%) is 4.5 nm for eYFP25 and 4.1 nm for eGFP.16 Furthermore, the energy transfer efficiency E as a function of the donor–acceptor distance r is given by the following equation:16
 | (8) |
Similarly, the anisotropy behavior for eGFP up to 10 µM and eYFP up to 1 µM is typical of that for a monomer. However, the r(0) values decrease at higher concentrations, indicating a depolarization process faster than the 20-ps time resolution of the apparatus. The decrease can be assigned to intra-dimer homo-FRET within a dimer, as previously reported for eYFP,25,29 and indicates the dimer formation. Previously, femtosecond transient absorption measurements of eYFP at 190 µM revealed that the anisotropy decreases from 0.4 to 0.28 with a time constant of 2.2 ps.29 The depolarization is due to intra-dimer homo-FRET, an excited-state equilibration process between two identical chromophores, and the rate constant, kFRET, is (1.1 ps)−1.29,54 The decrease in r(0) observed for eGFP at 100 and 200 µM confirms that eGFP also forms dimers, although corresponding ultrafast data for eGFP are currently unavailable. The more pronounced decrease in r(0) observed for eYFP compared to eGFP indicates a more significant contribution of the dimer in eYFP.
For the A206K mutants, the τobs values at 200 µM (14.4 ns for eGFP A206K and 13.4 ns for eYFP A206K) are shorter than those at 0.2 µM (17.3 ns for eGFP A206K and 16.5 ns for eYFP A206K), representing an approximately 20% acceleration. Interestingly, the τobs value for eYFP increases slightly from 17.3 ns at 0.2 µM to 18.4 ns at 200 µM, suggesting the contribution of rotational diffusion of the dimers. However, based on the Kd of 20 µM determined by AUC, eYFP predominantly exists as dimers at 200 µM. Assuming that the rotational correlation time of a dimer is roughly double that of a monomer according to the Stokes–Einstein–Debye equation,16,17 the observed τobs of 18.4 ns is notably faster than anticipated, even when accounting for the ∼20% acceleration by intermolecular FRET. This suggests additional fast depolarization processes unique to FPs that tend to form dimers. One plausible mechanism is “cascade FRET”: intermolecular FRET to a dimer immediately triggers ultra-fast intra-dimer homo-FRET. This instantaneously delocalizes the excitation energy over two chromophores, amplifying the depolarization effect. Alternatively, local fluctuation of the chromophore within the dimer might contribute to depolarization. The nature of the dimer-mediated accelerated depolarization process will be clarified in future studies.
Because intra-dimer homo-FRET is extremely fast, the process is effectively completed within the time resolution of the present measurements. The subsequent time-dependent anisotropy decay curve reflects the rotational diffusion of monomeric and dimeric species, intermolecular homo-FRET, and the aforementioned unidentified depolarization processes. Ideally, the decay curve should be analyzed using a sum of two exponential functions to account for contributions from the monomer and dimer. However, the model was overparameterized, making it difficult to determine the individual parameters with high precision. Consequently, we have used the single-exponential function (eqn (7)). Crucially, the concentration-dependent decrease in r(0) provides robust information on the dimer fraction and the relative orientation of the two chromophores within the dimer.
Characterization of the behavior of eGFP and eYFP homodimers
The observed anisotropy decay curves for eGFP (≥100 µM) and eYFP (≥10 µM) consist of a superposition of contributions of monomers and dimers. To characterize the behavior of the dimer species, anisotropy measurements were performed at higher concentrations (Fig. 7(a) and (b) and Fig. S28–S33 (SI)). Although the temporal evolutions of the anisotropy decay curves at concentrations of 500 µM or higher are affected by reabsorption, the initial anisotropy r(0) remains unaffected (eqn (S2), SI). The r(0) value decreases with increasing concentration and eventually converges to a constant value (Fig. 7(c)). This convergence suggests that higher-order oligomers, such as tetramers or octamers, do not significantly contribute to the anisotropy signals, even if they form in solution. Furthermore, the r(0) values for eGFP A206K and eYFP A206K remain near 0.4 even at high concentrations (Fig. S34, SI). The results indicate that any other oligomeric species do not contribute to the observed decay signals. Consequently, the observed decrease in r(0) can be explained solely by dimers mediated by Ala206. | ||
| Fig. 7 Fluorescence anisotropy decay curves of (a) eGFP (0.2 to 4350 µM) and (b) eYFP (0.2 to 2000 µM) (PBS, pH 7.4). (c) Concentration dependence of the anisotropy value at time zero r(0) for eGFP and eYFP. The dotted lines represent the fits obtained using the monomer–dimer equilibrium model (eqn (9)). The excitation and emission wavelengths are the same as those described in Fig. 6. | ||
Also, the dissociation constant Kd was determined by the concentration-dependent r(0) value. The observed r(0) is expressed using the fractions of monomers and dimers as follows:
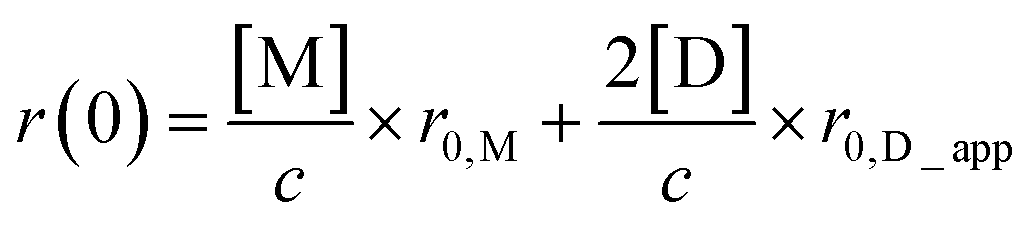 | (9) |
Furthermore, the angle θ between the absorption and emission TDMs of the two chromophores within the dimer was calculated using the r0,D_app values. Because intra-dimer homo-FRET in eGFP and eYFP is extremely fast ((1.1 ps)−1 for eYFP), the excitation energy reaches an equilibrium between the two identical chromophores within the 20-ps time resolution of the streak camera. Under these conditions, depolarization due to the nanosecond-scale rotational diffusion of the protein is negligible at time zero. Consequently, the r0,D_app value is equivalent to r∞, where r∞ is the anisotropy when the excited-state population equilibration is completed through intra-dimer homo-FRET. In this case, r∞ is expressed as follows:29,54
 | (10) |
 | (11) |
We considered two possible origins for the distinct θ values of 32° for eGFP and 49° for eYFP: (1) a difference in the quaternary structures of the dimers, or (2) a difference in the orientation of the TDMs within the chromophores. As a general basis for this discussion, the following points are clear. The r(0) value of approximately 0.4 for monomers indicates that the absorption and emission TDMs are parallel for both eGFP and eYFP. In eGFP, the TDM is oriented along the long axis of the chromophore,28 however, no experimental data are available for eYFP or other YFPs. Superimposition of the crystal structures aligned by α-carbon atoms of eGFP and YFP shows that the position of the chromophore within the β-barrel is remarkably similar between eGFP and YFP (Fig. S35, SI). The similarity is likely applicable to eYFP as well.
Assuming that this internal orientation is conserved, the first possibility is that the quaternary structures of the dimers, specifically the relative orientation of the two β-barrels, differ between eGFP and eYFP. This would represent a novel insight, as the dimer structures of FPs from the jellyfish Aequorea victoria are considered to be similar to the crystal structure of Aequorea victoria GFP.56 In the crystal structure, Ala206 is located at the dimer interface.56
Alternatively, the second possibility challenges this assumption: the orientation of the TDM might differ between eGFP and eYFP. Specifically, in eYFP, the π–π stacking between the chromophore and the phenol group of Tyr203 might alter the orientation of the TDM relative to the β-barrel. If such an alteration occurs, θ between the two TDMs within the homodimer would differ between eGFP and eYFP, even if their quaternary structures and the positions of the chromophore within the β-barrel remain the same.
To investigate the second possibility that the π–π stacking alters the orientation of the TDM, we prepared eYFP Y203T. As illustrated in Fig. S36(b) (SI), the anisotropy decay curves for eYFP Y203T are nearly identical to those of eYFP at concentrations of 10 µM and 200 µM. As previously discussed, dimerization occurs at both 10 µM and 200 µM. The agreement in the anisotropy decay curves indicates that both the dimerization affinity and the resulting quaternary structure are essentially the same in eYFP Y203T as in eYFP. If the π–π stacking were to alter the orientation of the TDM, the anisotropy signals of the dimer would change, resulting in distinct decay curves. These results strongly suggest that the orientation of the TDM relative to the β-barrel remains unchanged by the presence or absence of π–π stacking. It is highly improbable that the orientation of the TDMs and the quaternary structure would change simultaneously in a way that perfectly cancels out any overall change in the anisotropy signal. Therefore, these results indicate that the π–π stacking does not alter the orientation of the TDM. Instead, the results strongly suggest that the observed difference in θ between eGFP and eYFP is attributable to the distinct quaternary structures in the eGFP and eYFP homodimers. We are currently investigating eGFP and eYFP using small-angle X-ray scattering (SAXS) in order to determine the quaternary structure in solution. SAXS measurements would provide direct information on whether the dimer structures differ between eGFP and eYFP.
According to the crystal structure of Aequorea victoria GFP,56 Ala206, together with Leu221 and Phe223, is located at the dimer interface.4 Mutations of these hydrophobic residues to charged hydrophilic residues, such as A206K, L221K, and F223R, have been reported to increase the dissociation constant, with A206K showing the most pronounced effect.15 These observations indicate that hydrophobic interactions around Ala206 play an important role in dimerization.
However, the different dimerization properties of eGFP and eYFP cannot be explained simply by changes in surface hydrophobic residues. Four of the five residues that differ between eGFP (Leu64/Thr65/Val68/Ser72) and eYFP (Phe64/Gly65/Leu68/Ala72) are located on the central α-helix and are buried within the β-barrel, while the 203rd residue faces the chromophore inside the barrel. As shown in Fig. S35 (SI), the chromophore in YFP is shifted more toward the barrel surface than in eGFP. The negatively charged phenolic group of the chromophore is therefore positioned closer to the Ala206-mediated dimer interface. This structural difference could modify the electrostatic or local structural environment at the interface, thereby contributing to the different dimerization affinities and relative orientations of eGFP and eYFP homodimers.
Highly efficient intra-dimer FRET of FPs
As discussed above, intra-dimer homo-FRET is phenomenologically instantaneous in both eGFP and eYFP. This behavior is remarkably similar to the hetero-FRET dynamics observed in YC3.60.19 Our previous study demonstrated that YC3.60 exhibits structural heterogeneity and exists in at least three distinct conformations in the presence of calcium ions. The predominant conformation involves the formation of a tight dimer between eCFP and Venus. In this conformation, the excitation of eCFP results in an anisotropy r(0) value of 0.02 for Venus, which indicates intra-dimer hetero-FRET with θ of 53° between eCFP and Venus. The 28 ps decay component observed in a minor conformation suggests an inefficient FRET arising from non-optimal distance and/or relative orientation. The high performance of YC3.60 as a calcium indicator can be largely attributed to the predominance of the tight dimer formation of eCFP and Venus. These findings suggest that the dimer affinity is more critical than the relative orientation of the TDMs for ensuring efficient FRET.Oligomerization facilitates highly efficient FRET not only in FPs from the jellyfish Aequorea victoria but also those derived from coral. One of the authors previously reported the ultrafast dynamics of the photoconvertible fluorescent protein Kaede from the stony coral Trachyphyllia geoffroyi,57 which forms stable tetramers. In the photoconverted red form of Kaede, hetero-FRET from the neutral species to the anionic species within the tetramer occurs with a time constant of 13 ps. Considering these similarities, it might be a universal property that intra-dimer and intra-tetramer FRET in FPs proceeds with high efficiency.
Conclusions
In this study, we quantitatively characterized the dimerization properties of eGFP and eYFP from the jellyfish Aequorea victoria, which differ by only five amino acid residues. Using size-exclusion chromatography, analytical ultracentrifugation, and time-resolved fluorescence anisotropy, we demonstrated that both FPs exist in a monomer–dimer equilibrium in solution but exhibit significantly different affinities. Concentration-dependent anisotropy measurements allowed us to independently determine the dissociation constants to be 740 µM for eGFP and 36 µM for eYFP, proving that this method is effective for FPs with low affinity. Furthermore, by analyzing the ultrafast intra-dimer homo-FRET, we successfully determined the transition dipole moment angles within the homodimers to be 32° for eGFP and 49° for eYFP. These findings clearly demonstrate that subtle sequence variations are sufficient to induce significant changes in both dimerization affinity and relative orientation (quaternary structure). Ultimately, determining the dimerization affinities, relative orientations, and the residues that regulate them for typical FRET pairs will enable the rational design of sensors. The elucidation of the photophysical properties of FPs would accelerate the investigation of biological phenomena through precise fluorescence imaging.Author contributions
Y. K.: investigation (absorption, steady-state and time-resolved fluorescence, and AUC measurements), formal analysis, and writing– original draft. Y. N.: investigation (SEC measurements), formal analysis, and writing – review & editing. M. T.: validation and writing – review & editing. H. H.: conceptualization, supervision, funding acquisition, methodology, and writing – original draft & editing.Conflicts of interest
There are no conflicts to declare.Data availability
All relevant data supporting the findings of this study are included within the article and its supplementary information (SI) files. Supplementary information: supplementary figures; amino acid sequences; the typical fluorescence decay signals for the anisotropy measurements; the sedimentation equilibrium experiments; the effect of reabsorption on anisotropy at higher concentrations; pH dependence of fluorescence anisotropy curves of eGFP and eYFP; observed and calculated fluorescence anisotropy curves; fluorescence anisotropy decay curves of eGFP A206K and eYFP A206K at high concentrations; superimposition of the crystal structures of eGFP and YFP; effect of 203rd residue on dimerization behavior of eYFP; references. See DOI: https://doi.org/10.1039/d6cp01098a.Acknowledgements
We thank Dr Satoshi Shimozono and Prof. Atsushi Miyawaki (RIKEN Center for Brain Science) for providing the eGFP and eYFP plasmids. We thank Ms Takako Kogure, Dr Ryoko Ando, and Prof. Atsushi Miyawaki (RIKEN Center for Brain Science) for their assistance with AUC experiments. We also thank RIKEN Research Resource Division (RRD) for sequencing the plasmids of eGFP A206K and eYFP Y203T. We are grateful to Prof. Satoshi Takeuchi (University of Hyogo) for valuable discussions regarding reabsorption effects. This work was supported by JSPS KAKENHI Grant Number JP22K05027 (to H. H.) and a Sasakawa Scientific Research Grant (to Y. K.).References
- O. Shimomura, F. H. Johnson and Y. Saiga, J. Cell. Comp. Physiol., 1962, 59, 223–239 Search PubMed.
- D. C. Prasher, V. K. Eckenrode, W. W. Ward, F. G. Prendergast and M. J. Cormier, Gene, 1992, 111, 229–233 Search PubMed.
- M. Chalfie, Y. Tu, G. Euskirchen, W. Ward and D. Prasher, Science, 1994, 263, 802–805 Search PubMed.
- R. Y. Tsien, Annu. Rev. Biochem., 1998, 67, 509–544 Search PubMed.
- M. Zimmer, Chem. Rev., 2002, 102, 759–782 CrossRef CAS PubMed.
- A. Miyawaki, Annu. Rev. Biochem., 2011, 80, 357–373 CrossRef CAS PubMed.
- A. Miyawaki and Y. Niino, Mol. Cell, 2015, 58, 632–643 CrossRef CAS PubMed.
- E. A. Rodriguez, R. E. Campbell, J. Y. Lin, M. Z. Lin, A. Miyawaki, A. E. Palmer, X. Shu, J. Zhang and R. Y. Tsien, Trends Biochem. Sci., 2017, 42, 111–129 CrossRef CAS PubMed.
- S. Duwé and P. Dedecker, Curr. Opin. Struct. Biol., 2019, 58, 183–191 CrossRef PubMed.
- D. M. Shcherbakova, O. V. Stepanenko, K. K. Turoverov and V. V. Verkhusha, Trends Biotechnol., 2018, 36, 1230–1243 CrossRef CAS PubMed.
- N. Soleja, O. Manzoor, I. Khan, A. Ahmad and M. Mohsin, J. Biosci., 2018, 43, 763–784 Search PubMed.
- P. Dedecker, F. C. De Schryver and J. Hofkens, J. Am. Chem. Soc., 2013, 135, 2387–2402 Search PubMed.
- P. J. Cranfill, B. R. Sell, M. A. Baird, J. R. Allen, Z. Lavagnino, H. M. de Gruiter, G.-J. Kremers, M. W. Davidson, A. Ustione and D. W. Piston, Nat. Methods, 2016, 13, 557–562 CrossRef CAS PubMed.
- S. Segami, S. Makino, A. Miyake, M. Asaoka and M. Maeshima, Plant Cell, 2014, 26, 3416–3434 Search PubMed.
- D. A. Zacharias, J. D. Violin, A. C. Newton and R. Y. Tsien, Science, 2002, 296, 913–916 Search PubMed.
- J. R. Lakowicz, Principles of Fluorescence Spectroscopy, Springer, New York, 2006 Search PubMed.
- B. Valeur and M. N. Berberan-Santos, in Molecular Fluorescence: Principles and Applications, Wiley-VCH, Weinheim, 2012, ch. 8, pp. 213–261 Search PubMed.
- T. Nagai, S. Yamada, T. Tominaga, M. Ichikawa and A. Miyawaki, Proc. Natl. Acad. Sci. U. S. A., 2004, 101, 10554–10559 CrossRef CAS PubMed.
- H. Tsubota, Y. Kinoshita, M. Shigeno and H. Hosoi, J. Phys. Chem. B, 2023, 127, 3839–3850 CrossRef CAS PubMed.
- M. D. Allen and J. Zhang, Biochem. Biophys. Res. Commun., 2006, 348, 716–721 Search PubMed.
- L. Lindenburg and M. Merkx, Sensors, 2014, 14, 11691–11713 Search PubMed.
- H. Shweta, K. Gupta, Y. Zhou, X. Cui, S. Li, Z. Lu, Y. E. Goldman and J. A. Dantzig, Biophys. J., 2025, 124, 2133–2149 Search PubMed.
- X. X. Zhou, H. K. Chung, A. J. Lam and M. Z. Lin, Science, 2012, 338, 810–814 Search PubMed.
- G. N. Phillips Jr, Curr. Opin. Struct. Biol., 1997, 7, 821–827 CrossRef CAS PubMed.
- H. Tsubota, A. Takayama, Y. Takeda, N. Yamada and H. Hosoi, J. Phys. Chem. B, 2021, 125, 7997–8009 Search PubMed.
- L. M. Costantini, M. Fossati, M. Francolini and E. L. Snapp, Traffic, 2012, 13, 643–649 CrossRef CAS PubMed.
- F. I. Rosell and S. G. Boxer, Biochemistry, 2003, 42, 177–183 CrossRef CAS PubMed.
- J. Myšková, O. Rybakova, J. Brynda, P. Khoroshyy, A. Bondar and J. Lazar, Proc. Natl. Acad. Sci. U. S. A., 2020, 117, 32395–32401 CrossRef.
- G. Jung, Y. Ma, B. S. Prall and G. R. Fleming, ChemPhysChem., 2005, 6, 1628–1632 CrossRef CAS PubMed.
- D. L. Winters, J. M. Autry, B. Svensson and D. D. Thomas, Biochemistry, 2008, 47, 4246–4256 CrossRef CAS PubMed.
- T. Ansbacher, H. K. Srivastava, T. Stein, R. Baer, M. Merkx and A. Shurki, Phys. Chem. Chem. Phys., 2012, 14, 4109–4117 RSC.
- W. B. Frommer, M. W. Davidson and R. E. Campbell, Chem. Soc. Rev., 2009, 38, 2833–2841 RSC.
- R. Heim, A. B. Cubitt and R. Y. Tsien, Nature, 1995, 373, 663–664 CrossRef CAS PubMed.
- A. Royant and M. Noirclerc-Savoye, J. Struct. Biol., 2011, 174, 385–390 CrossRef CAS PubMed.
- Y. Kinoshita, M. Shigeno, K. Ishino, H. Minato, N. Yamada and H. Hosoi, J. Phys. Chem. B, 2024, 128, 9061–9073 CrossRef CAS PubMed.
- R. M. Wachter, M. A. Elsliger, K. Kallio, G. T. Hanson and S. J. Remington, Structure, 1998, 6, 1267–1277 CrossRef CAS PubMed.
- J. Schwarz, H. J. Leopold, R. Leighton, R. C. Miller, C. P. Aplin, A. J. Boersma, A. A. Heikal and E. D. Sheets, Methods Appl. Fluoresc., 2019, 7, 025002 Search PubMed.
- M. Currie, H. Leopold, J. Schwarz, A. J. Boersma, E. D. Sheets and A. A. Heikal, J. Phys. Chem. B, 2017, 121, 5688–5698 CrossRef CAS PubMed.
- S. V. Koushik, H. Chen, C. Thaler, H. L. Puhl and S. S. Vogel, Biophys. J., 2006, 91, L99–L101 CrossRef CAS PubMed.
- T. A. Nguyen, H. L. Puhl, K. Hines, D. J. Liput and S. S. Vogel, Nat. Commun., 2022, 13, 6335 CrossRef CAS PubMed.
- Y. Teijeiro-Gonzalez, A. Crnjar, A. J. Beavil, R. L. Beavil, J. Nedbal, A. Le Marois, C. Molteni and K. Suhling, Biophys. J., 2021, 120, 254–269 CrossRef CAS PubMed.
- T. A. Nguyen, P. Sarkar, J. V. Veetil, S. V. Koushik and S. S. Vogel, PLoS One, 2012, 7, e38209 CrossRef CAS PubMed.
- Y. Kim, H. L. Puhl, E. Chen, G. H. Taumoefolau, T. A. Nguyen, D. S. Kliger, P. S. Blank and S. S. Vogel, Biophys. J., 2019, 116, 1918–1930 CrossRef CAS PubMed.
- S. Vogel, T. Nguyen, P. Blank and B. Meer, Springer Series in Chemical Physics, 2015, 385–406 Search PubMed.
- S. S. Vogel, C. Thaler, P. S. Blank and S. V. Koushik, Time-Resolved Fluorescence Anisotropy, Taylor & Francis Group, New York, 2009 Search PubMed.
- H. Hosoi, S. Hazama and Y. Takeda, Chem. Phys. Lett., 2015, 618, 186–191 CrossRef CAS.
- K. Shibata, Y. Nakasone and M. Terazima, J. Phys. Chem. B, 2022, 126, 1024–1033 Search PubMed.
- D. K. McRorie and P. J. Voelker, Self-associating systems in the analytical ultracentrifuge, Beckman Instruments, Inc., Fullerton, CA, 1993 Search PubMed.
- T. M. Laue and W. F. Stafford III, Annu. Rev. Biophys. Biomol. Struct., 1999, 28, 75–100 CrossRef CAS PubMed.
- J. Borst, M. Hink, A. van Hoek and A. W. G. Visser, J. Fluoresc., 2005, 15, 153–160 CrossRef CAS PubMed.
- K. Suhling, D. Davis and D. Phillips, J. Fluoresc., 2002, 12, 91–95 CrossRef CAS.
- S. Chandrasekhar, Rev. Mod. Phys., 1943, 15, 1–89 CrossRef.
- R. Swaminathan, C. P. Hoang and A. S. Verkman, Biophys. J., 1997, 72, 1900–1907 CrossRef CAS PubMed.
- R. S. Moog, A. Kuki, M. D. Fayer and S. G. Boxer, Biochemistry, 1984, 23, 1564–1571 CrossRef CAS PubMed.
- T. Nagai, K. Ibata, E. S. Park, M. Kubota, K. Mikoshiba and A. Miyawaki, Nat. Biotechnol., 2002, 20, 87–90 CrossRef CAS PubMed.
- F. Yang, L. G. Moss and G. N. Phillips, Jr., Nat. Biotechnol., 1996, 14, 1246–1251 CrossRef CAS PubMed.
- H. Hosoi, H. Mizuno, A. Miyawaki and T. Tahara, J. Phys. Chem. B, 2006, 110, 22853–22860 CrossRef CAS PubMed.
| This journal is © the Owner Societies 2026 |