
 Open Access Article
 This Open Access Article is licensed under a
 Creative Commons Attribution 3.0 Unported Licence
Systematic workflow for crystallization process design for a polymorphic system: an experimental case study of imatinib mesylate
Hemalatha
Kilari†
 ,
Ilke
Akturk†
,
Attila Tamas
Csathy
,
Murat Ekin
Agca
,
Urvi
Mathur
and
Zoltan K.
Nagy
*
,
Ilke
Akturk†
,
Attila Tamas
Csathy
,
Murat Ekin
Agca
,
Urvi
Mathur
and
Zoltan K.
Nagy
*
Davidson School of Chemical Engineering, Purdue University, 610 Purdue Mall, West Lafayette 47907, USA. E-mail: zknagy@purdue.edu
First published on 23rd December 2025
Abstract
Crystallization plays a vital role in pharmaceutical manufacturing by defining critical quality attributes such as purity, particle size, and polymorphic form. With the growing adoption of continuous manufacturing (CM) and increasing regulatory emphasis on process understanding, there is a clear need for systematic workflows that can ensure robust and reproducible crystallization outcomes. In this study, we develop and demonstrate a structured workflow for crystallization process design using imatinib mesylate, a high-value oncology drug that exists in two polymorphic forms. The approach integrates advanced process analytical technology (PAT) tools and offline characterization methods to characterize crystal properties, track phase transitions, and monitor process performance. A kinetically informed thermodynamic (KIT) design procedure is implemented through small-scale experiments to rank potential solvents not only by yield and polymorph control, but also by incorporating critical kinetic factors. Batch crystallization studies were used to identify key parameters influencing polymorph formation, which informed the design of a continuous crystallization process. The resulting process reproducibly produced the desired stable form, offering advantages in downstream handling and product quality. This case study illustrates how a stepwise, data-driven workflow can support polymorph selection and control, while enabling consistent performance in both batch and continuous crystallization systems. The proposed methodology contributes to the broader goals of modern pharmaceutical manufacturing, supporting quality-by-design (QbD) and continuous processing initiatives aligned with regulatory expectations.
1. Introduction
Crystallization is a fundamental separation and purification technique in pharmaceutical manufacturing, particularly for the isolation of active pharmaceutical ingredients (APIs).1 As the final step in drug substance manufacturing, crystallization governs critical quality attributes (CQAs) such as purity, polymorphic form, particle size distribution, and downstream processability. The control of these attributes is essential to ensure the efficacy, stability, and manufacturability of pharmaceutical compounds. The significance of crystallization process design becomes even more evident as considering its impact on both upstream and downstream operations within an end-to-end drug manufacturing system. Traditional batch crystallization has been widely used in the industry; however, increasing regulatory guidelines for enhanced process understanding and incentives for end-to-end continuous manufacturing have driven interest in transitioning to continuous crystallization.2 Since 2004, the U.S. Food and Drug Administration (FDA), International Council for Harmonization (ICH), and European Medicines Agency (EMA) have issued guidelines promoting process analytical technology (PAT) and continuous manufacturing (CM), with the FDA recognizing CM as a key tool for modernizing the pharmaceutical industry.3 This shift from centralized batch processes to small-scale, distributed, continuous systems holds promise, especially in times such as the pandemic or for specialized APIs such as orphan drugs. Continuous crystallization offers several advantages over batch processes, including higher throughput, eliminating batch-to-batch variation, a smaller equipment footprint, on-demand production, and built-in monitoring and control using PAT, all while minimizing human exposure.4,5 In this study, we aim to develop a systematic crystallization design workflow to enable successful continuous crystallization with a case study on a low-volume, high-value oncology drug.The compound investigated in this study, imatinib mesylate (Fig. 1), is a well-known API used in targeted cancer therapy. Chemically designated as 4-[(4-methylpiperazin-1-yl)methyl]-N-[4-methyl-3-[(4-pyridin-3-ylpyrimidin-2-yl)amino]-phenyl]benzamide methanesulfonic acid, imatinib mesylate was originally developed by Novartis and commercialized under the brand name Gleevec or Glivec. The drug was approved by FDA in 2001.6 As a protein tyrosine kinase inhibitor (TKI), it has demonstrated exceptional therapeutic efficacy in treating Philadelphia chromosome-positive chronic myelogenous leukemia (CML) and metastatic malignant gastrointestinal stromal tumors (GISTs). The success of imatinib has been transformative, converting what was once a fatal cancer into a manageable condition. However, some CML patients eventually developed resistance to imatinib, leading to the development of second-generation drugs like dasatinib and nilotinib.7 In addition, recent studies have explored repurposing imatinib mesylate, demonstrating its potential to enhance anti-malarial treatment efficacy by accelerating parasite clearance and reducing fever in chloroquine-resistant cases. These findings require further investigation of TKIs for drug-resistant malaria.8,9 Additionally, Ghosh et al. showed that imatinib has structural features that can be utilized in designing potent HIV-1 protease inhibitors.10 These inhibitors, incorporating imatinib-like heterocyclic ligands, showed strong enzyme binding, high antiviral activity, and potential for further optimization based on X-ray structural studies. These emerging treatment areas highlight the evolving potential of imatinib, reinforcing the case for more personalized therapies and driving demand for agile and smaller-scale manufacturing approaches.
 | ||
| Fig. 1 Chemical structure of imatinib mesylate. | ||
Polymorphism is the ability of a molecule to exist in multiple crystalline forms while remaining chemically identical. It significantly influences key drug properties, including solubility, dissolution rate, bioavailability, and stability. Each polymorph exhibits distinct properties, affecting filtration, flowability, compaction, bioavailability, and therapeutic dosage. The presence of multiple polymorphs in a drug substance can pose manufacturing challenges, as failure to control polymorphic forms may lead to inconsistent drug performance, regulatory issues, and financial or reputational risks for pharmaceutical companies. Therefore, understanding and managing polymorphism is crucial to ensure the quality and performance of pharmaceutical products.11 The metastable polymorph typically exhibits higher solubility and Gibbs free energy compared to its stable form.12,13 The difference in Gibbs energy drives the transformation from the metastable to the stable polymorphic form, which can occur through two primary mechanisms: solid-state polymorphic transformation (SST) and solvent-mediated polymorphic transformation (SMPT).14 Li et al. broadly define SMPT as a transformation of one solid form into another facilitated by solvent interaction, focusing specifically on the nucleation and growth dynamics of the stable polymorph.15 Kshirsagar et al. applied a five-step mechanism for SMPT, emphasizing secondary nucleation and growth of the stable polymorph, along with primary nucleation, growth, and dissolution of the metastable form for ortho-aminobenzoic acid (OABA) via combined cooling and antisolvent crystallization (CCAC).11 O'Mahony et al. investigated the SMPT of carbamazepine and piracetam, demonstrating that in both cases, transformation is controlled by the growth of the stable polymorph. This study identified rate-determining steps of SMPT by integrating solution and solid-phase data, classifying transformations into four principal mechanistic scenarios and providing deeper insight into polymorphic transformation mechanisms.16
Imatinib mesylate is known to form multiple polymorphs and the choice of solvent plays a major role in determining which form crystallizes. Several patents explored this by using different solvents and methods along with imatinib free base and methanesulfonic acid. The original Zimmermann patent described the needle-shaped α and cubic β forms using non-alcoholic and polar solvents like ketones.17 Later patents reported different forms, co-crystals, or modified versions of these forms:18,19 α-2 with isopropanol,20 H1 with chlorinated solvents,21 a non-hygroscopic α-form using alcohols or ketones,22 and a non-needle α-form.23 Other examples include, polymorphs I and II from chloroform and water,24 the δ-form from acetone and water, and the ε-form from ethyl acetate and ethanol.25 These studies demonstrate that the choice of solvent plays a critical role in determining the resulting polymorph and underscore the need for robust crystallization process development for consistency.26
Besides, the multiple crystalline forms identified by various patents, imatinib mesylate exists in two primary polymorphs as it is described by Zimmermann:17 the α-form is metastable at room temperature and exhibits needle-like morphology, making filtration and manufacturability more challenging compared to the stable form. However, its higher solubility in various solvents offers potential advantages in manufacturing. The β-form is more stable and has a cubic-shaped morphology, providing superior flowability, compaction, and filtration properties. Interestingly, both polymorphs are commercially available: the trademark drug Gleevec is the β-form, whereas generic formulations contain the α-form.18 This necessitates thorough examination of both polymorphs and underscores the importance of defining their experimental design spaces. The identification and characterization of polymorphic forms require a combination of advanced analytical techniques to differentiate between structural, thermal, and morphological differences. Powder X-ray diffraction (PXRD) is one of the most reliable methods for polymorph identification, producing characteristic diffraction patterns as fingerprints of different crystalline forms. Complementary to PXRD, Raman microscopy offers molecular-level insights by detecting vibrational differences between polymorphs, especially suitable for distinguishing structurally similar forms. Differential scanning calorimetry (DSC) provides thermal characterization by identifying melting points and heat flow differences that are associated with polymorphic transitions. Optical microscopy and scanning electron microscopy (SEM) allow for the examination of crystal habits and morphology. Additionally, in situ Raman spectroscopy enables real-time monitoring of polymorphic transformation during crystallization, offering a deeper understanding of phase transitions and stability.27 The integration of these techniques ensures comprehensive polymorph identification and consistency in pharmaceutical manufacturing. Wang et al. used in situ Raman probe to show that form I progesterone (thermodynamically stable) always forms after form II (kinetically favored), confirming a monotropic polymorphic system in accordance with Ostwald's law of stages and providing insights into processing parameters for controlling the morphology of progesterone.28 Ono et al. used Raman spectroscopy to monitor the SMPT of L-glutamic acid quantitatively, showing that the α-form fraction gradually decreases as it transforms into the stable β-form and the transformation rate is strongly dependent on the temperature.29 In addition to the use of in situ Raman probe in batch and semi-continuous crystallization setups in these examples, there have been successful demonstrations of selective polymorph production using continuous oscillatory baffled crystallizers (COBCs). Briggs et al. designed a continuously seeded cooling crystallization process for L-glutamic acid in a COBC, showing that maintaining bulk supersaturation between certain values can ensure either the formation of stable or metastable form nucleation.30 Kalakech et al. evaluated both inline Raman spectroscopy and the Blaze900 PAT probe, an inline imaging tool, to monitor the SMPT of paracetamol during seeded batch cooling crystallization. Raman spectroscopy was ultimately excluded due to high system variability in terms of particle size and solid content that overshadowed the polymorphic changes. The Blaze900 probe was used for real-time monitoring of system evolution, with counts and CLD measurements providing further insight into the form II SMPT.31
In this study, we investigate the batch and continuous crystallization of imatinib mesylate, focusing on identifying and targeting the polymorphic form through systematic crystallization process design. With advanced characterization techniques and real-time monitoring, we aim to enhance process understanding and establish a robust methodology for consistent production of the target polymorphic form. We conducted both isothermal unseeded transformation experiments and seeded cooling crystallization experiments with SMPT to achieve these goals at a small scale and lab scale. The design of experiments (DoE) covered different seed loading and cooling profiles. Following these batch experiments, we successfully produced β-form imatinib mesylate by conducting a continuous cooling crystallization experiment. The findings from this study contribute to the broader efforts of advancing continuous pharmaceutical manufacturing and improving process reliability in polymorphic crystallization systems.
2. Experimental section
2.1 Materials
Imatinib methane sulfonate or imatinib mesylate with CAS [220127-57-1] has been procured from AK Science and is 98% pure by HPLC. All solvents i.e. used in the study i.e. heptane, toluene, ethyl acetate, acetonitrile, 2-butanone, 1-propanol, 2-propanol, ethanol, methanol and water were procured from Thermo Fisher Scientific or VWR scientific at 99.9% HPLC grade. Imatinib methanesulfonate was purchased as a raw material AK Science. PXRD analysis confirmed that the raw material was in metastable form. The β-form of imatinib mesylate was obtained by dissolving the α-form in methanol at 40 °C followed by 2-propanol (IPA) addition. The mixture was then cooled 20 °C, stirred at 293.15 K for 24 hours and as a result the compound was recrystallized. After filtration, the precipitate was dried under vacuum in a desiccator at room temperature for a week. PXRD analysis confirmed that imatinib mesylate had successfully recrystallized into the β-form, which was subsequently used in solubility studies.2.2 Characterization
A combination of offline and online characterization techniques was employed to analyze and confirm solid-state properties of imatinib mesylate, supporting solid form selection for crystallization process development. PXRD analysis confirmed that the raw material procured from the supplier was the metastable form. The stable-form of imatinib mesylate was obtained by dissolving the α-form in methanol at 40 °C followed by IPA addition. The mixture was then cooled 20 °C, stirred at 293.15 K for 24 hours and as a result the compound was recrystallized. After filtration, the precipitate was dried under vacuum in a desiccator at room temperature for a week. PXRD analysis confirmed that imatinib mesylate had successfully recrystallized into the β-form, which was subsequently used in other experimental studies including solubility.Molecular structure changes and crystallization events were monitored in real-time using Raman spectroscopy with a Mettler Toledo ReactRaman 802 L. Spectra were collected over an optical range of 100 to 3200 cm−1. Mettler Toledo EasyViewer 100 particle size analyzer was used for inline particle visualization and turbidity monitoring during crystallization.
2.3 Solubility studies
Technobis Crystalline platform and Velp Scientifica temperature regulated multi-vial magnetic stirring platform were used for mini-scale solubility studies of both polymorphic forms in various solvents. Both polymorphic forms of imatinib mesylate used for solubility studies were obtained following the procedure described in section 2.1 and characterized (section 2.2 & 3.1.1). Solubility determination was usually performed using the Crystalline platform, which typically follows a polythermal method involving linear heating–cooling cycles with varying cooling rates to determine the clear and cloud points, thereby establishing the solubility and metastable zone width. However, this standard method proved unsuitable for the metastable α-form, as it readily transforms into the stable β-form during the dissolution or thermal cycling process depending on the transformation kinetics. The transformation rate is strongly influenced by the solvent; therefore, before solubility measurement, the relative transformation time in each solvent was experimentally determined (discussed in section 3.1.3, under subsection “solvent-mediated transformation”). Hence, in Crystalline, the solubility for the metastable form was determined quickly by the clear point during dissolution, which was timed before the phase transformation monitored by the non-contact Raman probe connected to one of the reactors in the Crystalline (refer Fig. S1).For initial solubility screening of the metastable α-form at room temperature and at 40 °C (section 3.1.2), experiments were conducted using a Velp Scientifica magnetic stirring platform equipped with a temperature regulator. A measured volume of solvent was equilibrated to the desired temperature, followed by the stepwise addition of the solute until turbidity appeared, indicating saturation (for example, starting with 5 mg and increasing in 5 mg steps). This procedure was iterative since turbidity could also arise from phase transformation rather than excess solute. In such cases, the experiment was discarded and repeated with modified solute increments so as to quickly dissolve before phase transformation. The dissolution and equilibration period was restricted to 20 minutes for all α-form samples to minimize transformation.
For the stable β-form, an excess amount of solute was added to the solvent, and the suspension was equilibrated for 2 hours. The supernatant was then filtered and analyzed either by UPLC or gravimetry. For gravimetric determination, a known volume of the filtrate was dried in an oven for 48 hours, and the solid residue was weighed to calculate the solubility.
Following this initial screening, for accurate measurement of solubility in chosen solvent or antisolvent, EasyMax was used with the 100 mL glass vessel. The small-scale solubility measurements provided preliminary data that guided and validated subsequent laboratory-scale EasyMax experiments. A known amount of solvent was added and dissolved quickly until the solution turned turbid. Samples were taken out with syringes and filtered using syringe filters to collect the clear sample for concentration measurement through UPLC or gravimetry. These experiments were also used for monitoring SMPT using in situ Raman probe and IR probe. Extensive solubility studies were conducted to fit solubility models for α and β-forms in pure solvent and solvent–antisolvent mixtures at temperatures between 0 °C to 50 °C. The details are discussed in the following sections 3.1 and 3.2.
2.4 Experimental setup for batch and continuous crystallization
Similar to the initial solubility studies, preliminary crystallization trials were conducted at a small scale using the Crystalline and Velp platforms to gain a qualitative understanding of crystallization kinetics. With this information, lab-scale batch crystallization experiments were conducted. Mettler Toledo EasyMax 402 Basic Thermostat System was used for solubility validation, batch and continuous crystallization experiments.The experimental setup for the batch crystallization studies consisted of a 100 mL reactor, and equipped with PAT tools for in situ monitoring, as illustrated in Fig. 2a. A series of batch experiments were conducted under various crystallization conditions. Isothermal holding experiments were performed at the same initial supersaturation level but with different final temperatures to observe the effect of temperature on polymorphic transformation. Additionally, a set of unseeded and seeded experiments were carried out using varying cooling rates and seed loadings to gain comprehensive information about the nucleation and growth mechanisms.
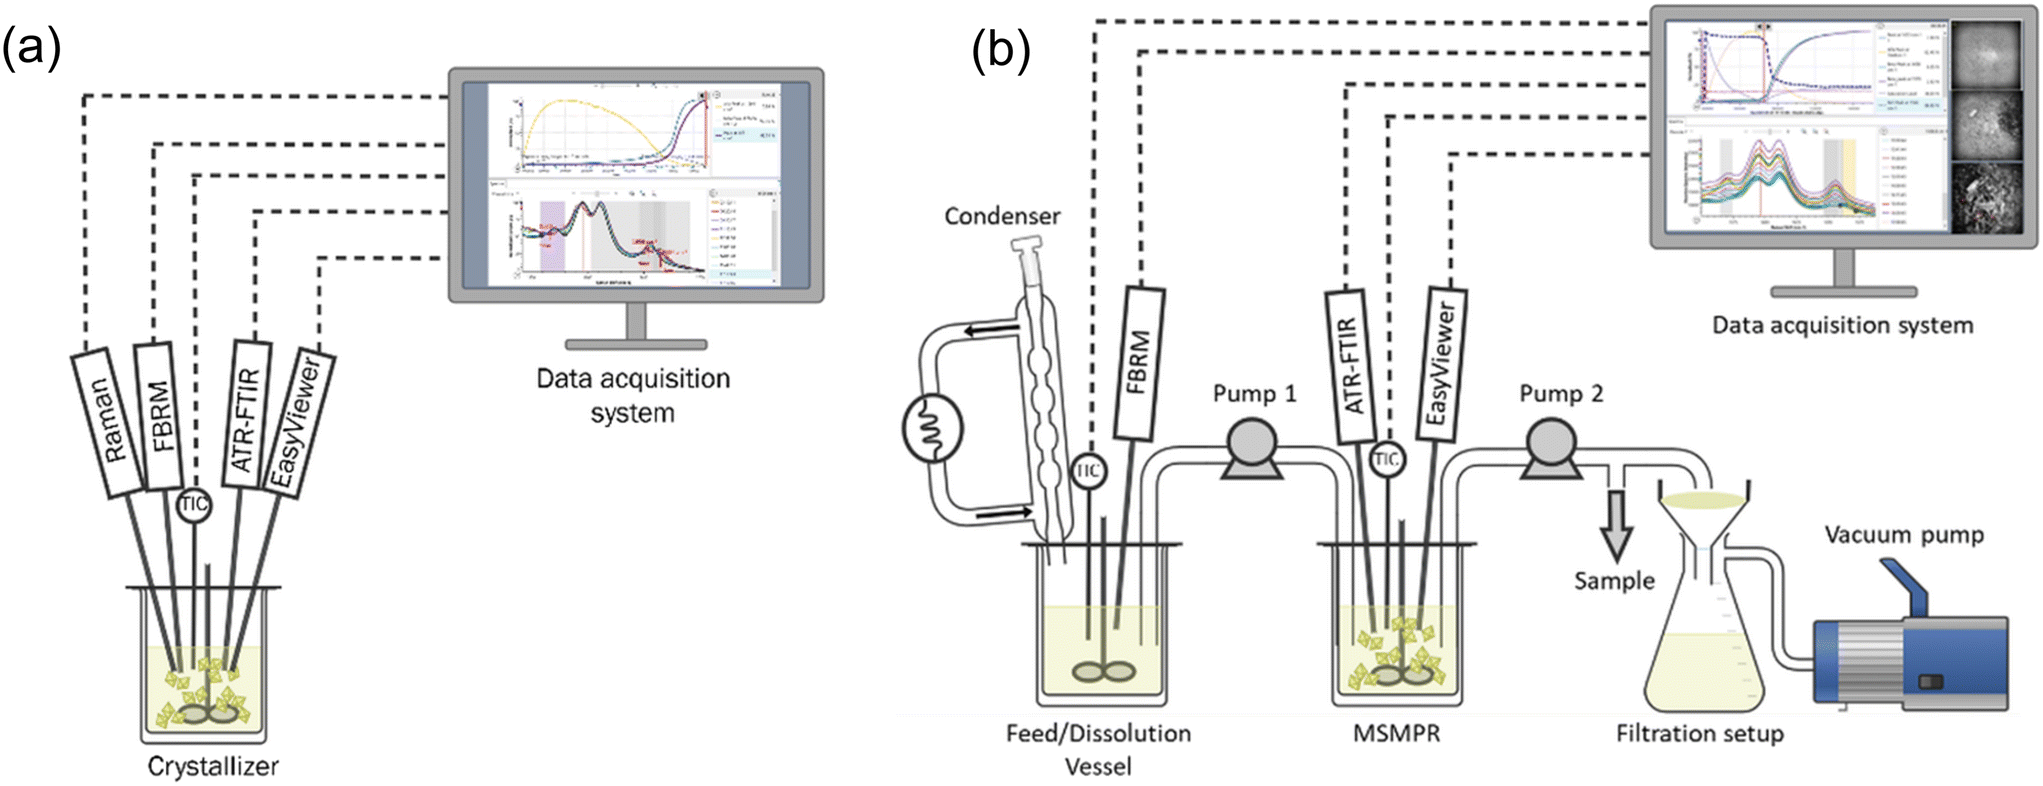 | ||
| Fig. 2 Experimental setup for: (a) batch cooling crystallization experiments and ATR-FTIR calibration experiments, and (b) continuous crystallization experiments. | ||
Continuous crystallization experiments were conducted using a single stage mixed suspension, mixed product removal (MSMPR) crystallizer, as it is drawn in Fig. 2b. The setup included two vessels: the first served as the feed vessel, and the second functioned as the MSMPR crystallization vessel. Slurry transfer between vessels was enabled by an Ismatec multi-channel peristaltic pump. Rapid intermittent transfer from the feed vessel to the MSMPR and from the MSMPR to the filtration setup was implemented to minimize the risk of tube clogging associated with slurry transfer. A Huber Ministat 125 thermoregulator was used to control the condenser jacket temperature and to prevent solvent evaporation during continuous operation.
To monitor the progression of crystallization and the achievement of steady state conditions, PAT tools were integrated into the MSMPR system. In situ Raman spectroscopy was employed to analyze the product polymorphic form in real time, while offline samples were collected at every residence time for UPLC concentration analysis. Additionally, intermittent sampling was performed for offline Raman spectroscopy and/or PXRD analysis, providing insights into the product polymorphic form.
2.5 Crystallization process development framework
Drug development consists of two streams: production of drug substance and production of the final dosage form. The drug product must accommodate the physical properties of the drug substance, such as density and powder flowability, while ensuring it meets the desired attributes like particle size and shape.32 Therefore, close coordination between drug substance and product development is essential to ensure the solid oral dosage form performs effectively and meets quality requirements. Selecting the appropriate crystalline form of the API should address the requirements of both drug substance and drug product development, and this decision is ideally made before or alongside the selection of the process development route.The workflow proposed in this work considers these efforts alongside the crystallization process development route which is aimed at developing a continuous crystallization process for any polymorphic system. A quality-by-design approach is chosen to guide the process development. The framework, as shown in Fig. 3, starts with the screening of the suitable polymorphic forms. This is accompanied in parallel through evaluation of physical properties of the solid forms, solid form stability, solvent screening, in addition to manufacturability of the solid forms.
 | ||
| Fig. 3 Process design workflow for polymorphic crystallization. | ||
In traditional crystallization design workflows, solvent selection is typically guided by thermodynamic considerations such as yield, with kinetic information often limited to polymorphic form control. However, early solvent screening experiments can provide much richer kinetic insights, such as whether the system is growth- or nucleation-dominated, its tendency for agglomeration, and particle shape characteristics. Incorporating this kinetic information during solvent selection can significantly improve downstream process development and efficiency. For instance, if a solvent is chosen solely for yield or polymorph control but later exhibits slow growth rates, nucleation-dominated behavior, or strong agglomeration tendencies, corrective measures such as slower crystallization, complex operating procedures, or thermocycling may become necessary. By contrast, considering even semi-quantitative kinetic evaluations early on can guide solvent choices that are inherently more favorable for process intensification. Consequently, it is essential to study the solubility and phase behavior of the API in a range of suitable solvents screened from the previous step to understand both the thermodynamic properties and the crystallization kinetics associated with different solid forms. This approach, referred to as kinetically informed thermodynamic (KIT) design, combines thermodynamic understanding with kinetic observations to guide effective crystallization process development.
The concept of kinetically informed thermodynamic (KIT) design proposed in this work builds upon the well-established principle that rational crystallization process design must concurrently consider thermodynamic (e.g., solubility, supersaturation, and phase equilibria) and kinetic (e.g., nucleation, crystal growth, aggregation, and polymorphic transformation) factors to achieve desired critical quality attributes (CQAs) within feasible process rates. This combined thermodynamic–kinetic perspective has long been recognized in crystallization science and engineering.33–35 In the present work, the term KIT design is introduced not to propose a new philosophy, but to formalize and operationalize this integrated approach as a structured workflow for early-stage pharmaceutical crystallization process development. Specifically, KIT design emphasizes how thermodynamic information (e.g., solubility, metastable zone width) can be informed by and coupled with kinetic insights (e.g., nucleation tendency, growth rate, polymorph interconversion) to guide solvent and antisolvent selection, selection of crystallization pathway, and scale-up strategies. This framework aligns with earlier combined design approaches in which process engineers select operating trajectories by jointly evaluating supersaturation control (thermodynamics) and crystallization rate dynamics (kinetics),33 integrates the thermodynamic–kinetic–hydrodynamic interdependence,34 and extends the foundational continuous crystallization principles.35 Thus, the KIT design is defined to be a structured framework within which the well-accepted combined thermodynamic and kinetic approach is made operational in early-stage process development and then linked to scale-up. KIT design is typically performed on a small-scale to gain insights into the influence of solvent choice and temperature on transformation kinetics and solid form stability.
Semi-quantitative observations of crystallization kinetics, such as nucleation, crystal growth, and agglomeration, under different conditions (e.g. cooling or antisolvent crystallization) provide valuable information. These findings help identify a suitable solvent system and define an experimental crystallization design space that balances thermodynamic feasibility with kinetic control. The outcomes from such small-scale trials serve as a foundation for designing robust bench-top or lab-scale crystallization experiments, enabling further validation and optimization of the process. An informed understanding of the KIT design step supports rational solvent selection, after which the solubility phase diagram can be established in the chosen solvent. This forms a foundation for developing a robust and sustainable crystallization process.
The subsequent step involves identifying the key design parameters that influence crystallization process development. Critical decisions such as the selection of the operating regime and the type of crystallization process play a major role in determining process outcomes. These include product yield, volume productivity, environmental impact, target solid form, product quality, and overall cycle time. A careful evaluation of these parameters is essential for embedding quality into the crystallization process from the early stages, with the goal of consistently achieving the desired solid form.11 This approach minimizes the need for extensive experimentation, thereby reducing process development time, resource consumption, and overall cycle time.
In continuous crystallization, maintaining a steady state operation with well-defined supersaturation levels is key to ensuring consistent crystal attributes such as size distribution, morphology, and polymorphic form. The solubility and phase diagram constructed during early studies allows for precise control of supersaturation profiles, which is essential for tuning nucleation and growth rates under continuous flow conditions. Moreover, understanding the influence of process parameters such as flow rates, temperature gradients, mixing intensity, and residence time distribution enables rational design of crystallizer configuration (e.g., MSMPR, tubular, or plug flow reactors). Insights into the crystallization kinetics guide the selection of appropriate seeding strategies, temperature control profiles, and solvent/feed concentrations to avoid issues like uncontrolled nucleation or undesired phase transitions. By leveraging this knowledge, it is possible to design a continuous process that not only delivers the target form with consistent quality but also enhances productivity, reduces solvent usage, and minimizes batch-to-batch variability. This leads to a more robust, scalable, and sustainable crystallization process with lower development time and cost.
3. Results and discussion
Following the crystallization process development framework in Fig. 3, each step is followed with the subtasks explained and applied to the imatinib mesylate crystallization process development.3.1 Screening
As illustrated in Fig. 3, the initial stage of crystallization process development entails the identification and selection of an appropriate solid form for drug substance manufacturing. This process begins with the compilation of prior knowledge related to the compound of interest, followed by thorough characterization of the starting materials and systematic solvent screening and ranking. These foundational steps are critical for conducting preliminary crystallization trials aimed at confirming the targeted solid form, which may be a specific salt or polymorphic variant intended for final use. While such evaluations are traditionally associated with the preformulation phase, the confirmation of solid form, assessment of solubility, selection of suitable solvents, and evaluation of manufacturability are all integral to the design and development of an efficient, scalable, and robust crystallization process.Imatinib is produced from imatinib free base, which is the precursor that is obtained from upstream synthesis reaction. Imatinib free base has very poor water solubility and dissolution profile. The crude reaction mixture then undergoes downstream steps to produce a salt form especially the reactive crystallization step with methanesulfonic acid to produce imatinib mesylate salt for formulation. Imatinib mesylate is highly soluble in water and it is reported that both the forms have the same bioefficacy with bioavailability >98%.36
 | ||
| Fig. 4 SEM images of α-form crystals exhibiting needle-like morphology with higher aspect ratio: (a) 15× magnification with 4 μm scale bar, and (b) 8× magnification with 5 μm scale bar; and SEM images of β-form crystals showing cubic-like morphology: (c) at 10 μm scale, and (d) at 20 μm scale. | ||
A comparison of the PXRD spectra from the samples and simulated spectra from literature for pure forms are shown in Fig. 5.12 The α-form exhibits prominent peaks at scattering angles (2θ) of 4.8°, 10.4°, 14.8°, 19.0°, 24.8°, and 28.5°, while the β-form can be identified by diagnostic peaks at 9.7°, 13.9°, 18.2°, 20.0°, 21.1°, and 30.8°. The comparison from Fig. 5 confirms that the mesylate salt used in these experiments were the pure form and were not a mixture of polymorphs.
 | ||
| Fig. 5 PXRD patterns of (a) α-form and (b) β-form imatinib mesylate, and comparison of (c) Raman spectra and (d) DSC results. | ||
Additionally, offline Raman spectra were obtained for the two forms based on characteristic peaks identified in the literature.12 The spectra shown in Fig. 5c are consistent with reported studies, where the peak around 1656 cm−1 is characteristic of the β-form, and the peak at 1664 cm−1 corresponds to the α-form. In addition, the emergence of a second peak around 1567 cm−1 was observed as the transformation to the stable form progressed.
As it is given in Fig. 5d, the DSC results show that both polymorphs produced a single endothermic peak due to melting: α-form imatinib mesylate has a higher melting point (225.4 °C) and lower heat of fusion (143.2 J g−1), compared to lower melting point of β-form (219.6 °C) and higher lower heat of fusion (149.1 J g−1).
These comparative studies of the starting materials confirm that the supplied form is the α-form, while the β-form is obtained through transformation of the α-form during our laboratory experiments. Furthermore, it is conformed that the α-form is the metastable form that transforms into more stable β-form, which does not undergo further transformation during any of our experimentation.12
As shown in Fig. 6, thirteen solvents were selected for preliminary solubility studies of both forms of imatinib mesylate. The initial screening was conducted at room temperature and at an elevated temperature of 40 °C using the Crystalline platform and a Velp Scientifica multi-vial magnetic stirring system following the procedure detailed in section 2.3. Among the thirteen tested solvents, methanol, N-methyl-2-pyrrolidone (NMP), dimethyl sulfoxide (DMSO), and water demonstrated good solubilizing capabilities, while the remaining solvents acted primarily as antisolvents.
 | ||
| Fig. 6 Comparison of α- and β-form solubility of imatinib mesylate in various solvents at room temperature (RT) and at 40 °C. | ||
Imatinib mesylate exhibited high solubility in water, particularly under acidic conditions (pH < 6.0). The solubility was so pronounced that a yellow gel-like phase formed upon dissolution, resulting in a dense and viscous mixture at saturation. Although the exact solubility limit could not be determined due to this phase behavior, both forms were able to dissolve 1 g in 1 g of water (water pH = 5.5), suggesting that the actual solubility exceeds this concentration. DMSO and NMP also supported high solubility of the drug, but their high boiling points (NMP: 202 °C, DMSO: 189 °C) may limit their utility in downstream crystallization or solvent recovery processes. The solubility of imatinib mesylate followed the order: water > DMSO > NMP > methanol. While higher solubility is typically desirable, excessively high solubility may lead to increased solid loading during crystallization, which can pose processing challenges such as inefficient mixing, clogging of transfer lines, and difficulties in slurry handling. According to solvent selection guides that emphasize environmental, health, and safety (EHS) criteria,38 alcohols and ketones are generally considered green and preferred solvent choices. In this context, methanol appears to be a strong candidate for dissolving imatinib mesylate, while 2-propanol (IPA) could serve as an effective antisolvent. Additionally, mixtures of alcohols or ketones with water may represent promising solvent systems that balance solubility performance with environmental sustainability.
Flowability and compressibility. From Fig. 4, it can be noticed that the β-form crystals are cubic and are more favorable for downstream operations than the α-form that has needle shape. Apart from this, bulk density affects material handling and dosing uniformity, while flowability and compressibility can be quantitatively assessed using the Hausner ratio and Carr compressibility index respectively.39 Lower values of these indices (Hausner ratio <1.34, compressibility index <25%) indicate better flow and compressibility characteristics, which are desirable for efficient and consistent manufacturing.40 Therefore, evaluating these physical parameters alongside solubility and SMPT profiles is essential for selecting a robust and scalable polymorphic form suitable for commercial production. These are evaluated for both forms of imatinib mesylate in the lab following the procedures and expressions reported in the literature.41 From Fig. 7, it can be noticed that the bulk density and tapped density is more for β-form and hence the Hausner ratio and Carr's index are low for the β-form showing that the β-form has superior flowability and compressibility characteristics.
 | ||
| Fig. 7 Comparison of (a) bulk and tapped densities, and (b) Hausner ratio and compressibility index. | ||
Solid state stability. Polymorphic stability is a critical parameter during pharmaceutical development, with implications for processing, handling, and long-term storage. Thermodynamic stability is governed by the free energy of crystal, wherein only one polymorph represents the most stable form at a given temperature (form with the lowest free energy), while all others are thermodynamically metastable and predisposed to transformation (forms with higher free energy). In contrast, kinetic stability reflects the resistance of a metastable form to undergo phase transformation and is dictated by the activation energy barrier associated with structural rearrangement.39,42 While thermodynamic stability is an intrinsic property of the solid form, kinetic stability can be modulated through external factors such as temperature, humidity, solvent environment, and mechanical stress, as well as intrinsic attributes including particle size, morphology, and crystallinity.
In the case of imatinib mesylate, both α- and β-forms were examined for their relative stability. The β-form is thermodynamically more stable, exhibiting lower free energy, and thus represents the preferred form under equilibrium conditions. Although the α-form is metastable, it displayed notable kinetic stability under ambient conditions and did not spontaneously convert to the β-form during the experimental timeframe (Fig. 8). The starting materials were characterized, and storage conditions were recorded. α-Form samples were stored in a sealed container at both 5 °C and room temperature, while the β-form sample was stored at room temperature. The PXRD data shown in Fig. 8 indicated that the metastable and stable forms did not undergo any transformation at the time of these stability tests. This kinetic persistence is attributed to the energy barrier associated with the structural rearrangement between the two forms. However, external stimuli such as elevated temperature or solvent-mediated processing may facilitate the transformation. Understanding and controlling the kinetic stability of the α-form is therefore essential when targeting it for downstream formulation, ensuring phase purity is maintained during manufacturing and storage.
 | ||
| Fig. 8 PXRD of samples for solid state stability of both forms of the imatinib salt. | ||
Solvent mediated transformation. Another important factor to consider in polymorphic systems is SMPT, where the metastable form converts to the stable form in the presence of a solvent. The kinetics of this transformation are strongly influenced by the nature of the solvent. Studying SMPT is critical for solvent selection in polymorphic systems, as the choice of solvent can directly influence the physical form of the final product. A metastable form may convert to a more stable polymorph during processing or storage if the solvent facilitates transformation under given conditions.39 Understanding SMPT behavior allows for the identification of solvents that either promote or suppress such transitions, ensuring consistent polymorphic form, which is essential for maintaining the desired bioavailability, stability, and regulatory compliance of the drug substance. Following solubility assessment, a constant excess of the α-form was added to a fixed volume of each solvent at room temperature, and the transformation time was recorded using Technobis Crystalline particle viewer (PV) platform. The phase transformation was monitored in real time using a non-contact Raman probe connected to the Crystalline PV via a custom adapter (refer Fig. S1). The onset of transformation was identified by a decrease in the peak intensity corresponding to the α-form and the simultaneous appearance of the β-form peak. Specifically, the appearance of the β-form peak at approximately 1567 cm−1 was used to mark the transformation time point. The transformation was further confirmed by filtering the contents at the end of the experiment and analyzing the solid residue using offline Raman spectroscopy or PXRD. The order of SMPT kinetics for the α-to-β transformation followed the same trend as shown in Fig. 6, with heptane exhibiting the fastest transformation and water the slowest.
3.2 Kinetically informed thermodynamic (KIT) design
![[thin space (1/6-em)]](https://www.rsc.org/images/entities/char_2009.gif) :50 (w/w), with a total mixture mass of 2 g. A qualitative comparison of crystallization kinetics in the two top solvent options was performed based on nucleation and growth behavior, degree of agglomeration, and aspect ratio. As shown in Fig. 9, the bar charts present a qualitative comparison of crystallization behavior, capturing differences in nucleation, growth, aspect ratio, and agglomeration for both α- and β-forms used as starting materials under cooling and antisolvent crystallization conditions. Interestingly, while the final solid obtained in all experiments was confirmed to be the β-form through offline characterization, the identity of the initially nucleated polymorph remains unclear. This is primarily due to the limitation of the in situ Raman spectroscopy, which was unable to detect the solid phase during nucleation, as the solid content at that stage was below the probe's detection limit. As a result, it is uncertain whether the β-form nucleated directly or whether it emerged from the transformation of an initially nucleated α-form. This ambiguity underscores the need for lab-scale experiments, where higher solid loadings enable more accurate in situ monitoring and provide clearer insights into nucleation behavior and polymorphic evolution. In order to qualitatively assess these outcomes, detailed solubility profiles of the α- and β-forms in the respective solvent systems are essential. Such thermodynamic information forms the basis for understanding transformation behavior and rationalizing the final polymorphic outcome observed under various process conditions. However, qualitative assessment of crystallization kinetics irrespective of the crystallized form can be obtained from Fig. 9.
:50 (w/w), with a total mixture mass of 2 g. A qualitative comparison of crystallization kinetics in the two top solvent options was performed based on nucleation and growth behavior, degree of agglomeration, and aspect ratio. As shown in Fig. 9, the bar charts present a qualitative comparison of crystallization behavior, capturing differences in nucleation, growth, aspect ratio, and agglomeration for both α- and β-forms used as starting materials under cooling and antisolvent crystallization conditions. Interestingly, while the final solid obtained in all experiments was confirmed to be the β-form through offline characterization, the identity of the initially nucleated polymorph remains unclear. This is primarily due to the limitation of the in situ Raman spectroscopy, which was unable to detect the solid phase during nucleation, as the solid content at that stage was below the probe's detection limit. As a result, it is uncertain whether the β-form nucleated directly or whether it emerged from the transformation of an initially nucleated α-form. This ambiguity underscores the need for lab-scale experiments, where higher solid loadings enable more accurate in situ monitoring and provide clearer insights into nucleation behavior and polymorphic evolution. In order to qualitatively assess these outcomes, detailed solubility profiles of the α- and β-forms in the respective solvent systems are essential. Such thermodynamic information forms the basis for understanding transformation behavior and rationalizing the final polymorphic outcome observed under various process conditions. However, qualitative assessment of crystallization kinetics irrespective of the crystallized form can be obtained from Fig. 9.
 | ||
| Fig. 9 KIT design studies for comparing: (a) cooling crystallization of α-form in methanol and DMSO, (b) cooling crystallization of β-form in methanol and DMSO, (c) antisolvent crystallization of α-form methanol–IPA and DMSO–IPA, (d) antisolvent crystallization of β-form methanol–IPA and DMSO–IPA. | ||
For the α-form under cooling crystallization (Fig. 9a), methanol exhibited significantly higher nucleation and growth rates compared to DMSO, which makes it a more promising solvent for this case. Both solvents, however, produced similar levels of agglomeration and crystals with low aspect ratios, indicating more equant shapes. For β-form (Fig. 9b), DMSO did not induce visually detectable nucleation; crystals were only observable under a microscope (Fig. 10b). This slow and ineffective crystallization behavior suggests inadequate supersaturation or a wide metastable zone width. As a result, β-form nucleation in DMSO was considerably lower than in methanol. In contrast, methanol promoted high nucleation and moderate growth rates, with medium aspect ratios and some degree of agglomeration.
 | ||
| Fig. 10 Microscopy images for KIT design experiments: (a) cooling crystallization of α-form in methanol and DMSO, (b) cooling crystallization of β-form in methanol and DMSO, (c) antisolvent crystallization of α-form methanol–IPA and DMSO–IPA, (d) antisolvent crystallization of β-form methanol–IPA and DMSO–IPA. | ||
Under antisolvent crystallization for α-form (Fig. 9c) in both methanol–IPA and DMSO–IPA mixtures exhibited high nucleation and low growth rates, while DMSO–IPA sample showed slightly slower nucleation and dissolution. The aspect ratio for the DMSO–IPA sample was much higher compared to the methanol–IPA sample (Fig. 10c). In both systems, the agglomeration was high. For β-form in methanol–IPA system (Fig. 9d), the nucleation rate was slow however, it was faster and more prominent than DMSO–IPA system, the latter having only very few crystals after 24 hours. However, it was observed that the secondary nucleation rate was more dominant than growth and primary nucleation rate for methanol–IPA case. Agglomeration was high for methanol–IPA sample, which is typical of processes dominated by nucleation and limited crystal growth. The crystals obtained showed similar aspect ratios. The β-form crystallizes more favorably under antisolvent conditions than via cooling.
In summary, methanol emerged as the most favorable solvent overall, supporting higher nucleation and growth rates, particularly for the α-form. Among the two methods, cooling crystallization demonstrated quicker and more distinct kinetic behavior compared to antisolvent crystallization, making it more suitable for rapid process development and form screening.
These experiments aimed to evaluate how quickly the system transformed to the β-form when a known amount of a metastable solid was suspended in a fixed volume of methanol, under consistent stirring conditions and at a defined laboratory scale. All experiments were performed in 20 mL vials containing 10 mL of solvent, with temperature-controlled magnetic stirring and real-time monitoring using a Raman probe inserted directly into the slurry. This setup ensured uniform mixing and allowed real-time tracking of the polymorphic transformation. Fig. S2 in the SI explains the identification of characteristic peaks of polymorphic forms of imatinib mesylate in methanol. According to this qualitative information, the metastable α-form is detected at 1664 cm−1 and the peak around 1656 cm−1 and ∼1570 cm−1 are characteristic peaks of the β-form. These are similar to the offline solid form characterization discussed in Fig. 5c.
By systematically varying the temperature from 0 °C to 40 °C and the initial solid content from 1% to 4%, the experiments enabled a detailed assessment of how these parameters influenced the transformation rate and extent in methanol. Higher temperatures led to faster transformations, likely due to increased solubility, enhanced molecular mobility, and more efficient dissolution-reprecipitation dynamics. While the effect of temperature was dominant, solid content also played a role, lower solid loadings favored quicker transformations, whereas higher loadings appeared to slow the process in general, potentially due to mass transfer limitations or hindered surface-mediated conversion.
The transformation to the β-form was monitored over time using in situ Raman spectroscopy. Experimental conditions and corresponding transformation times were used to generate a response surface plot (Fig. 11), illustrating the combined effect of temperature and solid content on transformation time. The response surface clearly showed that the transformation was significantly delayed at lower temperatures and higher solid contents, while rapid conversion occurred at elevated temperatures and lower solid fractions.
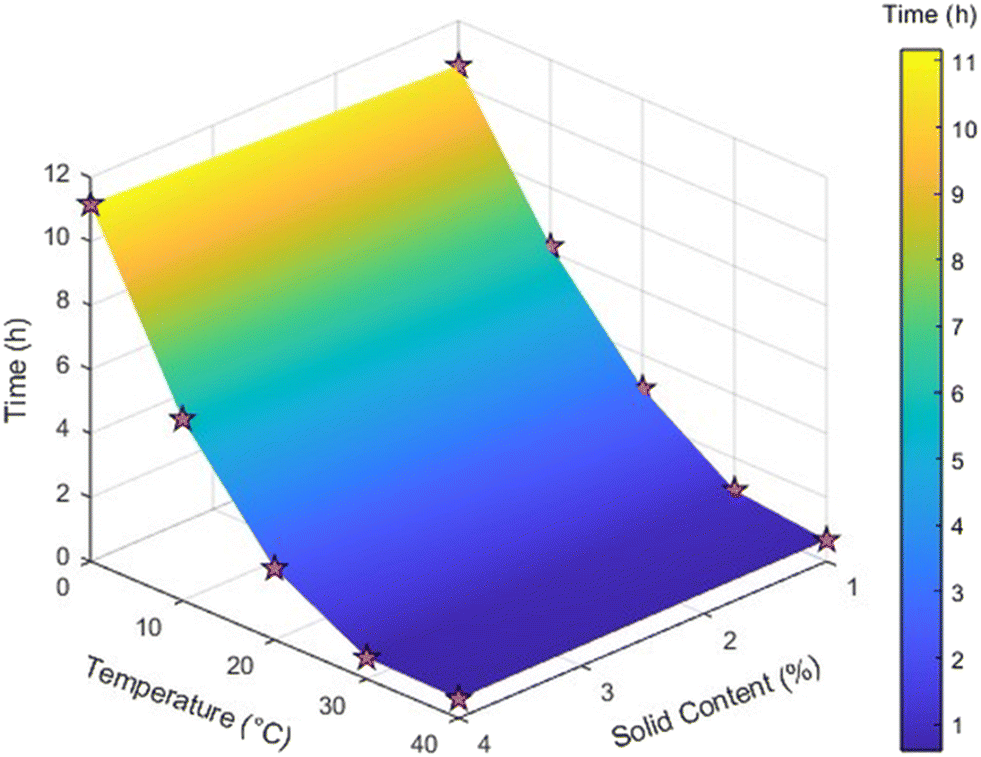 | ||
| Fig. 11 Response surface graph for transformation of metastable form to stable form illustrating weak interaction between temperature and solid loading. | ||
The surface curvature indicated a synergistic effect between temperature and solid content, highlighting optimal conditions for rapid transformation. These insights are particularly valuable for process development and scale-up, where controlling the rate and completeness of polymorphic conversion is critical. Knowing the conversion time is also critical for the development of a continuous crystallization process with the objective of producing a certain polymorphic form, as the residence time of the process would need to be aligned with the conversion time, depending on the desired polymorphic form. The results demonstrate that in methanol, the selected solvent for cooling crystallization, slurry-based transformation to the β-form can be efficiently achieved by optimizing temperature and solid loading, ensuring robust and reproducible formation of the desired stable form. However, changing the scale influenced the transformation time, with longer durations observed at larger volumes. Similar experiments were conducted in EasyMax setup at a higher scale. Data from one such experiment (SMPT at 20 °C for 1% solid content) is plotted in Fig. 12, where the Raman intensity of the β-form peak increases as that of the metastable form decreases. As the transformation proceeds, the solubility of the β-form, being significantly lower in methanol, leads to a decline in the IR peak and a rise in turbidity, representing β-crystals in the vessel. The transformation time was determined based on the onset of the β-form characteristic peak, as observed through in situ Raman spectroscopy.
 | ||
| Fig. 12 Solvent-mediated transformation at 20 °C for 1% solid content with EasyViewer images during the experiment and microscopy image of the product. | ||
After the transformation was complete, the contents were filtered, and offline Raman spectroscopy was performed to confirm the results. All experiments consistently yielded the stable β-form. In the EasyMax experiments, samples were collected at multiple time points: at the start of the experiment, near the onset of transformation, midway through the transformation, and after complete transformation, Fig. 13 shows the result from the initial sample being α, the sample during transformation being a mixture, and the final sample being β. The offline Raman analysis of these samples validated the in situ results obtained from the online ReactRaman. Hence, in conclusion, the transformation times obtained from both the small-scale and EasyMax lab-scale experiments are reliable and reproducible.
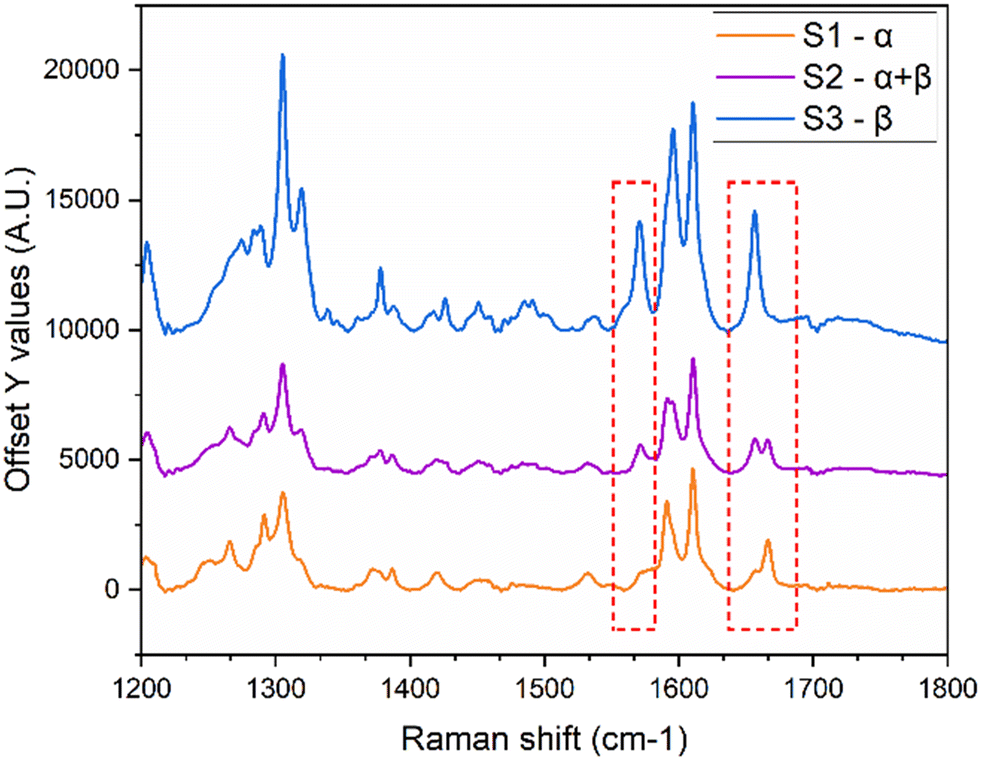 | ||
| Fig. 13 Offline Raman characterization performed at the beginning, during, and at the end of the transformation to validate the phase transition. | ||
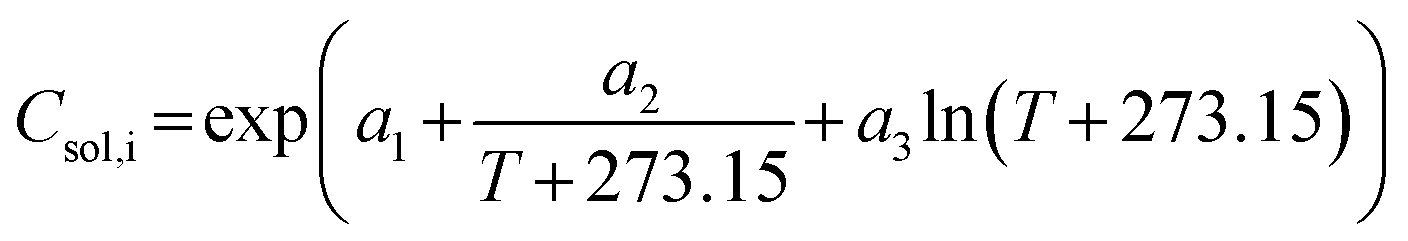 | (1) |
 | ||
| Fig. 14 Solubility data for (a) α-form in methanol, (b) β-form in methanol, and (c) comparison of α- and β-form solubility in IPA:MEOH mixtures at 20 °C, along with α-form solubility in IPA:MEOH mixtures at three different temperatures. | ||
| Parameters | α-Form | β-Form |
|---|---|---|
| a 1 | −1141.8491 | −361.8763 |
| a 2 | 47497.3657 |
13193.194 |
| a 3 | 172.0569 | 55.0941 |
The solubility model enables the prediction of solute solubility at any given or unmeasured temperature, providing essential input for supersaturation estimation and accurate modeling of crystallization processes. As part of the crystallization process development, the solubility of imatinib mesylate in binary mixtures of methanol and IPA was also determined. Fig. 14c illustrates the solubility across various antisolvent compositions at different temperature within the operation range. More number of data points are necessary for proposing a solubility model for anti-solvent crystallization or combined cooling-antisolvent crystallization. However, for initial assessment and understanding, this information was sufficient to design a crystallization process.
3.3 Crystallization process design
Building on the qualitative assessment of the initial crystallization trials, it can be concluded that multiple feasible pathways exist for crystallizing imatinib mesylate through cooling crystallization. These insights highlight the importance of strategic process design to leverage the thermodynamic and kinetic factors governing polymorph formation. With this understanding, the cooling crystallization process can be effectively designed based on the solubility landscape of the system, as discussed below. | ||
| Fig. 15 Recrystallization pathways for producing both forms: pathway (a): starting from saturated α-form solution to produce either α or β-form; pathway (b): starting from saturated β-form solution to produce β-form. | ||
Two representative recrystallization pathways considering cooling crystallization are demonstrated in Fig. 15. Pathway (a) involves starting from a saturated α-form solution at elevated temperature (star on the α-solubility curve). Isothermal holding at this temperature (vertical dashed line) can enable solvent-mediated transformation to the β-form, exploiting the thermodynamic driving force between the two forms. Alternatively, cooling this α-saturated solution (horizontal dashed line) introduces high supersaturation with respect to the β-form. Under such conditions, either α-nucleation may occur initially, followed by transformation, or the β-form may nucleate directly. Given the large supersaturation gradient with respect to β, the latter scenario is more likely, and desupersaturation process would proceed until the solution reaches equilibrium with the β-form at the final temperature. The feasibility of this pathway strongly depends on kinetic factors, particularly the transformation rate and nucleation behavior.
Pathway (b) starts with a saturated β-form solution and involves cooling to directly crystallize the β-form. This route avoids transformation and provides thermodynamic control, making it attractive when the β-form is the desired product and seed material or nucleation conditions are appropriately managed.
The practical viability of these pathways is informed by the transformation kinetics shown in Fig. 11 and 14. As explained in the previous section, at low temperatures and low solid loadings, the transformation is sluggish (exceeding 10 hours), which may limit the feasibility of isothermal solvent-mediated routes. However, transformation times reduce dramatically under elevated temperature and higher solid content, falling below 2 hours, conditions more suitable for batch and continuous processing. However, in these experiments, the slurry initially contained excess α-form solids, which provided a thermodynamic driving force for transformation. Nevertheless, introducing heavy seeding with the β-form could significantly alter the crystallization and transformation kinetics, potentially directing the system more efficiently toward β-form production.
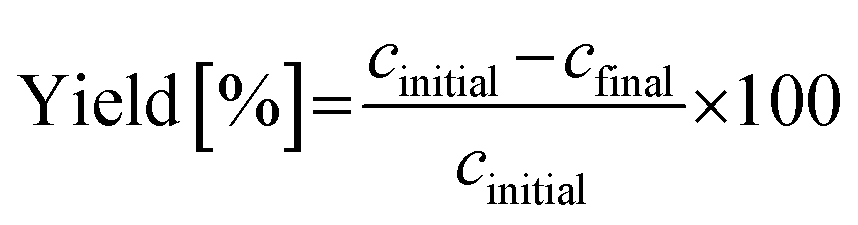
To assess and compare the efficiency and sustainability of different crystallization strategies under varying operating conditions, such as initial and final temperatures, key performance indicators, such as theoretical yield, productivity, and the environmental factor (E-factor), were calculated. Yield quantifies the percentage of solute recovered as crystalline product, while productivity reflects the mass of solid obtained per 100 grams of solvent. E-Factor, a commonly used green chemistry metric, measures the total amount of solvent required to produce one gram of solid product. These metrics were calculated using the following expressions in eqn (2)–(4):
 | (2) |
| Productivity (Final slurry concn.)[gsolid 100 gsolvent−1] = (cinitial − cfinal) × 100 | (3) |
 | (4) |
The design spaces represented by the heatmaps shown in Fig. 16 indicate the trade-offs between process performance metrics under varying crystallization temperature ranges (Tinitial to Tfinal). High yield and productivity are favored at lower final temperatures with larger operating temperature spans, while lower E-factors (i.e., improved process sustainability) are observed in the same region, suggesting that deep cooling may be optimal for process sustainability as well as performance. As an example, choosing Tinitial of 40 °C and Tfinal of 10 °C, three cooling crystallization cases involved in the pathways (a) and (b) in Fig. 16 can be explained as follows:
• α-Form crystallization:
| Yield = 61.0%, Productivity = 16.1 g per 100 g solvent, E-Factor = 6.2 |
• β-Form crystallization (via direct nucleation and growth):
| Yield = 66.4%, Productivity = 3.1 g per 100 g solvent, E-Factor = 32.1 |
• β-Form formation via crystallization from α-form (nucleation and growth of β-form):
| Yield = 63.7%, Productivity = 15.8 g per 100 g solvent, E-Factor = 6.3 |
 | ||
| Fig. 16 Design space for (a) yield, (b) volume productivity, and (c) E-factor for α-form of imatinib mesylate in methanol. | ||
| Expt. No. | Type of expt. | Seed loading | Cooling strategy/rate | Initial concentration (gsolute gsolv−1) | Initial temp. (°C) | Final temp. (°C) | Batch time (min) | Final product form |
|---|---|---|---|---|---|---|---|---|
| 1 | Isothermal | No seed | Isothermal | 0.24 | — | 20 °C | 720 | β |
| 2 | Isothermal | No seed | Isothermal | 0.24 | — | 0 °C | 720 | β |
| 3 | Isothermal | No seed | Isothermal | 0.13 | — | 20 °C | 720 | β |
| 4 | Isothermal | No seed | Isothermal | 0.13 | — | 0 °C | 720 | β |
| 5 | Cooling | 5% (α-seed) | 0.16 | 0.13 | 30 °C | 20 °C | 60 | β |
| 6 | Cooling | 5% (α-seed) | 0.33 | 0.13 | 30 °C | 20 °C | 30 | α |
| 7 | Cooling | 5% (β-seed) | 0.33 | 0.13 | 30 °C | 20 °C | 30 | β |
In the seeded experiments 5, 6 & 7, 5% of either form of imatinib was used, and the impact of both cooling and batch time was evaluated. When the seeded slurry was cooled from 30 °C to 20 °C, over 30 minutes, the final product showed the metastable α-form when measured the form using PXRD, suggesting that the initial nucleation and growth were governed by kinetic control. There is a possibility that the small amount of β-form nucleated might go undetected during the PXRD showing majority of the spectrum associated with the α-seed added. However, extending the batch time to 1 hour under the same initial and final temperature values (longer batch and slower cooling profile) led to complete transformation to the β-form. This transition is attributed to solvent-mediated transformation, wherein the initially crystallized α-form dissolves and recrystallizes as the more stable β-form within a relatively short time. Another simple experiment is conducted to conform the crystallization of stable form with β-seed, and it was evident that stable form is crystallized. It was qualitatively observed that yield increases with higher initial temperatures, as greater supersaturation leads to more solid crystallization when cooled to the same final temperature. Also, it was observed that a decreased mean size (approximately 50–60 μm) was obtained with a higher initial temperature of 40 °C. Comparatively, larger crystals are obtained, of mean size approximately in the range of 50 to 100 μm, for experiments with a lower initial temperature of 30 °C.
The final product was analyzed for the polymorphic form with experimental findings from PXRD or offline Raman analysis. The PXRD patterns of both the unseeded and long-duration seeded experiments match those of the reference β-form, confirming the dominance of the stable polymorph. In contrast, the short-duration seeded experiment exhibits distinct peaks corresponding to the α-form, validating its temporary persistence under kinetically controlled conditions. Together, these results highlight that while seeding with the α-form can initially direct the crystallization pathway, the β-form ultimately dominates due to its thermodynamic stability in methanol, particularly when sufficient time is allowed for transformation. These observations are used to choose the operating regime, residence time, and type of seed to produce the stable form selectively that can be translated to continuous operation.
3.4 Continuous crystallization experiments
A modular continuous crystallization system was set up as described in the experimental section. The continuous crystallizer consists of a single stage MSMPR setup in the EasyMax 402 station with the first reactor used as a feed vessel and the second one as the MSMPR-crystallization vessel. A peristaltic Ismatec pump with multiple channels has been used for slurry transfer to and from the MSMPR, as these pumps allow for simultaneous transfer of the feed into the MSMPR and the product slurry from the MSMPR. Various PAT tools were inserted to monitor the progression of crystallization and the steady state. The IR probe in the MSMPR was used to monitors the crystallization process and for concentration measurement. Offline samples were taken every residence time for offline concentration measurements using UPLC. ReactRaman probe is inserted into a product collection vessel to analyze the product polymorphic form at real time. However, samples were collected intermittently for offline characterization to confirm with offline Raman spectroscopy or PXRD. An FBRM is inserted into the feed vessel to monitor any undesired nucleation. Additionally, an inline solvent filter was used at the feed line to ensure solid free feed into the MSMPR.Selective crystallization of the stable form by dissolving the metastable form to achieve high supersaturation was performed based on a structured experimental plan rather than a full statistical design of experiments (DOE). The crystallization conditions were systematically selected using prior thermodynamic and kinetic understanding from batch studies, focusing on solubility behavior, transformation kinetics, and supersaturation control. Due to the limited material availability and high value of the compound, an exhaustive factorial DOE involving multiple variables such as seed polymorph, residence time, and initial supersaturation was not feasible. Instead, two representative proof-of-concept experiments (Table 3) were strategically designed to demonstrate selective crystallization of the stable form under continuous cooling conditions. This knowledge-driven approach served to validate the underlying process concept and establish a practical basis for future process optimization and scale-up.
| Exp no. | Seed loading during start-up | Residence time | Initial conc. (g g−1) | Feed temp. (°C) | Final solid content (%) | MSMPR temp. (°C) | Final product form | Operational constraints |
|---|---|---|---|---|---|---|---|---|
| 1 | Seeded, 5% (β-seed) | 30 min | 0.24 | 40 | 13.30 | 20 | β | Constant flow, line clogging |
| 2 | Seeded, 5% (β-seed) | 30 min | 0.13 | 30 | 7.50 | 20 | β | Intermittent flow, no clogging |
The MSMPR was seeded with the β-form crystals to promote faster steady state attainment, prevent the formation of undesired fines, and the nucleation of the metastable form. However, batch crystallization experiments clearly indicate that nucleation of the α-form does not occur at the selected initial supersaturation levels. For the continuous experiments, a 30 minute residence time was selected based on batch experiment 7, which showed that seeding with the β-form led to its formation within 30 minutes. While unseeded batch experiments resulted in the α-form, it is hypothesized that seeding with the β-form during startup of the continuous process will initiate the formation of β-form, which can then be sustained at steady state through secondary nucleation of the β-form. The solute concentration at the saturation temperature of 40 °C was selected to operate during the first continuous trial. The MSMPR was operated at 20 °C, a temperature close to room temperature, to mitigate the risk of transfer line clogging and ensure stable crystallization performance.
For Experiment 1 in Table 3, an MSMPR of holdup volume of 100 mL is used with overall contents of 50 g methanol, saturated with α-imatinib at 40 °C at a continuous constant flowrate of 1.967 mL min−1 was chosen to maintain 30 min residence time using the Ismatec pump for both the feed and product lines. Samples were withdrawn at the product line which was maintained at the same constant rate for offline characterization. The ReactRaman installed at the product outlet consistently indicated the presence of the β-form as the final product. However, the system did not reach a steady state during the experiment. The run was terminated after approximately three residence times due to clogging in the product transfer line connected to the MSMPR crystallizer. This blockage originated near the base of the crystallizer and was primarily attributed to the high solid content within the MSMPR and the associated product line. Hence, the next experiment was planned with the same residence time but different operating conditions. The initial concentration was reduced by changing the saturation temperature to 30 °C to decrease the solid content inside the crystallizer. To avoid clogging associated with low continuous flow rates, an intermittent flow strategy was adopted. In this setup, the feed solution was introduced into the MSMPR at 3.934 mL min−1 for 1 minute intervals, followed by a 1 minute pause. This alternating pumping sequence was maintained throughout the experiment. Simultaneously, the crystallizing suspension was withdrawn from the MSMPR via a rapid, intermittent transfer to the collection vessel. This operation was carefully programmed to maintain a constant liquid level inside the MSMPR, as determined by a marked dip tube. The withdrawal pump was programmed to operate every 3 minutes, transferring the suspension at the highest possible flow rate to ensure the transfer line was emptied during each cycle. This configuration maintained the mass balance with an allowable volume transfer deviation of less than 5%. This second experiment was successful without any clogging, and the system attained a steady state after 4 residence times.
Fig. 17 illustrates the performance of a single-stage MSMPR operated at 20 °C for the continuous crystallization of the β-form of the compound. Multiple online and offline tools, including turbidity, concentration (via an inline IR), particle size analysis, and inline Raman spectroscopy, were employed to monitor process performance and product consistency. The turbidity profile (Fig. 17a) shows a rise during the initial phase, stabilizing after approximately 1.5 residence times (RT), indicating the establishment of nucleation and growth processes. This trend is mirrored in the inline IR-based concentration measurements (Fig. 17b), which shows a decreasing trend initially but become consistent beyond 4 RTs. Offline UPLC data correlates well with the IR measurements, validating the concentration trends. The stability of turbidity, online and offline concentrations after 4 RTs confirm the achievement of a steady state under the given operating conditions. Particle size data (Fig. 17c) further supports this conclusion. The D10 and D50 values converge and stabilize after 4 RTs reproducible and consistent crystal growth dynamics. The D90 values show variability with large error bars and do not follow the D10 & D50 trend after 4 RTs. The error bars reflect replicate measurements, confirming the reliability of the process in this steady state regime. However, compared to batch operation, continuous crystallization yielded a smaller mean crystal size of around 20 to 30 μm. The crystal size could be increased through further optimization via experimental studies or digital design using modeling of the imatinib crystallization process. Increasing residence time or continuous seeding of larger seed crystals may also contribute to the growth of larger crystals.
 | ||
| Fig. 17 Cooling crystallization of the β-form in a continuous single-stage MSMPR at 20 °C: (a) turbidity profile, (b) concentration profile, (c) CSD, and (d) Raman spectra at various residence times. | ||
Offline Raman spectra (Fig. 17d) collected at RT2, RT5, RT6, and RT7 consistently display the characteristic β-form peak; signal around 1654 cm−1 and 1570 cm−1 was consistently visible across all time points. The spectral overlay confirms polymorphic purity and consistency throughout the experiment. The experiment was carried out for over 7 residence times without clogging. Steady state was observed for the last three residence times. The intermittent transfer design along with reduced solid content prevented clogging in external transfer lines. However, some solid buildup inside the MSMPR was observed around 3 RTs, which did not affect the steady state behavior observed after 4 RTs but points to areas for mechanical or design improvement in future implementations, and is the potential reason for the larger variation in the D90 values. Additionally, because the product is polymorphic, a recycle configuration for repeated continuous experiments was not feasible due to the large solubility differences between the two forms. Moreover, extensive design-of-experiments studies for further process optimization were limited by the availability of material. Nevertheless, the experiments summarized in Table 3 provide a proof-of-concept, illustrating how the proposed workflow can leverage systematic information from batch studies to design a robust continuous crystallization process in just a few experimental steps, using minimal material.
4. Conclusions
This work presents a systematic workflow for crystallization process development, with imatinib mesylate serving as a model compound to illustrate strategies for selective polymorphic crystallization and continuous process implementation. Through a combination of solid-state characterization, solubility profiling, solvent screening, and transformation kinetics, the α- and β-polymorphs were fully characterized and identifying methanol as the most suitable solvent for selective crystallization of the stable β-form.Initial batch studies revealed that both thermodynamic and kinetic factors strongly influence polymorphic outcomes. Slurry experiments, guided by KIT design and conducted at small scale, demonstrated that transformation from α- to β-form in methanol is governed by nucleation and growth mechanisms and is significantly accelerated at higher temperatures and lower solid loadings. Cooling crystallization emerged as a more kinetically favorable strategy than antisolvent crystallization, with methanol supporting faster nucleation and growth rates for both forms than crystallization in another favorable solvent DMSO. Process performance was further evaluated through design space analysis using key metrics such as yield, productivity, and E-factor. Among the tested strategies, nucleation and growth of the β-form via transformation from the α-form offered a favorable balance between product quality and process sustainability.
The batch crystallization studies provided insights into the influence of seeding, supersaturation, and cooling profiles on polymorphic selectivity and crystal size distribution. These findings enabled the successful design and execution of a continuous crystallization process using a single-stage MSMPR. Real-time PAT tools (IR, Raman, EasyViewer) and offline analyses confirmed the production of the β-form with consistent concentration, turbidity, and particle size distribution after four residence times, indicating attainment of steady state. While continuous crystallization yielded slightly smaller crystals compared to batch operation, the process demonstrated reproducibility, scalability, and potential for further optimization.
Overall, this study highlights how a data-driven, quality-by-design (QbD) based approach, supported by advanced monitoring tools and solid-form knowledge, can enable robust crystallization process design for polymorphic systems. The proposed framework is adaptable and can be applied broadly to support the transition from batch to continuous crystallization, aligning with industry goals for digitalization, sustainability, and regulatory compliance in pharmaceutical manufacturing.
Author contributions
Hemalatha Kilari: conceptualization, methodology, formal analysis, investigation, data curation, visualization, writing – original draft, writing-review & editing. Ilke Akturk: conceptualization, methodology, formal analysis, investigation, validation, data curation, writing – original draft. Attila Tamas Csathy: formal analysis, investigation. Murat Ekin Agca: formal analysis, investigation. Urvi Mathur: formal analysis, investigation. Zoltán K. Nagy: conceptualization, funding acquisition, project administration, resources, writing – review & editing, supervision.Conflicts of interest
There are no conflicts to declare.Data availability
The data supporting the findings of this study are available within the article and its supplementary information (SI). Additional raw data are available from the corresponding author upon reasonable request.Supplementary information is available. See DOI: https://doi.org/10.1039/d5ce00852b.
Acknowledgements
Funding for this work was made possible, in part, by the US Food and Drug Administration (FDA) through grant number 75F40121C00106 and NSF grant no 2132142. Views expressed herein do not necessarily reflect the official policies of the Department of Health and Human Services; nor does any mention of trade names, commercial practices, or organizations imply endorsement by the United States Government. The authors gratefully acknowledge the collaborative support provided by Rutgers University and SRI. We thank Kiruba Catherine Vincent for assistance with the Raman microscope, Yung-Shun Kang for his support with UPLC analysis, and Fiona Jene Wehrle for her participation in experimental studies.References
- S. T. Ferguson, F. Ortner, J. Quon, L. G. Peeva, B. L. Trout, A. Livingston and A. S. Myerson, Use of Continuous MSMPR Crystallization with Integrated Nanofiltration Membrane Recycle for Enhanced Yield and Purity in API Crystallization, Cryst. Growth Des., 2013, 14(2), 617–627, DOI:10.1021/cg401491y.
- S. C. Hock, T. K. Siang and C. L. Wah, Continuous Manufacturing versus Batch Manufacturing: Benefits, Opportunities and Challenges for Manufacturers and Regulators, GaBI J., 2021, 10(1), 44–56, DOI:10.5639/gabij.2021.1001.004.
- A. Domokos, B. Nagy, B. Szilágyi, G. Marosi and Z. K. Nagy, Integrated Continuous Pharmaceutical Technologies - A Review, Org. Process Res. Dev., 2021, 25(4), 721–739, DOI:10.1021/acs.oprd.0c00504.
- D. Grover, J. Mackey, G. Pruneda, E. Zenk and Z. K. Nagy, Continuous Extraction of 2-Chloroethyl Isocyanate for Lomustine Intermediate Purification, Chem. Eng. Process., 2023, 183, 109225, DOI:10.1016/j.cep.2022.109225.
- V. Sundarkumar, W. Wang, M. Mills, S. W. Oh, Z. Nagy and G. Reklaitis, Developing a Modular Continuous Drug Product Manufacturing System with Real Time Quality Assurance for Producing Pharmaceutical Mini-Tablets, J. Pharm. Sci., 2023, 113(4), 937–947, DOI:10.1016/j.xphs.2023.09.024.
- A. Kompella, B. R. K. Adibhatla, P. R. Muddasani, S. Rachakonda, V. K. Gampa and P. K. Dubey, A Facile Total Synthesis for Large-Scale Production of Imatinib Base, Org. Process Res. Dev., 2012, 16(11), 1794–1804, DOI:10.1021/op300212u.
- A. Haouala, N. Widmer, M. A. Duchosal, M. Montemurro, T. Buclin and L. A. Decosterd, Drug Interactions with the Tyrosine Kinase Inhibitors Imatinib, Dasatinib, and Nilotinib, Blood, 2011, 117(8), 75–87, DOI:10.1182/blood-2010-07-294330.
- H. D. Chien, A. Pantaleo, K. R. Kesely, P. Noomuna, K. S. Putt, T. A. Tuan, P. S. Low and F. M. Turrini, Imatinib Augments Standard Malaria Combination Therapy without Added Toxicity, J. Exp. Med., 2021, 218(10), 1–9, DOI:10.1084/jem.20210724.
- F. Z. Ahmed and P. Shaifulla, Assessment of efficacy and safety of imatinib as an adjunct host-targeted therapy for parasite clearance in chloroquine-resistant malaria: a prospective case control study, Egypt. J. Intern. Med., 2025, 37(1), 11, DOI:10.1186/s43162-025-00399-9.
- A. K. Ghosh, J. L. Mishevich, S. Kovela, R. Shaktah, A. K. Ghosh, M. Johnson, Y. F. Wang, A. Wong-Sam, J. Agniswamy, M. Amano, Y. Takamatsu, S. i. Hattori, I. T. Weber and H. Mitsuya, Exploration of Imatinib and Nilotinib-Derived Templates as the P2-Ligand for HIV-1 Protease Inhibitors: Design, Synthesis, Protein X-Ray Structural Studies, and Biological Evaluation, Eur. J. Med. Chem., 2023, 255, 115385, DOI:10.1016/j.ejmech.2023.115385.
- S. Kshirsagar, B. Szilagyi and Z. K. Nagy, Experimental Design for the Efficient Determination of the Crystallization Kinetics of a Polymorphic System in Combined Cooling and Antisolvent Crystallization, Cryst. Growth Des., 2023, 23(3), 1486–1499, DOI:10.1021/acs.cgd.2c01075.
- M. Lin, Y. Wu and S. Rohani, A Kinetic Study of Crystallization Process of Imatinib Mesylate with Polymorphic Transformation Phenomenon, J. Cryst. Growth, 2019, 507, 146–153, DOI:10.1016/j.jcrysgro.2018.10.061.
- E. Simone, B. Szilagyi and Z. K. Nagy, Systematic Model Identification and Optimization-Based Active Polymorphic Control of Crystallization Processes, Chem. Eng. Sci., 2017, 174, 374–386, DOI:10.1016/j.ces.2017.09.034.
- J. W. Mullin, Crystallization, Butterworths, London, 4th edn, 2001, DOI:10.1021/op0101005.
- T. Li, J. Zhang, M. Li, H. Qu, S. Wu and J. Gong, Mechanism of Solvent-Mediated Polymorphic Transformation to Prepare Axitinib Form XLI Controlled by Water Activity, CrystEngComm, 2024, 6562–6572, 10.1039/d4ce00863d.
- M. A. O'Mahony, A. Maher, D. M. Croker, Å. C. Rasmuson and B. K. Hodnett, Examining Solution and Solid State Composition for the Solution-Mediated Polymorphic Transformation of Carbamazepine and Piracetam, Cryst. Growth Des., 2012, 12(4), 1925–1932, DOI:10.1021/cg201665z.
- J. Zimmermann, B. Sutter and H. M. Burger, Crystal Modification of a N-Phenyl-2-Pyrimidineamine Derivative, Processes for Its Manufacture and Its Use, Patent WO1999003854A1, 1999.
- M. Lin, Experimental and Numerical Study of Polymorphism in Crystallization Processes, Ph.D. Thesis, The University of Western Ontario, Canada, 2020 Search PubMed.
- M. F. Mutz, G, H, I and K Crystal Forms of Imatinib Mesylate, Patent WO2007059963, 2007.
- K. Amala, R. T. Srinivasa, K. S. B. R. Adibhatla, S. Rachakonda, C. N. Venkaiah and K. Podili, Novel Polymorphic Form of Imatinib Mesylate and a Process for Its Preparation, Patent WO2005077933A1, 2005.
- R. B. Parthasaradhi, R. K. Rathnakar, R. R. Raji, R. D. Muralidhara, R. K. S. Subash and H. D. Limited, Novel Polymorphs of Imatinib Mesylate, Patent WO2004106326A1, 2004.
- S. L. Pathi, R. Puppala, R. N. Kankan, D. R. Rao, C. Limited and C. Wain, Stable Crystal Form of Imatinib Mesylate and Process for the Preparation Thereof, Patent WO2006024863A1, 2006.
- H. Patel, R. Jani and R. Thennati, Imatinib Mesylate Crystal Form and Process for Preparation Thereof, Patent WO2006048890A1, 2006.
- A. K. Kompella, K. S. B. R. Adibhatla, K. Podili and C. N. Venkaiah, Polymorphic Forms of Imatinib Mesylate, Patent WO2006054314A1, 2006.
- M. Mutz, Delta and Epsilon Crystal Forms of Imatinib Mesylate, Patent WO2007023182, 2007.
- A. Kompella, B. R. K. Adibhatla, P. R. Muddasani, S. Rachakonda, V. K. Gampa and P. K. Dubey, A Facile Total Synthesis for Large-Scale Production of Imatinib Base, Org. Process Res. Dev., 2012, 16(11), 1794–1804, DOI:10.1021/op300212u.
- M. Szelagiewicz, C. Marcolli, S. Cianferani, A. P. Hard, A. Vit, A. Burkhard, M. Von Raumer, U. C. Hofmeier, A. Zilian, E. Francotte and R. Schenker, In Situ Characterization of Polymorphic Forms: The Potential of Raman Techniques, J. Therm. Anal. Calorim., 1999, 57(1), 23–43, DOI:10.1023/A:1010184805966.
- F. Wang, J. A. Wachter, F. J. Antosz and K. A. Berglund, An Investigation of Solvent-Mediated Polymorphic Transformation of Progesterone Using in Situ Raman Spectroscopy, Org. Process Res. Dev., 2000, 4(5), 391–395, DOI:10.1021/op000210w.
- T. Ono, J. H. Ter Horst and P. J. Jansens, Quantitative Measurement of the Polymorphic Transformation of L-Glutamic Acid Using In-Situ Raman Spectroscopy, Cryst. Growth Des., 2004, 4(3), 465–469, DOI:10.1021/cg0342516.
- N. E. B. Briggs, U. Schacht, V. Raval, T. McGlone, J. Sefcik and A. J. Florence, Seeded Crystallization of β- L -Glutamic Acid in a Continuous Oscillatory Baffled Crystallizer, Org. Process Res. Dev., 2015, 19(12), 1903–1911, DOI:10.1021/acs.oprd.5b00206.
- C. Kalakech, A. Madmar, E. Gagnière, G. Agusti, D. Mangin, S. Lafont, M. Le Hir, M. Monnot, C. Charcosset and E. Chabanon, Monitoring of Paracetamol Solvent-Mediated Phase Transformation in Seeded Batch Crystallization Processes, Cryst. Growth Des., 2025, 25(7), 2056–2070, DOI:10.1021/acs.cgd.4c01650.
- C. L. Burcham, M. F. Doherty, B. G. Peters, S. L. Price, M. Salvalaglio, S. M. Reutzel-Edens, L. S. Price, R. K. R. Addula, N. Francia, V. Khanna and Y. Zhao, Pharmaceutical Digital Design: From Chemical Structure through Crystal Polymorph to Conceptual Crystallization Process, Cryst. Growth Des., 2024, 24(13), 5417–5438, DOI:10.1021/acs.cgd.3c01390.
- M. Fujiwara, Z. K. Nagy, J. W. Chew and R. D. Braatz, First-principles and direct design approaches for the control of pharmaceutical crystallization, J. Process Control, 2005, 15(5), 493–504, DOI:10.1016/j.jprocont.2004.08.003.
- S. Vedantam and V. Ranade, Crystallization: Key thermodynamic, kinetic and hydrodynamic aspects, Sadhana, 2013, 38, 1287–1337, DOI:10.1007/s12046-013-0195-4.
- A. D. Randolph and M. A. Larson, Theory of Particulate Processes: Analysis and Techniques of Continuous Crystallization, Academic Press, 1988, DOI:10.1016/B978-0-12-579652-1.X5001-7.
- K. Maddeboina, B. Yada, S. Kumari, C. McHale, D. Pal and D. L. Durden, Recent Advances in Multitarget-Directed Ligands via in Silico Drug Discovery, Drug Discovery Today, 2024, 29(3), 103904, DOI:10.1016/j.drudis.2024.103904.
- C. L. Burcham, Crystalline compound and a process for its preparation, US Pat., 8299059, issued October 30, 2012 Search PubMed.
- F. P. Byrne, S. Jin, G. Paggiola, T. H. M. Petchey, J. H. Clark, T. J. Farmer, A. J. Hunt, C. Robert McElroy and J. Sherwood, Tools and Techniques for Solvent Selection: Green Solvent Selection Guides, Sustainable Chem. Processes, 2016, 4(1), 1–24, DOI:10.1186/S40508-016-0051-z.
- J. Aronhime and M. Teiler, Solid State Development and Processing of Pharmaceutical Molecules: Salts, Cocrystals, and Polymorphism, Opportunities and Challenges for Generic Development from a Solid-state Perspective, 2022, vol. 79, pp. 481–530, DOI:10.1002/9783527823048.ch11.
- A. M. Hamdani, I. A. Wani and N. A. Bhat, Sources, structure, properties and health benefits of plant gums: A review, Int. J. Biol. Macromol., 2019, 135, 46–61, DOI:10.1016/j.ijbiomac.2019.05.103.
- N. A. Devi, M. A. Hadi, P. Rajitha, J. V. C. Sharma and A. Srinivasa Rao, Formulation and evaluation of floating controlled release tablets of imatinib mesylate using hydrophilic matrix system, Int. J. Pharm. Pharm. Sci., 2013, 5(1), 271–277 CAS.
- A. Joseph, C. E. Bernardes, A. I. Druzhinina, R. M. Varushchenko, T. Y. Nguyen, F. Emmerling, L. Yuan, V. Dupray, G. Coquerel and M. E. M. da Piedade, Polymorphic phase transition in 4′-hydroxyacetophenone: equilibrium temperature, kinetic barrier, and the relative stability of Z′= 1 and Z′= 2 forms, Cryst. Growth Des., 2017, 17(4), 1918–1932, DOI:10.1021/acs.cgd.6b01876.
- D. Kashchiev, D. Verdoes and G. M. van Rosmalen, Induction time and metastability limit in new phase formation, J. Cryst. Growth, 1991, 110(3), 373–380, DOI:10.1016/0022-0248(91)90273-8.
- H. Wu, M. White, R. T. Berendt, R. D. Foringer and K. Mansoor, Integrated Process Analytical Technology Approach for Nucleation Induction Time Measurement and Nucleation Mechanism Assessment for a Dynamic Multicomponent Pharmaceutical Antisolvent Crystallization System, Ind. Eng. Chem. Res., 2014, 53(14), 1688–1701, DOI:10.1021/ie4036466.
- Y. Yoshihashi, E. Yonemochi, Y. Maeda and K. Terada, Prediction of the induction period of crystallization of naproxen in solid dispersion using differential scanning calorimetry, J. Therm. Anal. Calorim., 2010, 99, 15–19, DOI:10.1007/s10973-009-0480-y#citeas.
- R. J. Arruda, P. A. Cally, A. Wylie, N. Shah, I. Joel, Z. A. Leff, A. Clark, G. Fountain, L. Neves, J. Kratz, A. A. Thorat, I. Marziano, P. R. Rose, K. P. Girard and G. Capellades, Automated and material-sparing workflow for the measurement of crystal nucleation and growth kinetics, Cryst. Growth Des., 2023, 23(5), 3845–3861 CrossRef CAS.
Footnote |
| † Equal contribution. |
| This journal is © The Royal Society of Chemistry 2026 |