 Open Access Article
Bandgap engineering in quasi-1D Zr1−xTixS3 (0 ≤ x ≤ 1) solid solutions
Dmitry S. Muratov *a,
Ettore Bianco
 a,
Dmitry Karpenkov
 b,
Alberto Castelleroa,
Alexey Lipatov
 c,
Valter Maurino
 a and
Alexander Sinitskii
 *de
*de
aDepartment of Chemistry, University of Turin, Turin, 10125, Italy. E-mail: dmitry.muratov@unito.it
bDepartment of Magnetism, Lomonosov Moscow State University, Leninskie Gory, Moscow 119991, Russia
cDepartment of Chemistry, Biology & Health Sciences, South Dakota Mines and Technology, Rapid City, SD57701, USA
dDepartment of Chemistry, University of Nebraska-Lincoln, Lincoln, NE 68588, USA. E-mail: sinitskii@unl.edu
eNebraska Center of Materials and Nanoscience, University of Nebraska-Lincoln, Lincoln, NE 68588, USA
First published on 8th August 2025
Abstract
TiS3 and ZrS3 are quasi-one-dimensional materials from the family of transition metal trichalcogenides with the general composition MX3, where M is a transition metal and X is a chalcogen. Although isostructural, TiS3 and ZrS3 have very different bandgaps of approximately 1 eV and 2 eV, respectively. Consequently, Zr1−xTixS3 solid solutions are promising for achieving a composition-dependent bandgap that is tunable across a broad spectral range, from visible to infrared, for various electronic and optoelectronic applications. Previous studies demonstrated the synthesis of Zr1−xTixS3 solid solutions from elemental precursors at 800 °C, but only in a narrow compositional range of 0 ≤ x ≤ 0.33, while higher Ti content led to the formation of a secondary TiS2 phase. In this work, we optimized the synthetic conditions and produced the entire range of Zr1−xTixS3 solid solutions (0 ≤ x ≤ 1) via a direct reaction between Zr–Ti alloys and sulfur vapor at a lower temperature of 600 °C. All Zr1−xTixS3 compositions crystallized as needle-like structures within the P21/m space group, with lattice parameters increasing with the Zr content, as confirmed by X-ray diffraction analysis. The optical bandgaps of the prepared crystals were within the 1 to 2 eV range and also increased with the Zr content, demonstrating that synthesis of Zr1−xTixS3 solid solutions is a viable route for bandgap engineering in transition metal trichalcogenides.
Introduction
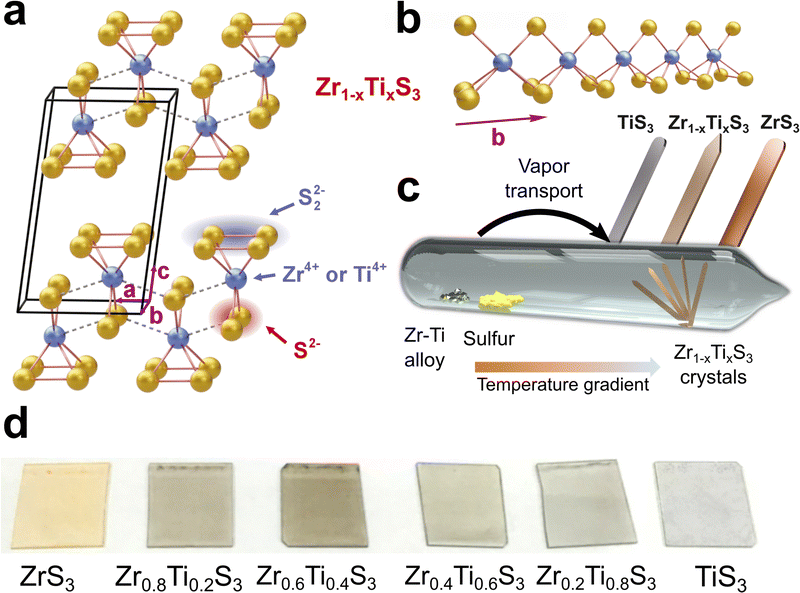
Transition metal trichalcogenides (TMTCs) are quasi-one-dimensional (quasi-1D) materials with the general composition MX3, where M is a transition metal such as Ti, Zr, Hf, Ta, or Nb and X is S, Se, or Te.1–5 Members of the TMTC family exhibit intriguing physical phenomena, including temperature-dependent metal–insulator transitions, charge density waves, and superconductivity,3–8 possess remarkable properties, such as anisotropic electronic transport9–12 and high breakdown current densities,13,14 and show promise for numerous electronic and optoelectronic applications,5,15 ranging from field-effect transistors,11,16,17 polarization-sensitive photodetectors,18–21 and printed electronics22 to thermoelectric converters,23,24 gas sensors,25–28 and charge transport materials in light-emitting devices.29 Many of these applications benefit from the variable bandgaps of TMTCs that can be either metallic, such as TaS3 and NbSe3, have small bandgaps of about 1 eV or less, such as TiS3, ZrSe3, and HfSe3, or have bandgaps around 2 eV or larger, such as ZrS3 and HfS3.5 Interestingly, despite the great diversity of TMTC materials, they do not cover the visible-to-near-infrared range from 1 to 2 eV, which is crucial for many optoelectronic and photonic technologies. Materials with bandgaps in this range are commonly used for efficient light absorption and charge carrier generation in photovoltaic devices.30 They are also employed in light-emitting devices and photodetectors for telecommunications, integrated photonics, biomedical imaging, and many other applications. Therefore, the potential applications of TMTCs could be significantly expanded if these materials were engineered to exhibit tunable bandgaps within the 1–2 eV range.In this work, for the bandgap engineering in TMTCs we considered solid solutions of TiS3 and ZrS3. These are isostructural compounds that have a monoclinic ZrSe3-type crystal structure (space group P21/m) that is schematically shown in Fig. 1a and b. TiS3 has a bandgap of about 1 eV,31–33 while ZrS3 has a larger bandgap of about 2 eV.2,12,34,35 Therefore, Zr1−xTixS3 solid solutions (0 ≤ x ≤ 1) provide a promising material platform for realizing a composition-dependent bandgap that is tunable across a broad spectral range, from visible to infrared.
Several previous works focused on the synthesis and characterization of Zr1−xTixS3 solid solutions.36–39 Gard and co-workers performed spectroscopic studies of Zr1−xTixS3 (0 ≤ x ≤ 1) crystals37 although did not disclose their preparation and referenced a prior study.36 However, that study by Sieber and co-workers, which investigated chemical vapor transport reaction between metallic Ti, Zr and sulfur vapor at 800 °C, reported the synthesis of Zr1−xTixS3 solid solutions only with 0 ≤ x ≤ 0.33.36 We also studied the reaction between the metals and sulfur at 800 °C and reached a similar conclusion that under these conditions the Zr1−xTixS3 solid solutions can only be obtained in a narrow compositional range.39 When a high titanium content is used in the precursor mixture, the resulting Zr1−xTixS3 crystals still have x < 0.33, while the Ti excess results in the formation of a secondary TiS2 phase.39 Therefore, while prior literature suggests that Zr1−xTixS3 solid solutions with x > 0.33 are realistic, the procedure for their synthesis remains missing in literature. In this study, we aimed to address this gap in knowledge and establish synthetic procedures for the entire series of solid solutions with 0 ≤ x ≤ 1, which is necessary to cover the whole 1–2 eV range of bandgaps with Zr1−xTixS3 compounds.
We optimized the synthetic conditions and produced the entire range of Zr1−xTixS3 solid solutions (0 ≤ x ≤ 1) via a direct reaction between Zr–Ti alloys and sulfur vapor at a lower temperature of 600 °C. We demonstrate that the resulting Zr1−xTixS3 compositions formed needle-like crystals, consistent with the quasi-1D structure of ZrSe3-type compounds. The lattice parameters of Zr1−xTixS3 solid solutions systematically increased with the Zr content, as confirmed by X-ray diffraction analysis. The optical bandgaps of the prepared crystals were within the 1 to 2 eV range and linearly increased with the Zr content, demonstrating that Zr1−xTixS3 solid solutions are viable route for bandgap engineering in TMTC materials for electronic and optoelectronic applications.
Results and discussion
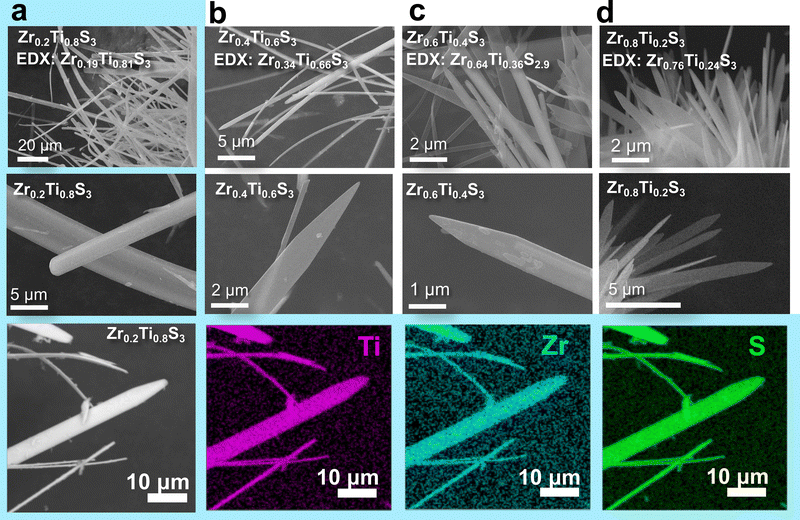
Previous reports on the synthesis of Zr1−xTixS3 crystals utilized pure powders of Ti and Zr as precursors and noted that even when employing high titanium-to-zirconium ratios, the resulting solid solutions were deficient in titanium.36,38,39 This could be due to the difference in the vapor pressures of Ti and Zr under the chosen synthetic conditions. Our approach, involving precisely controlled Zr1−xTix alloys instead of mixtures of elemental Zr and Ti (Fig. 1c), aimed to achieve a more even evaporation of the metallic precursors.39 However, we also observed a reduced titanium concentration in the produced Zr1−xTixS3 solid solutions when the ampoules were annealed at 800 °C.39 In this study, we attempted synthesis of Zr1−xTixS3 crystals at different temperatures and found that when the temperature is reduced from 800 °C to 600 °C, the resulting solid solutions have the same Ti/Zr ratio as in the precursor alloys. The reaction products were imaged by optical (Fig. 1d) and scanning electron microscopy (SEM), and their composition was confirmed by energy-dispersive X-ray spectroscopy (EDX), see Fig. S1–S4. In Fig. 2, we demonstrate SEM images of all Zr1−xTixS3 crystals as well as provide EDX mapping data for Zr0.2Ti0.8S3, the solid solution with the highest titanium content, while EDX maps for other compositions are shown in Fig. S5. The maps show that for all Zr1−xTixS3 compositions the elements are evenly distributed throughout the crystals.Most of the Zr1−xTixS3 crystals had similar shapes across different Ti/Zr ratios. The ends of the solid solution crystals were typically sharp, resembling a sword tip, while pure ZrS3 and TiS3 crystals had rounded tips, see Fig. 2 as well as Fig. S6 and S7. Based on the shapes of these needle-like crystals, it can be concluded that the fastest growth occurs in the b direction of 1D chains in the structure (Fig. 1b). According to the Burton–Cabrera–Frank (BCF) theory of crystal growth mechanics,40 the surface of a growing crystal needs an atomic kink or an open step to promote further growth. For a Zr1−xTixS3 solid solution crystal, particularly when the Ti/Zr ratio is about 1![[thin space (1/6-em)]](https://www.rsc.org/images/entities/char_2009.gif) :
:![[thin space (1/6-em)]](https://www.rsc.org/images/entities/char_2009.gif) 1, this kink forms naturally due to the presence of two types of atoms with the same number of valence electrons but differing atomic radii (0.160 nm for Zr and 0.147 nm for Ti). This difference in atomic radii significantly accelerates growth along the b direction, giving the crystals their sword-like shapes. The ‘sword’ edges could be formed by the planes with high-h (h11) Miller indices, where h > 3. These planes form because of the large discrepancy between the growth rates along the b direction and at oblique angles to it. A simple evaluation of the crystal shapes indicates that the growth rate along the b direction should be at least three times higher for the Zr1−xTixS3 solid solutions compared to pristine ZrS3 and TiS3 under the same conditions (Fig. S8).
1, this kink forms naturally due to the presence of two types of atoms with the same number of valence electrons but differing atomic radii (0.160 nm for Zr and 0.147 nm for Ti). This difference in atomic radii significantly accelerates growth along the b direction, giving the crystals their sword-like shapes. The ‘sword’ edges could be formed by the planes with high-h (h11) Miller indices, where h > 3. These planes form because of the large discrepancy between the growth rates along the b direction and at oblique angles to it. A simple evaluation of the crystal shapes indicates that the growth rate along the b direction should be at least three times higher for the Zr1−xTixS3 solid solutions compared to pristine ZrS3 and TiS3 under the same conditions (Fig. S8).
We found that the size of the crystals strongly depends on the Ti/Zr ratio in the resulting solid solution. At high Ti/Zr ratios, the crystals grow significantly larger, reaching widths greater than 5 or even 10 μm. In contrast, at lower Ti/Zr ratios, the width of a single ribbon is typically less than 2 μm. It is important to note that all the crystals discussed above and shown in Fig. 2 were synthesized at 600 °C, using comparable masses of alloy precursors, same temperature gradient, and synthesis time. To achieve crystals of the same size for each composition, the synthesis conditions should be individually adjusted for each case.
All Zr1−xTixS3 crystals are reasonably stable in ambient conditions, and their degradation becomes noticeable only after weeks of storage in air. SEM images of samples after long-term storage in air reveals the formation of particles with characteristic shapes of anatase platelets41 on the surface of Zr1−xTixS3 crystals (Fig. S9), which also correlates with the increased oxygen content in EDX spectra (Fig. S10). In order to ensure that we analyzed pure solid solutions rather than samples containing oxidation products, all the materials characterization was performed on freshly prepared Zr1−xTixS3 crystals.
We studied the effect of chemical composition of solid solutions on their bond vibrations. Fig. 3a shows Raman spectra of all obtained compositions of Zr1−xTixS3 solid solutions, as well as the spectra of pristine ZrS3 and TiS3. For the Raman peaks of Zr1−xTixS3 solid solutions we used the same labelling approach as in ref. 42 for ZrS3 and ZrSe3. We observed a nearly linear change in the position of the A3g peak with the increasing Ti content, from 154 cm−1 in pristine ZrS3 to 179 cm−1 in TiS3, due to the almost twofold difference in atomic masses of Zr and Ti (Fig. 3b). The vibration scheme for this peak is shown in Fig. 3c.
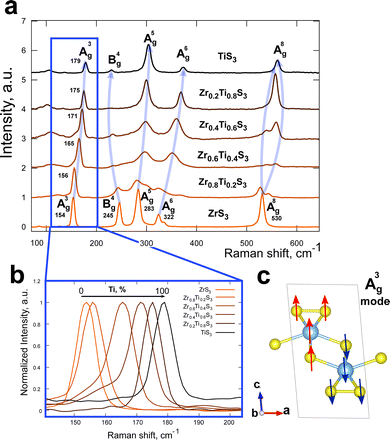 | ||
| Fig. 3 (a) Raman spectra of Zr1−xTixS3 crystals with (b) the A3g peak position depending on the Ti/Zr ratio in a solid solution and (c) graphical representation of the A3g vibration mode. | ||
We found a different trend for the B4g vibration mode, which is observed at 245 cm−1 for ZrS3. This band was not previously discussed in studies that employed a green 532 nm laser as the excitation source, where the B4g peak was reported to have very low intensity.42–44 Here, with a 780 nm laser, the B4g mode band is very prominent in ZrS3 and has a lower intensity in TiS3. We also note that its intensity inversely correlates with the amount of Ti in the solid solutions, with the lowest intensity observed in Zr0.2Ti0.8S3. The position of the B4g band changes differently compared to the A3g band, being smallest in Zr0.2Ti0.8S3 and largest in ZrS3 (230 and 245 cm−1 respectively).
An interesting observation was made for the highest-frequency band A8g located at 530 cm−1 in ZrS3. This band splits in all studied solid solution crystals, indicating the formation of new vibration modes in the Zr1−xTixS3 system. Finally, the positions of the A5g and A6g bands shift from lower to higher wavenumbers with the increasing Ti content.
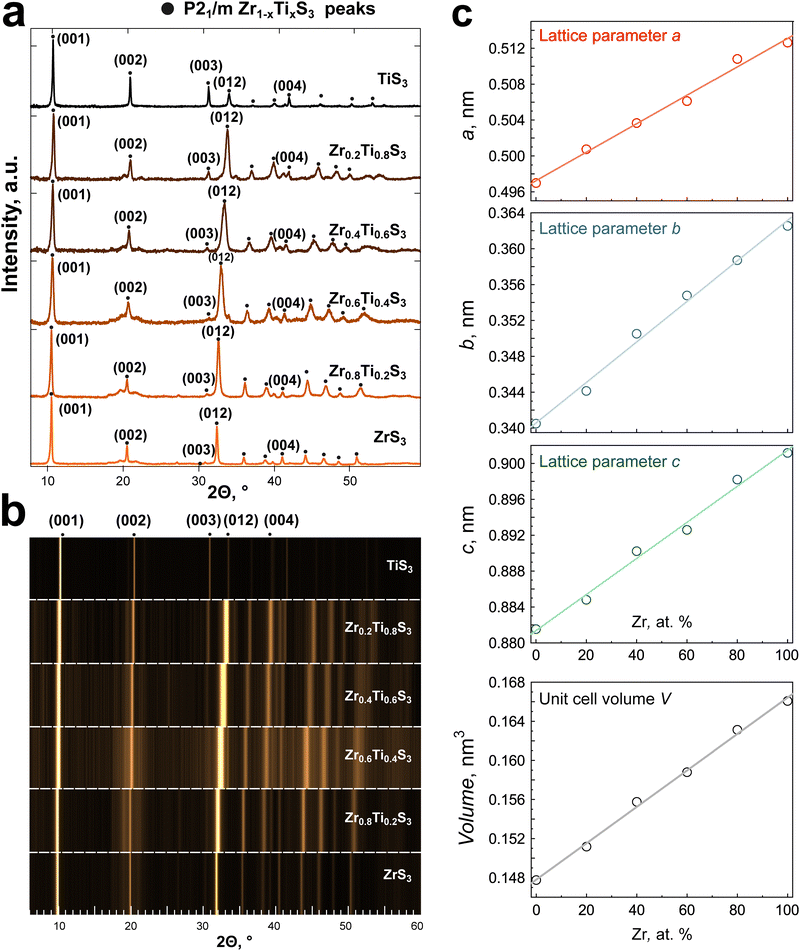
The structural parameters of the Zr1−xTixS3 solid solutions were identified using X-ray diffraction (XRD) analysis. The XRD patterns for all synthesized compounds are presented in Fig. 4, while the corresponding lattice parameters are summarized in Table S1. All diffractograms display very similar patterns, with the most intense reflections coming from the (001) and (012) planes (Fig. 4a). The XRD patterns exhibit texture due to the needle-like shape of the crystals. Starting from 2Θ = 30°, we observe a gradual shift of the peaks that linearly correlates with the Ti/Zr ratio. The dependence is even more prominent in the waterfall presentation of the XRD data in Fig. 4b. We did not detect any additional superstructure peaks, and the a, b, and c lattice parameters, as well as the unit cell volume show a clear linear dependence on the Zr content (Fig. 4c), in agreement with the Vegard's law.45 No correlation was found between the angle β and the composition. The gradual shift in lattice parameters is in agreement with the formation of a substitutional solid solution at any given metal ratio.
Finally, we performed diffuse reflectance spectroscopy of Zr1−xTixS3 solid solutions and calculated their optical bandgaps using the conventional Kubelka–Munk function and the Tauc plot approximation for the linear parts of the spectra (Fig. 5a). We note in passing that TMTC compounds are known for rich excitonic physics,37,46–48 but in this study we specifically focused on the absorption edge energies of Zr1−xTixS3 solid solutions to determine their optical bandgaps. We obtained a close to linear fit of the bandgap values for the investigated Zr1−xTixS3 materials with the composition varying from TiS3 to ZrS3, as shown in Fig. 5b. The optical bandgap of Zr1−xTixS3 solid solutions ranges from 1 to 2 eV. All these values fall within the optimal range for many optoelectronic applications.30 The electronic bandgaps of these compounds should be higher by the values of the corresponding exciton binding energies. While not currently known for Zr1−xTixS3 (0 < x < 1), they are likely comparable to TiS3, for which the exciton binding energy was experimentally shown to be about 0.13 eV.47
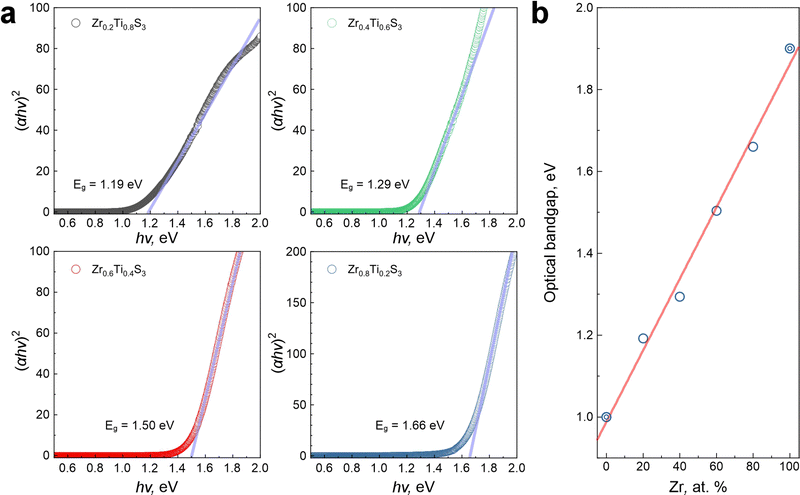 | ||
| Fig. 5 (a) Kubelka–Munk functions and Tauc plots for the diffuse reflectance spectra measured for Zr1−xTixS3 solid solution powders. (b) Linear fit of Zr1−xTixS3 (0 ≤ x ≤ 1) bandgap values including literature data (bullseye circles) for pristine ZrS3 (ref. 12) and TiS3 (ref. 31). | ||
The ease of exfoliation of TMTC materials through simple ultrasonic treatment in various media allows for the production of ready-to-use inks suitable for slot-die,29 inkjet,22 and other printing techniques, opening up numerous potential applications for Zr1−xTixS3 solid solutions. We also note that while it is also possible to modulate bandgaps of TMTCs by varying the chalcogen ratio in solid solutions like ZrS3−xSex,2,49,50 and ZrTe3−xSex,51 the use of toxic chalcogens for this purpose, such as Se and Te, is less practical than the more environmentally friendly Ti/Zr substitution.
Conclusions
A full range of Zr1−xTixS3 solid solutions with x = 0.2 step was successfully synthesized using chemical vapor transport reactions between Zr1−xTix alloys and sulfur vapor in sealed quartz ampoules at 600 °C. The structure and composition of solid solutions were confirmed through XRD, EDX, and Raman measurements. In particular, EDX analysis confirmed uniform distribution of Ti, Zr, and S within the crystals. In line with the Vegard's law, the refined lattice parameters a, b and c of Zr1−xTixS3 crystals display a linear dependence on the Zr content, which is consistent with the formation of substitutional solid solutions.Our study demonstrates the ability to control the optical bandgap of Zr1−xTixS3 solid solutions by varying the metal ratio in the precursor alloy used for synthesis. The lowest bandgap value of 1.19 eV was determined for Zr0.2Ti0.8S3, while the highest was 1.65 eV for Zr0.8Ti0.2S3. Considering the known bandgaps of TiS3 and ZrS3 of about 1 and 2 eV, respectively, the resulting dependence of the bandgap of Zr1−xTixS3 on the Zr content is nearly linear, suggesting a straightforward preparation of solid solutions with desired bandgaps in the 1–2 eV range while maintaining the same ZrSe3-type structure as in pristine TiS3 and ZrS3. The study demonstrates a simple and practical route for bandgap engineering in TMTC materials in the technologically important 1–2 eV range, suggesting their relevance to photovoltaics, light-emitting devices and photodetectors for telecommunications, integrated photonics, biomedical imaging, and many other optoelectronic applications.
Experimental
Synthesis of precursor alloys
Zr1−xTix alloys were produced by co-melting of pure Ti and Zr metals using a high-vacuum arc-melting furnace. Titanium and zirconium were mixed in 20/80, 40/60, 60/40, and 80/20 molar ratios, and the chemical compositions of the resulting Zr1−xTix alloys were confirmed by EDX, as shown in Table S2.Synthesis of Zr1−xTixS3 solid solutions
The Zr1−xTix alloys were ground into coarse particles and sealed under vacuum in separate quartz tubes with elemental sulfur. In a typical synthesis, we used 300–400 mg of a Zr1−xTix alloy and a calculated amount of sulfur for obtaining stoichiometric Zr1−xTixS3 solid solutions. All solid solution crystals were synthesized at 600 °C in a tube furnace (Lenton LHC 12/750). The precursor materials were located directly in the center of the furnace (Fig. 1c), while the other side of the ampoule was kept a few centimeters away from the hot zone, forming a small temperature gradient along the ampoule. For the synthesis of TiS3 and ZrS3 crystals, we also prepared similar quartz tubes, in which sulfur was sealed with Ti or Zr powders, respectively. TiS3 was synthesized at 500 °C while ZrS3 was obtained at 800 °C. The produced crystals were then dispersed in isopropyl alcohol (10 mg mL−1) and treated in an ultrasonic bath for 1.5 h to get stable dispersions. These dispersions were then printed with a slot-die Ossila printer on glass slides to test the ink deposition and prepare samples for optical measurements. The resulting samples are shown in the series of optical photographs in Fig. 1d.Characterization methods
SEM imaging was performed using a Tescan Vega 3 scanning electron microscope with an integrated AZtec EDX module from Oxford Instruments. Raman spectroscopy was performed using a Thermo DXR Raman microscope with a 780 nm solid-state laser. XRD patterns were recorded using a PANalytical X'Pert instrument with Cu Kα radiation. Crystallographic data from the powder X-ray diffraction patterns were obtained using Le Bail profile fitting performed with BGMN package included within Profex software.52 Diffuse reflectance spectra were measured using a Cary 5000 UV-visible spectrometer.Author contributions
Dmitry S. Muratov: conceptualization, data curation, formal analysis, investigation, methodology, visualization, writing – original draft, review and editing. Ettore Bianco: investigation. Dmitry Karpenkov: data curation, investigation, methodology. Alberto Castellero: resources, methodology. Alexey Lipatov: data curation, formal analysis, investigation, methodology, visualization, writing – original draft, review and editing. Valter Maurino: formal analysis, funding acquisition, project administration, resources, writing – review & editing. Alexander Sinitskii: conceptualization, data curation, formal analysis, funding acquisition, investigation, project administration, writing – original draft, review and editing.Conflicts of interest
There are no conflicts to declare.Data availability
The authors confirm that the data supporting the findings of this study are available within the article or included in SI, any additional data are available on request from the authors.Refined lattice parameters, EDX spectra and SEM images of crystals and crystal shape description. See DOI: https://doi.org/10.1039/d5tc02480c
Acknowledgements
The authors acknowledge support from the Project CH4.0 under the MUR program “Dipartimenti di Eccellenza 2023–2027” (CUP: D13C22003520001). The work was also supported by the National Science Foundation through awards OIA-2044049 (synthesis of solid solutions) and OSI-2329159 (materials characterization). DSM thanks Vladislav Vanyushin for his contribution to the development of the synthetic approach used in this work.39References
- S. Furuseth, L. Brattås, A. Kjekshus, A. F. Andresen and P. Fischer, Acta Chem. Scand., Ser. A, 1975, 29, 623–631 CrossRef.
- L. Brattas and A. Kjekshus, Acta Chem. Scand., 1972, 26, 3441–3449 CrossRef CAS.
- M. D. Randle, A. Lipatov, I. Mansaray, J. E. Han, A. Sinitskii and J. P. Bird, Appl. Phys. Lett., 2021, 118, 210502 CrossRef CAS.
- A. A. Balandin, F. Kargar, T. T. Salguero and R. K. Lake, Mater. Today, 2022, 55, 74–91 CrossRef.
- M. Chen, L. Li, M. Xu, W. Li, L. Zheng and X. Wang, Research, 2023, 6, 66 CrossRef CAS PubMed.
- S. Ghosh, S. Rumyantsev and A. A. Balandin, Appl. Phys. Rev., 2024, 11, 21405 CAS.
- A. V. Frolov, A. P. Orlov, F. Gay, A. A. Sinchenko and P. Monceau, Appl. Phys. Lett., 2021, 118, 213102 CrossRef CAS.
- M. Randle, A. Lipatov, A. Kumar, C.-P. Kwan, J. Nathawat, B. Barut, S. Yin, K. He, N. Arabchigavkani, R. Dixit, T. Komesu, J. Avila, M. C. Asensio, P. A. Dowben, A. Sinitskii, U. Singisetti and J. P. Bird, ACS Nano, 2019, 13, 803–811 Search PubMed.
- I. G. Gorlova, S. G. Zybtsev and V. Y. Pokrovskii, JETP Lett., 2014, 100, 256–261 CrossRef CAS.
- J. Dai and X. C. Zeng, Angew. Chem., Int. Ed., 2015, 54, 7572–7576 Search PubMed.
- J. O. Island, M. Barawi, R. Biele, A. Almazán, J. M. Clamagirand, J. R. Ares, C. Sánchez, H. S. J. van der Zant, J. V. Álvarez, R. D’Agosta, I. J. Ferrer and A. Castellanos-Gomez, Adv. Mater., 2015, 27, 2595–2601 Search PubMed.
- H. Yi, S. J. Gilbert, A. Lipatov, A. Sinitskii, J. Avila, J. Abourahma, T. Komesu, M. C. Asensio and P. A. Dowben, J. Phys. Condens. Matter, 2020, 32, 29LT01 Search PubMed.
- M. A. Stolyarov, G. Liu, M. A. Bloodgood, E. Aytan, C. Jiang, R. Samnakay, T. T. Salguero, D. L. Nika, S. L. Rumyantsev, M. S. Shur, K. N. Bozhilov and A. A. Balandin, Nanoscale, 2016, 8, 15774–15782 Search PubMed.
- A. Geremew, M. A. Bloodgood, E. Aytan, B. W. K. Woo, S. R. Corber, G. Liu, K. Bozhilov, T. T. Salguero, S. Rumyantsev, M. P. Rao and A. A. Balandin, IEEE Electron Device Lett., 2018, 39, 735–738 Search PubMed.
- J. O. Island, A. J. Molina-Mendoza, M. Barawi, R. Biele, E. Flores, J. M. Clamagirand, J. R. Ares, C. Sánchez, H. S. J. van der Zant, R. D’Agosta, I. J. Ferrer and A. Castellanos-Gomez, 2D Mater., 2017, 4, 022003 Search PubMed.
- J. O. Island, M. Buscema, M. Barawi, J. M. Clamagirand, J. R. Ares, C. Sánchez, I. J. Ferrer, G. A. Steele, H. S. J. van der Zant and A. Castellanos-Gomez, Adv. Opt. Mater., 2014, 2, 641–645 CrossRef CAS.
- A. Lipatov, P. M. Wilson, M. Shekhirev, J. D. Teeter, R. Netusil and A. Sinitskii, Nanoscale, 2015, 7, 12291–12296 CAS.
- X. Wang, K. Wu, M. Blei, Y. Wang, L. Pan, K. Zhao, C. Shan, M. Lei, Y. Cui, B. Chen, D. Wright, W. Hu, S. Tongay and Z. Wei, Adv. Electron. Mater., 2019, 5, 1900419 Search PubMed.
- S. Yang, M. Wu, W. Shen, L. Huang, S. Tongay, K. Wu, B. Wei, Y. Qin, Z. Wang, C. Jiang and C. Hu, ACS Appl. Mater. Interfaces, 2019, 11, 3342–3350 CAS.
- S. J. Gilbert, H. Yi, J. S. Chen, A. J. Yost, A. Dhingra, J. Abourahma, A. Lipatov, J. Avila, T. Komesu, A. Sinitskii, M. C. Asensio and P. A. Dowben, ACS Appl. Mater. Interfaces, 2020, 12, 40525–40531 CAS.
- A. Lipatov, J. Abourahma, G. Viswan, K. Acharya, T. R. Paudel, M. J. Loes, S. Bagheri, A. T. N’Diaye, E. Mishra, T. K. Ekanayaka, M. Zaz, J. Rodenburg, A. Dhingra, R. Streubel, P. A. Dowben and A. Sinitskii, J. Mater. Chem. C, 2023, 11, 9425–9437 CAS.
- S. Baraghani, J. Abourahma, Z. Barani, A. Mohammadzadeh, S. Sudhindra, A. Lipatov, A. Sinitskii, F. Kargar and A. A. Balandin, ACS Appl. Mater. Interfaces, 2021, 13, 47033–47042 Search PubMed.
- C. Wang, C. Zheng and G. Gao, J. Phys. Chem. C, 2020, 124, 6536–6543 Search PubMed.
- N. V. Morozova, I. V. Korobeinikov, K. V. Kurochka, A. N. Titov and S. V. Ovsyannikov, J. Phys. Chem. C, 2018, 122, 14362–14372 Search PubMed.
- N. Rafiefard, A. Iraji Zad, A. Esfandiar, P. Sasanpour, S. Fardindoost, Y. Zou, S. J. Haigh and S. H. H. Shokouh, Microchim. Acta, 2020, 187, 117 Search PubMed.
- V. V. Sysoev, A. V. Lashkov, A. Lipatov, I. A. Plugin, M. Bruns, D. Fuchs, A. S. Varezhnikov, M. Adib, M. Sommer and A. Sinitskii, Sensors, 2022, 22, 9815 Search PubMed.
- M. J. Loes, S. Bagheri, N. S. Vorobeva, J. Abourahma and A. Sinitskii, ACS Appl. Nano Mater., 2023, 6, 9226–9235 CrossRef CAS.
- C. C. Mayorga-Martinez, Z. Sofer, J. Luxa, Š. Huber, D. Sedmidubský, P. Brázda, L. Palatinus, M. Mikulics, P. Lazar, R. Medlín and M. Pumera, ACS Nano, 2018, 12, 464–473 CrossRef CAS PubMed.
- D. S. Muratov, A. R. Ishteev, D. A. Lypenko, V. O. Vanyushin, P. Gostishev, S. Perova, D. S. Saranin, D. Rossi, M. Auf der Maur, G. Volonakis, F. Giustino, P. O. Å. Persson, D. V. Kuznetsov, A. Sinitskii and A. Di Carlo, ACS Appl. Mater. Interfaces, 2019, 11, 48021–48028 CrossRef CAS.
- B. R. Sutherland, Joule, 2020, 4, 984–985 CrossRef.
- H. Yi, T. Komesu, S. Gilbert, G. Hao, A. J. Yost, A. Lipatov, A. Sinitskii, J. Avila, C. Chen, M. C. Asensio and P. A. Dowben, Appl. Phys. Lett., 2018, 112, 52102 CrossRef.
- E. Finkman and B. Fisher, Solid State Commun., 1984, 50, 25–28 CrossRef CAS.
- I. J. Ferrer, J. R. Ares, J. M. Clamagirand, M. Barawi and C. Sánchez, Thin Solid Films, 2013, 535, 398–401 CrossRef CAS.
- H. G. Grimmeiss, A. Rabenau, H. Hahn and P. Ness, Z. Phys. Chem., Abt. A, 1961, 65, 776–783 CAS.
- S. Kurita, J. L. Staehli, M. Guzzi and F. Lévy, Phys. B, 1981, 105, 169–173 CrossRef CAS.
- K. Sieber, B. Fotouhi and O. Gorochov, Mater. Res. Bull., 1983, 18, 1477–1484 CrossRef CAS.
- P. Gard, C. Sourisseau and O. Gorochov, Phys. Status Solidi B, 1987, 144, 885–901 CrossRef CAS.
- P. Gard, F. Cruege, C. Sourisseau and O. Gorochov, J. Raman Spectrosc., 1986, 17, 283–288 CrossRef CAS.
- D. S. Muratov, V. O. Vanyushin, N. S. Vorobeva, P. Jukova, A. Lipatov, E. A. Kolesnikov, D. Karpenkov, D. V. Kuznetsov and A. Sinitskii, J. Alloys Compd., 2020, 815, 152316 CrossRef CAS.
- W. K. Burton, N. Cabrera and F. C. Frank, Nature, 1949, 163, 398–399 CrossRef CAS.
- F. Pellegrino, E. Ortel, J. Mielke, R. Schmidt, V. Maurino and V.-D. Hodoroaba, Adv. Eng. Mater., 2022, 24, 2101347 CrossRef CAS.
- K. Osada, S. Bae, M. Tanaka, H. Raebiger, K. Shudo and T. Suzuki, J. Phys. Chem. C, 2016, 120, 4653–4659 CrossRef CAS.
- A. Zwick, M. A. Renucci and A. Kjekshus, J. Phys. C-Solid State Phys., 1980, 13, 5603–5614 CrossRef CAS.
- J. Y. Harbec, C. Deville Cavellin and S. Jandl, Phys. Status Solidi, 1979, 96, K117–K120 CrossRef CAS.
- L. Vegard, Z. Phys, 1921, 5, 17–26 CrossRef CAS.
- K. N. Boldyrev, E. V. Mostovshchikova, A. N. Titov, V. Y. Pokrovskii and I. G. Gorlova, JETP Lett., 2024, 120, 565–572 CrossRef CAS.
- A. J. Molina-Mendoza, M. Barawi, R. Biele, E. Flores, J. R. Ares, C. Sánchez, G. Rubio-Bollinger, N. Agraït, R. D’Agosta, I. J. Ferrer and A. Castellanos-Gomez, Adv. Electron. Mater., 2015, 1, 1500126 CrossRef.
- Q. Cui, A. Lipatov, J. S. Wilt, M. Z. Bellus, X. C. Zeng, J. Wu, A. Sinitskii and H. Zhao, ACS Appl. Mater. Interfaces, 2016, 8, 18334–18338 CrossRef CAS.
- A. Zwick, G. Landa, R. Carles, M. A. Renucci and A. Kjekshus, Solid State Commun., 1983, 45, 889–893 CrossRef CAS.
- J. Deslandes and S. Jandl, Phys. Rev. B: Condens. Matter. Mater. Phys., 1984, 29, 2088–2090 CrossRef CAS.
- X. Zhu, W. Ning, L. Li, L. Ling, R. Zhang, J. Zhang, K. Wang, Y. Liu, L. Pi, Y. Ma, H. Du, M. Tian, Y. Sun, C. Petrovic and Y. Zhang, Sci. Rep., 2016, 6, 26974 CrossRef CAS.
- N. Doebelin and R. Kleeberg, J. Appl. Crystallogr., 2015, 48, 1573–1580 CrossRef CAS PubMed.
| This journal is © The Royal Society of Chemistry 2025 |

