
 Open Access Article
 This Open Access Article is licensed under a Creative Commons Attribution-Non Commercial 3.0 Unported Licence
Rhombohedral-to-cubic structural phase transition in (LaBi)0.7Ba0.3MnO3 manganites: an investigation on the “Cause and Effect” and magneto caloric response†
Lozil Denzil
Mendonca
 a,
El Kebir
Hlil
b,
Mudiyarsu Subrahmanya
Murari
c and
Mamatha D.
Daivajna
*a
a,
El Kebir
Hlil
b,
Mudiyarsu Subrahmanya
Murari
c and
Mamatha D.
Daivajna
*a
aDepartment of Physics, Manipal Institute of Technology, Manipal Academy of Higher Education, Manipal 576104, Karnataka, India. E-mail: mamatha.daijna@manipal.edu; mamata.shet@yahoo.com
bInstitute Néel, University Grenoble Alpes, CNRS, Grenoble INP, PB 38000 Grenoble, France
cDepartment of Physics, N.M.A.M. Institute of Technology, Nitte 574110, Karkala, Karnataka, India
First published on 23rd June 2025
Abstract
The major objective of this study was to revisit the first reported lanthanum-based colossal magneto resistive manganite (LaBa)MnO3 and substitute lanthanum with bismuth to steadily tune its magnetic transition temperature to different temperature regimes. The substitution was expected to result in structural, morphological and magnetic modifications owing to the Lewis acidic nature of the Bi3+ ion and the large diffusivity of Bi2O3 at high processing temperatures. Unexpectedly, a whole new spectrum of physical properties was observed after Bi3+ substitution in La0.7Ba0.3MnO3. A substitution-induced structural transition from R![[3 with combining macron]](https://www.rsc.org/images/entities/char_0033_0304.gif) c to Pmm was manifested at around 20% of Bi substitution. Reversal to a highly symmetrical structure upon Bi substitution in La-based manganites is rare, so the reason for concentration-dependent phase change was investigated meticulously using X-ray diffraction, Fourier transform infrared spectroscopy and X-ray photoelectron spectroscopy. A-site cationic vacancies generated owing to Bi segregation from the lattice were found responsible for these structural transitions. The temperature-dependent magnetization study revealed Bi3+-assisted steady tuning of the Curie temperature from 333 K to room temperature (293 K) upon 0% to 10% substitution. The exceptional occurrence of transition temperature at 315 K, significant magnetic entropy change of 2.5 J kg−1 K−1 and adiabatic temperature change of ≈1.5 K at a magnetizing intensity of just 2 T in 5% Bi-substituted sample indicate its potential in magnetic refrigeration and medical applications, such as magnetic hyperthermia-based cancer therapy. This work presents a qualitative and preliminary investigation of a magnetic specimen for magnetic hyperthermia using a magnetic isotherm.
c to Pmm was manifested at around 20% of Bi substitution. Reversal to a highly symmetrical structure upon Bi substitution in La-based manganites is rare, so the reason for concentration-dependent phase change was investigated meticulously using X-ray diffraction, Fourier transform infrared spectroscopy and X-ray photoelectron spectroscopy. A-site cationic vacancies generated owing to Bi segregation from the lattice were found responsible for these structural transitions. The temperature-dependent magnetization study revealed Bi3+-assisted steady tuning of the Curie temperature from 333 K to room temperature (293 K) upon 0% to 10% substitution. The exceptional occurrence of transition temperature at 315 K, significant magnetic entropy change of 2.5 J kg−1 K−1 and adiabatic temperature change of ≈1.5 K at a magnetizing intensity of just 2 T in 5% Bi-substituted sample indicate its potential in magnetic refrigeration and medical applications, such as magnetic hyperthermia-based cancer therapy. This work presents a qualitative and preliminary investigation of a magnetic specimen for magnetic hyperthermia using a magnetic isotherm.
Introduction
It has been more than half a century since the discovery of ferromagnetism in a manganese oxide of perovskite structure. G. H. Jonker and J. H. Van Santen,1 during their investigation on nonconventional perovskites (A3+B3+O32−), observed ferromagnetism (FM) when a trace of manganese ion (B) of higher valency (Mn4+) was induced in the compound. The awareness of the cause of ferromagnetism in such oxides led to the development of a plethora of novel manganese perovskites, which are known today as mixed-valent manganites (MVMs). The early works on parent manganites, such as stoichiometric LaMnO3, showed that they crystallize in the orthorhombic structure of the Pnma space group, with the magnetic ground state of A-type antiferromagnetism (AFM) resulting from the antiparallel alignment of FM coupled spins in the successive planes. Notably, if the size criterion is met, perovskites can ideally hold any combination of A and B cations and the corresponding anion. The family of alkaline earth metal-based manganites is one such class of materials. For example, CaMnO3, SrMnO3, and BaMnO3 are some of the early considered G-type AFM manganites.2 The formation of single-phase BaMnO3 was debated, and only in the late 90s was it reported that the hexagonal structure of BaMnO3 belongs to P63/mmc at room temperature (RT) and to P63cm at low temperatures.3,4 BaMnO3 shows a noncollinear AFM structure below 59 K.4 Notably, although the rare-earth (RE) manganites and alkaline-earth (AE) manganites have perovskite structures, they differ in manganese ion valency (LaMnO3:Mn3+, CaMnO3:Mn4+). As a result, the gradual substitution of RE with AE metals establishes holes in the lattice and induces ferromagnetism. To explain the occurrence of FM, a model relating the crystalline structure and induced FM was proposed by Zener.5 The so-called double-exchange interaction model states that if the Mn3+–O2−–Mn4+ configuration has ferromagnetically coupled magnetic spins, then a simultaneous transfer of electrons is energetically possible. The insulating parent shall then display high conductivity upon substitution due to the tendency of the traveling electron to retain its spin orientation parallel to Mn3+ and Mn4+. Thus, unlike their parents, MVMs can display a variety of structural, magnetic, electrical transport and thermal properties depending on the extent of substitution. Even though MVMs show versatile correlated properties, they elicited extensive discussions in the years 1993–1994, when a large negative isotropic change in resistance at the magnetic/electric transition temperatures was observed in bulk Nd0.5Pb0.5MnO36 and La2/3Ba1/3MnOx7 subjected to changing magnetic intensity (H) such change in resistance is coined as Colossal magnetoresistance (CMR). Since then, MVMs were intensely explored to exhibit such resistance changes at RT to employ them in magnetic read heads. Some noteworthy compositions of RE and AE MVMs identified early are La–Ba–MnO3 with CMR ≈ −150%, La–Ca–MnO3 thin films with CMR ≈ −110% at 220 K but 0% at RT and above RT, and La–Sr–MnO3 layered perovskites.8–14Another area of research interest related to manganites is the magneto caloric effect (MCE), which causes a large change in the temperature of the magnetic specimen upon ΔH. The wide interest in MCE is because of its application scope in magnetic refrigeration (MR). Until recently, the RE metal Gd was considered the ideal candidate for MR, but its usage was limited due to the high cost. However, the discovery of a massive MCE in the Gd5Si2Ge2 alloy (Curie temperature TC is about 276 K) in 1997 by Pecharsky and Gschneidner15 escalated research activity for the development of novel, cost-effective, RT MCE materials. MVMs are considered excellent candidates for MR not only due to their MCE response but also their highly tuneable TC, low cost and excellent chemical stability. The effective MCE in MVMs is seen near the magnetic transition temperature, and to date, a vast majority of MVM compositions result in TC close to RT. Due to the extended tolerance of perovskite structures to hosting foreign ions, MVMs can be further substituted by mono-, di-, tri- and tetra-valent cations at the A-site and/or B site to tune their TC to RT. La0.815Sr0.185MnO3 (with a maximum magnetic entropy change (ΔSmaxM) of 7.1 J kg−1 K−1), La0.8Sr0.2MnO3 (7.9 J kg−1 K−1), La0.7Ca0.3−xSrxMnO3 (10.5–6.9 J kg−1 K−1 for x = 0.05–0.25), La0.7Sr0.3Mn1−xTMxO3 (TM: Ni, Cu, and Co; ΔSmaxM = 7, 5.2, and 5 J kg−1 K−1, respectively) and Pr0.63Sr0.37MnO3 (5 J kg−1 K−1) are some examples with TC close to RT and large MCE.16TC tuning can also be achieved by deliberately creating RE and AE deficiency in certain MVM compositions.
Along with CMR and MCE, magnetic nanoparticles (MNPs) of manganites have recently gathered significant attention with regard to magnetic hyperthermia treatment (MHT). Hyperthermia treatment (HT) entails overheating of the subject's body or body parts to eliminate the cancerous tumours. This treatment is rooted in the fact that the healthy cells have higher tolerance to temperatures than cancerous ones. There are two modes of HT: one is the conventional method of heating the entire body with the help of water, and the second is local hyperthermia. Local hyperthermia involves the injection of suitable fluids directly into the tumour or the artery supplying the tumour. An external alternating magnetic field (AMF) induces current flow within the MNPs, and the resistive losses convert the applied magnetic energy into thermal energy. The as-produced heat is used to kill cancerous cells without affecting the healthy tissues. However, the lack of control over heating can lead to temperatures beyond the highest permissible limit (42–43 °C or −107.6–109.4 °F). Nanoparticles of MVMs with controlled heating or cooling efficiency in a narrow temperature range are suitable candidates for MHT.17–22
Considering these findings, solid solutions of La0.7−xBixBa0.3MnO3 MVMs with x = 0, 0.05, 0.1, 0.2, 0.3 and 0.4 were considered for investigation. The first ever phase diagram of La1−xBaxMnO3 (LBMO) (0 ≤ x ≤ 1) was produced by H. L. Ju et al.23 The samples showed a cubic perovskite phase of Pmm space group with the lattice parameter a = 3.906 Å. The ferromagnetic metallic (FMM) phase was stabilised between 0.2 ≤ x ≤ 0.5, with the highest TC, and beyond this range, the magnetic saturation MS declined compared to full saturation. The crystal structure showed structural polymorphism beyond x > 0.5. In contrast, the work of R. C. Budhani24 asserts that the solubility of Ba in LaMnO3 is limited. The phase purity and FMM ground state were stable only up to 35% Ba substitution. The varying limits of phase purity imply the prominence of the synthesis route and annealing conditions in determining the outcome. For instance, the synthesis of La1−xBaxMnO3 (LBMO) at low temperatures caused a cubic-to-rhombohedral transformation at x = 0.25 with phase purity till x = 0.4.25 On the other hand, neutron diffraction studies of vacancy-free LBMO (0 ≤ x ≤ 0.24) uncovered an orthorhombic to rhombohedral phase transition at 10% substitution with stabilization of the FMM behaviour.26 Further, LBMO was half metallic at x = 0.33, owing to which a linear decline of the magnetic moment, and CMR was observed beyond 0.33.27 In MVMs, ideally, divalent substitution of x = 0.3 yields the highest TC and optimal MS due to the specific charge ratio (Mn3+/Mn4+). Thus, based on these findings, the stable, high TC, high MS, rhombohedral La0.7Ba0.3MnO3 was chosen as the starting MVM for continuous Bi3+ substitution in this work. Notably, the final member of the series, namely Bi0.7Ba0.3MnO3, cannot be synthesised under normal conditions. To date, only one research article is published on Ba1−xBixMnO3 (BBMO) by S. Matsumoto et al.,28 which shows that BBMO forms the 9R single phase only from x = 0.05 to 0.12. The cause for mutual insolubility in systems like BaMnO3–BiMnO3 is the ionic size of Ba2+ and Bi3+ compared with Mn4+ and Mn3+.28 The large mismatch in ionic size can be compensated if the heavier atom is slightly compressed; thus, a high-pressure synthesis protocol is usually preferred to obtain BBMO. So far, the only Bi–Ba-based manganite synthesised under high pressure is Bi0.5Ba0.5MnO3. It has a cubic structure with a spin glass nature at low temperatures. The limited solubility of Bi in magnetic compositions, such as BaMnO3, is also reflected in LaMnO3. The study of La1−xBixMnO3 (0 ≤ x ≤ 1) manganite composition showed a structural transition from distorted crystal (orthorhombic or rhombohedral) to cubic beyond x = 0.3 and segregation of the BiMnO3 phase from the single-phase matrix beyond x = 0.5. Most specimens with this composition have shown large CMR effects, even up to 400%.29 The limited solubility of Bi in perovskite matrices, such as LaMnO3 and BaMnO3, despite the similar ionic radii of La3+ and Ba2+, is because of its capability to form anisotropic sp-covalent bonds.30
To sum up, based on the possibility that Bi substitution to a certain composition in La0.7Ba0.3MnO3 would result in diverse structural and magnetic states and TC tuning, a detailed investigation is conducted to understand the structural and magnetic anomalies.
Materials and methods
The polycrystalline specimens of La0.7−xBixBa0.3MnO3 with x = 0, 0.05, 0.1, 0.2, 0.3 and 0.4 were synthesized using the conventional solid-state reaction route. The precursor La2O3 was preheated at 800 °C, and BaCO3 was preheated at 450 °C. MnO2 and Bi2O3 of research-grade purity (99.99%, Sigma Aldrich) were used. While MnO2 was taken in stoichiometric quantities, Bi2O3 was taken in 5% excess. The chemicals were mixed with isopropyl alcohol and stirred continuously using a magnetic stirrer for about 6 hours. Later, wet grinding was performed using an agate mortar and pestle; the mixture obtained was calcined at 800 °C with intermittent grinding. The resultant powder was cold-pressed to form pellets and sintered at 1000 °C. The duration of the soaking temperature was 12 hours for both calcination and sintering, followed by natural cooling to RT.X-ray diffractograms (XRD) were obtained at RT using a Bruker D8 Advance X-ray diffractometer (Cu-Kα radiation, λ = 0.154 nm). The scan range was set to 20°–80° with a step size of 0.02° at a scan rate of 1° per min. The resulting patterns were analysed using the Fullprof Suite software. To complement the structural findings, Fourier transform infrared (FTIR) absorption measurements were carried out using a Bruker Vertex-70 spectrometer in the far-infrared region from 50 to 680 cm−1. Instead of conventional KBr pellets, a high-density polyethylene (HDPE) polymer was used as the background. The finely ground powders were mixed with isopropyl alcohol and coated on HDPE to record IR absorbance signals. The morphology and preliminary assessment of elemental composition were obtained using an Oxford Zeiss Sigma microscope equipped with field-emission scanning electron microscopy (FESEM) and energy dispersive X-ray spectroscopy (EDS). The images were obtained at various magnifications and by probing different locations of the specimen; meanwhile, the elemental composition was also obtained in a similar manner based on small-area and large-area scans. The oxidation states of each element present in the sample, and their bonding and chemical environment were identified using X-ray photoelectron spectroscopy (XPS) measurements performed on a PHI 5000 Versa Probe III using Al–Kα radiation. Temperature-dependent magnetization under an external magnetic intensity of 500 Oe was measured using zero field-cooled warming (ZFCW) and field-cooled cooling (FCC) protocols in the temperature range of 5 to 650 K, depending on the sample requirement. The magnetic isotherms were obtained in the ΔH range of 0 to 50 kOe at and around the TC. The isotherms were corrected for the demagnetization factor (N). The measurements were performed using a Quantum Design (QD) physical property measurement system (PPMS).
Results and discussions
When a new perovskite is designed or an existing perovskite is substituted by a cation at the A or B site, it can deviate from its perovskite structure and get into a non-perovskite form. Therefore, it is essential to assess the probability of formation and stability of the perovskite structure. For a perovskite with the chemical formula ABX3, the probability of formation and stability can be verified using the new tolerance factor . Here, rA, rB and rX are the ionic radii of the A-site ion, B-site ion and anion, respectively, and nA. is the oxidation state of the A-site. For a stable perovskite structure, A and B must be chosen in such a way that rA ≫ rB. Otherwise, as
  , the probability of formation tends to 0, P(τ)→ 0. Further, the octahedral factor
  sets a condition on the choice of rB for a given anion X. If rB ≪ rX, then τ improves beyond the accepted limit and leads to P(τ) → 0. These conditions thus state that for a stable perovskite ground state, τ must be less than 4.18, and μ should be greater than 0.414.31 In this investigation, the chosen perovskite matrix is (LaBiBa)(Mn)O3; thus, the A-site has La3+, Bi3+, and Ba2+ distribution, B-site is occupied by Mn3+ and Mn4+ ions, and X is O2−. Before the estimation of τ, for a given chemical composition, it is necessary to validate the possibility for each cation to occupy the respective site (A or B). To check the possibility of occupation of each cation at a given site, expected to be at A-site and B-site, which charge balance O3 through −6 are considered. Here, they are [La3+Bi3+]Ba2+[Mn3+]Mn4+O36−. Further, among all the cations, Mn and Bi have different stable oxidation states, which would balance the charge of O3 (Mnx+, x: 2 to 7, and Bix+x: 3 and 5). Suppose Bi is in the +5 oxidation state, Mn should be in the +1 oxidative state. As such a pair is not possible, the charge-balancing pairs chosen are [La3+][Mn3+]O3, [Bi3+][Mn3+]O3 and [Ba2+][Mn4+]O3. Based on these assignments, the ionic radii of the A and B-site cations are chosen close to 12 and 6 coordinates, respectively. However, in MVMs, the coordination number can go as low as 8 for highly distorted structures.32–34 For instance, if we consider the coordination number (CN) of the A-site as 9 (which is the most preferred in MVMs) and that of the B-site as 6, (ri: La3+ = 1.216 Å, Bi3+ = 1.24 Å, Ba2+ = 1.47 Å, Mn3+ = 0.645 Å, Mn4+ = 0.53 Å, O2− = 1.4 Å) the estimated value of τ will vary from 1.76 to 1.74 and μ = 0.436, which are well within the range of a stable perovskite structure. Once the probability of formation and stability of the resulting composition are evaluated, it is important to check the solubility of the substituent in the host matrix. Even though the solubility of a substituent is primarily the function of temperature and pressure, the size of the substituent, its valence state, electronegativity, and structure play major roles in determining the solubility. The simple Hume-Rothery rules have been proven pivotal in estimating the solubility of substituents. Of the four simple rules, the first is the size rule, which states that the percentage change (PC) in the crystal radii of the substituent (rs) and host (rh) cannot exceed 15%. If this criterion is satisfied, then the other three can be considered. The valence rule states that complete solubility is achieved when the valence state of the substituent and the host are the same. If they differ, then the solute with a higher valency than the solvent shows extended solubility. The electronegativity rule states that the electronegativities of the two cations should be similar. The structure rule states that the structure of the host lattice and the substituent lattice must be the same.35–39 In this study, as Bi3+ is used to replace La3+, the estimated PC is <2%, which is within the desired limit of solubility as per the size rule. Further, Bi3+ cannot replace Ba2+, Mn3+ or Mn4+ as their PC values are well above 15%. The valence rule holds true as the valence states of the solute cation and the solvent cation are the same, whereas there are concerns with the electronegativity rule and the structure rule. The electronegativities
  of Bi3+, La3+, and Ba2+ are 2.02, 1.1, and 0.89, respectively,40 and the structure of Bi2O3 is monoclinic, whereas the host matrix has a rhombohedral structure. If the electronegativity difference between each cation and the anion
  is considered, the difference for Bi3+ is the smallest (1.42) and can favor polar covalent bonding with oxygen, whereas La–O and Ba–O are ionic in nature. The increased substitution of Bi can thus enhance the covalency of the perovskite matrix. Thus, we can expect limited solubility of Bi3+ in the La0.7Ba0.3MnO3 host.
Room-temperature X-ray diffraction analysis and Rietveld refinement
The intensity (I) versus 2θ XRD plots of each specimen is shown in Fig. 1, consisting of stacked intensities. Upon inspection of the patterns there are certain vivid features displayed by them. The peaks are sharp and grow in intensity (37.65%) with increasing Bi, which means that the samples become increasingly homogenized at the nanometric scale upon substitution. A systematic peak shift towards lower angles is seen, which perhaps indicates the enhancement in d spacing in the crystals upon gradient Bi substitution. Interestingly, striking changes are seen in the XRD pattern after LBB10, particularly the dramatic disappearance of the peak split at around 32.5°. The same is the case with peaks at 39.5°, 52.5°, 57.5°, 67.5°, 72.5°, and 77°. The peak located at 38° vanishes beyond the 10% substitution level. To visualize the abrupt changes in the pattern, the normalized intensity (I/Imax) was plotted against the 2θ − 2θ(Imax). Convincingly, the halfwidth of the major peak showed a sudden drop at LBB20, and the intensity of the peak around 46.5° showed a rapid suppression, contrary to the trend of the other peaks in the normalised XRD pattern. The parent La0.7Ba0.3MnO3 manganite has a rhombohedral distortion belonging to the Rc space group.23 This symmetry is identified by a characteristic fingerprint in its XRD pattern. The major peak under Rc space group will have split corresponding to [110] and [104] planes and are closely spaced. As a result, the major peak appears to hold large halfwidth. The cause for the split is a reduction in the symmetry from the cubic phase to form a lower symmetry structure. The XRD patterns of La0.7−xBixBa0.3MnO3 (x = 0, 0.05, 0.1, 0.2, 0.3, and 0.4) reveal a similar but opposite behaviour, leading to the speculation of concentration-dependent structural reversal from a rhombohedral to a cubic crystal system.
 | ||
| Fig. 1 Stacked XRD patterns of La0.7−xBixBa0.3MnO3 (x = 0, 0.05, 0.1, 0.2, 0.3, and 0.4). Inset is an enlarged view of the region containing the major peaks of the specimens. | ||
To confirm the crystal system and crossover, it is essential to extract the best estimate of Bragg peak intensities (Miller indices, hkl) from the whole diffractogram. Thus, whole powder pattern decomposition (WPPD) was performed using the Le Bail method to extract the intensities41 for the identification of possible space groups and profile matching with a constant scale factor using EDPCR utility of Fullprof software. The details of profile matching and Le Bail fitting (LB) can be found in the (ESI).† The LB method could successfully decompose the whole powder pattern into Rc space group and Pmm space group, respectively, for x ≤ 10 and x ≥ 20. As the next step, Rietveld refinement was performed for structure matching, considering the output parameters of LB fitting (lattice parameters, zero-point, background and profile parameters).
The crystal structure refinement parameters that define a crystal lattice and the reliability score of the refined data, namely, R values, are tabulated in Table 1. The significance of the R values and inferences based on their magnitude can be found in ESI.† The contrasting nature in this context is evident from the clear bifurcation between R values on either side of 10% and 20% substitution. The weighted profile R value (Rwp) is greater than 10 at lower substitution percentages (≤LBB10) and are opposite in trend from LBB20 to LBB40. This indicates that, given the steady background with low intensity throughout the series, the data obtained at higher concentrations belong to a high-symmetry structure (cubic) and those below LBB10 are from lower-symmetry structures (rhombohedral, orthorhombic, tetragonal, monoclinic etc.). For reliable refinement, the Rwp and statistically expressed R value (Rexp) of Rietveld refinement should always converge with Le Bail fitting.42 In this case, they are consistent with each other (Table 1 and Table S1, ESI†), the χ2 value is close to unity, and the Bragg-intensity R values (RB) are small real numbers. These findings along with the linear nature of the difference curve (Fig. 2) with minimal disturbance at peaks establishes the reliability of refinement. Thus, according to whole powder pattern fitting (LB + Rietveld), La0.7−xBixBa0.3MnO3 crystalizes as a rhombohedral structure in the Rc space group up till x = 0.1 and a cubic structure in the Pmm space group emerges at x = 0.2 and sustains till x = 0.4.
| P.Q | Sample code | |||||
|---|---|---|---|---|---|---|
| LBB0 | LBB5 | LBB10 | LBB20 | LBB30 | LBB40 | |
| Space group |
Rc |
Rc |
Rc |
Pmm |
Pmm |
Pmm |
| a = b (Å) | 5.54 | 5.54 | 5.54 | 3.92 | 3.92 | 3.93 |
| c (Å) | 13.50 | 13.51 | 13.53 | |||
| V (Å3) | 358.5 | 358.9 | 359.7 | 60.1 | 60.3 | 60.5 |
| Oxygen position | 0.53 | 0.54 | 0.53 | 0.50 | 0.50 | 0.50 |
| ρ est (g cm−3) | 6.7 | 6.6 | 6.9 | 7.1 | 7.3 | 7.6 |
| ρ mrd (g cm−3) | 5.1 | 5.5 | 6.1 | 6.7 | 4.9 | 4.9 |
| The site occupation numbers | ||||||
| La3+ | 0.70 | 0.65 | 0.59 | 0.48 | 0.38 | 0.26 |
| Bi3+ | 0.00 | 0.05 | 0.10 | 0.21 | 0.318 | 0.426 |
| Ba2+ | 0.30 | 0.30 | 0.31 | 0.31 | 0.32 | 0.32 |
| Mn3+ | 0.70 | 0.70 | 0.71 | 0.71 | 0.72 | 0.72 |
| Mn4+ | 0.30 | 0.30 | 0.30 | 0.31 | 0.30 | 0.31 |
| O2− | 3.00 | 3.03 | 3.00 | 2.98 | 2.98 | 2.96 |
| 〈MN–O〉 (Å) | 1.96 | 1.97 | 1.97 | 1.96 | 1.96 | 1.96 |
| 〈MN–O–Mn〉 (degree) | 169.07 | 167.86 | 169.30 | 180.00 | 180.00 | 179.97 |
| 〈La/Bi–O〉 (Å) | 2.71 | 2.70 | 2.71 | 2.77 | 2.77 | 2.78 |
| 〈Ba–O〉 (Å) | 2.77 | 2.77 | 2.77 | 2.77 | 2.77 | 2.78 |
| 〈O–O〉 (l) (Å) | 2.79 | 2.79 | 2.79 | 2.77 | 2.77 | 2.78 |
| R wp | 12.9 | 12.9 | 12.3 | 10.8 | 9.64 | 9.75 |
| R exp | 10.72 | 10.12 | 9.83 | 9.63 | 8.62 | 8.01 |
| χ 2 | 1.46 | 1.62 | 1.56 | 1.26 | 1.25 | 1.48 |
| R B | 3.73 | 3.81 | 3.92 | 2.72 | 2.43 | 3.17 |
 | ||
| Fig. 2 Rietveld refined XRD patterns of La0.7−xBixBa0.3MnO3 (x = 0, 0.05, 0.1, 0.2, 0.3, and 0.4), showing the observed data (yobs), calculated data (ycal), difference curve (yobs − ycal) and Bragg positions (Bragg pos) for λ1 and λ2. The (hkl) values corresponding to the Rc and Pmm space groups are written at the bottom. The simulated unit cells containing a MnO6 octahedron and La, Ba, and Bi atoms is shown as insets. | ||
Any rhombohedral perovskite structure can be described in terms of a pseudo-cubic unit cell, whose axes correspond to the aristo type (ideal perovskite) with cell parameters as ac and αc ≅ 90°. Space groups, such as Rm, R3m, R32, and R3, can be directly mapped to the aristo type (Pmm) with a pseudo-cubic unit cell of one formula unit with ac = a0 ≈ 4 Å, whereas space groups Rc and R3c have eight formula units or pseudocubic double edge length such that ac = 2a0 ≈ 8 Å. For bipartite structures, namely Rc and R3c, the conventional choice of unit cell is a primitive rhombohedron consisting of two formula units and αr ≅ 60°. It can directly map into a pseudo cube based on the equation  where αr is the rhombohedral included angle or the trigonal angle. Regardless of the pseudo-cubic or rhombohedron structure, it is convenient to use hexagonal axes to describe the crystal lattice. In this representation, the components of the crystals are located with reference to four axes, three of which are set at 120° to each other and have equal length. The fourth axis is perpendicular to the plane of the other three and is referred to as the triad axis. Each component of the pseudo-cubic or rhombohedral crystal will have projections on the triad axis. Based on the hexagonal representation, three parameters, namely octahedron strain (ζ), distortion (d), and rotation (e), can be used to determine the shape and orientation of the BX6 octahedron, and the average X–X bond length (l) will determine its size. The parameter d is relevant only in polar space groups, such as R3m, R3 and R3c. The equations connecting the said parameters are ah = 2l
![[thin space (1/6-em)]](https://www.rsc.org/images/entities/char_2009.gif) cosω,
cosω,  , and
, and  . The term cosω decides the elongation of the hexagonal unit cell and in turn the changes in the pseudo cube along the triad axis. Depending on the sign of ζ, the term (1 + ζ) may act along the elongation axis or against it parallel to the triad axis. The lattice parameters of the pseudo-cube corresponding to the hexagonal lattice system can obtained using the equations
 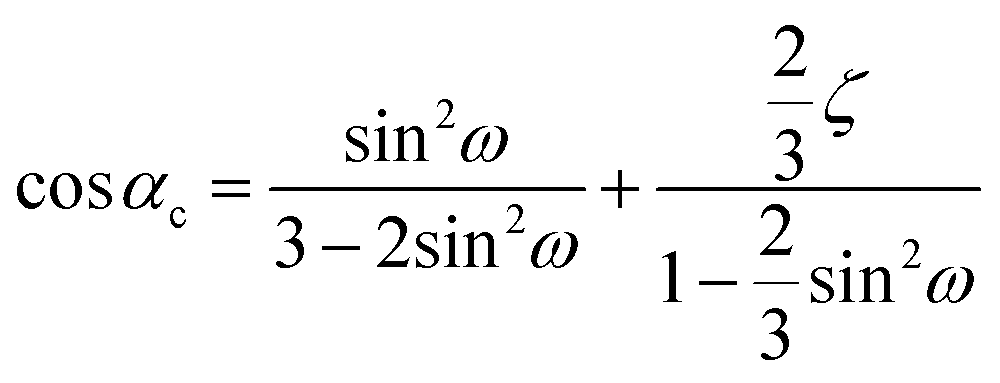 ,
,  , and ch2 = 3ac2(1 + 2cos2ω). In the rhombohedral representation, the rhombohedral included angle is given by
  , and the lattice constant is given by
 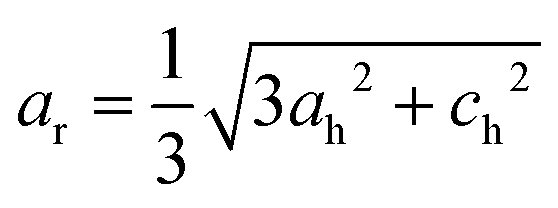 . The detailed description of the geometrical consideration can be found in works of H. D. Megaw, N. W. Thomas, T. Harumoto and A. Gholizadeh.43–46
The variations in the tilt angle, rotation, octahedral strain and lattice parameters corresponding to the pseudo-cube and primitive rhombohedron (Table 2) support the claim of change in crystal symmetry from rhombohedral to cubic. As discussed earlier, for a bipartite structure ac = 2a0 ≈ 8 Å and αc ≅ 90°. In our specimens with lower Bi concentrations, the ac close to 8 Å and αc tends towards 90° upon bismuth substitution. This indicates a tendency of crystallization in a high-symmetry structure, namely cubic. Further if the  ratio of the hexagonal cell takes a unique value of 2.45, the rhombohedral included angle will be equal to 60° and the B–O–B bond angle in this case will be 180°. The structure in this situation is that of an ideal perovskite. If αr is less than 60°, the lattices will expand along the body diagonal [111] of the rhombohedron or the c-axis of the hexagon; meanwhile, if αr is greater than 60°, then the contraction will be observed along the said axes. The increasing trend of the trigonal angle (αr) towards 60° indicates that the lattice experiences compression (rhombohedral representation) for eventual crystallization in the ideal perovskite structure. Because of lattice compression, there will be obvious changes in the MnO6 octahedra. As ζ and e define the shape and orientation of the BX6 octahedron (hexagonal representation), the negative ζ value is a signature of flattened or compressed octahedra, and its reducing magnitude confirms the tendency of achieving an ideal perovskite lattice in which the corners of the octahedron act as the face-centred component (oxygen) of the cube. The increasing trend of cosω supports this fact and indicates elongation. The rotation parameter e is related to the tilt angle ω according to the equation
  . The reducing value of e (at LBB10) establishes that the octahedral tilt tends to revert towards equilibrium about the triad axis. Rhombohedral perovskites are defined as a variant of pseudo cube with nearly regular BX6 octahedra that are tilted (rotated) about the triad axis. If the tilt reduces, the structure will eventually transform into a pseudo cube. All these variations are the consequence of Bi substitution in the rhombohedral perovskite La0.7Ba0.3MnO3, establishing that cationic charges at the A site decide crystal symmetry. To visualize the correlation between the lattice strain (90° − αc), octahedral strain η = (1 + ζ) and octahedral tilt angle ω when the A-site cationic charge changes because of substitution, a set of parametric curves were drawn relating ω and 90°0 − αc (Fig. 3).
| X (in %) | c h/ah | ω (degree) | e | (1 + ζ) | ζ | α c (degrees) | a c (Å) | V c (Å3) | α r (degrees) | a r (Å) | V r (Å3) |
|---|---|---|---|---|---|---|---|---|---|---|---|
| 0 | 2.44 | 6.67 | 0.017 | 0.99 | −0.011 | 90.16 | 7.82 | 478.0 | 59.70 | 5.52 | 118.2 |
| 5 | 2.44 | 7.41 | 0.019 | 0.99 | −0.012 | 90.15 | 7.82 | 478.6 | 59.63 | 5.52 | 118.2 |
| 10 | 2.44 | 6.54 | 0.017 | 0.99 | −0.010 | 90.13 | 7.83 | 479.6 | 59.71 | 5.53 | 118.7 |
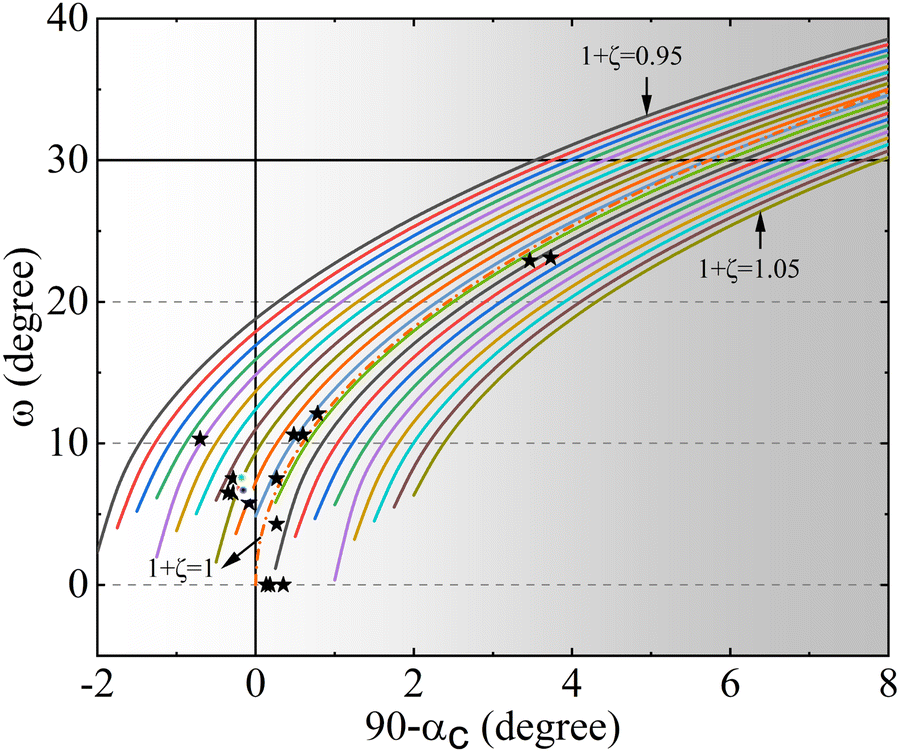 | ||
| Fig. 3 Parametric curves representing the relationship between ω and 90° − αc for equally spaced η. | ||
It is known that the cation at the A site decides the crystal lattice of a perovskite and in turn, leads to octahedral strain and the tilt of the octahedron. These parameters are interrelated and have been characteristically defined for each space group, even for non-rhombohedral crystals. The equation connecting ω, 90° − αc and η is  , where
  and
and  . The procedure for constructing the parametric curves is described by N. W. Thomas.44 In Fig. 3, the horizontal line passing through 30° represents the upper limit for ω to be physically realistic. The vertical line passing through 0 on the X-axis separates polar (right) and non-polar (left) structures, namely R3c and Rc, respectively. The non-titled Rm and R3m structures lie on the line through the zero of the Y-axis. Obviously, the tilted structures R3c and Rc are dispersed away from the X-axis (ω = 0). The white bubbles with RGB colours indicate LBB0, LBB5 and LBB10, respectively, and the stars denote the reference datapoints from the works of H. D. Megaw and N. W. Thomas. The dashed curve joining the X-axis at 0 is the theoretical curve drawn using the equation of cosαc for ζ = 0. Clearly, the bubbles are in the nonpolar branch with small octahedral strain and tilt angle, which tend to move towards the origin. The extent of deviation from the pseudo cube, which is called lattice strain, also reduces, as inferred from the movement of the bubbles towards the abscissa.
Fourier transform infrared spectroscopy
Apart from the X-ray diffraction measurements, insights into structural changes involving variations in the metal–ligand bonds were obtained from light transmission experiments (FTIR spectroscopy).47 The factor group analysis of an ideal perovskite with cubic symmetry (Pmm) predicts three-fold degenerate vibrational modes belonging to 3F1u + 1F2u symmetry.48 The F2u mode is infrared (IR) inactive, and the three F1u modes are IR active. These phonon modes exist in the fingerprint region of the IR spectra and are termed external mode, bending mode and stretching mode, respectively. The external mode is attributed to the vibration of the A-site cation against the BX6 octahedron and exists at lower energies in the far-infrared spectra (150–180 cm−1). The mid-energy F1u mode (around 350 cm−1) characterizes the bending of the B–O bonds. The stretching mode which is highest-energy F1u mode (550–600 cm−1) signifies the stretching of the B–O bonds in the octahedral environment. As the crystal structure changes from higher symmetry (Pmm) to lower symmetry, for instance to Rc, these degenerate IR active modes split into six modes, 3 belonging to Au symmetry and 3 of the 5 Eu symmetry modes.49–51
Fig. 4 displays the FTIR spectra of all the samples in the wavenumber range of 680 cm−1 to 50 cm−1. The spectra show broad distribution of several phonon modes in the said range, with local humps at around 160–170 cm−1, 360–370 cm−1 and 580–610 cm−1 (at lower concentrations, these features could only be seen after baseline corrections). The observed modes confirm the perovskite structure of the prepared samples. However, specimens with lower Bi concentrations show broad absorption bands because they are mostly ionic, and the broad bands appear due to the lattice vibrations. Meanwhile, from LBB20, prominent vibrational modes appear at characteristic frequencies, likely because covalency is established in these samples after Bi substitution. To obtain further insights from the spectra, each spectrum was subjected to baseline correction and deconvoluted to probe the variations in wavenumber (![[v with combining macron]](https://www.rsc.org/images/entities/i_char_0076_0304.gif) ) for each vibrational mode. The corresponding spectra of each specimen are shown in Fig. 5.
) for each vibrational mode. The corresponding spectra of each specimen are shown in Fig. 5.
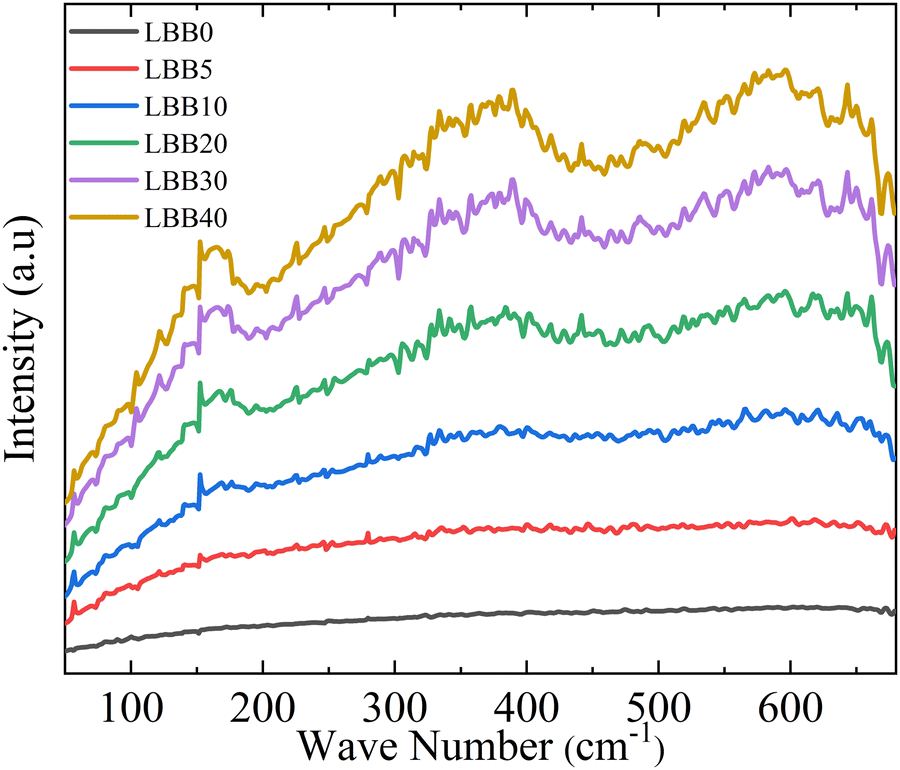 | ||
| Fig. 4 FTIR absorption spectra of La0.7−xBixBa0.3MnO3 (x = 0, 0.05, 0.1, 0.2, 0.3, and 0.4 from bottom to top) in the 680 cm−1 to 50 cm−1 range. | ||
 | ||
| Fig. 5 FTIR spectra of La0.7−xBixBa0.3MnO3 (x = 0, 0.05, 0.1, 0.2, 0.3, and 0.4) after baseline correction. Each spectrum is subjected to deconvolution considering the three characteristic vibrational modes in the far-IR region. The solid lines represent the individual and cumulative data. | ||
Interestingly, the FTIR data support changes in crystal symmetry in the samples under investigation. The clear bifurcation in spectral attributes categorizes the samples into two sets (x = 0 to 0.1: Rset and x = 0.2 to 0.4: Cset). The samples in Rset have vibration modes at around 600–610 cm−1, whereas a sudden shift of 3 to lower values is observed in Cset (notably to 580–600 cm−1). A similar behaviour is seen in external mode, with 1 shifting from ≈170 cm−1 to 155 cm−1. The split of the vibration modes at lower concentrations and the gradual merging of peaks due to the change in crystal symmetry48 with continued Bi substitution are not noticeable, perhaps due to the noisy data or failure to resolve close bands. In fact, the Rc space group has merely a shallow distorted symmetry compared with the aristo-type and may not show noticeable splitting of bands. However, the full width at half maxima (FWHM) of each mode remarkably declines as x changes. This can happen only when the degeneracy of the F1u mode is regained and the modes resulting from the lowering of symmetry (Au and Eu) disappear.52,53 This confirms the change of lattice symmetry essentially from lower to higher.
The fundamental principle behind IR spectroscopy is the absorption of electromagnetic waves corresponding to energies in the IR region. These energies are insufficient to excite an electron but can effectively vibrate covalently bonded atoms, just like a classic spring system. In such a case, the stretching frequency or ; is directly proportional to the bond strength (or force constant: K) and inversely proportional to the effective mass (reduced mass: μ) of the spring system. The expression connecting these physical parameters is 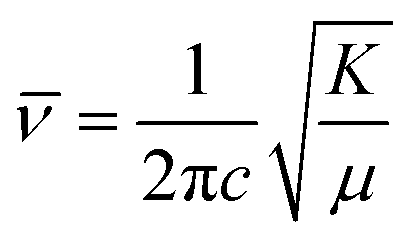 where c is the velocity of light.
  ; M1 and M2 are the masses of atoms involved in bonding (Mn and O in the stretching mode; La, Bi, Ba, and O in the external mode).54,55
The estimated force constants K1 and K3 also displayed a trend similar to the frequency of vibrational mode; the force constants tended to decrease with bismuth substitution. The force constant is a measure of bond strength and is inversely proportional to bond length. Considering this proportionality, the vibrational frequency of the B–O bond can be estimated using the bond lengths. The (La,Bi)–O and Mn–O bond lengths, and Mn–O–Mn bond angles, which are of major concern, are tabulated in Table 1. The work of Madon et al.56 on the infrared spectroscopic analysis of the polymorphic series (enstatite, ilmenite, and perovskite) of MgSiO3, MgGeO3, and MnGeO3 relates the bond lengths (r) and reduced mass (μ) to the maximum vibrational frequency as vmaxr7/2μ−1/5 = 3810. In samples beyond LBB10, the estimated frequency vmax was very close to the observed frequency 3 and, interestingly, varied opposite to the observed values. This indicates that the relationship between the vibrational mode and bond strength is not as straightforward as expected. The bond strength is not a mere outcome of the distance of separation between the two charges but also depends on the type of bonding. The IR active vibrational modes are susceptible to changes in the covalency of the Mn–O bond.57 Given the constant reduced mass μ3, the increase in vmax with a sudden decrease in r beyond LBB10 is reasonable but the opposite trend seen in 3 implies a reduction in the covalency of the Mn–O bond. This happens because of the localization of the eg electron at the bismuth site (A-site). The large electronegativity of bismuth due to its 6s lone pair e imparts greater covalency to the A-site, and reduces the covalency of B-site due to poor overlap of orbitals. In such a case, the wavenumber corresponding to the external mode should have practically moved to a higher frequency, but the blue shift of 1 is perhaps due to the dormant state of the Bi ion. Bi3+ is reported to show duality in ionic radius based on its dormancy.58 In the dormant state, Bi3+ has an ionic radius of 1.23 Å, which induces an increase in bond length at the A-site compared with La–O, and upon enhancement in the Bi content, the reduced mass of the A–O system shows a significant increase, as seen in Table 1 and Table 3 (see 〈La,Bi–O〉 and μ1). Finally, as the FTIR spectra complement the structural findings from XRD, it can be concluded that the shift of the bending mode to higher wavenumbers indicates the change in the Mn–O–Mn bond angle from nonlinear to linear 180°, thereby changing the symmetry. The percentage change in vibrational mode was estimated to determine the blue or red shift in the observed modes. The external mode and stretching modes showed blue shifts, whereas the bending mode showed a red shift. Apart from the structural concerns, the increased intensity of the vibrational mode is indicative of the increased resistivity of the sample at room temperature.53
1), bending mode (2), stretching mode (3) and corresponding FWHMs. The reduced masses and force constants corresponding to (1) and (3) are denoted as μ1, K1 and μ3, K3 respectively
| x |
1 (cm−1) |
FWHM1 (cm−1) |
2 (cm−1) |
FWHM2 (cm−1) |
3 (cm−1) |
FWHM3 (cm−1) | μ 1 × 10⁻²⁴ g | K 1 (N m−1) | μ 3 × 10⁻²⁴ g | K 3 (N m−1) |
max (cm−1) |
|---|---|---|---|---|---|---|---|---|---|---|---|
| 0 | 168.4 | 43.9 | 364.1 | 110.3 | 603.5 | 132.6 | 22.5 | 22.71 | 19.6 | 253.6 | 587.9 |
| 0.05 | 165.3 | 37.8 | 369.6 | 106.0 | 606.8 | 102.5 | 22.6 | 21.97 | 19.6 | 256.4 | 584.8 |
| 0.1 | 166.5 | 42.6 | 365.3 | 101.1 | 605.1 | 120.3 | 22.6 | 22.3 | 19.6 | 255.1 | 586.9 |
| 0.2 | 162.3 | 35.0 | 369.1 | 119.4 | 594.5 | 125.3 | 22.7 | 21.3 | 19.6 | 246.1 | 593.2 |
| 0.3 | 155.3 | 38.0 | 371.2 | 85.7 | 585.3 | 111.9 | 22.8 | 19.53 | 19.6 | 238.6 | 591.1 |
| 0.4 | 155.0 | 39.9 | 362.3 | 101.0 | 587.4 | 114.7 | 22.9 | 19.5 | 19.6 | 240.3 | 589.0 |
Field-emission scanning electron microscopy image analysis
Bi3+ substitution in a perovskite lattice can have a plethora of effects. The duality of Bi3+ ionic radius facilitates substitution at both A and B sites in the ABO3 structure, allowing the tuning of a variety of physical properties, such as conductivity and magnetism.59,60 In contrast, the starting material Bi2O3 is widely used as an additive to assist grain growth and reduce the sintering temperature in synthesis involving various volatile compounds, which are susceptible to evaporation at high formation temperatures.61–63 At high temperatures >820 °C, Bi2O3 interacts with the host compound and forms a eutectic liquid phase, which wets the grain boundaries and accelerates the diffusion of the constituent host atoms.64 Thus, the impact of Bi2O3 on the morphology and microstructure of the Bi-substituted specimens is an interesting dimension to explore, which would assist in gaining deeper insights on the electrical and magnetic properties of specimens under investigation.The FESEM micrographs of all specimens are shown in Fig. 6. Visually, the samples display progressive densification from LBB0 to LBB20. Moreover, noticeable porosity is established in LBB30 and LBB40. Individual grains appear to swell in size initially, and a sudden shrinkage is seen beyond LBB20. To confirm these observations, grain size estimation was carried out using ImageJ software. The detailed procedure of grain size estimation from the micrographs and statistical analysis is given in ESI.† Statistical parameters, such as mean, mode, median, standard deviation and variance, are tabulated in Tables S3 and S4 (ESI†). The arithmetic mean, that is, the average grain size (D) of the given samples is plotted in Fig. 7 in comparison with the density (ρmrd) (Table 1) and porosity. The grain size shows a sudden inflection at LBB20, while holding approximately similar values at other concentrations of Bi. In contrast, the density displays a steady increase till LBB20 and suddenly falls to the initial value beyond LBB20. Similarly, the porosity abruptly escalates beyond LBB20. This indicates the strong influence of Bi2O3 on the microstructure and grain growth of the prepared samples. Bi2O3 is a strongly preferred additive for densification and grain growth in various compounds, which otherwise need a high formation temperature. This preference is due to the low melting point of Bi2O3 (820 °C), beyond which it exists in the liquid phase. This liquid phase of Bi2O3 is responsible for all the variation observed in microstructure depending on the amount of liquid phase present during the high temperature anneal. The microstructural developments in Bi-substituted (LaBa)MnO3 can thus be discussed using liquid-phase grain growth kinetics represented by the equation Dnt − Dn0 = Kt where Dn is the average grain size at the nth second, D0 is the initial size, n is the growth exponent, K is the rate constant, and t is the time. According to the Arrhenius equation, the rate constant is related to the absolute temperature T according to the equation  , where K0 is the Arrhenius factor, Q is the apparent activation energy, and R is the universal gas constant.65 Therefore, if the temperature and time of soaking for each specimen are kept constant, the final grain size depends on rate constant and hence the activation energy.
 | ||
| Fig. 6 FESEM micrographs of La0.7−xBixBa0.3MnO3 (x = 0, 0.05, 0.1, 0.2, 0.3, and 0.4) captured at 10 K× magnification. | ||
 | ||
| Fig. 7 Variations in the grain sized (D), experimentally measured density (ρmrd), and porosity as functions of bismuth concentration. | ||
Impurities in the precursors can modify the activation energy by segregation, precipitation, or melting at the grain boundaries and can act as promoters of grain growth.66 Though Bi2O3 is used here as a substituent and not an additive or impurity, it melts before the formation of the perovskite structure, thus assisting the diffusion of the other constituent atoms. The findings drawn from the grain size analysis, and the density and porosity values can thus be discussed based on the amount of liquid-phase Bi2O3 present in the specimen at the time of heat treatment. Three different mechanisms can be at play and collectively determine grain growth at different concentrations of Bi.64,66 The first mechanism is bulk diffusion; when the liquid phase of Bi2O3 is absent or insufficient, the grain growth is determined only by the diffusion of the constituents based solely on the temperature at the time of heat treatment. The temperature dependence of the diffusion coefficient is defined as 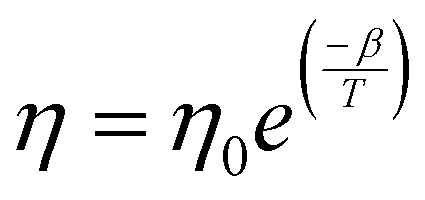 , where η0 and β are constants.64 The exponential dependence indicates that crystal growth escalates with increasing temperature. In this scenario, the temperature at which the parent sample was heat-treated is low but sufficient to cause a completely packed grain distribution with small but approximately the same-sized grains and no porosity. The grain boundary density is very high, which is an indication of insufficient surface energy for the promotion of grain growth. This region of Bi2O3 substitution corresponds to the highest activation energy. The second mechanism is solution reprecipitation: a thin layer of Bi2O3-rich liquid precipitates at the boundaries during heat treatment. However, for solution reprecipitation to occur, a certain minimum amount of the liquid phase must be wetting the grain boundaries.65 A dramatic variation in activation energy occurs at this level of Bi substitution, leading to a collapse. This happens because the liquid phase not only escalates mass transfer but also forms a wetting meniscus, leading to capillary pressure for obligatory movements of the constituent atoms. Thus, LBB5 and LBB10 belong to a percolative class, in which the activation energy begins to drop but the diffusion of atoms is still determined by the dwell temperature. Heavy atoms, such as La and Ba, resist the overall diffusion, while the Bi2O3 liquid phase facilitates it.61 Therefore, the grain size improves moderately, and the system is compact with a small number of trapped pores at the grain boundaries. LBB20 belongs to the class of critical concentration, at which rapid grain growth occurs. The activation energy drops to the minimum value around this concentration, and the thickness of the liquid phase of Bi2O3 is adequate to provide enough capillary pressure for substantial mass transfer. The processes involved are solid-state solubilization and pore segregation.67 The term reprecipitation indicates the fact that during the creation of giant grains, the smaller, thermodynamically unstable grains dissolve in the liquid and precipitate on larger grains.65 The grain size at this level of substitution is the largest with clear grain boundaries. The pores escape from the grain core and reside at the grain boundaries, leading to homogeneity in the interior of the grains.67 After 20% Bi substitution, the third mechanism i.e. mass transfer through a thick liquid layer begins. Here, the amount of Bi2O3 liquid is so excessive that it causes a barrier for the motion of atoms. In this case, the grain growth rate is expressed as
 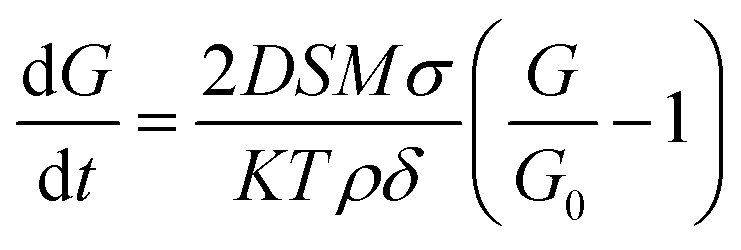 , where D is the diffusion constant of the solid in the liquid, S is the solubility of the flat surface, M is the molecular weight of the solid (LaBaMnO3), σ is the energy of the solid liquid interface, K is a constant, T is the temperature, ρ is the density of the solid, δ is the thickness of the liquid layer, and G0 is the critical grain radius below which they dissolve and above which the grains sustain and the melted grains grow on them.65,68 Clearly, as the thickness of the Bi2O3 liquid layer increases, the grain growth rate decreases. As a result, LBB30 and LBB40 show a constant grain size smaller than that of LBB20. The samples show vivid open porosity due to the evaporation of a large amount of Bi2O3. The density of the specimens with increasing Bi substitution shows a nearly linear dependence up to 20% because, given a volume of the specimen, Bi substitution increases the molar mass of the system linearly, while the porosity remains approximately the same. Beyond LBB20, a decrease in density is observed mainly because of the deterioration of the microstructure due to the evaporation of large amounts of Bi2O3 during the final sintering process.61 These microscopic developments prompted a detailed investigation of the elemental composition of the prepared sample. The elemental compositional analysis was undertaken through EDS measurement and XPS. An advanced technique like XPS can help understand not only the elemental composition but also the chemical environment, valence state of atoms based on the extent of substitution and probable vacancies. This can indirectly shed light on physical properties, such as structure and magnetism. The elemental composition obtained using EDS suggests a large variation from the expected stoichiometry of Bi, Mn and O. Since EDS is a surface technique and considering the operating energy range of the system, various interactions of electrons with the sample might result in the attenuation of the signal reaching the detector. Thus, it may not be appropriate to consider this elemental composition. However, the details are provided in ESI.†
X-ray photoelectron spectral analysis
Fig. 8 presents the survey spectra of the three samples (LBB0, LBB20 and LBB40) chosen based on structural implications to find the cause of the phase transition. Each spectrum is corrected for the binding energy (BE) to account for the shift caused by charging, considering the carbon 1s core line as the reference. All the features observed in the survey spectra confirm the presence of the expected elements. The strong signals at 838.2 eV, 778.9 eV, 641.7 eV, 529.4 eV and 159.2 eV correspond to the La 3d, Ba 3d, Mn 2p, O 1s and Bi 4f core electron binding energies.69 Additionally, a prominent signal is seen at 284.6 eV, corresponding to adventitious carbon, which is an unexpected species that may have accumulated on the surface of the specimen during handling and storage. However, favourably, it serves as a reference for charging correction for all other elements during the scan. Assuming the Shirley background for the characteristic photoelectron lines, the estimated percentage composition of each element did not match the expected numbers; nevertheless, the substitution is evident from the intensity of La and Bi core lines and the shift in the Bi core line. The intensity of the La core line plummets with the shift in the Bi core line, but the intensities of the Ba, Mn and O core lines markedly remain the same. To visualize the shape of the BE curve and the shift in BE position, the stacked plots are given in ESI.† The distinct feature in the XPS spectra of the A-site and B-site elements is the spin–orbit split (SOS) of the core level peaks into two components due to the interaction between the spin and orbital angular momentum. This is typical of heavy elements, such as lanthanides, transition metals (TM) and heavy main group elements (Bi). Apparently, even though Ba is an alkali-earth metal, it shows SOS perhaps due to its large atomic number and the resultant heavy nuclear charge, leading to a strong spin–orbit interaction. Having known the BE positions and separations, a deconvolution was carried out using CasaXPS peak fitting software to assign each of these features, understand the precise variation in their BEs upon Bi substitution, and understand different types of chemical bonding involved in structure formation. | ||
| Fig. 8 XPS survey spectra of LBB0, LBB20 and LBB30 (bottom to top, respectively). | ||
The photoelectron spectra of lanthanum-based compounds are well-known for their complex array of peaks. In a broad sense, it includes a doublet structure (3d5/2 and 3d3/2) with a strong satellite peak (shake-up) in addition to the main photoelectron peak in each core level. The SOS has neighbouring plasmon lines and La MNN auger peaks. In perovskites, La is expected to exist in the +3 ground state (3d104f0). Upon interaction with X-rays, the photoelectrons are ejected, resulting in the final states described as cf0(3d104f0 + hϑ → 3d94f0 + e) and cf1L (3d104f0 + hϑ → 3d94f1L + e), which are also called unscreened and screened core level photoemissions, respectively. The screening is the result of charge transfer from the valence band of the ligand to the 4f0 orbital of the core ionised La. This happens because of the sudden increase in (nearly one unit) effective nuclear charge experienced by the valence electron of the ligand upon primary photoionization. Here, c represents the La core hole, 0 and 1 represent the absence and presence of f electrons, e is the photoelectron and L is the hole in the ligand valence band. The screened core level is further divided into bonding (B) and antibonding (AB) contributions; for most of the compounds, the cf1L antibonding and cf0 overlap. The intensity and separation between the main peaks and satellite are subtle and solely depend on the ligand atom involved in bonding. In short, the mixing of final states with and without charge transfer and the presence of bonding and antibonding states decide the complex structure of the lanthanum photoelectron spectrum.70–74
The deconvolution of the La 3d core spectrum is shown in Fig. 9. The distinct features are labelled with the corresponding contributing orbitals. If monochromatic Al Kα radiation is used for photoionization, the strongest signal of La, which is the La 3d core line, appears with an intense La auger signal (La M4,5 N4,5: La MNN); its interference is usually seen in the energy range of approximately 840 to 870 eV. This region is above the La 3d5/2 SOS component, thus, only the La 3d5/2 core line was considered for deconvolution. The deconvolution was carried out considering three peaks, including cf0, cf1L AB and cf1L B.70,75–77 However, some works on lanthanoids and related compounds have considered only two peaks for deconvolution, ignoring the bonding and antibonding states resulting from the electron–hole exchange (a strong signal: J = 1 and a cluster of weak signals: J ≠ 1). Moreover, some studies have reported four deconvolutions within one doublet, with alternate assignments to La-based oxide and hydroxide, rooted back to the same inconsistency. The peak positions, FWHM and area corresponding to the cf0, cf1L AB and cf1L B final states are given in Table 4. The cf0 and cf1L B final states of LBB0, LBB20 and LBB40 are found at nearly the same positions: 832.8 eV and 837.8 eV, respectively. Only the cf1L AB final state is shifted to a higher BE by 0.7 eV w.r.t. 834.4 eV. The energy difference between the cf0 and cf1L B final state increases from 4.8 eV to 5.1 eV, and the energy difference between cf1L AB and cf1L B decreases from 3.2 eV to 2.7 eV from LBB0 to LBB40. Interestingly, the area ratio between cf0 and the cf1L B final state changes from ≈5 to 0.9 from LBB0 to LBB40, emphasising that the intensity of the shakeup reduces at the cost of the main peak and becomes equal, whereas the intensity of cf1L AB remains nearly the same. The peak positions observed in this study match fingerprint spectra of La2O3 and La-based perovskites, such as LaCrO3, LaMnO3, LaNiO3, La0.95Ba0.05FeO3, La0.95Ba0.05CoO3 and LaNi0.8Co0.2O3.78–85 This verifies that, in the samples under investigation, lanthanum must be in the La3+ state similar to La2O3; however, the presence of La2O3 due to an incomplete reaction is ruled out as there are no reflections indicating La2O3 (2θ = 30°) in the XRD pattern. Peter Burroughs et al.72 state that the resemblance between the La photoelectron peaks of La2O3 and La-based perovskites is because the shape and position of the satellite is confined to the La3+ atom or LaOx cluster and is independent of site symmetry. However, the intensity and position of the main peak and satellite are greatly determined by the ligand attached to the La3+ atom. Therefore, it can be concluded that La3+ is in the perovskite framework. An energy separation ranging from 4.5 eV to 4.9 eV between the cf0 and cf1L B final states is the fingerprint of La2O3 or perovskite systems. However, in the case of La(OH)3, it is 3.9 eV, and in the case of La2(CO3)3, it is 3.5 eV. Considering these facts, it is believed that La atoms in all three specimens majorly have the La2O3-type chemical environment. However, rare-earth compounds are hygroscopic in ambient conditions and spontaneously react with moisture to form La(OH)3 not only on the surface but also in the bulk of the sample.70,86 The as-studied specimens also show indications of hydroxyl contamination. Generally, the hydroxyl cf0 signal is evident above 834.5 eV,73,75,76 so considering the fact that cf0 and cf1L AB final state are not distinct but have extensive overlap,77 the average of these two positions fall between 833.6 eV and 833.9 eV. Thus, the new energy separation between the main peak and satellite changes from 4.1 eV to 3.9 eV, which corresponds to La(OH)3. Further, the extent to which cf0 and cf1L AB final states appear on the BE scale (FWHM cf0 + FWHM cf1L AB) increases significantly from LBB0 (5.4 eV to 8 eV). The broad FWHM in the XPS is because of the multiple overlapping chemical states, different bonding environments of the same element or components showing signals in the same BE region. These findings hint at partial hydroxylation of the compound even in the bulk of the sample. This was also confirmed by the faint parasitic signal at a 2θ value of 290 in the X-ray diffractogram. Amongst all the features observed in the La 3d5/2 core spectra, the enhanced energy separation between the satellites of the doublet and suppression of the satellite intensity at the cost of the main peak upon bismuth substitution are notable.
 | ||
| Fig. 9 Deconvoluted core spectra of the La 3d and B 3d regions of LBB0, LBB20 and LBB40 cps: counts per second, bgr: background, IES: inelastic scattering. | ||
| Sample code | Element | Core level | Peak name | Species | Peak position | BE separation | FWHM | Area | % Area | Area ratio |
|---|---|---|---|---|---|---|---|---|---|---|
| A: cf1L B-cf0, a: cf1L B/cf0, B: cf1L B-cf1L AB, b cf1L B/cf1L AB, SO: sub oxide, O: oxide, C: SO3/2-SO5/2, c: SO5/2/SO3/2, D: O3/2-O5/2, d: O5/2/O3/2, E: Bi5/20-Bi7/20, e: Bi7/20/Bi5/20, F: Bi5/23+-Bi7/23+, f: Bi7/23+/Bi5/23+, G: Mn1/23+-Mn3/23+, g: Mn3/23+/Mn1/23+, H: Mn1/24+-Mn3/24+, h: Mn3/24+/Mn1/24+, I: OAD-OL(average), i: OAD/OL(sum), J: OC-OL(average), j: i: OC/OL(sum). | ||||||||||
| LBB0 | La | 3d | 3d5/2 | cf0 | 832.8 | 4.8A | 2.24 | 18675.0 |
10.3 | 4.8a |
| cf1L AB | 834.4 | 3.2B | 3.2 | 73163.6 |
40.2 | 1.2b | ||||
| cf1L B | 837.6 | — | 3.6 | 90038.2 |
49.5 | — | ||||
| LBB20 | 3d5/2 | cf0 | 832.6 | 5.0A | 3.7 | 32506.7 |
24.0 | 1a | ||
| cf1L AB | 834.6 | 3.0B | 4.3 | 70358.8 |
52.0 | 0.5b | ||||
| cf1L B | 837.6 | — | 2.8 | 32482.1 |
24.0 | — | ||||
| LBB40 | 3d5/2 | cf0 | 832.7 | 5.1A | 3.1 | 21096.0 |
25.6 | 0.9a | ||
| cf1L AB | 835.1 | 2.7B | 4.1 | 42446.4 |
51.5 | 0.4b | ||||
| cf1L B | 837.8 | — | 2.9 | 18866.9 |
22.9 | — | ||||
| LBB0 | Ba | 3d | 3d5/2 | SO | 777.6 | 15.2C | 1.6 | 7739.5 | 3.5 | 1.1c |
| O | 779.2 | 3.4 | 120032.1 |
53.5 | ||||||
| 3d3/2 | SO | 792.8 | 15.3D | 1.8 | 6892.1 | 3.1 | 1.5d | |||
| O | 794.5 | 3.4 | 82577.2 |
36.8 | ||||||
| LBB20 | 3d | 3d5/2 | SO | 776.2 | 14.9C | 3.0 | 15668.5 |
7.8 | 1.4c | |
| O | 778.4 | 3.4 | 98165.3 |
48.7 | ||||||
| 3d3/2 | SO | 791.1 | 15.2D | 2.7 | 10885.1 |
5.4 | 1.3d | |||
| O | 793.6 | 3.4 | 74374.2 |
36.9 | ||||||
| LBB40 | 3d | 3d5/2 | SO | 776.8 | 15.3C | 1.9 | 11233.8 |
6.0 | 1.5c | |
| O | 778.7 | 3.4 | 95916.9 |
51.5 | ||||||
| 3d3/2 | SO | 792.1 | 15.3D | 1.6 | 7499.4 | 4.0 | 1.5d | |||
| O | 794 | 3.2 | 64996.3 |
34.9 | ||||||
| LBB20 | Bi | 4f | 4f7/2 | Bi0 | 156.4 | 5.3E | 1.7 | 8344.2 | 12.2 | 1.1e |
| Bi3+ | 158.4 | 2.2 | 28284.3 |
41.4 | ||||||
| 4f5/2 | Bi0 | 161.7 | 5.3F | 1.8 | 7390.8 | 10.8 | 1.3f | |||
| Bi3+ | 163.7 | 2.2 | 21564.7 |
31.6 | ||||||
| LBB40 | 4f | 4f7/2 | Bi0 | 157.1 | 5.3E | 1.7 | 29870.5 |
18.2 | 1.2e | |
| Bi3+ | 159 | 2.2 | 59680.6 |
36.3 | ||||||
| 4f5/2 | Bi0 | 162.4 | 5.3F | 1.7 | 24022.9 |
14.6 | 1.3f | |||
| Bi3+ | 164.3 | 2.2 | 45822.7 |
27.9 | ||||||
| LBB0 | Mn | 2p | 2p3/2 | Mn3+ | 641.2 | 11.4G | 3.5 | 39900.0 |
42.6 | 2.1g |
| Mn4+ | 643 | 3.1 | 18260.8 |
19.5 | ||||||
| 2p1/2 | Mn3+ | 652.6 | 11.4H | 3.2 | 19400.0 |
20.7 | 2.0h | |||
| Mn4+ | 654.4 | 2.5 | 9135.3 | 9.8 | ||||||
| LBB20 | 2p | 2p3/2 | Mn3+ | 640.5 | 11.5G | 3.9 | 42996.0 |
43.7 | 1.9g | |
| Mn4+ | 642.2 | 3.7 | 21496.9 |
21.8 | ||||||
| 2p1/2 | Mn3+ | 652 | 11.8 H | 3.8 | 23076.3 |
23.5 | 2.0h | |||
| Mn4+ | 654 | 3.5 | 10849.1 |
11.0 | ||||||
| LBB40 | 2p | 2p3/2 | Mn3+ | 640.7 | 11.5G | 3.6 | 43437.6 |
41.6 | 2.0g | |
| Mn4+ | 642.6 | 3.1 | 23251.3 |
22.3 | ||||||
| 2p1/2 | Mn3+ | 652.2 | 11.6 H | 3.6 | 21883.9 |
21.0 | 1.8h | |||
| Mn4+ | 654.2 | 3.3 | 13621.7 |
12.5 | ||||||
| LBB0 | O | 1s | OL | 528.3 | 2.7I | 1.5 | 8624.9 | 6.8 | 0.67i | |
| OL | 529.7 | 3.0 | 67430.6 |
53.3 | ||||||
| OAD | 531.7 | 3.6 | 50459.6 |
39.9 | ||||||
| LBB20 | 1s | OL | 527 | 2.6I | 2.0 | 18887.1 |
15.6 | 0.53i | ||
| OL | 528.9 | 2.2 | 52965.0 |
43.8 | ||||||
| OAD | 530.6 | 4.1J | 2.7 | 36947.0 |
30.6 | 0.17j | ||||
| OC | 532.1 | 3.1 | 12641.2 |
10.0 | ||||||
| LBB40 | 1s | OL | 527.7 | 2.4I | 2.0 | 30654.4 |
25.6 | 0.29i | ||
| OL | 529.5 | 2.1 | 52829.9 |
44.1 | ||||||
| OAD | 531 | 3.8J | 2.4 | 24635.4 |
20.6 | 0.16j | ||||
| OC | 532.4 | 2.7 | 11614.6 |
9.7 | ||||||
Hypothetically, the energy difference between the doublet components ΔEJ depends on the spin–orbit constant ξnl, which is related to the expected  value of the average ionic radius of atoms involved in the orbital. This means ξnl increases with the atomic number Z for a given subshell (n and l) and decreases as l increases for a given n.74 In other words, if the valence electron moves away from the atom, the effective nuclear charge increases, causing the core level electrons to move closer to the nucleus, resulting in strong spin–orbit coupling. Considering this, in the as-investigated samples, it is believed that upon Bi substitution, the local environment around La changes in such way that the O 2p electrons, which were available for charge transfer, localise at the Bi site, increasing the effective nuclear charge of La substantially. Because of the resultant strong spin–orbit coupling, ΔEJ improves across the series (LBB0 to LBB40). Regarding the decline in the intensity of the satellite peak, it is directly influenced by the nature of bonding between the cation and the ligand. It is proportional to the charge transfer from O 2p to the metal 4f level; in other words, the intensity of the charge transfer shakeup increases with increase in the covalency of the bond.87–89 A divalent cation like Ca2+, Sr2+ or Ba2+ improves the relative covalency on the La–O bond as it induces an effective negative charge in the lattice. At this stage, the ligand tends to take an electron, thus improving the overall electronic cloud density around the anion. In this situation, there is an abundance of electrons around La, leading to improved covalency of the La–O bond. However, a strong electronegative ion, such as Bi3+, drastically reduces the covalency of the La–O bond as it seizes the electron of the O 2p orbital at its site. The La site is thus greatly ionic, resulting in a reduction in shakeup intensity. This not only provides a reason for the changes observed in the La 3d core spectra but also validates the successful substitution of bismuth in the perovskite framework.
The deconvoluted Ba 3d core spectra (Fig. 9) uncovers inelastic scattering signals90,91 along with the asymmetric doublet core lines. The spin–orbit doublets (3d5/2 and 3d3/2) are separated by an energy difference of ≈15.3 eV, and the intensity ratio is close to the ideal value of 1.5 (Table 4) in all the samples, confirming that the origin of the signal is spin–orbit coupling. The asymmetry in the Ba 3d core line is apparent from the deconvolutions, which suggest the presence of two or more chemically different phases of Ba in the samples. The lower BE shoulder components occur at 776.6 ± 0.2 eV and 791 to 793 eV. As shown in Fig. 9, the 3d3/2 signal has an overlapping contribution from the inelastic scattering component, which is perhaps insignificant in the current discussion. However, although the shoulder signal of the 3d3/2 branch is at the same position after Bi substitution, it shows a significant increase in intensity (area%) upon substitution. This finding infers the existence of a common phase other than the perovskite in all the specimens. This phase is attributed to Ba2+ in an oxygen-vacant environment and/or at an inequivalent crystallographic site. This can also be attributed to Ba defects in the crystal92–95 (also referred to as the sub-surface or sub-oxide phase). The main peaks found at 779.2 eV and 794.5 eV in LBB0 correspond to lattice Ba in +2 oxidation state in the perovskite environment. These core lines shift to lower BE values by 0.8 and 0.5 eV, respectively. Though this shift is insignificant with respect to the instrumental resolution, the direction of the shift is noteworthy for alkaline-earth metals. Therefore, the central question for discussion regarding the Ba 3d core spectra is the negative BE shift of the core line of the oxide w.r.t. metallic Ba. The same is true for the La 3d core line in La-based oxides. According to some reports, the metallic Ba core line (3d5/2) is found at 780.4–781 eV.69,96 Generally, in oxides, when charge transfer happens from the initial state of the cation to the ligand during bond formation, the electrostatic potential of the cation increases, which increases the core level BE. However, these Ba-based compounds show a shift in the core line to lower values w.r.t. the metal. In LBB0, the core line was found at 779.2 eV, demonstrating a ≈1.5 eV negative shift compared to metallic Ba. This behaviour is majorly attributed to extra-atomic relaxation (EAR) effects.91,96 A similar effect has been reported in the core level spectra of Ag during transition from Ag2O and AgO (where the oxidation state of Ag changes from 0 to +1 and +2) and Cd to CdO.97 In general, the overall shift in the core-level BE of an atom when its chemical environment is changed is the sum of the relaxation energy shift, lattice potential shift and valence shift. The relaxation effects arise due to the redistribution of electron density within the ion and its surroundings after photoionization. The lattice potential shift arises because of the screening effect of the surrounding ion cores on the atom under investigation and depends on the crystallographic structure. The valence shift is the consequence of electron transfer from or to an atom during chemical-bond formation.91 Though EAR leads to a negative shift of the core BE from metal to oxide, for oxide specimens, as long as there are no changes in the oxidation state and/or crystal structure, EAR can be ignored. In this regard, it should be noted that the crystal lattice of Ba metal is base-centred cubic and rhombohedral for LBB0. It changes back to cubic in LBB20. The corresponding Ba–Ba bond distance in the metal = 4.33 Å changes to 3.91 Å in LBB0 and then rises to merely 3.92 Å in LBB20. Interestingly, a reduction in the FWHM of the Ba-MNN auger peak (860–930 eV) is observed from LBB0 to LBB40. This indicates the dormancy of EAR in deciding the negative BE shift within the oxide series, as speculated, and the crystallographic observations rule out lattice potential shifts. Thus, it is assumed that valence effects decide the net negative shift in BE. It is likely that the electron-withdrawing nature of Bi3+ changes the lattice environment in such a way that Ba–O bonding becomes weaker. This results in increased electronic density around barium and hence a negative shift in BE. Apart from the negative shift, from the crystallographic point of view, the area% estimations reveal that 94%, 86% and 90% of Ba intensity comes from the perovskite environment in LBB0, LBB20 and LBB40, respectively, and the remaining intensity corresponds to the non-perovskite form.
Fig. 10 shows the deconvolution of the Bismuth 4f core spectra of LBB20 and LBB40. The peculiarity of these spectra is the existence of a shoulder intensity on the lower BE side of both 4f7/2 and 4f5/2 core lines. The major signals of these core lines of LBB20 and LBB40 appear at 158.4 eV, 163.7 eV, 159.0 eV, and 164.3 eV, respectively. The spin–orbit doublet nature of these lines in both the samples is confirmed by the BE separation (ΔBE) of 5.3 eV and the intensity ratio close to 1.33 (Table 4).98–102 A similar observation for the shoulder intensity means that the shoulder belongs to bismuth but of a different oxidation state.
 | ||
| Fig. 10 Deconvoluted XPS high-resolution spectra of the Bi 4f core level for LBB20 and LBB40. | ||
The contribution at ≈154 eV is the signal of the X-ray satellite peak corresponding to Al Kα3,4.103 There can be several reasons for the origin of the shoulder intensity observed on the lower binding side of the main peak. Some researchers consider it to be a multiplet arising due to crystal field effects and degenerate electronic energy.104 A few other studies attribute this peak to a Bi suboxide with an oxidation state of Bi+3−x resulting from long exposure to a reducing vacuum environment. Some assign it to a Bi-rich parasitic phase and others to metallic bismuth (Bi0).99,101,105–108 Notably, in this context, there cannot be any other charge state of Bi (for instance, Bi2+ or Bi+) as long as the samples are not sintered at high oxygen pressure109 or Bi is substituted at the B-site of the perovskite. Further, the BE positions in the Bi core spectra are largely susceptible to their chemical environment than the oxidation state.102,106,110 After careful consideration and BE position matching with the literature, the shoulder appearing in the Bi spin–orbit doublet is inferred to be the signature of Bi0 (metallic bismuth). Therefore, the main peak in the 4f core signal corresponds to the Bi3+ species residing at the A-site of the perovskite lattice, and the shoulder corresponds to metallic bismuth.100,102,108 The formation of Bi0 is the consequence of the reduction process. The thermal decomposition of Bi2O3, when heated above its melting point, leaves behind metallic bismuth accompanied by the consequent evolution of oxygen gas. It was observed that with an increase in Bi substitution, the metallic content also increased. The Bi3+: Bi0 was found to be 76:24 and 67:33, respectively, for LBB20 and LBB40.
By and large, first-row TMs like Mn always pose serious challenges due to different possible charge states and the corresponding small BE differences between them. In the deconvoluted Mn 2p core spectra, the core lines of manganese ions, viz. Mn2+, Mn3+ and Mn4+, are separated not even by 2 eV, which is close to the resolution of most XPS measurement systems. As a result, if a given XPS photoelectron spectrum contains more than one ion of the same element, it is unlikely to resolve them into separate contributions. Moreover, the satellites of the 2p3/2 core line are weak irrespective of the Mn ion present. On the other hand, the said species of Mn ions assume high spin states in oxides and hydroxides, leading to a broad distribution of peaks as a consequence of multiplets.111 The high spin state is common in manganese ions with lower oxidation states, which are attached to a weak field ligand, such as oxygen (O2−). This is also true for Mn4+, even though it assumes a higher oxidation state. The high spin state arises from the unpaired electrons retained in the eg orbital of Mn3+ (2e) and Mn4+ (1e). The weak field ligands produce smaller crystal field splitting, which is not sufficient to overpower the cost of pairing energy for the unpaired valence electrons. Thus, due to the overlapping peaks of different oxidation states, their multiplet nature and hazy satellites, the deconvolution of XPS core spectra of first-row TMs is usually difficult and not preferred. Rather, the ΔBE between the SOS and the separation from the main peak to the oxygen (in general, ligand) core line are appropriate criteria to determine the possible chemical state and environment of TMs in the compound.80,112 In contrast, even though the multiplets in the XPS photoemission spectra of TMs are not resolvable, the spectrum of each isovalent ion of the TMs presents salient features with respect to multiplets. The theoretical study on Mn free ions by R. P. Gupata et al. revealed five multiplets for Mn3+. The BE maximum of multiplets was found at 642.3 eV with a plateau on the lower BE side (two peaks of the same intensity) and a shoulder on the higher BE side (fourth peak). Along with these peaks, a distinct fifth peak occurred at 644.9 eV. The Mn4+, on the other hand, had the maximum for the multiplets at 641.9 eV with a shallow slope on the higher BE side, indicating that the rest of the multiplets lie in this region. The distinct 5th multiplet was located at 646.8 eV.113,114 H. W. Nesbitt et al.111 attempted a fair correlation of their work with the theoretical work by R. P. Gupata et al. and experimental works of other researchers. Notably, their deconvolution identified the BE maximum of Mn3+-rich manganite at 641.8 eV and those of Mn4+-rich manganites ranging from 641.9 eV to 642.6 eV.111 Independently, Michael A. Stranick115–117 reported the XPS spectra of Mn(C2H3O2)2, Mn2O3 and MnO2 as prototypes for Mn2+, Mn3+ and Mn4+, which showed similar spectral characteristics to those of H. W. Nesbitt. Based on the above observations and dataset, the Mn 2p core spectra were deconvoluted in this work, as shown in Fig. 11. The only difference between the literature and this investigation is the FWHM of the Mn 2p3/2 whole peak. It has been reported that the FWHM of samples solely containing Mn3+ ranges from 2 eV to 3.1 eV and those of samples with Mn4+ lie in the 2.5 eV to 3.5 eV range. However, in this study, the FWHM was found to be ≈5.4 eV. Even after considering instrumental broadening, this value seems to be significantly large enough to host a single species. Obviously, the samples under investigation are MVMs with a charge ratio of 2.33 (Mn3+/Mn4+: 70/30), and it is expected to remain the same as Bi3+ replaces La3+. Thus, it is believed that along with instrumental contributions, there can be a distinction in the core spectra of Mn3+ and Mn4+, leading to broad peaks unlike many oxides of manganese with mixed valency. The multiplet nature of Mn3+ and Mn4+ is not accounted for because the salient features were not identified, so a broad peak for each charge state is considered for Mn 2p3/2 and 2p1/2, along with an occasional presence of a third component in each doublet at 645 eV. The two broad signals observed in the Mn 2p spectra correspond to the SOS of Mn 2p (j = 3/2 and j = 1/2), as confirmed by the area ratio ≈2:1 (0.5) (Table 4) between the deconvoluted peaks of Mn 2p3/2 and Mn 2p1/2. The ΔBE ranging from 11.4 eV to 11.8 eV also confirms the same. The peaks at 645 eV and 656.3 eV in the case of LBB0 and 644.8 eV in the case of LBB40 correspond to the Mn3+ satellite. Such satellites are not recognizable in LBB20, so it was not considered for deconvolution. The mixed valent nature of the studied specimens is established by the successful deconvolution of Mn 2p3/2 and Mn 2p1/2 into four peaks. The lower energy peak of each core line corresponds to Mn3+, and the higher energy peak of each core level is attributed to Mn4+. Interestingly, the area ratio between Mn3+/Mn4+ (including the satellite of Mn3+) in LBB0 is 2.4 or 71:29, which is close to the expected ratio of 70:30. This confirms the purity of the sample at its bulk. However, the ratio changed to 67:33 and 65:35 in LBB20 and LBB40, respectively. As the preparation conditions were the same, the escalation in Mn4+ concentration is believed to be a consequence of vacancies (essentially Bi3+) at the A-sites of the perovskite lattice.
 | ||
| Fig. 11 Deconvoluted Mn 2p and O 1s core spectra of LBB0, LBB20 and LBB40. | ||
The deconvolution of the O 1s core spectra is challenging due to its complex nature when the specimen under consideration has many chemical components with various characteristics, bonding with oxygen. This can lead to the formation of several non-equivalent metal–oxygen bonds. Additionally, the reactivity of the specimen with atmospheric contaminants, the conditions during sample preparation and experimentation parameters can greatly influence the original signal of the O 1s spectra. The deconvoluted O 1s spectra of LBB0, LBB20 and LBB40 are shown in Fig. 11. The asymmetric nature of the spectra is evidence for the existence of oxygen signals of different origin. Generally, the signals at low BE are attributed to the metal–oxygen bonds of a crystal lattice with higher coordination and the contributions at higher BE come from oxygen linked to basic metals, absorbed/adsorbed oxygens species, hydroxyls, carbonyls, carbonates, cationic vacancies and water content. The LBB0 O 1s spectra could be deconvoluted into three contributions, two of which (lower BE) were at 528.3 eV and 529.7 eV (Table 4). The ΔBE between these peaks was 1.4, which is just above the resolution of the instrument, thus can be boldly considered as separate contributions. The minor peak belongs to the lattice oxygen (OL1) of the Ba–O bond in the perovskite environment80,92,95,118,119 and the major peak (OL2) corresponds to the overlapping signals of the Mn–O and La–O bonds in the lattice.86,99,115,116 The third broad peak (adsorbed oxygen: OAD) at 531.7 eV corresponds to a superposed contribution from hydroxyl groups (OH−), adsorbed oxygen species (O22−, O2− and O−) and carbonyl groups (C![[double bond, length as m-dash]](https://www.rsc.org/images/entities/char_e001.gif) O). It is known that the presence of basic elements, such as barium, in the crystal lattice of LaMnO3 can induce oxygen vacancies at the subsurface level. The surface molecular oxygen adsorbates react with these oxygen vacancies and lead to an increase in the adsorbed/absorbed oxygen concentration in the surface structure.80,92,120 Further, hydroxylation is inevitable in La-containing oxide due to their high reactivity with moisture.77 The ΔBE of 2.7 eV (Table 4) between OAD and OL (average) confirms the presence of hydroxyl in the specimen.86 The presence of adventitious carbon with carbonyl functional group CO is confirmed by the signal in the C 1s spectra at around 288–290 eV.100 The presence of adsorbed water is ruled out as its peak appears above 533 eV.86 Generally, the lattice oxygen component with overlapping contributions from metal–oxygen bonds cannot be split into distinct contributions due to the marginal ΔBE between them; however, if the chemical components largely vary in their ionicity, there is a high likelihood for some elements to exhibit distinct signatures in the O 1s core spectra, as discussed in the following sections. The O 1s spectra of LBB20 and LBB40 were markedly different from the LBB0 spectrum. Apart from the three contributions seen in LBB0, a new component was observed above 532 eV. The minor and major of OL peaks were respectively observed at 527 eV, 528.9 eV (LBB20) and 527.7 eV, 529.5 eV (LBB40). According to the literature, the major peak belongs to the BE position of Bi–O in the perovskite lattice100,101,108,121,122 and Mn–O, and the minor peak may be assigned to La–O123,124 and Ba–O in the concerned perovskite lattice. The lower BE peak increased in intensity systematically from LBB0 to LBB40. The area ratios OLminor/OLmajor were 0.13, 0.36, and 0.58, respectively, which are roughly in concordance with 1:3:5 Bi% substitution. The observed changes indicate electronic redistribution and modifications in the bonding environment of the lattice upon Bi substitution. These changes are thought to occur when a highly electronegative ion like Bi increases the iconicity of La and Ba by largely withdrawing the electron density of the oxygen. As a result, the electron cloud around La, Ba is modified in such a way that its ionic nature is enhanced.74,86 Meanwhile, the Bi–O bonding characteristic becomes largely covalent. This fact can be established by considering the Pauling electronegativity values of Bi, Mn, La, and Ba. The Pauling electronegativity value of an element is a measure of the ability of an atom to attract electrons in a chemical bond. The larger the electronegativity of a metal atom to which an oxygen atom is bonded, the higher the BE of the O 1s electron due to the enhanced attraction of the O 1s core electrons.125 The Pauling electronegativity values of Bi, Mn, La and Ba are 1.9, 1.55, 1.1, and 0.89, respectively. The widely spread values of OL BE (Table 4), i.e. the change in OLmajor–OLminor from 1.4 to 1.9, clearly indicate that different types of bonding exist in the lattices. The La–O and Ba–O bonds are largely ionic, and Bi–O and Mn–O are covalent in nature; therefore, they tend to display opposite trends in BE shift, thereby increasing the OL BE spread. The overall shift of OL towards lower BEs is due to the enhancement in ionicity, which was also confirmed by the bond valence calculations (bond valence sum: BVS) of oxygen. The BVS of oxygen reduced from LBB0 to LBB10 (2 → 1.95 → 1.98) and suddenly switched to 2 + δ beyond LBB20 (2.05 → 2.03 → 2.04). This means upon Bi substitution, the lattice changes from the state of electron deficiency to electron excess, which manifests as a negative shift in BE in the O 1s core spectra.70 The origin of the third peak OAD mentioned earlier is highly debatable. In the present case, for LBB20 and LBB40, the OAD appears at 530.6 eV and 531 eV, respectively. The attribution to these peaks in most of the works is to surface-adsorbed molecular oxygen species viz. O−, O2− and/or O22− due to the presence of oxygen vacancies at subsurface levels and surface hydroxyl OH− groups (typically 531–532 eV).80,92,95,120,124,126–128 Interestingly, a similar BE position is also attributed to oxygen chemically bonded to segregated cations at the surface i.e. chemi-absorbed oxygen.95,99,119,129 In this context, it is believed to be the Bi–O bonding signal resulting from the metallic bismuth present on the surface. BaCO3 also has a typical O 1s signal at 530.8–531 eV; however, the absence of a photoemission signal at 290 eV in C 1s negates the existence of carbonate species (CO32−).90,96 The decrease in the intensity of OAD w.r.t. OL, as seen from the area ratio (0.67 → 0.29), is due to the reduction in the surface area of the sample upon Bi substation, which is verified by the morphological analysis. Discarding the possibility of adsorbed water, CO2 adsorption, and organic functional groups, the fourth bands (OC) in LBB20 and LBB40, respectively at 532.1 eV and 532.4 eV, are attributed to oxide ions with low electron density and a very low coordination state. Such oxygen can be associated with cation vacancies in the oxide structure. This band lies at 4.1 eV from the average lattice oxygen position in LBB20, and the separation declines to 3.8 eV upon further substitution, and the area ratio of OC to lattice oxygen almost remains the same. This is in agreement with the trend of the Mn3+/Mn4+ charge ratio upon Bi substitution, that is, the generation of Mn4+ due to cationic vacancies induced in the system is not linear but saturable from LBB0 to LBB40. This observation has greater implications for substitution-dependent structural phase change in the investigated samples. The C 1s core spectra complement the findings from the O 1s and Bi 4f spectra. Using a simple double derivative method, the BE positions in the C 1s spectra indicative of different origins were estimated. In LBB0, there were two prominent bands at 284.5 eV and 289 eV. These BE positions belong to adventitious carbon of graphitic type C–C bonding and polar carbonyl CO bonding, respectively. Upon Bi substitution, an additional band appeared on the lower BE at 282.5 eV and 283.3 eV at 20% and 40% substitution, respectively. This signal comes essentially from the carbide bonding of Bi-C.130,131 Such bonding between Bi and carbon is believed to be formed by the reaction between chemisorbed carbon and metallic bismuth segregated from the main phase. Notably, with enhanced substitution of bismuth, all the core levels of A-site, B-site cations and anion shift to lower BEs, but the core levels of Bi shift
by 0.7 eV to a higher BE. The studies claim that this is due to the strengthening of the Bi–O bond, which changes the chemical environment, local structure and electronic structure around Bi.132 For elements like Bi, as the oxidation state increases from Bi0, the core BE shifts higher due to a strong effective nuclear charge experienced by the core electrons. It is thoroughly established that in the studied specimens, Bi is in the 3+ oxidation state (the stable +5 oxidation state is ruled out based on the BE position of Bi5+ in the perovskite environment) and behaves as a Lewis acid, that is, it can accept electron pairs or withdraw electron density. The high charge density of Bi3+ creates an electron-deficient environment around the ion, making it capable of accepting electron pairs. As Bi3+ is a heavy ion, the creation of a core hole further increases the effective nuclear charge of Bi3+, resulting in a positive shift of BE. Meanwhile, less electronegative cations would act as electron donors to oxygen. In the presence of Bi3+, the redistribution of electron density of oxygen happens in such a way that the Mn–O, La–O and Ba–O bonds become weak, leading to a negative shift in BE.
O). It is known that the presence of basic elements, such as barium, in the crystal lattice of LaMnO3 can induce oxygen vacancies at the subsurface level. The surface molecular oxygen adsorbates react with these oxygen vacancies and lead to an increase in the adsorbed/absorbed oxygen concentration in the surface structure.80,92,120 Further, hydroxylation is inevitable in La-containing oxide due to their high reactivity with moisture.77 The ΔBE of 2.7 eV (Table 4) between OAD and OL (average) confirms the presence of hydroxyl in the specimen.86 The presence of adventitious carbon with carbonyl functional group CO is confirmed by the signal in the C 1s spectra at around 288–290 eV.100 The presence of adsorbed water is ruled out as its peak appears above 533 eV.86 Generally, the lattice oxygen component with overlapping contributions from metal–oxygen bonds cannot be split into distinct contributions due to the marginal ΔBE between them; however, if the chemical components largely vary in their ionicity, there is a high likelihood for some elements to exhibit distinct signatures in the O 1s core spectra, as discussed in the following sections. The O 1s spectra of LBB20 and LBB40 were markedly different from the LBB0 spectrum. Apart from the three contributions seen in LBB0, a new component was observed above 532 eV. The minor and major of OL peaks were respectively observed at 527 eV, 528.9 eV (LBB20) and 527.7 eV, 529.5 eV (LBB40). According to the literature, the major peak belongs to the BE position of Bi–O in the perovskite lattice100,101,108,121,122 and Mn–O, and the minor peak may be assigned to La–O123,124 and Ba–O in the concerned perovskite lattice. The lower BE peak increased in intensity systematically from LBB0 to LBB40. The area ratios OLminor/OLmajor were 0.13, 0.36, and 0.58, respectively, which are roughly in concordance with 1:3:5 Bi% substitution. The observed changes indicate electronic redistribution and modifications in the bonding environment of the lattice upon Bi substitution. These changes are thought to occur when a highly electronegative ion like Bi increases the iconicity of La and Ba by largely withdrawing the electron density of the oxygen. As a result, the electron cloud around La, Ba is modified in such a way that its ionic nature is enhanced.74,86 Meanwhile, the Bi–O bonding characteristic becomes largely covalent. This fact can be established by considering the Pauling electronegativity values of Bi, Mn, La, and Ba. The Pauling electronegativity value of an element is a measure of the ability of an atom to attract electrons in a chemical bond. The larger the electronegativity of a metal atom to which an oxygen atom is bonded, the higher the BE of the O 1s electron due to the enhanced attraction of the O 1s core electrons.125 The Pauling electronegativity values of Bi, Mn, La and Ba are 1.9, 1.55, 1.1, and 0.89, respectively. The widely spread values of OL BE (Table 4), i.e. the change in OLmajor–OLminor from 1.4 to 1.9, clearly indicate that different types of bonding exist in the lattices. The La–O and Ba–O bonds are largely ionic, and Bi–O and Mn–O are covalent in nature; therefore, they tend to display opposite trends in BE shift, thereby increasing the OL BE spread. The overall shift of OL towards lower BEs is due to the enhancement in ionicity, which was also confirmed by the bond valence calculations (bond valence sum: BVS) of oxygen. The BVS of oxygen reduced from LBB0 to LBB10 (2 → 1.95 → 1.98) and suddenly switched to 2 + δ beyond LBB20 (2.05 → 2.03 → 2.04). This means upon Bi substitution, the lattice changes from the state of electron deficiency to electron excess, which manifests as a negative shift in BE in the O 1s core spectra.70 The origin of the third peak OAD mentioned earlier is highly debatable. In the present case, for LBB20 and LBB40, the OAD appears at 530.6 eV and 531 eV, respectively. The attribution to these peaks in most of the works is to surface-adsorbed molecular oxygen species viz. O−, O2− and/or O22− due to the presence of oxygen vacancies at subsurface levels and surface hydroxyl OH− groups (typically 531–532 eV).80,92,95,120,124,126–128 Interestingly, a similar BE position is also attributed to oxygen chemically bonded to segregated cations at the surface i.e. chemi-absorbed oxygen.95,99,119,129 In this context, it is believed to be the Bi–O bonding signal resulting from the metallic bismuth present on the surface. BaCO3 also has a typical O 1s signal at 530.8–531 eV; however, the absence of a photoemission signal at 290 eV in C 1s negates the existence of carbonate species (CO32−).90,96 The decrease in the intensity of OAD w.r.t. OL, as seen from the area ratio (0.67 → 0.29), is due to the reduction in the surface area of the sample upon Bi substation, which is verified by the morphological analysis. Discarding the possibility of adsorbed water, CO2 adsorption, and organic functional groups, the fourth bands (OC) in LBB20 and LBB40, respectively at 532.1 eV and 532.4 eV, are attributed to oxide ions with low electron density and a very low coordination state. Such oxygen can be associated with cation vacancies in the oxide structure. This band lies at 4.1 eV from the average lattice oxygen position in LBB20, and the separation declines to 3.8 eV upon further substitution, and the area ratio of OC to lattice oxygen almost remains the same. This is in agreement with the trend of the Mn3+/Mn4+ charge ratio upon Bi substitution, that is, the generation of Mn4+ due to cationic vacancies induced in the system is not linear but saturable from LBB0 to LBB40. This observation has greater implications for substitution-dependent structural phase change in the investigated samples. The C 1s core spectra complement the findings from the O 1s and Bi 4f spectra. Using a simple double derivative method, the BE positions in the C 1s spectra indicative of different origins were estimated. In LBB0, there were two prominent bands at 284.5 eV and 289 eV. These BE positions belong to adventitious carbon of graphitic type C–C bonding and polar carbonyl CO bonding, respectively. Upon Bi substitution, an additional band appeared on the lower BE at 282.5 eV and 283.3 eV at 20% and 40% substitution, respectively. This signal comes essentially from the carbide bonding of Bi-C.130,131 Such bonding between Bi and carbon is believed to be formed by the reaction between chemisorbed carbon and metallic bismuth segregated from the main phase. Notably, with enhanced substitution of bismuth, all the core levels of A-site, B-site cations and anion shift to lower BEs, but the core levels of Bi shift
by 0.7 eV to a higher BE. The studies claim that this is due to the strengthening of the Bi–O bond, which changes the chemical environment, local structure and electronic structure around Bi.132 For elements like Bi, as the oxidation state increases from Bi0, the core BE shifts higher due to a strong effective nuclear charge experienced by the core electrons. It is thoroughly established that in the studied specimens, Bi is in the 3+ oxidation state (the stable +5 oxidation state is ruled out based on the BE position of Bi5+ in the perovskite environment) and behaves as a Lewis acid, that is, it can accept electron pairs or withdraw electron density. The high charge density of Bi3+ creates an electron-deficient environment around the ion, making it capable of accepting electron pairs. As Bi3+ is a heavy ion, the creation of a core hole further increases the effective nuclear charge of Bi3+, resulting in a positive shift of BE. Meanwhile, less electronegative cations would act as electron donors to oxygen. In the presence of Bi3+, the redistribution of electron density of oxygen happens in such a way that the Mn–O, La–O and Ba–O bonds become weak, leading to a negative shift in BE.
From the findings of XPS analysis, such as, the metallic bismuth and Bi-C bonding, respectively seen in the Bi 4f and C 1s core spectra, the deviation seen in the expected 70/30 Mn3+/Mn4+ charge ratio and perhaps the additional peak observed in the O 1s spectra at ≈532.1–532.4 eV in LBB20 and LBB40, clearly indicates bismuth segregation from the perovskite lattice. The consequence of such segregation is the formation of vacancies in the lattice, resulting in compounds with the formula (LaBiBa)1−xV(Bi)xMnO3, where V(Bi) corresponds to bismuth vacancies of charge −3 at the A-site. These increasing vacancies are the root cause of the structural phase transition. Notably, the A-site vacancies are not intentional as they occur intrinsically because of the volatility of Bi2O3. The resultant compound can be considered a self-doped manganite, which is known to display a structural transition from asymmetric to symmetric space groups.133
The effects of lacunarity on structure and magnetism are strikingly different in rare-earth-deficient and alkaline-earth-deficient manganites. For instance, La/Nd/Pr deficiency has detrimental effects on the unit cell volume, whereas Na/Ba/Sr/Ca deficiency shows an enhancement in lattice parameters and unit-cell volume.134 A nominal deficiency in the latter reduces the TC, whereas rare-earth deficiency improves the TC135,136 marginally. However, the as-prepared manganites, under the assumption that they are rare-earth deficient, were found to show a contrary result. The cell volume increases up to LBB10, followed by a dramatic decrease due to the structural transitions. Although the estimation of tolerance factor and A-site cationic variance using empirical and statistical approaches doesn’t support such a dramatic change, the tolerance factor estimated using the formula  (where 〈A–O〉 and 〈B–O〉 are the expected bond lengths of the A-site and B-site, respectively) shows a significant improvement approaching unity. At this point, it is important to consider the average ionic radius 〈rA〉 of the A-site. Assuming La, Bi, and Ba in 9 coordinates, the 〈rA〉 undergoes a small change from 1.29 Å to 1.30 Å, but in 12 coordinates, its changes from 1.43 Å to 1.45 Å. Notably, these values do not include the vacancy radius. The cationic vacancy radius is significantly larger compared to the corresponding cation and thus would result in significant changes in 〈rA〉 i.e. internal pressure. In a recent work on the effect of bismuth in tuning structural transitions in NaNbO3,137 the co-existence of multiple ion species at the A-site was found to yield a disordered system with increased configurational entropy. These disorders caused an ordered asymmetrical structure to fully convert into a disordered cubic phase. The increasing disorder at the A-site was accommodated by an anomalous expansion of the lattice during the order–disorder phase transitions. An exact replication is observed in our specimens, with an anomalous change in lattice volume seen at the LBB10–LBB20 boundary.
Temperature-dependent magnetic analysis
The temperature (T)-dependence of magnetization (M) in the zero field cooled (ZFC) protocol, the second order derivative of M, and linear fit to inverse susceptibility (χ−1) are shown in Fig. 12. The distinct feature of the variation in magnetization is the step-like transition from nearly zero positive values of M at high temperatures to significantly higher M at low temperatures. This denotes a typical transition from a paramagnetic (PM) to a ferromagnetic (FM) state. The temperature at which the transition happens is called the Curie temperature (TC), and it is obtained from the
  versus T plot. The TC values were 333 K, 315 K, and 293 K for LBB0, LBB5 and LBB10, respectively. Evidently, magnetization in the FM regime reduced visibly from LBB0 to LBB10. The reduction in TC and M with Bi3+ substitution to La3+ is quite intriguing as both are isovalent and nonmagnetic in nature. It is well-known that the magnetism of MVMs is dependent on the transition metal ion Mn, unless magnetic rare-earths are present at the A-site. The magnetic interaction between the two ions (Mn3+ and Mn4+) arises due to the double exchange (DE) mechanism; electron hopping occurs between the ions through a bonding ligand. The strength of hopping depends on the extent of mixed valency, average bond length (〈Mn–O〉) and average bond angle (〈Mn–O–Mn〉).5 In this context, the bandwidth of the conduction band for electrons indicates whether an electron can be itinerant or localized, thus deciding the exchange interactions between the magnetic ions Mn3+ and Mn4+. The bandwidth W is defined as
 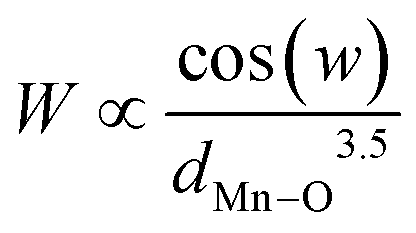 , where
  , dMn−O is 〈Mn–O〉.138 In this investigation, the bandwidth remained nearly constant at about 0.094. The same was true for A-site cationic variance and the tolerance factor. Therefore, it can be stated that these structural attributes are unlikely to cause a shift in TC or a reduction in M. The effective paramagnetic moment might unveil some insights into the observed changes. Effective paramagnetic moment (μeff) represents the average magnetic moment of an isolated magnetic ion or atom in a material. In these specimens, the magnetic moments of Mn3+ and Mn4+ would average to give μeff. Notably, even though the charge ratio Mn3+/Mn4+: 70/30 is expected to remain constant due to isovalent substitution, the oxygen off stoichiometry and A-site cationic vacancies can upset charge neutrality. This, in turn, changes the charge ratio, which affects the paramagnetic moments (clearly established in XPS analysis). The Curie–Weiss (CW) law was employed to estimate μeff. The CW law is defined as
  , where C is the Curie constant, and θP is the Weiss temperature, which is equal to TC in a homogeneous ferromagnet. The Weiss temperature signifies the onset of ferromagnetic ordering. Mathematically, the Curie constant C is defined as
  =
=  , where μ0 = 10−7 H m−1 is the permeability of free space, g is the Lande factor, J = L + S is the total moment, μB = 9.27 × 10⁻²⁴ J T−1 is the Bohr magneton, and kB = 1.38 × 10⁻²³ J K−1 is the Boltzmann constant. The Curie constant obtained from the linear fit to χ−1, where χ is expressed in emu mol−1, would give μexpeff according to the equation
  . The theoretical value of μeff (μtheff) was obtained using the expression
  , where μeff(Mn3+) = 4.9 μB and μeff(Mn3+) = 3.87 μB. In this investigation, for a charge ratio of 70:30 the μtheff = 4.62 μB139 (which is strictly not for LBB5 and LBB10 due to the variation in charge ratio). The linear fit to χ−1 in the paramagnetic region is shown in Fig. 12. The parameters obtained from the fitted data, including θP, C and μeff, are tabulated in Table 5.
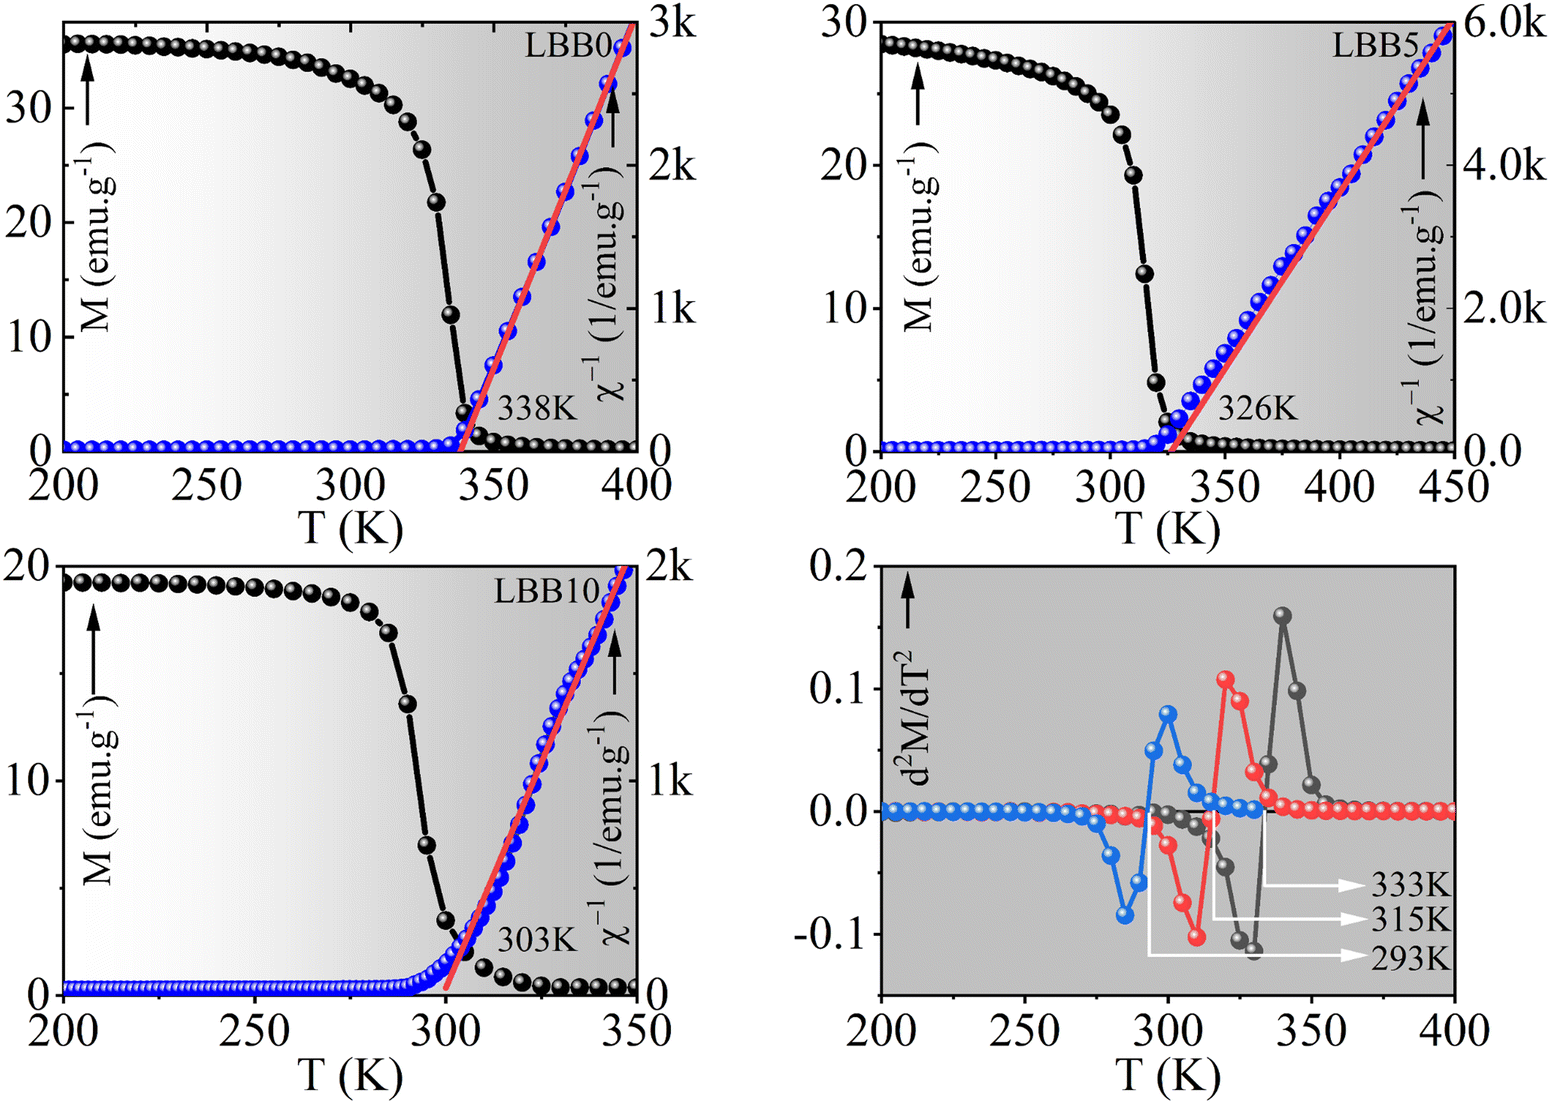 | ||
| Fig. 12 Temperature dependence of magnetization of LBB0, LBB5 and LBB10 and their double derivative and linear fit to inverse susceptibility using the Curie–Wiess law. | ||
| Sample code | T C (K) | θ P (K) | C (emu K mol−1) | μ theff (μB) | μ expeff (μB) |
|---|---|---|---|---|---|
| LBB0 | 333 | 338 | 4.9 | 4.62 | 6.2 |
| LBB5 | 315 | 326 | 5.0 | <4.62 | 6.3 |
| LBB10 | 293 | 303 | 4.7 | <4.62 | 6.1 |
The positive values of θP indicate the existence of FM interactions in the samples, thereby confirming PM to FM second-order phase transition (SOPT).140 However, the incongruity observed here is the difference between μtheff and μexpeff. This points out the limitation of applying the classical Curie–Weiss law to polycrystalline manganites. The studies on La1−xSrxMnO3 based on electron-spin resonance and magnetic measurements have shown that perovskite manganites are inhomogeneous ferromagnets, which means the FM clusters can be found even above the TC. This is responsible for the larger value of μexpeff compared with μtheff.141,142 The same is true for θP and TC. The θP values are higher than the TC values, and the difference between them (θP–TC) increases with increasing Bi content. This indicates that Bi substitution suppresses magnetic homogeneity to enhance disorder. Thus, the decrease in TC and M is purely Bi3+ driven. A recent study on bismuth-substituted manganites reports that the weakened magnetic interaction is solely attributed to the 6s2 lone pair characteristics of bismuth. The strong hybridization between the Bi 6s orbitals and O 2p orbitals results in a stronger attraction towards the 2p electron cloud of O compared with Mn. As a result, the electronic cloud density is redistributed to balance the hopping and localization of eg electrons. Thus, the double-exchange interaction between Mn4+ and Mn3+ ions is weakened, and AFM coupling occurs around Bi3+ ions through super-exchange interactions between Mn ions of the same species. The long-range FM ordering is disrupted in this case, and short-range FM clusters are developed.143 This is the cause for the reduction in TC and M. The strong electron-withdrawing nature of Bi3+, which is responsible for the localization of ligand electrons, is discussed in detail in the XPS studies. At this point, it should be noted that the reduction in TC through Bi substitution in La0.7Ba0.3MnO3 has a fascinating outcome, namely, specimen LBB5. This ferromagnetic MVM has TC in the range of 313 to 315 K, which is 40–42 °C, called the moderated hyperthermia range. In this narrow temperature range, cancerous cells die, and healthy body cells ideally recover even after extended exposure to heat.
Magnetic hyperthermia treatment is a medical procedure that involves local heating of the body using a magnetic field to destroy cancer cells. A chemical compound that responds to the external magnetic field is introduced into the body to enable heating. These chemical compounds are generally magnetic nanoparticles and are controlled to move towards and accumulate in the cancerous tissues or are directly injected at the tumour site. Once these nanoparticles are in place, an alternating magnetic field (AMF) is applied to generate heat. This heat can raise the temperature of the tumour to a level that it can damage or kill cancer cells, with minimal damage to the surrounding healthy tissue. Generally, the tolerance of healthy cells (human body tissue) is up to around 42–43 °C (107.6–109.4 °F) for brief periods without significant damage. Beyond this point, the cells will undergo irreversible damage, which leads to cell death and tissue damage. Notably, the tolerance of cancer cells is still at lower limits.17,20,144 In MHT, the AMF can affect the stimulation of peripheral nerves and cardiac tissue. This implies that an AMF of random amplitude and frequency cannot be used for treatment. A high-frequency and higher-amplitude AMF can cause harmful electrical activity, leading to discomfort, pain, or even nerve damage. Similarly, very strong magnetic fields can interfere with the electrical activity of the heart and induce arrhythmias or other cardiac disturbances. Moreover, high-frequency AMF can induce eddy currents and cause nonspecific heating in tissues. Contrary to these effects, fields that are too low in amplitude and frequency may not be effective for the given quantity of MNPs and may not produce enough heat for effective treatment. The upper stimulation threshold Hmax is limited to a range from 10 Oe at f = 100 kHz to 10 kOe at f = 10 Hz. Once the range is known, the product quantity decides the possible combination of Hmax and f. To avoid the harmful effects of electromagnetic field on the human body, during treatment, the upper limit of f × H should not exceed the maximum value of (f × H)max. Clinical trials have shown that subjects do not experience severe discomfort at (f × H)max = 6.3 × 10⁷ Oe s−1 for a duration of one hour. With all these considerations, fields (Hmax) in the range of 500 Oe to 1500 Oe and frequency around 100 kHz are apt for long-exposure hyperthermia treatment (30 min to 60 min).18,145 Manganites are considered suitable candidates for MHT due to their inherent property called the magnetocaloric effect.
The MCE is a physical phenomenon in which a magnetic material releases/absorbs heat under a changing magnetic field. The quantities that measure the amount of heat released/absorbed are the magnetic entropy change (ΔSM) under isothermal conditions and adiabatic temperature change ΔTad. Accordingly, indirect routes, such as magnetization measurements, heat capacity measurements and/or direct methods, can be employed to find these quantities.146 In this investigation, a magnetization route was adopted to calculate ΔSM and thus ΔTad. Moreover, a phenomenological model was employed to obtain the thermomagnetic parameters of the prepared samples at very low magnetic fields (essentially ΔSM), the details of which are given in ESI.† There was a good agreement between the ΔSM obtained using the two different methods (Fig. S12, ESI†). Further, in principle, the physical quantity called specific absorption rate (SAR), along with the biocompatibility of the specimen, is utilised to evaluate the feasibility for magnetic hyperthermia. It quantifies the optimum heat evolution from MNPs when exposed to an external magnetic field. Above all one can perform preclinical trials on deceased lab rat using MNPs and monitor the growth inhibition upon magnetic hyperthermia treatment. Compared to these routes, a simpler and non-invasive route is the estimation of ΔTad. This stands as a preliminary identifier of any magnetic material that is considered a candidate for magnetic hyperthermia.
The estimation of ΔSM using the magnetization method involves calculating M versus H at different T (magnetic isotherms). The ΔSM can be obtained through a numerical method, which approximates Maxwell's integration. It is expressed as  . Here Mi and Mi+1 are the magnetizations at Ti and Ti+1, respectively, for a field change of Hi+1 − Hi.147Fig. 13 shows the magnetic isotherms at a maximum field change (Hmax) of 50 kOe around the TC. The variation of M versus H shows an abrupt escalation in M with eventual saturation, and the gradual and almost linear increase of M as T increases from 280 K testifies the FM to PM phase transition. The nature of the phase transition is SOPT, as confirmed by the positive slopes in the Arrott plots148 (Fig. 13, middle panel). The nature of phase transition is pivotal in MHT. This is because, unlike FOPT and other ferrimagnetic oxides, SOPT MVMs do not produce uncontrolled heating due to eddy currents when subjected to AMF, as they have insignificant magnetic hysteresis.16 The variation of ΔSM with T at a Hmax of 5 kOe to 20 kOe with a step size of 5 kOe is shown in Fig. 13 (middle panel). The estimated ΔSmaxM values at a Hmax of 20 kOe in LBB0, LBB5 and LBB10 were 2.6 J kg−1 K−1, 2.5 J kg−1 K−1, and 2.5 J kg−1 K−1, respectively (Table 6). The peak values of these ΔSM are respectively observed at 333.5 K, 315.5 K and 291.5 K. Notably, the maximum value of ΔSM varies almost linearly with the field, and the speculated sharp drop of ΔSmaxM upon Bi substitution is not seen (% change = 4%). The prime motive of Bi substitution in any MVM is to reduce the TC to room temperature. However, this always comes at the cost of a reduction in the magnitude of ΔSmaxM due to parallel effects, such as damage to the magnetic interactions by the 6s lone pairs and structural distortions. However, in this investigation, the phase reversal from rhombohedral to a cubic structure counterbalances the weakening of magnetic interactions by removing the distortion part. The improvement in bond angle (Mn3+–O–Mn4+) towards 180° enhances the probability of hopping and hence the magnetic interaction between two neighbouring Mn ions of different valency. In such a case, LBB10 should have shown a higher ΔSmaxM. The explanation is, though initially the generic characteristics of Bi3+ and Bi2O3, such as its larger ionic radius than La3+ and low melting point, respectively work in favour of crystal lattice relaxation and enhancing the overall homogeneity (crystallization and grain growth), and localization of the hopping eg electrons at the site of Bi3+ is inevitable due to its large electron-withdrawing nature. Therefore, as the population of Bi3+ increases, magnetic disorder become the dominant attribute that determines the magnetism of the specimen. At low concentrations up to LBB10, structural relaxation (change of bond angles to 180°) will dominate 6s lone pair-driven localization and thereby increase the probability of hopping. Though no phase reversal has been reported, a similar effect i.e., either improvement in ΔSmaxM or the retention of ΔSmaxM magnitude, to that of the parent composition is seen in few MVMs, such as La0.85−xBixNa0.15MnO3,148 La0.67−xBixBa0.33MnO3,149 and La0.67−xBixBa0.33MnO3.150 This peculiarity is attributed to cooperative structural dynamics, where bond lengths and bond angles shall turn in favour of FM spin ordering or lay a pathway for easy magnetization across TC. This leads to improvement in FM moments and/or allows abrupt PM to FM transition, almost like a first-order transition.
 | ||
| Fig. 13 Magnetic isotherms (top panel), Arrott plots (middle panel) and temperature-dependent variation of the magnetic entropy change (bottom panel) of LBB0, LBB5 and LBB10 specimens. | ||
| ΔHmax | ΔSM (J kg−1 K−1) | ΔTad (K) | ||||
|---|---|---|---|---|---|---|
| kOe | LBB0 | LBB5 | LBB10 | LBB0 | LBB5 | LBB10 |
| Note: < indicates that the values are approximate and may be less than the actual physical quantity obtained through direct measurement. | ||||||
| 5 | 1.06 | 0.81 | 0.85 | <0.7 | <0.5 | <0.5 |
| 10 | 1.74 | 1.47 | 1.51 | <1.1 | <0.9 | <0.9 |
| 15 | 2.22 | 2.01 | 2.03 | <1.4 | <1.2 | <1.2 |
| 20 | 2.62 | 2.46 | 2.46 | <1.7 | <1.5 | <1.4 |
Hereafter, it should be noted that the isothermal magnetic entropy change is an extensive property, and it may not be an appropriate physical quantity to evaluate the applicability of a specimen in MR or MHT.151 In this regard, adiabatic temperature change is an apt parameter to quantitatively assess the temperature changes a material shall produce. The ΔTad at a characteristic temperature T0 is given by the expression  . Here CP(T0, H) is the heat capacity at T0. This equation is the numerical approximation of the integral
  , which shows the numerical approximation is possible only when CP(T, H) is weakly dependent on ΔH. A recent study by Anna Kosogor and Victor A. L’vov152 has shown that the numerical approximation leads to a dramatic overestimation of ΔTad. They showed that the CP(T, H) of FOPT Fe–Rh alloys is not independent of the applied field but shows obvious changes with changes in the magnetic field (essentially a decrease in the of magnitude of CmaxP and the shift of CmaxP to lower T with ΔH). This is also true for several MVMs, except the CmaxP shifts to higher T with ΔH. Based on these findings, there are two considerations. First, MHT happens essentially at low magnetic intensities, not more than 10 kOe. This means that the modulation and shift of CmaxP on the T axis is marginal; secondly, as the manganites obey the Debye concept of specific heat just like other solids (except during transition), the classical value of CP = 3 × NAkB (Dulong–Petit law)151,153 is considered as CP(T, H) at room temperature. Notably, the contribution to CP mostly comes from the lattice part of CP, which is found to saturate above the Debye temperature (ΘD) to a classical value of CP = 3 × NAkB. This value is significantly smaller compared to its jump, CmaxP at zero field (CmaxP–ClatticeP ≈ 20 to 30 J kg−1 K−1). Therefore, before estimating the ΔTad using numerical approximation, we considered low fields not exceeding 20 kOe and used classical saturation values of specific heat based on the fact that the ΘD of manganites is close to RT.151,154 Thus, the actual ΔTad values are essentially less than the estimated values. The near-room-temperature heat capacity values of LBB0, LBB5 and LBB10 were 516.5 J kg−1 K−1, 509.1 J kg−1 K−1 and 502.0 J kg−1 K−1, respectively, and the estimated ΔTad value of LBB5 was nearly 1 K for a field change of 10 kOe (Table 6). This value is 42% of the prototype MCE material, Gd. We compared our results with other manganites for which ΔTad was calculated by the direct method or from specific heat measurements, as seen in Table 7. The ΔTad of nearly 1 K is in good agreement with the reported data. Although, incorporation of all those materials, which have been scrutinized over the time through direct measurement or through specific heat, may not be possible in this review, we have tried to quote the notable ones.
| Specimen | T C (K) | ΔSmaxM (J kg−1 K−1) | ΔTad (K) | ΔH (T) |
|---|---|---|---|---|
| La0.7Ba0.3MnO3 | 333.5 | 1.74 | <1.1 | 1 |
| La0.65Bi0.05Ba0.3MnO3 | 315.5 | 1.47 | <0.9 | 1 |
| La0.6Bi0.1Ba0.3MnO3 | 291.5 | 1.51 | <0.9 | 1 |
| Pr0.6Sr0.4MnO3155 | 281 | 2.06 | 1.10 | 1.8 |
| Pr0.6Sr0.4MnO3156 | 306 | ∼1.9 | ∼1 | 1 |
| La0.7Ca0.3MnO3157 | 254 | 6.05 | 2.60 | 1.8 |
| La0.8Ag0.1MnO2.92158 | 287 | 3.2 | 1.5 | 2.6 |
| La0.75Sr0.08Ca0.17MnO3159 | 295 | — | 0.78 | 1.4 |
| La0.6Ca0.4MnO3160 | 260 | ∼2.5 | 1.1 | 1 |
| La0.3Pr0.4Sr0.3MnO3161 | 319 | 1.71 | 1.09 | 1.8 |
| Pr0.7Sr0.3MnO3161 | 262 | 3.61 | 1.75 | 1.8 |
| La0.67Ca0.33MnO3162 | 267 | 5.9 | 2 | 1.2 |
| La0.67Sr 0.33MnO3162 | 369 | 1.8 | 1.07 | 1.2 |
| La0.8Ag0.15MnO3163 | 265 | 5.6 | 2.7 | 2.6 |
| La0.5Ca0.4Pb0.1MnO3164 | 255 | ∼2.25 | 0.60 | 1.96 |
| La0.67Ca0.33MnO3165 | 268 | 6.9 | 2.4 | 2.02 |
| Pr0.7Sr0.3MnO3166 | 263 | 3.38 | 1.81 | 1.8 |
| La0.6Ca0.4MnO3167 | 268 | ∼1.75 | 0.5 | 0.7 |
| Pr0.7Sr0.2Ca0.1MnO3168 | 197 | 6.55 | 2.42 | 1.8 |
| (La0.7Sm0.3)0.67Ba0.33MnO3169 | ∼150 | 1.47 | 0.72 | 3 |
| (La0.8Pr0.2)0.67Ba0.33MnO3170 | ∼195 | 1.5 | 0.72 | 3 |
| La0.4Pr0.3Ca0.1Sr0.2MnO3171 | 289 | 2.98 | 1.5 | 1.9 |
It should be noted that this review is restricted to the upper limit of the magnetic field permitted in MHT for therapeutic effects. With respect to MHT, several manganite compositions have ΔTad either greater than or similar to that of our specimen, but their effective temperature TC is either too high or too low with reference to the hyperthermia regime.
According to the recent study by A. O. Ayaş et al.17 on the applicability of magnetocaloric (MC) materials for MHT, for any MC material to be a candidate for magnetic hyperthermia, the following four parameters must be considered: ΔSM, ΔTad, δTFWHM, and TC. The first two parameters indicate the heating/ cooling efficiency of the material; the TC decides the operating temperature, and δTFWHM governs the cutoff point of heating when the material is subjected to AMF. There are numerous materials, including rare-earth Gd, rare-earth-based intermetallic alloys and transition metal-based alloys, which show giant MCE, but the drawback is their instability in ambient conditions and liquid media, high material cost and poor biocompatibility. Manganites belong to a family of perovskite oxides that have excellent chemical stability in a wide temperature range and moderate pressure. Their production cost is low, the precursors are cheap except for the rare-earth elements, and they are biocompatible but show moderate MCE. However, it should be noted that though ΔSM and /or ΔTad play important roles in determining the MR applicability of a material, they need not be prioritised in the case of MHT. In fact, TC and δTFWHM are the major indicators for material selection towards MHT. The variation of ΔSM(T) generally follows a bell curve, with a maximum at the TC and drops across the Curie point. As discussed earlier, for therapeutic purposes, the TC of a MC material cannot be higher than 315 K due to the possibility of overheating of the healthy tissues. Further, it cannot be far away from 315 K as therapeutic hyperthermia loses its significance. If the magnetic transition is very close to 315 K, say a specimen with TC = 312 K and a sharp magnetic transition of δTFWHM ≈ 4 K shall be an ideal candidate for magnetic hyperthermia. This is because if the material continues to heat above 315 K, the situation yields a hazardous effect on the subject as a conventional hyperthermia procedure does. Along with the said parameters, low eddy current loss is a crucial parameter for MHT candidates. The merits of specimen LBB5 are its TC in the range 313 K to 315 K, which is in accordance with the requirement for magnetic hyperthermia. Moreover, it is a second-order transition material such that there is no hysteresis loss, which means low eddy current losses and no uncontrolled heating of the specimen. It is true that δTFWHM ≈ 16 K at a field change of 1.5 kOe will lead to sample heating above 315 K. This opens up a future task to produce nanoparticles of the same composition, perhaps using a top-down approach, such as high-energy ball milling. According to many studies, such a process will produce MNPs of spherical morphology with TC shifted to lower temperatures and improved Sm and ΔTad. As result the δTFWHM (right side of bell curve) shall span in the vicinity of 315 K.149
Conclusions
Bi3+ substitution of La3+ in a CMR composition, such as La0.7Ba0.3MnO3, is not unipartite but yields a multitude of favourable outcomes at different concentrations. The major finding of this work is the concentration-dependent structural phase transition from rhombohedral Rc to cubic Pmm perovskite. The results assert that through the solid-state synthesis route, a homogenous and nearly stoichiometric composition of (LaBi)0.7Ba0.3MnO3 can be achieved at a low sintering temperature of 1000 °C in a short soaking time of 12 h. The homogeneity is sustained in the marginal substitution range (≤10% of Bi), but substitution of Bi3+ beyond 10% results in the segregation of metallic Bi. The structure is no longer stoichiometric but a self-doped lacunar composition. The interplay of bismuth concentration and its lacunarity result in fascinating structural and morphological features. The structural phase transition from an ordered low-symmetry rhombohedron to a disordered symmetric pseudo-cube is rare in La-based mixed valent manganites. The dramatic increase in internal pressure due to a large Bi vacancy with −3 electronic charge at the A-site is responsible for this phase transition. The theoretical study of the pseudo-cubic transformation of rhombohedral La0.7−xBixBa0.3MnO3 (x = 0 to 0.1) by constructing parametric curves to locate La0.7−xBixBa0.3MnO3 (x = 0 to 0.1) appears to be an efficient way to account for the concentration-dependent structural transition irrespective of the direction of symmetry change (symmetric or asymmetric). The FTIR spectroscopic studies validate the structural phase transition and uncover the enhanced covalency and an increase in resistivity of the specimen upon Bi3+ substitution. The far-infrared region serves as a fingerprint region of the prepared specimen, demonstrating the recovery of F1u degeneracy, which is the prime evidence of the structural phase transition. Apart from the Lewis acid nature and unique 6s2 lone pair of Bi, the low melting point of Bi2O3 causes visible changes in grain morphology. The grain size was the highest for La0.5Bi0.2Ba0.3MnO3 (≈1 μm2), and the grain boundaries had almost disappeared in the micrometre range. The XPS analysis emphasises the fact that La-based mixed-valent manganites are not homogeneous in their composition but can display complex electronic structure because of configuration entropy in the system. The lattice structure is mostly anisotropic, with suboxide phases, metallic impurities, cationic vacancies, oxygen off stoichiometry and surface termination. Though rare-earth-based manganites are thought to be chemically stable, the surface and subsurface levels shall have large contamination from hydroxyl and carbonyl groups. A major finding from the XPS analysis is that the A-site cationic lacunarity is mostly due to the segregation of metallic Bi. Nevertheless, it causes a structural phase transition from ordered low-symmetry to disordered aristo-type perovskite. Bi substitution leads to successful tuning of TC in the studied material. The higher TC (333 K) is effectively shifted to room temperature without disturbing the charge ratio by means of Bi3+-induced magnetic disorders. The strong hybridization between Bi3+ and O2− weakens the magnetic interaction between the ferromagnetic spins, thus reducing the TC. The isothermal magnetic entropy change and adiabatic temperature change (though it drops marginally by 4%) in all three specimens have more or less similar values even up to 10% substitution, owing to structural phase reversal after Bi substitution. Finally, the concurrent attributes, such as the occurrence of TC at 315 K, relatively higher effective paramagnetic moment, a sharp magnetic transition width of 14 K, excellent magnetic entropy change of 2.5 J kg−1 K−1 and adiabatic temperature change of 1.5 K at a magnetizing intensity of just 2 T in the 5% Bi-substituted SOPT system makes it attractive for cooling and medical applications, such as magnetic refrigeration and magnetic hyperthermia therapy for cancer treatment. We propose that nanoparticles of said composition should be tested for biocompatibility and frequency-dependent specific absorption rate (SAR) to quantify the actual temperature changes in a biomimetic medium.
Author contributions
LDM: conceptualization, data curation, formal analysis, investigation, methodology, visualization, writing – original draft. EKH: investigation, validation, writing – review & editing. MSM: investigation. MDD: funding acquisition, project administration, supervision.Data availability
The data supporting this article have been included as part of the ESI.†Conflicts of interest
There are no conflicts of interest to declare.Acknowledgements
The Manipal Academy of Higher Education and UGC DAE Consortium for scientific research (UDCSR/MUM/CD/CRS-M-240/2017/1008) are acknowledged for their support in carrying out the present research. The authors are indebted to Dr Mukul Gupta and Layanta Behera (UGC-DAE CSR, Indore) for providing XRD measurements; Dr Uday Deshpande and Sachin Kumar (UGC-DAE CSR, Indore) for providing FTIR and XPS measurements; Mendonca L. D. is thankful to Patricia Mendonca and Leslie David Mendonca for their invaluable cooperation throughout the work. Pramod R. Nadig, Parveen Garg and Vignesh K. R. are acknowledged for fruitful discussions on structuring the entire manuscript over the course of time.References
- G. H. Jonker and J. H. Van Santen, Physica, 1950, 16, 337–349 CrossRef CAS.
- M. B. Salamon and M. Jaime, Rev. Mod. Phys., 2001, 73, 583–628 CrossRef CAS.
- C. Roy and R. C. Budhani, Phys. Rev. B: Condens. Matter Mater. Phys., 1998, 58, 8174–8177 CrossRef CAS.
- E. J. Cussen and P. D. Battle, Chem. Mater., 2000, 12, 831–838 CrossRef CAS.
- C. Zener and R. R. Heikes, Rev. Mod. Phys., 1953, 25, 191–198 CrossRef CAS.
- R. M. Kusters, J. Singleton, D. A. Keen, R. McGreevy and W. Hayes, Phys. B, 1989, 155, 362–365 CrossRef CAS.
- R. Von Helmolt, J. Wecker, B. Holzapfel, L. Schultz and K. Samwer, Phys. Rev. Lett., 1993, 71, 2331–2333 CrossRef CAS PubMed.
- K. Chahara, T. Ohno, M. Kasai and Y. Kozono, Appl. Phys. Lett., 1993, 63, 1990–1992 CrossRef CAS.
- S. Jin, T. H. Tiefel, M. McCormack, R. A. Fastnacht, R. Ramesh and L. H. Chen, Science, 1994, 264(5157), 413–415 CrossRef CAS PubMed.
- H. L. Ju, C. Kwon, Q. Li, R. L. Greene and T. Venkatesan, Appl. Phys. Lett., 1994, 65, 2108–2110 CrossRef CAS.
- M. McCormack, S. Jin, T. H. Tiefel, R. M. Fleming, J. M. Phillips and R. Ramesh, Appl. Phys. Lett., 1994, 64, 3045–3047 CrossRef CAS.
- Y. Moritomo, A. Asamitsu, H. Kuwahara and Y. Tokura, Nature, 1996, 380, 141–144 CrossRef CAS.
- Y. Tokura, A. Urushibara, Y. Moritomo, T. Arima, A. Asamitsu, G. Kido and N. Furukawa, J. Phys. Soc. Jpn., 1994, 63, 3931–3935 CrossRef CAS.
- A. Urushibara, Y. Moritomo, T. Arima, A. Asamitsu, G. Kido and Y. Tokura, Mater. Sci. Eng., B, 1995, 51, 15 Search PubMed.
- V. K. Pecharsky and K. A. Gschneidner, Jr., Phys. Rev. Lett., 1997, 78, 4494–4497 CrossRef CAS.
- M.-H. Phan and S.-C. Yu, J. Magn. Magn. Mater., 2007, 308, 325–340 CrossRef CAS.
- A. O. Ayaş, E. Seçilmiş and A. Ekicibil, J. Mol. Struct., 2021, 1231, 130010 CrossRef.
- A. V. Pashchenko, N. A. Liedienov, I. V. Fesych, Q. Li, V. G. Pitsyuga, V. A. Turchenko, V. G. Pogrebnyak, B. Liu and G. G. Levchenko, RSC Adv., 2020, 10, 30907–30916 RSC.
- O. V. Melnikov, O. Y. Gorbenko, M. N.
![[M with combining caron]](https://www.rsc.org/images/entities/char_004d_030c.gif) arkelova, A. R. Kaul, V. A. Atsarkin, V. V. Demidov, C. Soto, E. J. Roy and B. M. Odintsov, J. Biomed. Mater. Res., Part A, 2009, 91A, 1048–1055 CrossRef CAS PubMed.
arkelova, A. R. Kaul, V. A. Atsarkin, V. V. Demidov, C. Soto, E. J. Roy and B. M. Odintsov, J. Biomed. Mater. Res., Part A, 2009, 91A, 1048–1055 CrossRef CAS PubMed. - R. Hamdi, D. Ramotar, S. S. Hayek, A. Samara, S. A. Mansour and Y. Haik, Inorg. Chem. Commun., 2023, 150, 110551 CrossRef CAS.
- M. C. Ferreira, B. Pimentel, V. Andrade, V. Zverev, R. R. Gimaev, A. S. Pomorov, A. Pyatakov, Y. Alekhina, A. Komlev, L. Makarova, N. Perov and M. S. Reis, Nanomaterials, 2021, 11, 1826 CrossRef CAS PubMed.
- V. M. Kalita, A. I. Tovstolytkin, S. M. Ryabchenko, O. V. Yelenich, S. O. Solopan and A. G. Belous, Phys. Chem. Chem. Phys., 2015, 17, 18087–18097 RSC.
- H. L. Ju, Y. S. Nam, J. E. Lee and H. S. Shin, J. Magn. Magn. Mater., 2000, 219, 1–8 CrossRef CAS.
- R. C. Budhani, C. Roy, L. H. Lewis, Q. Li and A. R. Moodenbaugh, J. Appl. Phys., 2000, 87, 2490–2496 CrossRef CAS.
- A. Chakraborty, P. Sujatha Dévi and H. S. Maiti, J. Mater. Res., 1995, 10, 918–925 CrossRef CAS.
- B. Dabrowski, K. Rogacki, X. Xiong, P. W. Klamut, R. Dybzinski, J. Shaffer and J. D. Jorgensen, Synthesis and properties of the vacancy-free La1−xBaxMnO3, Phys. Rev. B: Condens. Matter Mater. Phys., 1998, 58, 2716 CrossRef CAS.
- S. J. Youn and B. I. Min, Phys. Rev. B: Condens. Matter Mater. Phys., 1997, 56, 12046–12049 CrossRef CAS.
- S. Matsumoto, H. Faqir, H. Chiba, M. Kikuchi and Y. Syono, Mater. Lett., 1999, 39, 36–41 CrossRef CAS.
- T. Ogawa, H. Shindo, H. Takeuchi and Y. Koizumi, Jpn. J. Appl. Phys., 2006, 45, 8666 CrossRef CAS.
- I. O. Troyanchuk, M. K. Karpuk, O. S. Mantytskaya and H. Szymczak, Crystallogr. Rep., 2004, 49, 626–630 CrossRef CAS.
- C. J. Bartel, C. Sutton, B. R. Goldsmith, R. Ouyang, C. B. Musgrave, L. M. Ghiringhelli and M. Scheffler, Sci. Adv., 2019, 5, 1–9 Search PubMed.
- M. O’Keeffe, B. G. Hyde and J. O. Bovin, Phys. Chem. Miner., 1979, 4, 299–305 CrossRef.
- H. J. A. Koopmans, G. M. H. Van De Velde and P. J. Gellings, Acta Crystallogr., 1983, C39, 1323–1325 CAS.
- M. W. Lufaso and P. M. Woodward, Acta Crystallogr., Sect. B, 2001, 57, 725–738 CrossRef CAS PubMed.
- H. Arandiyan, S. S. Mofarah, C. C. Sorrell, E. Doustkhah, B. Sajjadi, D. Hao, Y. Wang, H. Sun, B. J. Ni, M. Rezaei, Z. Shao and T. Maschmeyer, Chem. Soc. Rev., 2021, 50, 10116–10211 RSC.
- M. Avinash, M. Muralidharan and K. Sivaji, Phys. B, 2019, 570, 157–165 CrossRef CAS.
- G. M. Tomboc, X. Zhang, S. Choi, D. Kim, L. Y. S. Lee and K. Lee, Adv. Funct. Mater., 2022, 32, 1–25 Search PubMed.
- W. Peng, L. Li, S. Yu, P. Yang and K. Xu, Ceram. Int., 2021, 47, 29191–29196 CrossRef CAS.
- K. Efimov, Q. Xu and A. Feldhoff, Chem. Mater., 2010, 22, 5866–5875 CrossRef CAS.
- T. Yagi, H.-K. Mao and P. M. Bell, Phys. Chem. Miner., 1978, 3, 97–110 CrossRef CAS.
- A. Le Bail, Powder Diffr., 2005, 20, 316–326 CrossRef CAS.
- L. B. Mccusker, R. B. Von Dreele, D. E. Cox, D. Louër and P. Scardi, J. Appl. Crystallogr., 1999, 32, 36–50 CrossRef CAS.
- H. D. Megaw and C. N. W. Darlington, Acta Crystallogr., Sect. A, 1975, 31, 161–173 CrossRef.
- N. W. Thomas, Acta Crystallogr., Sect. B, 1996, 52, 954–960 CrossRef.
- T. Harumoto, T. Sannomiya, S. Muraishi, J. Shi and Y. Nakamura, J. Appl. Crystallogr., 2014, 47, 1490–1501 CrossRef CAS.
- A. Gholizadeh, J. Adv. Mater. Process., 2015, 3, 71–83 Search PubMed.
- X. Wang, Q. Cui, Y. Pan and G. Zou, J. Alloys Compd., 2003, 354, 91–94 CrossRef CAS.
- P. T. Phong, S. J. Jang, B. T. Huy, Y. I. Lee and I. J. Lee, J. Mater. Sci.: Mater. Electron., 2013, 24, 2292–2301 CrossRef CAS.
- M. Rosić, D. Zagorac, D. Milivojević, N. Paunović, J. Zagorac, Z. Dohčević-Mitrović and B. Matović, J. Alloys Compd., 2016, 678, 219–227 CrossRef.
- C. Roy and R. C. Budhani, J. Appl. Phys., 1999, 85, 3124–3131 CrossRef CAS.
- M. Oumezzine, O. Hassayoun, R. Bellouz, H. B. Sales and E. K. Hlil, J. Alloys Compd., 2017, 729, 156–161 CrossRef CAS.
- E. Frozandeh-Mehr, A. Malekzadeh, M. Ghiasi, A. Gholizadeh, Y. Mortazavi and A. Khodadadi, Catal. Commun., 2012, 28, 32–37 CrossRef CAS.
- G. V. S. Rao, C. N. R. Rao and J. R. Ferraro, Appl. Spectrosc., 1970, 24, 436–445 CrossRef CAS.
- M. Bourguiba, Z. Raddaoui, M. Chafra and J. Dhahri, RSC Adv., 2019, 9, 42252–42261 RSC.
- R. V. Lakshmi, P. Bera, M. Hiremath, V. Dubey, A. K. Kundu and H. C. Barshilia, Phys. Chem. Chem. Phys., 2022, 24, 5462–5478 RSC.
- M. Madon and G. D. Price, J. Geophys. Res.: Solid Earth, 1989, 94, 15687–15701 CrossRef.
- H. Najjar and H. Batis, Catal. Rev., 2016, 58, 371–438 CrossRef CAS.
- X. Bao, J. Wang, X. Wu, C. He, H. Luo, Q. Bai, V. Bao, Y. Bai, J. Liu and S. Zhao, Phys. B, 2023, 671, 415410 CrossRef CAS.
- A. Krichene, P. S. Solanki, S. Rayaprol, V. Ganesan, W. Boujelben and D. G. Kuberkar, Ceram. Int., 2015, 41, 2637–2647 CrossRef CAS.
- M. A. I. Zainuddin, N. Ibrahim and Z. Mohamed, J. Solid State Chem., 2023, 328, 124355 CrossRef CAS.
- H. Gencer, S. Atalay, H. I. Adiguzel and V. S. Kolat, Phys. B, 2005, 357, 326–333 CrossRef CAS.
- A. Chakraborty and H. S. Maiti, Ceram. Int., 1999, 25, 115–123 CrossRef CAS.
- A. D. Souza, S. Rayaprol, M. S. Murari and M. Daivajna, Ceram. Int., 2021, 47, 1021–1033 CrossRef CAS.
- C. Liu, Z. Lan, X. Jiang, Z. Yu, K. Sun, L. Li and P. Liu, J. Magn. Magn. Mater., 2008, 320, 1335–1339 CrossRef CAS.
- M. Drofenik, A. Žnidaršič and D. Makovec, J. Am. Ceram. Soc., 1998, 81, 2841–2848 CrossRef CAS.
- K. Sun, Z. Lan, Z. Yu, L. Li, J. Huang and X. Zhao, J. Phys. D: Appl. Phys., 2008, 41, 235002 CrossRef.
- Z. Yu, K. Sun, L. Li, Y. Liu, Z. Lan and H. Zhang, J. Magn. Magn. Mater., 2008, 320, 919–923 CrossRef CAS.
- K. W. Lay, J. Am. Ceram. Soc., 1968, 51, 373–377 CrossRef CAS.
- J. F. Moulder, W. F. Stickle, P. E. Sobal and K. D. Bomben, in Handbook of X-ray Photoelectron Spectroscopy, ed. J. Chastain and R. C. King Jr, Perkin-Elmer Corporation, Minnesota, USA, 1992, vol. 40, p. 221 Search PubMed.
- M. F. Sunding, K. Hadidi, S. Diplas, O. M. Løvvik, T. E. Norby and A. E. Gunnæs, J. Electron Spectrosc. Relat. Phenom., 2011, 184, 399–409 CrossRef CAS.
- A. T. Fulmer, J. Dondlinger and M. A. Langell, Appl. Surf. Sci., 2014, 305, 544–553 CrossRef CAS.
- P. Burroughs, A. Hamnett, A. F. Orchard and G. Thornton, J. Chem. Soc., Dalton Trans., 1976, 1686 RSC.
- J. P. H. Li, X. Zhou, Y. Pang, L. Zhu, E. I. Vovk, L. Cong, A. P. van Bavel, S. Li and Y. Yang, Phys. Chem. Chem. Phys., 2019, 21, 22351–22358 RSC.
- A. Khaled, J.-J. Pireaux and S. Khelili, Acta Chim. Slov., 2012, 59, 766–778 CAS.
- D. F. Mullica, C. K. C. Lok, H. O. Perkins and V. Young, Phys. Rev. B: Condens. Matter Mater. Phys., 1985, 31, 4039–4042 CrossRef CAS PubMed.
- D. F. Mullica, H. O. Perkins, C. K. C. Lok and V. Young, J. Electron Spectrosc. Relat. Phenom., 1993, 61, 337–355 CrossRef CAS.
- M. AlKetbi, K. Polychronopoulou, M. Abi Jaoude, M. A. Vasiliades, V. Sebastian, S. J. Hinder, M. A. Baker, A. F. Zedan and A. M. Efstathiou, Appl. Surf. Sci., 2020, 505, 144474 CrossRef CAS.
- M. M. Nair, Université Laval, 2014.
- S.-W. Yu, M. H. Carpenter, F. Ponce, S. Friedrich and J.-S. Lee, J. Phys.: Condens. Matter, 2015, 27, 405501 CrossRef PubMed.
- N. Gunasekaran, S. Rajadurai, J. J. Carberry, N. Bakshi and C. B. Alcock, Solid State Ionics, 1994, 73, 289–295 CrossRef CAS.
- L. P. Haack, C. R. Peters, J. E. deVries and K. Otto, Appl. Catal., A, 1992, 87, 103–114 CrossRef CAS.
- M. de, S. Santos, R. C. R. Neto, F. B. Noronha, P. Bargiela, M. da, G. C. da Rocha, C. Resini, E. Carbó-Argibay, R. Fréty and S. T. Brandão, Catal. Today, 2018, 299, 229–241 CrossRef.
- M. M. Gul, K. S. Ahmad, A. G. Thomas and S. M. Ibrahim, J. Phys. Chem. Solids, 2023, 179, 111378 CrossRef CAS.
- M. M. Gul, K. S. Ahmad, A. G. Thomas, M. D. Albaqami and S. Mohammad, J. Phys. Chem. Solids, 2024, 188, 111949 CrossRef CAS.
- S. H. Pamu, K. B. S. Vashist, P. S. Ganesh, P. Da Costa and S. A. Singh, Catal. Today, 2024, 441, 114841 CrossRef CAS.
- S. Mickevičius, S. Grebinskij, V. Bondarenka, B. Vengalis, K. Šliužienė, B. A. Orlowski, V. Osinniy and W. Drube, J. Alloys Compd., 2006, 423, 107–111 CrossRef.
- D. D. Sarma, P. Vishnu Kamath and C. N. R. Rao, Chem. Phys., 1982, 73, 71–82 CrossRef CAS.
- A. Khaled, J. J. Pireaux and S. Khelili, Acta Chim. Slov., 2012, 59, 766–778 CAS.
- N. Gunasekaran, S. Rajadurai, J. J. Carberry, N. Bakshi and C. B. Alcock, Solid State Ionics, 1995, 81, 243–249 CrossRef CAS.
- P. J. Schmitz, Surf. Sci. Spectra, 2001, 8, 190–194 CrossRef CAS.
- W. V. Lampert, K. D. Rachocki, B. C. Lamartine and T. W. Haas, J. Electron Spectrosc. Relat. Phenom., 1982, 26, 133–145 CrossRef CAS.
- B. D. Padalia, P. K. Mehta, S. R. Reddy, O. Prakash and N. Venkataramani, Mod. Phys. Lett. B, 1988, 02, 1177–1181 CrossRef CAS.
- H. M. Meyer III, T. J. Wagener, J. H. Weaver and D. S. Ginley, Phys. Rev. B: Condens. Matter Mater. Phys., 1989, 39, 1–4 CrossRef PubMed.
- V. Craciun and R. K. Singh, Appl. Phys. Lett., 2000, 76, 1932–1934 CrossRef CAS.
- S. K. Jaiswal, V. K. Kashyap and J. Kumar, J. Asian Ceram. Soc., 2021, 9, 163–172 CrossRef.
- R. P. Vasquez, J. Electron Spectrosc. Relat. Phenom., 1991, 56, 217–240 CrossRef CAS.
- S. W. Gaarenstroom and N. Winograd, J. Chem. Phys., 1977, 67, 3500–3506 CrossRef CAS.
- M. Miodyńska, T. Klimczuk, W. Lisowski and A. Zaleska-Medynska, Catal. Commun., 2023, 177, 106656 CrossRef.
- A. Haque, S. Bhattacharya, R. Das, A. Hossain, A. Gayen, A. K. Kundu, M. Vasundhara and Md. M. Seikh, Ceram. Int., 2022, 48, 16348–16356 CrossRef CAS.
- R. Dudric, R. Bortnic, G. Souca, R. Ciceo-Lucacel, R. Stiufiuc and R. Tetean, Appl. Surf. Sci., 2019, 487, 17–21 CrossRef CAS.
- O. García-Zaldívar, S. Díaz-Castañón, F. J. Espinoza-Beltran, M. A. Hernández-Landaverde, G. López, J. Faloh-Gandarilla and F. Calderón-Piñar, J. Adv. Dielectr., 2015, 05, 1550034 CrossRef.
- H. Cui, J. Shi and H. Liu, Chin. J. Catal., 2015, 36, 969–974 CrossRef CAS.
- M. R. Biswal, J. Nanda, N. C. Mishra, S. S. Acharya, D. K. Mishra and V. V. Srinivasu, J. Mater. Sci.: Mater. Electron., 2018, 29, 20595–20602 CrossRef CAS.
- R. H. Alzard, L. A. Siddig, A. S. Abdelhamid, T. Ramachandran and A. Alzamly, J. Solid State Chem., 2024, 329, 124359 CrossRef CAS.
- Y. Tang, C. H. Mak, R. Liu, Z. Wang, L. Ji, H. Song, C. Tan, F. Barrière and H. Hsu, Adv. Funct. Mater., 2020, 30, 2006919 CrossRef CAS.
- H. Akazawa and H. Ando, J. Appl. Phys., 2010, 108, 083704 CrossRef.
- M.-W. Chu, M. Ganne, M. T. Caldes and L. Brohan, J. Appl. Phys., 2002, 91, 3178–3187 CrossRef CAS.
- G. A. Gomez-Iriarte, A. Pentón-Madrigal, L. A. S. de Oliveira and J. P. Sinnecker, Materials, 2022, 15, 4285 CrossRef CAS PubMed.
- M. Takahashi, M. Noda and M. Okuyama, J. Appl. Phys., 2003, 94, 6729–6734 CrossRef CAS.
- M. Zhang, M. A. Farid, Y. Wang, J. Xie, J. Geng, H. Zhang, J. Sun, G. Li, F. Liao and J. Lin, Inorg. Chem., 2018, 57, 1269–1276 CrossRef CAS PubMed.
- H. W. Nesbitt and D. Banerjee, Am. Mineral., 1998, 83, 305–315 CrossRef CAS.
- P. Decorse, Solid State Ionics, 1999, 117, 161–169 CrossRef CAS.
- R. P. Gupta and S. K. Sen, Phys. Rev. B, 1974, 10, 71–77 CrossRef CAS.
- R. P. Gupta and S. K. Sen, Phys. Rev. B, 1975, 12, 15–19 CrossRef CAS.
- M. A. Stranick, Surf. Sci. Spectra, 1999, 6, 31–38 CrossRef CAS.
- M. A. Stranick, Surf. Sci. Spectra, 1999, 6, 39–46 CrossRef CAS.
- M. A. Stranick, Surf. Sci. Spectra, 1999, 6, 47–54 CrossRef CAS.
- A. V. Fetisov, G. A. Kozhina, S. K. Estemirova, V. B. Fetisov, V. Y. Mitrofanov, S. A. Uporov and L. B. Vedmid’, J. Spectrosc., 2013, 2013, 1–13 CrossRef.
- S. Chakrabarti, S. Ginnaram, S. Jana, Z.-Y. Wu, K. Singh, A. Roy, P. Kumar, S. Maikap, J.-T. Qiu, H.-M. Cheng, L.-N. Tsai, Y.-L. Chang, R. Mahapatra and J.-R. Yang, Sci. Rep., 2017, 7, 4735 CrossRef PubMed.
- P. Rajasekaran, M. Arivanandhan, Y. Kumaki, R. Jayavel, Y. Hayakawa and M. Shimomura, CrystEngComm, 2020, 22, 5363–5374 RSC.
- L. Yan, Y. Zhang, Y. Zhang, R. Liu, C. Liu, F. Wu, X. Miao, E. Liu, X. Peng, J. Li, S. Tao and F. Xu, J. Magn. Magn. Mater., 2024, 591, 171730 CrossRef CAS.
- S. Wu, Y. Su, Y. Zhu, Y. Zhang and M. Zhu, Appl. Surf. Sci., 2020, 520, 146339 CrossRef CAS.
- W.-Y. Howng and R. J. Thorn, J. Phys. Chem. Solids, 1980, 41, 75–81 CrossRef CAS.
- J. Hueso, A. Caballero, M. Ocana and A. Gonzalezelipe, J. Catal., 2008, 257, 334–344 CrossRef CAS.
- H. Akazawa and H. Ando, J. Appl. Phys., 2010, 108, 0–7 CrossRef CAS.
- H. Yu, N. Liedienov, I. Zatovsky, D. Butenko, I. Fesych, W. Xu, C. Song, Q. Li, B. Liu, A. Pashchenko and G. Levchenko, ACS Appl. Mater. Interfaces, 2024, 16, 3605–3620 CrossRef CAS PubMed.
- Y. Jiang, J. Deng, S. Xie, H. Yang and H. Dai, Ind. Eng. Chem. Res., 2015, 54, 900–910 CrossRef CAS.
- F. Brahma, B. Mohanty, S. Bhattacharjee, R. L. Hota, R. K. Parida and B. N. Parida, Ceram. Int., 2022, 48, 18286–18293 CrossRef CAS.
- G.-D. Zhang, J.-Q. Dai and X.-L. Liang, J. Sol–Gel Sci. Technol., 2023, 105, 489–499 CrossRef CAS.
- L. Zhang, Y. Li, Q. Li, J. Fan, S. A. C. Carabineiro and K. Lv, Chem. Eng. J., 2021, 419, 129484 CrossRef CAS.
- Y. Mao, P. Wang, L. Li, Z. Chen, H. Wang, Y. Li and S. Zhan, Angew. Chem., 2020, 132, 3714–3719 CrossRef.
- L. Yan, Y. Zhang, Y. Zhang, R. Liu, C. Liu, F. Wu, X. Miao, E. Liu, X. Peng, J. Li, S. Tao and F. Xu, J. Magn. Magn. Mater., 2024, 591, 171730 CrossRef CAS.
- P. A. Joy, C. R. Sankar and S. K. Date, J. Phys.: Condens. Matter, 2002, 14, L663–L669 CrossRef CAS.
- L. D. Mendonca, M. S. Murari and M. D. Daivajna, Phys. Chem. Chem. Phys., 2020, 22, 19888–19902 RSC.
- B. Arun, V. R. Akshay, D. Chandrasekhar Kakarla and M. Vasundhara, J. Magn. Magn. Mater., 2019, 489, 165418 CrossRef CAS.
- B. Arun, V. R. Akshay and M. Vasundhara, Dalton Trans., 2018, 47, 15512–15522 RSC.
- L. Zhang, Z. Yan, T. Chen, H. Luo, H. Zhang, T. Khanom, D. Zhang, I. Abrahams and H. Yan, J. Mater. Chem. C, 2021, 9, 4289–4299 RSC.
- M. Oumezzine, O. Peña, T. Guizouarn, R. Lebullenger and M. Oumezzine, J. Magn. Magn. Mater., 2012, 324, 2821–2828 CrossRef CAS.
- L. D. Mendonca, M. S. Murari and M. D. Daivajna, J. Supercond. Novel Magn., 2021, 34, 2067–2078 CrossRef CAS.
- S. Goto, H. Kura, H. Yanagihara, E. Kita, M. Tsujikawa, R. Sasaki, M. Shirai, Y. Kobayashi, T. Honda and K. Ono, ACS Appl. Nano Mater., 2019, 2, 6909–6917 CrossRef CAS.
- N. A. Viglin, S. V. Naumov and Ya. M. Mukovskii, Phys. Solid State, 2001, 43, 1934–1940 CrossRef CAS.
- C. Autret-Lambert, M. Gervais, S. Roger, F. Gervais, M. Lethiecq, N. Raimboux and P. Simon, Solid State Sci., 2017, 71, 139–145 CrossRef CAS.
- C. Shang, Z. C. Xia, B. Zhao, H. Y. Dai, X. Z. Zhai and D. W. Liu, J. Magn. Magn. Mater., 2022, 554, 169321 CrossRef CAS.
- A. B. Tewari, R. Sharma and D. Sharma, Results Eng., 2023, 20, 101537 CrossRef CAS.
- A. I. Tovstolytkin, Y. Y. Shlapa, S. O. Solopan, A. V. Bodnaruk, M. M. Kulyk, V. M. Kalita, V. O. Zamorskyi, S. M. Ryabchenko and A. G. Belous, Acta Phys. Pol., A, 2018, 133, 1017–1020 CrossRef CAS.
- J. Ćwik, Y. Koshkid’ko, K. Nenkov, E. Tereshina-Chitrova, B. Weise and K. Kowalska, Crystals, 2022, 12, 931 CrossRef.
- P. R. Nadig, M. S. Murari and M. D. Daivajna, Phys. Chem. Chem. Phys., 2024, 26, 5237–5252 RSC.
- L. D. Mendonca, M. S. Murari and M. D. Daivajna, Phys. Chem. Chem. Phys., 2022, 24, 13171–13188 RSC.
- A. Dhahri, E. Dhahri and E. K. Hlil, RSC Adv., 2019, 9, 5530–5539 RSC.
- S. Atalay, V. S. Kolat, H. Gencer and H. I. Adiguzel, J. Magn. Magn. Mater., 2006, 305, 452–456 CrossRef CAS.
- V. K. Pecharsky and K. A. Gschneidner, J. Appl. Phys., 2001, 90, 4614–4622 CrossRef CAS.
- A. Kosogor and V. A. L’vov, Sci. Rep., 2023, 13, 10004 CrossRef CAS PubMed.
- S. Rößler, H. S. Nair, U. K. Rößler, C. M. N. Kumar, S. Elizabeth and S. Wirth, Phys. Rev. B: Condens. Matter Mater. Phys., 2011, 84, 184422 CrossRef.
- S. K. Estemirova, V. Y. Mitrofanov, S. A. Uporov, V. A. Bykov and G. K. Kozhina, J. Magn. Magn. Mater., 2024, 605, 172355 CrossRef.
- A. G. Gamzatov, A. B. Batdalov, A. M. Aliev, Z. Khurshilova, M. Ellouze and F. B. Jemma, J. Magn. Magn. Mater., 2017, 443, 352–357 CrossRef CAS.
- M. D. Daivajna and A. Rao, Solid State Commun., 2016, 245, 65–69 CrossRef CAS.
- A. M. Aliev, A. G. Gamzatov, K. I. Kamilov, A. R. Kaul and N. A. Babushkina, Appl. Phys. Lett., 2012, 101, 172401 CrossRef.
- A. G. Gamzatov, A. B. Batdalov, I. K. Kamilov, A. R. Kaul and N. A. Babushkina, Appl. Phys. Lett., 2013, 102, 032404 CrossRef.
- Y. X. Zhang, Z. G. Liu, H. H. Zhang and X. N. Xu, Mater. Lett., 2000, 45, 91–94 CrossRef CAS.
- X. Bohigas, J. Tejada, M. L. Marínez-Sarrión, S. Tripp and R. Black, J. Magn. Magn. Mater., 2000, 208, 85–92 CrossRef CAS.
- A. G. Gamzatov, A. M. Aliev, P. D. H. Yen, K. X. Hau, Kh. E. Kamaludinova, T. D. Thanh, N. T. Dung and S.-C. Yu, J. Magn. Magn. Mater., 2019, 474, 477–481 CrossRef CAS.
- A. R. Dinesen, S. Linderoth and S. Mørup, J. Phys.: Condens. Matter, 2005, 17, 6257–6269 CrossRef CAS.
- I. K. Kamilov, A. G. Gamzatov, A. M. Aliev, A. B. Batdalov, A. A. Aliverdiev, S. B. Abdulvagidov, O. V. Melnikov, O. Y. Gorbenko and A. R. Kaul, J. Phys. D: Appl. Phys., 2007, 40, 4413–4417 CrossRef CAS.
- M. Zarifi, P. Kameli, T. Raoufi, A. Ghotbi Varzaneh, D. Salazar, M. I. Nouraddini, L. Kotsedi and M. Maaza, J. Magn. Magn. Mater., 2020, 494, 165734 CrossRef CAS.
- G. C. Lin, Q. Wei and J. X. Zhang, J. Magn. Magn. Mater., 2006, 300, 392–396 CrossRef CAS.
- A. G. Gamzatov, A. B. Batdalov, N. Z. Abdulkadirova, A. M. Aliev, V. V. Khovaylo, T. D. Thanh, N. T. Dung and S.-C. Yu, J. Alloys Compd., 2023, 964, 171330 CrossRef CAS.
- A. R. Dinesen, S. Linderoth and S. Mørup, J. Magn. Magn. Mater., 2002, 253, 28–34 CrossRef CAS.
- A. B. Batdalov, A. G. Gamzatov, A. M. Aliev, N. Abdulkadirova, P. D. H. Yen, T. D. Thanh, N. T. Dung and S.-C. Yu, J. Alloys Compd., 2019, 782, 729–734 CrossRef CAS.
- S. K. Çetin, J. Mater. Sci.: Mater. Electron., 2020, 31, 12842–12847 CrossRef.
- S. K. Çetin, J. Supercond. Novel Magn., 2020, 33, 683–691 CrossRef.
- S. Ghorai, R. Skini, D. Hedlund, P. Ström and P. Svedlindh, Sci. Rep., 2020, 10, 19485 CrossRef CAS PubMed.
Footnote |
| † Electronic supplementary information (ESI) available. See DOI: https://doi.org/10.1039/d5tc00829h |
| This journal is © The Royal Society of Chemistry 2025 |