
Selective and sensitive detection of nitric oxide in aqueous and biological settings using a novel fluorescent cobalt-MOF†
Kushal
Arya
a,
Sheetal
Negi
b,
Ajay
Kumar
ac,
Kanika
Thakur
d,
Sanjay
Mehra
 e,
Arvind
Kumar
e,
Ravinder
Kumar
d,
Surinder Kumar
Mehta
a,
Ramesh
Kataria‡
*a and
Vikram
Saini‡
*b
e,
Arvind
Kumar
e,
Ravinder
Kumar
d,
Surinder Kumar
Mehta
a,
Ramesh
Kataria‡
*a and
Vikram
Saini‡
*b
aDepartment of Chemistry, Centre for Advanced Studies in Chemistry, Panjab University, Chandigarh, India 160014. E-mail: rkataria@pu.ac.in
bLaboratory of Infection Biology and Translational Research, Department of Biotechnology, All India Institute of Medical Sciences (AIIMS), New Delhi 110029, India. E-mail: vikram@aiims.edu
cUniversity Center for Research and Development, Chandigarh University, Mohali, Punjab 140301, India
dDepartment of Zoology, Panjab University, Chandigarh 160014, India
eCSIR-Central Salt and Marine Chemicals Research Institute Council of Scientific and Industrial Research, Bhavnagar, Gujarat, India 364002
First published on 24th April 2025
Abstract
Nitric oxide (˙NO) plays a crucial role in various biological processes, but its reactive nature and short half-life make its precise detection challenging. Developing sensitive and selective probes for ˙NO detection is essential for advancing biological and biomedical research. Here, we report the design of a hydrolytically stable and highly luminous amine-functionalized cobalt-based metal–organic framework (MOF), PUC-9, as a novel ˙NO sensor. PUC-9 exhibits a distinct fluorescence “turn-off” response to ˙NO via a deamination-based quenching mechanism, effectively differentiating it from other reactive oxygen and nitrogen species (ROS and RNS). It demonstrates a low detection limit (LOD) of 0.019 μM and a notable Stern–Volmer constant (Ksv) of 0.13 × 10⁵ M−1. With minimal cytotoxicity, PUC-9 enables ˙NO detection comparable to standard assays through absorbance, fluorescence, and imaging-based methods, showing its reliability and versatility across different detection platforms. These findings establish PUC-9 as a highly sensitive and selective tool for ˙NO detection in aqueous media and biological environments.
1. Introduction
Nitric oxide (˙NO) is an essential signalling molecule with varied biological functions. It is crucial for physiological processes such as vasodilation, which helps control blood pressure, and neurotransmission, facilitating communication between neurons.1–4 ˙NO also plays a significant role in immune responses by aiding immune cells in combating pathogens.5–8 Due to changing lifestyles and different kinds of food availability, humans consume more amino acids elevating ˙NO production, which can be very harmful.9,10 Elevated levels of ˙NO are linked to the progression of neurodegenerative disorders like Parkinson's and Alzheimer's, as well as conditions such as ischemia-reperfusion injury.11–13 Thus, accurate detection and quantification of ˙NO is vital for understanding its beneficial and detrimental roles in biological systems. Existing detection methods, such as chemiluminescence, colorimetry and electrochemical techniques, often lack the required sensitivity and capability for real-time monitoring.14,15 Fluorescence-based methods, valued for their high selectivity, sensitivity, and real-time imaging capabilities, are widely preferred. However, the limited water compatibility of many luminescent probes often restricts their effectiveness in biological and aqueous environments.12,16–23 Thus, there is an urgent need for new platforms that can effectively and reliably monitor ˙NO, especially in biological systems.Metal–organic frameworks (MOFs) are innovative crystalline substances known for their range of potential uses, such as energy storage, pharmaceuticals, gas separation, chemical sensing, heterogeneous catalysis, non-linear optics, and photocatalysis.24–27 MOFs are highly valued for their adjustable porosity and excellent thermal as well as mechanical stability. Luminescent MOFs are developed to detect various environmental contaminants such as toxic heavy metal cations, anions, nitroaromatic compounds (NACs), and solvents.28–30
In luminescent MOFs, the contact between analytes and fluorescent organic ligands or inorganic units causes a shift in luminescent signals, enabling detection. In a copper(II)-based MOF like Cu-TCA, fluorescence quenching occurs due to the interaction between ˙NO and Cu2+ ions, which are paramagnetic and quench the fluorescence. When ˙NO binds to these ions, it reduces Cu2+ to Cu+, thereby restoring the fluorescence and enabling ˙NO detection.31 A probe was created by coordinating p-aminobenzoic acid (PABA) with the Zr6 clusters in MOF-808, enhancing its luminescence and adding a free amine group for ˙NO detection. This amine group, which reacts with ˙NO, enables targeted sensing within the PABA@MOF-808 framework. Similarly, the 3D structure of PUC2 with unoccupied amines (–NH2) provides multiple ˙NO binding sites, resulting in improved sensitivity and a detection limit of 0.08 μM where spectroscopic analysis affirmed ˙NO-induced removal of amino group of the framework.32 As per the literature review, various luminescent probes such as organic ligands, C-dots and other nanoparticles are reported for the identification of ˙NO but MOF-based sensors for ˙NO are much less explored.33–35 Therefore, there is a lot of room for the development of luminescent MOFs for specific and sensitive detection of ˙NO in the aqueous phase as well as living cells for practical applicability.
Herein, a luminescent MOF (PUC-9) is reported for selective and highly accurate detection of ˙NO in the aqueous phase as well as living cells. PUC-9 has been synthesized by using N,N′-(1,3,6,8-tetraoxo-1,3,6,8-tetrahydrobenzo[lmn]-3,8-phenanthroline-2,7-diyl)diacetamide (L1), 5-Aminoisophthalic acid (H2IP) and Co(NO3)2·4H2O solvothermally in DMF. Cobalt(II) was selected as the metal ion for constructing the framework compound due to its redox-active nature, which enhances the luminescent properties of the material. The interaction between the redox-active cobalt ion and the redox-active ligand promotes effective luminescence through d–d transitions. Therefore, Co(II) is a more suitable choice for achieving efficient luminescent sensing in this work. The as-synthesized PUC-9 has been characterised by using several analytical techniques including FTIR, PXRD, SCXRD, TGA, BET, XPS etc. PUC-9 exhibits a highly luminous 3D framework with sql topology and consists of free –NH2 groups in the framework. Therefore, we sought to explore PUC-9 as a chemical sensor for ˙NO. Interestingly, PUC-9 was found highly selective and sensitive for ˙NO amid various ROS/RNS species. The minimal detection limit i.e., 0.019 μM and high Ksv value i.e. 0.13 × 10⁵ M−1 indicated strong interactions between PUC-9 framework and ˙NO. Spectroscopic measurements such as FTIR, UV-visible, HR-MS showed deamination of PUC-9's framework upon exposure to ˙NO. We have observed a non-significant cytotoxicity of PUC-9 in THP-1 cells and absorbance and fluorescence of PUC-9 is modulated in a ˙NO dependent manner following LPS induction. We also demonstrated the utility of PUC-9 in ˙NO sensing in human cells using fluorescence microscopy. Lastly internalisation of PUC-9 within the cells emphasizes upon its utility to detect ˙NO levels at the site of infection or ˙NO production. These findings highlight the potential of PUC-9 as a highly sensitive and selective probe for ˙NO detection in biological systems, paving the way for its application in cellular studies.
2. Experimental section
2.1. Materials and methods
The materials used in this study included a pre-assembled ligand and 5-aminoisopthalic acid sourced from TCI Chemicals. Solvents such as DMF and MeOH were obtained from Alfa Asar, while TCI Chemicals provided the Co(NO3)2·6H2O metal salt. The donor of nitric oxide, diethylenetriamine/nitric oxide adduct (DETA-NO), was procured from Sigma-Aldrich, USA. Single crystal X-ray diffraction (SCXRD) measurements were carried out on a Rigaku Super-Nova (Mo) diffractometer, featuring a micro-focus sealed X-ray tube with Mo-Kα radiation (λ = 0.71073 Å) and a HyPix3000 CCD detector. The scan was performed with an increasing ω (width of 0.3° per frame) at a speed of 10 s per frame, and data collection and processing were done using CrysAlisPro and Olex2 software followed by refinement using Least Squares minimization in ShelXL.36–38 Fourier-transform infrared (FTIR) spectroscopy was performed on a PerkinElmer FTIR 2000 spectrometer, while the powder X-ray diffraction analysis was executed with a PAN-analytical X’PertPRO diffractometer utilizing Cu Kα radiation at a scan rate of 1° per minute under standard atmospheric conditions. Thermogravimetric analysis (TGA) was executed with a SDT Q600 (V20.9 Build 20) from Artisan Technology Group (Champaign, IL), using a heating rate of 10 °C per minute under a nitrogen atmosphere. Brunauer–Emmett–Teller (BET) surface area measurements were carried out with a PHI 5000 VersaProbe III. X-ray photoelectron spectroscopy (XPS) analysis was conducted on the composition of PUC-9 before and after nitric oxide sensing using a PHI 5000 VersaProbe III from Physical Electronics. Surface morphology was studied with a Hitachi SU8010 field emission scanning electron microscope (FESEM). Fluorescence measurements were taken with an F-7000 FL spectrophotometer.2.2. Synthesis of PUC-9
A mixture of ligand (L1), 5-aminoisophthalic acid (H2IP) and Co(NO3)2·6H2O with a concentration ratio of 1![[thin space (1/6-em)]](https://www.rsc.org/images/entities/char_2009.gif) :1:2 was assembled in a solvent containing DMF, water and MeOH (2:1:1, v/v, 3 mL) as shown in Scheme 1. The solution was put on stirring for 10 minutes and then filled into 5 mL glass vials. It was subsequently heated to 100 °C in a programmable oven for 72 h, after which it was cooled to room temperature. Once the oven had cooled, rod-shaped crystals with a brownish-pink hue were obtained. Further, these were separated via filtration, followed by washing with methanol, and dried at 70 °C. To prepare PUC-9 nanoparticles (NPs), a simple green synthesis approach was employed using manual grinding. The PUC-9 compound was gently milled in a mortar-pestle for a time interval of 100 minutes, resulting in the formation of nanoparticles, which were subsequently labelled as PUC-9 NPs.
:1:2 was assembled in a solvent containing DMF, water and MeOH (2:1:1, v/v, 3 mL) as shown in Scheme 1. The solution was put on stirring for 10 minutes and then filled into 5 mL glass vials. It was subsequently heated to 100 °C in a programmable oven for 72 h, after which it was cooled to room temperature. Once the oven had cooled, rod-shaped crystals with a brownish-pink hue were obtained. Further, these were separated via filtration, followed by washing with methanol, and dried at 70 °C. To prepare PUC-9 nanoparticles (NPs), a simple green synthesis approach was employed using manual grinding. The PUC-9 compound was gently milled in a mortar-pestle for a time interval of 100 minutes, resulting in the formation of nanoparticles, which were subsequently labelled as PUC-9 NPs.
 | ||
| Scheme 1 Schematic representation of the synthesis of PUC-9, its asymmetric unit and 3D framework. In 3D framework, magenta and green colors are used to differentiate both the ligands (magenta color for 5-amino isophthalic acid and green color to denote the ligand L1). | ||
2.3. Luminescence detection experiments
It was thoroughly investigated how PUC-9 performs in photoluminescence for ˙NO sensing. Initially, A total of 20 mg of PUC-9 nanoparticles powder was suspended in 50 mL H2O (double-distilled), sonicated for 1 h, and left overnight, followed by filtration. This prepared stock solution was used for all fluorescence experiments. The emission spectrum of PUC-9 showed rapid quenching after the addition of a 100 μM ˙NO solution. To achieve a concentration of 1.8 mM, ˙NO gas was bubbled through a de-gassed phosphate buffer solution (PBS, pH = 6.8) for 20 minutes.7 In a detailed titration experiment, incremental amounts of a 1 mM aqueous solution of ˙NO (added in increments of 20 μL to 300 μL) were introduced into a water dispersion of PUC-9 NPs (10 μL). The emission intensity of PUC-9 gradually lowered with each addition of the ˙NO solution.The Stern–Volmer equation was used to calculate the quenching constant (Ksv) based on the fluorescence quenching data:
 | (1) |
The limit of detection (LOD) is a crucial parameter for assessing the sensing capability of a material at low concentrations. Utilizing the formula 3σ/m, the calculation was carried out, where σ represents the relative standard deviation from ten blank measurements of PUC-9, and the ˙NO concentration and relative emission intensities have a linear connection; the slope of this relationship is denoted by the symbol m. Selective identification of target analytes is fundamental for an effective sensor. To assess the probe's selectivity, similar sensing studies were conducted with distinct relevant RNS/ROS species. Aqueous solutions of singlet oxygen (1O2), ˙NO2− (nitrite), ˙NO3− (nitrate), hydroxyl radical (˙OH), tBuO− (tertiarybutoxide), H2O2, ˙O2− (superoxide), and peroxynitrite (ONOO−) were prepared having a concentration of 1 mM using respective salts or through specific reactions.
In single analyte selectivity tests, each species was separately added to a PUC-9 suspension, and emission spectra were measured both prior to and following the addition. Furthermore, a binary selectivity test was conducted for ˙NO in the presence of the aforementioned RNS/ROS species to evaluate interference. Initially, emission spectra of pristine PUC-9/water dispersion were obtained, followed by the addition of 100 μM of individual interfering analytes (NO2−/˙NO3−/H2O2/˙O2−/1O2/ONOO−/tBuO−/or ˙OH). Subsequently, an equal amount of ˙NO solution was introduced, and emission spectra were recorded again.
2.4. Cell Culture and determination of cellular toxicity of PUC-9
The experiments were performed as reported in our earlier work.7 Briefly, THP-1 cells were cultured in RPMI (Gibco; Invitrogen, USA) supplemented with 10% Fetal Bovine Serum (FBS; Himedia, India) and 1% penicillin/streptomycin (Himedia, India). Cells were differentiated into macrophages with phorbol 12-myristate 13-acetate (PMA)7,39 and maintained in a 37 °C incubator in a 5% humidified CO2 atmosphere. The cells were inoculated in a 96-well plate at a density of 5 × 10⁴ cells per well, and various concentrations of PUC-9 in 200 μL of media were added to each well. 20 μL MTT solution (0.5 mg mL−1 in media) was added to each well and incubated for 4 h at different time intervals. Finally, the MTT solution was carefully removed and 100 μL DMSO was added to each well to solubilize the formazan crystals. After shaking the plate for 10 min and mixing, the absorbance was recorded at 570 nm using a multimode reader cytation1 (BioTek, USA). Cell viability was calculated as the ratio of ΔA570 in the treated and untreated cells.2.5. ˙NO detection in cells on LPS induction using PUC-9
Briefly, the PMA-differentiated THP-1 cells (pd-THP-1 cells) were exposed to bacterial lipopolysaccharide (LPS; Sigma-Aldrich, USA) for 3 h leading to ˙NO production by the macrophages. Cells with and without exposure to LPS (control) were exposed to PUC-9 (0.5 mg mL−1) for <3 h. ˙NO production was scored using three independent approaches namely absorbance spectra, fluorescence spectra and fluorescence microscopy. For absorbance-based detection, an absorption spectrum between 300 and 450 nm (Multimode Reader cytation1, BioTek, USA), with absorbance maxima averaged over 310–340 nm represented ˙NO levels. Simultaneously, PUC-9 was also amenable to the fluorescence quenching following ˙NO exposure and the florescence values averaged over 400–440 nm represented mean fluorescence intensity (Spectra max, Molecular devices, USA). Calibration curve was prepared using known amount of DETA/NO [Sigma-Aldrich, USA], a well-characterised and widely used ˙NO donor with defined ˙NO release kinetics (1 mole of DETA/NO = 2 molecules of ˙NO).7 For validation and comparison of PUC-9, we have used a commercial Greiss assay kit (Himedia, India) to score for ˙NO production and compared it with ˙NO levels scored vis a vis PUC-9. Heat-killed THP-1 cells (dead cells) were used as a negative control in sensing assays to ensure that the observed ˙NO production was specific to viable, metabolically active cells.40 Heat-killing was performed by incubating the THP-1 cells at 90 °C for 10 minutes, a standard procedure leading to irreversible denaturation of cellular proteins and loss of metabolic activity.For visual detection, we have performed fluorescence imaging of THP-1 cells in presence of PUC-9 (Nikon Ti-2 Eclipse fluorescence microscope, Japan). The imaging was performed using a DAPI filter (Wavelength used-excitation ∼358 nm and emission ∼461 nm). Samples were scored for the presence of fluorescence signal which would be quenched following exposure to ˙NO produced following LPS stimulation.
2.6. TEM Sample processing for analysis of PUC-9 uptake
Briefly 1 × 10⁷ THP-1 cells were seeded in a round petri dish and kept for differentiation as mentioned earlier. Cells were treated with PUC-9 at different concentrations and incubated for 3 h. Post incubation cells were washed twice with 1 × PBS and finally fixed using the Karnosky fixative overnight at 4 °C. Samples were processed at SAIF facility of AIIMS, New Delhi using a TALOS TEM microscope (Thermo Fischer, USA) in a double blinded fashion as per established protocols.2.7. Quantification of intracellular cobalt levels using ICP/MS
To determine MOF internalisation, we used ICP-MS (Inductively Coupled Plasma Mass Spectrometry) to quantify the elemental Cobalt, which is present in miniscule amount in the cells but is a major constituent of the PUC-9. Briefly 1 × 10⁷ THP-1 cells were seeded in a round petri dish and kept for differentiation as mentioned earlier. Cells were treated with PUC-9 at different concentrations and incubated for 3 h. Post incubation, cells were scrapped gently and washed twice with 1 × PBS. For digestion 5% HNO3 (Sigma, USA) and H2O2 (Fisher Scientific, USA) in 1 mL as per well optimised protocols in our laboratory. Final sample was made up to be 3 mL using MilliQ water and acquired on ICPMS-Agilent 7850 at Panjab University, Chandigarh. Cobalt levels were normalized to total protein concentration and expressed as ng Co per mg protein to ensure accurate and comparable quantification across different samples.3. Results and discussion
3.1. Structural description of PUC-9
The SCXRD analysis of mixed-ligand 2D metal–organic framework (PUC-9) based on the ligand N,N′-(1,3,6,8-tetraoxo-1,3,6,8-tetrahydrobenzo[lmn][3,8]phenanthroline-2,7-diyl)diisonicotinamide (L1) and 5-aminoisopthalic acid (H2IP) synthesised by a solvothermal method has been investigated. The crystallographic studies confirmed that the PUC-9 forms crystals in a triclinic structure with a P![[1 with combining macron]](https://www.rsc.org/images/entities/char_0031_0304.gif) space group. The asymmetric unit of PUC-9 is assembled from a central metal atom (Co2+) along with one molecule each of L1 and H2IP respectively. Each Co2+ atom exhibits distorted octahedral geometry with N2O4 coordination around it, provided by two pyridine N from two distinct pillared ligands (L1) and four carboxylate O-atoms from three separate H2IP linkers as shown in Fig. 1(a).
space group. The asymmetric unit of PUC-9 is assembled from a central metal atom (Co2+) along with one molecule each of L1 and H2IP respectively. Each Co2+ atom exhibits distorted octahedral geometry with N2O4 coordination around it, provided by two pyridine N from two distinct pillared ligands (L1) and four carboxylate O-atoms from three separate H2IP linkers as shown in Fig. 1(a).
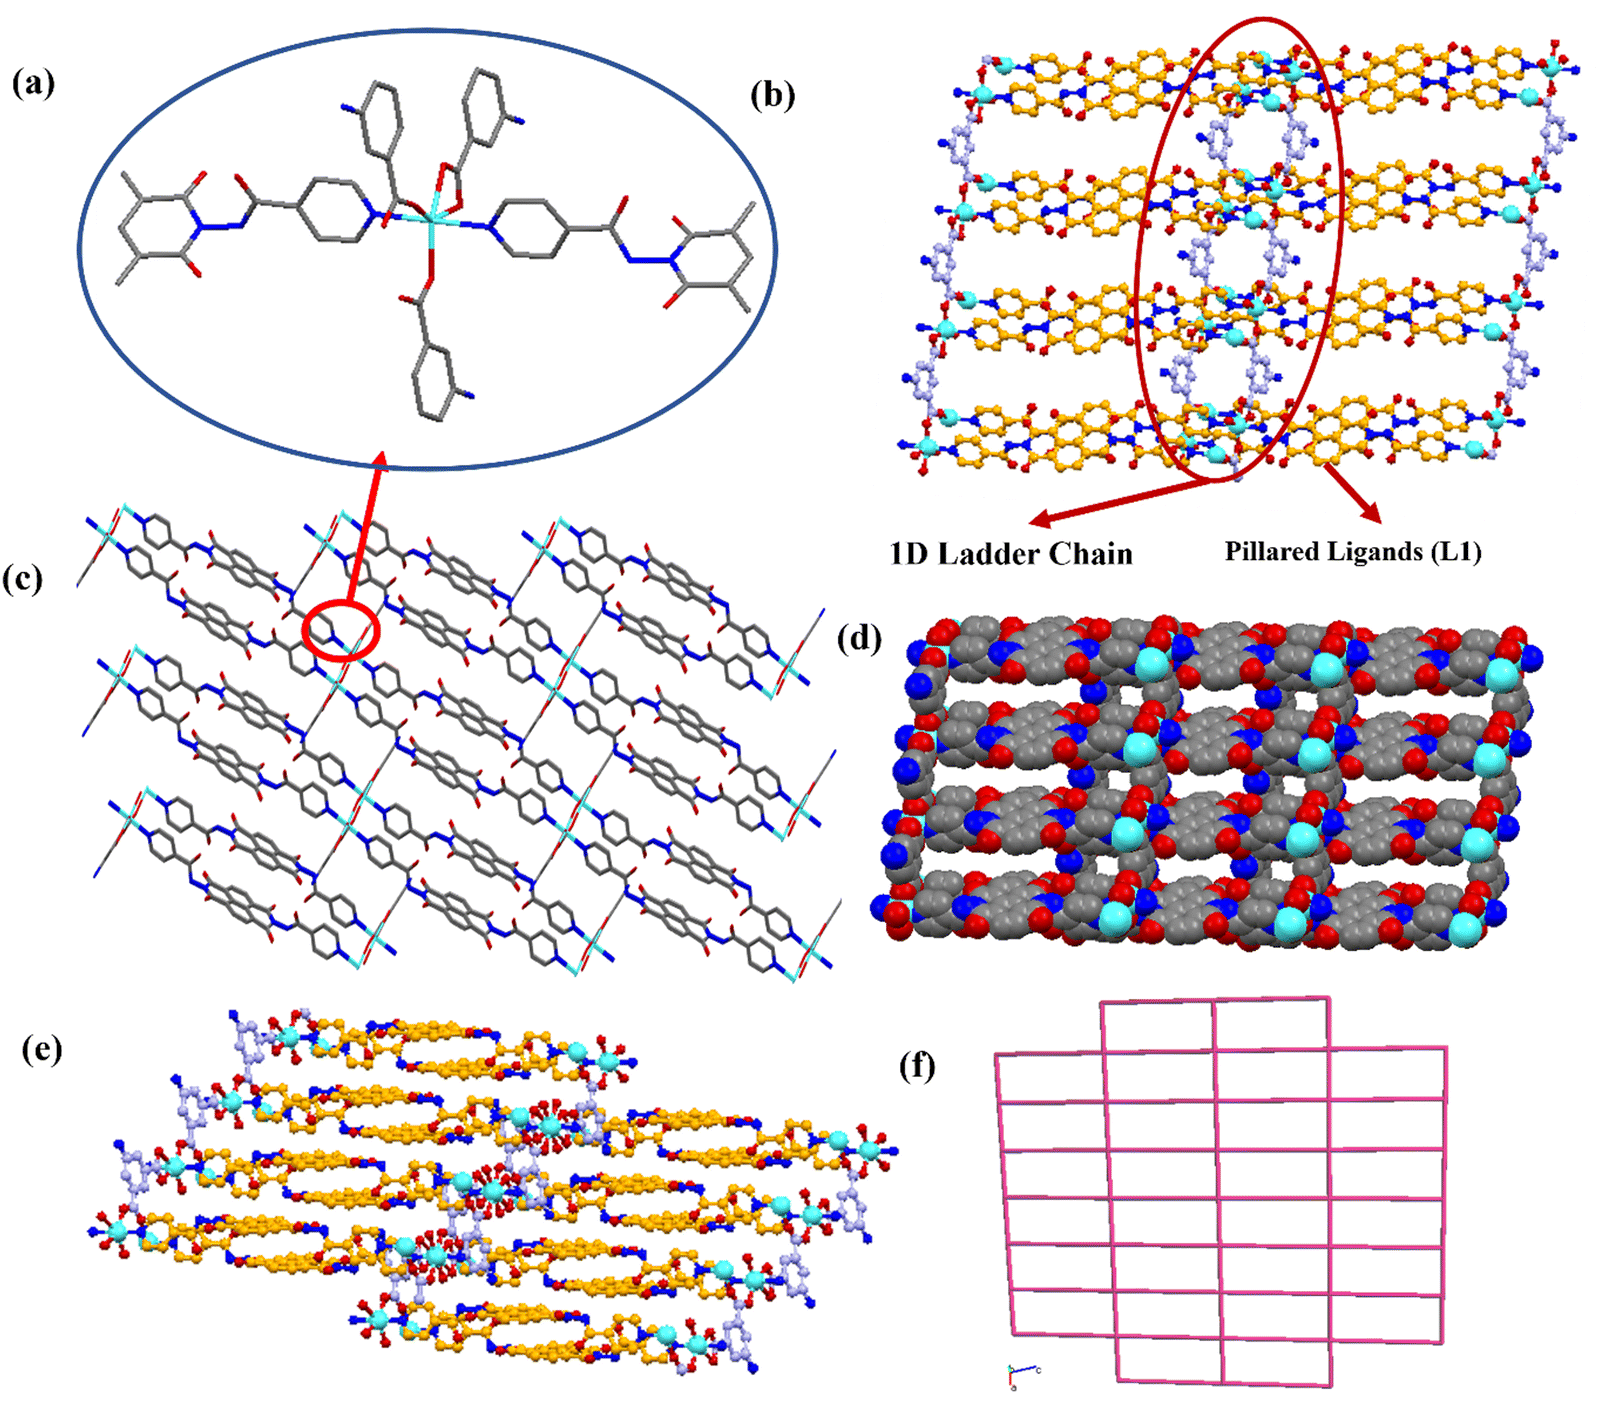 | ||
| Fig. 1 (a) Octahedral environment around central metal atom (Co2+) (b) A 2D representation of a framework depicting a 1D ladder-like chain with pillared ligands (L1) and two distinct types of cavities within the structure. (c) Capped stick view of 2D network (C-grey, O-red, N-blue and Co-cyan colored) (d) spherical packing model of PUC-9 showing voids, (e) ball stick view of 2D network, (f) topological view of PUC-9's framework in different directions showing sql topology. | ||
The Co2+ nodes are connected by H2IP linker with μ3-η1η1η2 bridging mode to form a binuclear secondary building block extended to a 1D ladder like chain which is doubly pillared with the L1via μ2-bridging through pyridine N-atoms to form a 2D network plane (Fig. 1(b) and (c)). The Co–O and Co–N bond length lies between 1.996–2.0058 Å and 2.154–2.162 Å respectively. Fig. 1(d) and (e) shows that there are two types of cavities are present, a smaller one having a square shape formed by H2IP linkers and a larger one with a rectangular shape comprising both L1 and H2IP linkers making larger and smaller edge lengths respectively. The Available void volume for solvent was estimated as 554 Å3 using PLATON software which accounts for about 27.8% of the total volume. The topological analysis of PUC-9 reveals a notable (4)-connected unimodal network featuring an sql topology and a point symbol of {4.4.4.4.6(2).6(2)} (Fig. 1(f)). Table S1 (ESI†) displays further crystallographic refinement parameters as well as specific bond lengths and angles for PUC-9.
3.2. FT-IR, TGA and PXRD analysis
The FTIR spectrum of PUC-9 was obtained over the range of 4000 to 500 cm−1, as shown in Fig. 2(b). In the FTIR spectrum of PUC-9, peaks observed between 3500 and 3800 cm−1 are associated with the vibrations obtained by stretching of O–H and N–H bonds, which usually manifest as broad and strong bands. The obtained peaks are attributed to the presence of –OH and –NH2 groups in the ligand. Specifically, the band near 3700 cm−1 is assigned to the O–H bond stretching of the carboxylate group in the 5-aminoisophthalic acid ligand. A peak around 1700 cm−1 is due to the C![[double bond, length as m-dash]](https://www.rsc.org/images/entities/char_e001.gif) O bond vibration of the 5-aminoisophthalic acid, while the peak at 1698 cm−1 due to the C–N bond stretching. An acute peak at 680 cm−1 resembles to the Co–O bond stretching. The thermogravimetric analysis of PUC-9 is shown in Fig. S1 (ESI†). The first major weight decline of 37% observed in the temperature span of 25–425 °C could be due to the loss of coordinated and lattice water molecules or solvent molecules such as DMF, water, and methanol. This weight loss could also be corresponded to the ejection of CO2 and NH2 molecules. The second major weight reduction of 49% observed in the temperature span of 425–1000 °C could be due to the decomposition MOF framework. The remaining weight could be attributed to the residue of the metal oxide or metal salt formed after the decomposition of the PUC-9 framework.
O bond vibration of the 5-aminoisophthalic acid, while the peak at 1698 cm−1 due to the C–N bond stretching. An acute peak at 680 cm−1 resembles to the Co–O bond stretching. The thermogravimetric analysis of PUC-9 is shown in Fig. S1 (ESI†). The first major weight decline of 37% observed in the temperature span of 25–425 °C could be due to the loss of coordinated and lattice water molecules or solvent molecules such as DMF, water, and methanol. This weight loss could also be corresponded to the ejection of CO2 and NH2 molecules. The second major weight reduction of 49% observed in the temperature span of 425–1000 °C could be due to the decomposition MOF framework. The remaining weight could be attributed to the residue of the metal oxide or metal salt formed after the decomposition of the PUC-9 framework.
 | ||
| Fig. 2 (a) PXRD spectrum of PUC-9 compared with simulated; (b) FTIR spectrum of PUC-9; (c) N2 adsorption–desorption isotherm curve of PUC-9 and (d) Pore size distribution curve of PUC-9 showing pores with different sizes (1.85 Å, 2.65 Å and 4.15 Å). The average pore size is 2.65 Å, which is well-suited for selectively accommodating small molecules like ˙NO (2–3 Å, bond length 1.15 Å), enabling effective diffusion and interaction with the free amine sites. | ||
To assess the overall phase consistency of the bulk samples, PXRD measurements were performed on PUC-9, as depicted in Fig. 2(a). The results showed that the PXRD pattern obtained experimentally showed a strong resemblance to the simulated pattern generated from single-crystal XRD, confirming the high phase purity of the synthesized sample. Additionally, distinct peaks observed at 2θ = 9.3°, 10.5°, 11.1°, 11.8°, 13.3°, 14.1°, 16.3°, and 21.2° correspond closely to the (100), (011), (110), (012), (102), (111), and (022) reflections of PUC-9 respectively, providing solid evidence for the successful synthesis of PUC-9. The characteristic peak of PUC-9 is also evident in PUC-9 NPs, confirming the formation of nanoparticles without any alteration in structure (Fig. S2, ESI†). Using the diffraction data, essential physical parameters such as crystallinity percentage and grain size were determined using the Scherrer equation.
 | (3) |
In the Scherrer equation, D depicts the size of crystallite, λ denotes the wavelength of the incoming X-ray, β indicates the full width at half maximum (FWHM) of the analogous peak, with K being the Scherrer constant and θ represent the diffraction angle.
 | (4) |
| Reflection number | PUC-9 | PUC-9 NPs | ||||||
|---|---|---|---|---|---|---|---|---|
| 2θ | Miller indices | FWHM (β) | Crystallite size (nm) | 2θ | Miller indices | FWHM (β) | Crystallite size (nm) | |
| 1 | 9.3 | (100) | 0.10468 | 75.641 | 9.3 | (100) | 0.11675 | 40.244 |
| 2 | 10.5 | (011) | 0.11679 | 67.736 | 10.5 | (011) | 0.23771 | 33.279 |
| 3 | 11.8 | (012) | 0.11977 | 65.978 | 11.8 | (012) | 0.22914 | 34.486 |
| 4 | 16.3 | (111) | 0.13035 | 60.330 | 16.3 | (111) | 0.30149 | 26.083 |
| Average size = 67.421 nm | Average size = 33.523 nm | |||||||
To evaluate the surface area of PUC-9 NPs, nitrogen adsorption measurements were conducted at a temperature of 77 K. The results, illustrated in 2c, reveal a reversible adsorption isotherm of type II hysteresis loop. Analysis of the data using the Brunauer–Emmett–Teller (BET) method demonstrates that the surface area of the nanoparticles is approximately 36.9 m2 g−1. Additionally, the measurements suggest an average pore size of 2.65 Å, providing insights into the material's porosity and structural characteristics (Fig. 2(d)). It is well established that pore size can influence the sensing performance of MOFs, including for ˙NO detection.32 The pore size significantly governs diffusion kinetics of analyte, quenching efficiency, and overall sensing performance, making it a critical design parameter in the MOF-based gas sensors. In the case of PUC-9, which has an average pore size of approximately 2.65 Å, this dimension is highly suitable for selectively accommodating small molecules like ˙NO, which has a molecular size of approximately 2–3 Å, with a bond length of 1.15 Å between the nitrogen and oxygen atoms. The relatively small size of the ˙NO molecule enables it to diffuse into the pores of the framework and interact effectively with the free amine sites.
3.3. XPS analysis of PUC-9
The XPS analysis of PUC-9 reveals detailed information about the chemical bonding and environment of carbon, cobalt, oxygen, and nitrogen within the metal–organic framework, providing valuable insights into its structure and composition. In the Co2p spectrum, peaks are observed at 780.6 eV, 785.0 eV, 796.4 eV, and 801.8 eV, indicate the presence of cobalt in various chemical environments within the framework (Fig. 3(a)). The peak at 780.6 eV is due to Co2p3/2, while the peaks at 785.0 eV, 796.4 eV, and 801.8 eV are associated with Co2p1/2 transitions. The O1s spectrum displays peaks at 531.0 eV and 532.3 eV, which is related to the different oxygen species present in PUC-9. The peak at 531.0 eV is typically assigned to oxygen atoms in metal–oxygen bonds (such as Co–O), while the peak at 532.3 eV may be attributed to oxygen atoms in carboxylate groups (Fig. 3(b)). | ||
| Fig. 3 XPS spectra of PUC-9; (a) high-resolution Co2p XPS spectrum showing four deconvoluted peaks at 780.6, 785, 796.4, 801.8 eV; (b) O1s showed two deconvoluted peaks in high-resolution spectra (c) C1s exhibit two deconvoluted peaks in XPS curve and (d) high-resolution N1s XPS profile having two peaks at 399 and 400.6 eV. | ||
The C1s spectrum of PUC-9 exhibits two prominent peaks at 284.7 eV and 287.9 eV (Fig. 3(c)). The peak at 284.7 eV suggests the presence of unsaturated C-atom bonds such as CC and CN, which are typical in aromatic and heterocyclic structures found in organic ligands like 5 amino isophthalic acid. The peak at 287.9 eV corresponds to saturated C-atom bonds (C–C, C–N, C–O), indicating the presence of aliphatic and carbonyl functionalities within the ligands. Finally, the N1s spectrum shows peaks at 399.0 eV and 400.6 eV, representing different nitrogen environments in PUC-9 (Fig. 3(d)). The peak at 399.0 eV is indicative of nitrogen atoms involved in aromatic or heterocyclic rings (like pyridine rings), whereas the peak at 400.6 eV corresponds to nitrogen atoms in amine or amide groups.
3.4. HR-TEM and FE-SEM analysis
The FESEM and HRTEM provide valuable insights into the morphology and size distribution of PUC-9 crystals and their nanoparticles (NPs). In earlier studies, PUC-9 was characterized by large rod-like crystals, with an mean length of approximately 500 nm (Fig. 4(a) and (b)). Through further processing techniques, including milling and sonication, these crystals were reduced significantly in size to form PUC-9 NPs (Fig. 4(c)). Elemental mapping represented the presence of key elements (C, N, O, Co) as presented in supplementary figures (Fig. S3–S7, ESI†). HRTEM analysis also confirmed that the PUC-9 crystals retained their well-defined rod-shaped morphology, with an average length of around 500 nm (Fig. 4(d)), in agreement with the FESEM data. The reduction of PUC-9 to PUC-9 NPs through grinding and sonication yielded particles having an average size of 27 nm, as illustrated in the corresponding histogram (Fig. S8, ESI†). Furthermore, selected area electron diffraction (SAED) patterns confirmed the crystalline nature of the PUC-9 NPs (Fig. 4(f)). This approach demonstrates an efficient method for the preparation of both PUC-9 crystals and their nanoscale counterparts. | ||
| Fig. 4 FESEM images of rod-shaped PUC-9 crystals (a), (b), PUC-9 NPs (c) and HRTEM images of rod-shaped PUC-9 (d) and PUC-9 NPs (e) with SAED pattern (f). | ||
3.5. Optical properties of PUC-9
To identify the ideal excitation wavelength (λex), fluorescence spectra were taken at a range of excitation wavelengths (λex) between 300 and 340 nm. With λex, the emission peak's strength increased continuously until it peaked at 330 nm, at which point it started to decline from 330 to 340 nm (Fig. S9, ESI†). For the best emission, 330 nm was chosen as the excitation wavelength. Reliability of this value as the system's emission peak was confirmed by the emission wavelength's notable consistency across several excitation wavelengths. The presence of luminescent H2IP and the strong π-conjugation in the L1 ligands are likely to contribute to the luminescent properties of PUC-9 NPs. Fluorescence is emitted from both organic linkers in PUC-9. The increased e− mobility and a bigger π-conjugated structure inside the MOF structure are responsible for the enhanced luminescence. The emission spectra of PUC-9 NP suspension in water were obtained over a 30-day period in order to assess the probe's hydrolytic stability. The fluorescence intensity barely changed over time, as seen in Fig. S11, ESI,† verifying the synthetic MOF's high-water stability.3.6. Detection of ˙NO in aqueous samples
The emission response of PUC-9 towards several ROS/RNS species including ˙NO, 1O2, H2O2, O2−, NO2−, NO3−, ONOO−, tBuO−, OH− were measured (Fig. 5(a)). We observed a significant quenching in the emission peak of PUC-9 after addition of ˙NO only and not with any other species evaluated in this study. We further observed that other ROS/RNS species does not compromise the sensitivity of the MOF toward the targeted analyte confirming its specificity (Fig. 5(b)). These results revealed the specificity and selectivity of PUC-9 to ˙NO in aqueous media and were indicative of utility of PUC-9 as a potential ˙NO sensor. | ||
| Fig. 5 (a) Fluorescence spectra of PUC-9 prior to and following the addition of various ROS/RNS species; (b) figure showing interference of competitive species during detection of ˙NO by PUC-9 in aqueous phase; (c) correlation between the intensity of PUC-9 and different amounts of ˙NO and (d) S–C plot (inset: S–V plot at low conc. of ˙NO). | ||
To further quantify ˙NO levels by using PUC-9, we performed additional experiments featuring scoring of change in fluorescence of PUC-9 upon incremental addition of ˙NO. We observed a quick quenching of PUC-9 fluorescence signal with increasing ˙NO concentration (0–100 μM), as shown in Fig. 5(c). Further, the changes in emission intensity of PUC-9 was analysed by Stern–Volmer plot; a linear correlation fitting was observed for ˙NO with correlation coefficient (R2) of 0.988. As the ˙NO concentration increased, the S–V plot diverted from linearity and bent upward, suggesting coexistance of both static and dynamic quenching which is discussed in detail in quenching mechanism section (Fig. 5(d)). The quenching constant (Ksv) was measured to be 0.13 × 10⁵ M−1 which is a high Ksv value, demonstrating high sensitivity of PUC-9 for ˙NO. This finding indicated that PUC-9 could be used as a potential sensor for ˙NO with high accuracy. Based on the calibration curve, the LOD of PUC-9 for ˙NO in aqueous solution was found to be 0.019 μM (Fig. S12, ESI†). The values of LOD and Ksv of PUC-9 for ˙NO are either comparable or better (Table S2, ESI†) than the other reported sensors for ˙NO.32,41,42
3.7. Possible mechanism of ˙NO sensing using PUC-9
The PUC-9 mediated sensing mechanisms for ˙NO detection is likely diverse and complex. They could involve structural changes upon interaction with ˙NO and/or photo-induced electron transfer (PET) in the excited state. Resonance energy transfer (RET) and competitive absorption of light can be ruled out as ˙NO does not show any absorption peak. For RET and competitive absorption mechanisms, spectral overlapping is a must. To investigate the quenching mechanism of PUC-9, PXRD and XPS spectra were recorded after soaking PUC-9 in a ˙NO solution for 24 h (Fig. 6(c) and 7). The PXRD and XPS patterns of PUC-9 before and after exposure to ˙NO remained identical, demonstrating that the structure of PUC-9 does not change. Therefore, the structural collapse as a potential mechanism of ˙NO detection by PUC-9 was excluded. The logical possibility left is to explore for PET, which can explain ˙NO-mediated quenching of PUC-9 as MOFs have a larger framework and assuming a high band gap energy for PUC-9. So, there is a distinct possibility of electron shift from the conduction band of PUC-9 to LUMO of ˙NO. | ||
| Fig. 6 (a) Zoomed FTIR spectra of PUC-9 (scale = 4000 to 1800 cm−1); comparison of (b) FTIR (c) PXRD (d) time-resolved fluorescence spectra of PUC-9 prior and following addition of ˙NO and (e) Schematic representation of deamination based ˙NO sensing using PUC-9. | ||
 | ||
| Fig. 7 XPS spectra of PUC-9 after treated with ˙NO; high-resolution XPS spectrum of (a) Co2p; (b) O1s; (c) C1s; (d) N1s and (e) analysis of full XPS survey of PUC-9 before and after exposure to ˙NO. | ||
To support our hypothesis, FTIR spectra of PUC-9 before and after ˙NO exposure was measured (Fig. 6(a) and (b)). The IR peak associated with the free –NH2 group observed in between 3200–3300 cm−1 disappeared after ˙NO treatment. The C–N stretching vibration at around 1389 cm−1 was also diminished. FTIR results revealed that there is a deamination of PUC-9's framework by ˙NO. The mass spectrum of 5-aminoisophthalic acid, a major ligand used in PUC-9 synthesis, was recorded after exposure to ˙NO (Fig. S13, ESI†) to support this observation. A peak with 100% intensity at a mass-to-charge ratio (m/z) of 165.018 was detected, corresponding to the theoretically predicted mass of deaminated 5-aminoisophthalic acid (i.e., isophthalic acid). This indicates that the amino group (NH2) reacts with ˙NO and is removed from the aromatic ring, providing strong evidence for the deamination mechanism. In PUC-9, the lone pair of nitrogen atoms in the –NH2 group participates in conjugation, contributing to its luminescence. Upon exposure to ˙NO, the lone pair electrons of nitrogen are transferred to the lowest unoccupied molecular orbital (LUMO) of ˙NO, leading to fluorescence quenching, as illustrated in Fig. 6(e).
To distinguish between dynamic and static quenching, time-resolved fluorescence measurements were conducted for PUC-9 pre and post exposure to ˙NO. In dynamic quenching, the presence of analyte leads to a decline in the mean fluorescence lifetime of the probe, as the excited state undergoes faster relaxation due to collisions with the analyte. Conversely, static quenching would result in no change in the average lifetime, as it involves complex formation in ground state.43,44 Our results showed that the average fluorescent lifetimes of PUC-9 was 14.35 ns before ˙NO exposure, which is reduced to 10.43 ns after ˙NO exposure, indicating a significant reduction of 3.92 ns (Fig. 6(d)).45 This notable decrease in lifetime following exposure confirms dynamic quenching. The absorbance spectra of PUC-9 and 5-amino isophthalic acid before and after the addition of ˙NO also support this mechanism. Unlike static quenching, which affects ground-state complexes and would not alter lifetime, dynamic quenching impacts only the excited state consistent with the unchanged absorption spectra of PUC-9 in the presence of ˙NO (Fig. S14, ESI†). Other quenching mechanisms like IFE and FRET are ruled out, as ˙NO lacks significant absorption in the relevant spectral regions.46 These observations collectively support dynamic quenching as the dominant mechanism, with no evidence of competing processes.
To estimate the ratio of active NH2 groups involved in deamination and quenching relative to the total available NH2 sites in the PUC-9, a calculation was carried out. At 30 μM ˙NO (the highest concentration in the linear calibration range), the total number of ˙NO molecules in a 3 mL cuvette are calculated to be 5.42 × 10¹⁶.
Given that each asymmetric unit of PUC-9 has one free NH2 group and the material exhibits a 60% dissolution efficiency, the total available NH2 sites in solution amount to be 1.94 × 10¹⁵. Since each ˙NO molecule reacts with one NH2 group, the number of NH2 groups actively participating in sensing is 5.82 × 10¹⁴, corresponding to a 30% quenching efficiency. The results suggest that a significant fraction of the available NH2 groups is engaged in the ˙NO sensing, highlighting the extent of deamination and quenching to support material's high responsiveness to ˙NO detection.
3.8. PUC-9 as a potential probe for ˙NO detection in biological system
After establishing the utility of PUC-9 to detect ˙NO in aqueous medium, we next explored whether PUC-9 can be used for ˙NO sensing in living cells. Using the MTT assay, we first determined that PUC-9 (up to 0.5 mg mL−1) did not have a significant impact on the survival of THP-1 macrophages and survival remains >80% even after prolonged exposure (>6 h) (Fig. S15, ESI†). We also observed similar results in other cells lines, indicating PUC9's broad safety profile (data not shown).Next, we used a well-established ˙NO donor DETA/NO, and PUC-9 in the complete cellular media, and observed a dose-dependent effect on absorbance as well as on fluorescence quenching (Fig. 8). The dose-dependent change in absorbance and fluorescence quenching indicates that PUC-9 interacts directly with ˙NO especially since PUC-9 did not react with interfering species. PUC-9 showed an LOD of ∼25 nM in complete media, determined from a DETA/NO standard curve with a known half-life of approximately 20 hours at 37 °C in aqueous solution, ensuring a stable and controlled release of ˙NO during the course of the experiments. [r2 = 0.901, 1:2 DETA/NO:˙NO stoichiometry] (Fig. 8(d)).47
 | ||
| Fig. 8 ˙NO sensing by using PUC-9 in biological relevant setting: (a) Dose-dependent reduction in absorbance of PUC-9 following exposure with DETA/NO; (b) histogram representation of PUC-9 absorbance for detection of ˙NO production in culture media only; the bar represents absorbance averaged over 310–340 nm, measured in triplicates, and absorbance plotted as mean ± SEM; (c) concentration dependent quenching of PUC9 fluorescence in the presence of DETA/NO in the cell culture media; (d) PUC-9 calibration in culture media yielded an LOD of ∼25 nM using DETA/NO (r2 = 0.901); (e) fluorescence spectra of PUC-9 detecting ˙NO production in live THP-1 cells stimulated with low concentrations of LPS, compared to heat-killed THP-1 cells, or dead cell plus LPS control. A clear fluorescence quenching was observed only in live THP-1 cells upon LPS stimulation, indicating ˙NO production as a result of active cellular metabolism. In contrast, heat-killed cells alone or heat-killed cells with LPS exposure showed no change in fluorescence, confirming that the detected ˙NO signal originates from metabolically active processes and not from non-specific protein degradation or cellular debris or LPS alone indicating specificity. (f) Quantification of ˙NO levels detected by PUC-9 following low-dose LPS stimulation in THP-1 cells, using the standard calibration curve. Data are presented as mean ± SEM from N = 2 independent experiments, each performed in triplicate (n = 3). Statistical significance was determined using One-Way ANOVA with Tukey's post-hoc correction (*p ≤ 0.05, **p ≤0.01, ***p ≤ 0.001). | ||
We first confirmed that the sensitivity of PUC-9 is sufficient to reliably detect physiological (basal) levels of ˙NO. PUC-9 could detect ˙NO production (∼40 nM) following stimulation with low-dose LPS (1.5 μg mL−1) (Fig. 8(e) and (f)). Fluorescence quenching occurred only in live cells, and not in heat-killed cells alone or heat-killed cells with LPS exposure confirming that the detected ˙NO signal originates from metabolically active cells and not from non-specific protein degradation or cellular debris indicating specificity (Fig. 8(e) and (f)). Similar trends were observed in absorbance spectra (Fig. S16, ESI†), supporting the specificity of PUC-9 for metabolically produced ˙NO.
To evaluate the multi-modal detection capability of PUC-9 for ˙NO detection, we also performed fluorescence imaging in THP-1 cells. In unstimulated cells treated with PUC-9 alone, strong fluorescence was observed, consistent with minimal basal ˙NO production. Upon increasing LPS stimulation, a progressive fluorescence dimming was observed, indicative of dose-dependent ˙NO-mediated quenching of PUC-9 (Fig. 9(a)). This preliminary imaging analysis confirmed the responsiveness of PUC-9 to varying ˙NO levels under physiological and moderately elevated conditions. Subsequently, to assess the detection of pathological (elevated) ˙NO levels, cells were exposed to high-dose LPS (up to 50 μg mL−1). Significant fluorescence quenching was observed, alongside a dose-dependent increase in absorbance, further validating PUC-9's performance across fluorescence, imaging, and absorbance-based detection modes (Fig. 9(b)–(f)). Estimation of ˙NO levels using fluorescence measurements based on the DETA/NO calibration curve revealed that exposure to high-dose LPS exacerbates the ˙NO production reaching over 40 μM. Thus, PUC-9 reliably senses both low nanomolar and high micromolar ˙NO levels and enables a tri-modal ˙NO detection via fluorescence imaging, quantitative fluorescence measurements, and absorbance changes, offering a versatile platform for biological applications (Fig. 8 and 9).
 | ||
| Fig. 9 ˙NO detection in biological system using PUC-9: We have used THP-1 cells and expose them to various concentration of LPS to stimulate ˙NO production. (a) Fluorescence imaging of THP-1 cells in presence of PUC-9 (Wavelength used-excitation ∼358 nm and emission∼461 nm; DAPI filter, Nikon Ti-2 Eclipse fluorescence microscope). While the THP-1 cells with PUC-9 demonstrate the highest fluorescence (indicated by red arrows), a dose-dependent quenching reflecting on cellular ˙NO production following LPS stimulation is observed. THP-1 cells exogenously exposed to ˙NO donor DETA/NO showing fluorescence quenching is used as a positive control; (b) absorbance spectra of PUC-9 following LPS stimulation. Cells exposed to higher concentration of LPS expectedly showed maximum absorbance due to higher ˙NO production; (c) histogram representation of PUC-9 absorbance of data derived from (b). The bar represents absorbance averaged over 310–340 nm, measured in triplicates, and plotted as mean ± SEM; (d) florescence spectra of PUC-9 detecting ˙NO production in cells. Cells induced with high concentration of LPS shows maximum quenching; (e) histogram representation of PUC-9 fluorescence for detection of ˙NO production. The bar represents the florescence values averaged over 400–440 nm, measured in triplicates, and plotted as mean ± SEM; (f) quantification of ˙NO levels detected using PUC-9 following exposure of THP-1 cells with a high-dose LPS (up to 50 μg mL−1) using the calibration curve shown in Fig. 8(d); (g) comparative analysis of ˙NO production in THP-1 macrophages following high-dose LPS stimulation, measured using PUC-9 and the standard Griess assay, confirms the ability of PUC-9 to sense both physiological and pathological ˙NO concentrations. Data represent mean ± SEM from N = 2 independent experiments, each performed in triplicate (n = 3). Statistical significance was determined using One-Way ANOVA with Tukey's post-hoc correction or Two-Way ANOVA with Sidak multiple comparison test (*p ≤ 0.05, **p ≤0.01, ***p ≤ 0.001). | ||
Additionally, ˙NO levels measured using PUC-9 were comparable to those obtained via the standard Griess assay, reinforcing its accuracy in biological settings. Collectively, our findings establish PUC-9 as a sensitive and specific chemical tool for detecting broad range of ˙NO levels in aqueous as well as live-cell environments.
3.9. ˙NO detection by internalization of PUC-9 by the THP-1 cells
Having established the feasibility of PUC-9 as a physiological ˙NO sensor, we next examined whether the cells are able to internalize the PUC-9 in cells. Using TEM imaging, we directly observed PUC-9 internalization in THP-1 cells (Fig. 10(a)), with clear evidence of particle presence inside the cells (shown by red arrows in the Fig. 10(a)). | ||
| Fig. 10 PUC-9 is internalized by the THP-1 cells: (a) THP-1 cells alone without PUC-9 did not show any accumulation of nanoparticles; while the cells treated with PUC-9 demonstrated a clear accumulation of nanoparticles within 3 h of exposure. The inset figure provides a zoomed-in view of the internalization of PUC-9 within THP-1 cells, highlighting finer details of intracellular accumulation. Red arrows indicate nanoparticles of PUC-9 while yellow arrows indicate cellular organelle (i.e., mitochondria); (b) quantification of intracellular cobalt levels using ICP-MS reveals a dose-dependent increase following treatment with PUC-9, a cobalt containing MOF. THP-1 cells only group represents basal cellular cobalt levels. Data is normalised to the protein concentration. TEM images were generated in blinded fashion at the SAIF facility, AIIMS, New Delhi. Data represent mean ± SEM from N = 2 independent experiments, each in triplicate n = 3. Statistical significance was determined using One-Way ANOVA with Tukey's post hoc correction (*p ≤ 0.05, **p ≤ 0.01, ***p ≤ 0.001). | ||
As shown earlier, the particle size of the MOF predominantly falls within the ∼22–32 nm range (Fig. S8, ESI†). The internalization mode of the MOF into THP-1 cells may influence its ˙NO sensing performance by affecting its stability, localization, and ability to detect the analyte before degradation. Nonetheless, the nanoparticles in the 20–50 nm size range, like PUC9, are predominantly internalized via clathrin- and caveolae-mediated endocytosis.48,49 Since macrophages efficiently internalize or phagocytose even larger entities like bacteria (μm range), it is reasonable to expect that PUC-9 can also be internalized by THP-1 cells.50 Direct evidence for cellular uptake is provided by ICP-MS analysis, which shows a dose-dependent increase in intracellular cobalt levels, a key component of PUC-9, (Fig. 10(b)), unequivocally validating MOF internalization.
Following internalization, the intracellular trafficking route could expose the MOF to acidic pH or enzymatic degradation. However, the inherent stability and small size of PUC-9, combined with the rapid diffusion of ˙NO, make it highly probable that sensing occurs shortly after internalization, before significant degradation can impair performance. Supporting this, PUC-9 exhibited a LOD of ∼20–25 nM ˙NO in aqueous and complete media (without cells), and efficiently detected ∼40 nM ˙NO in cellular environments, demonstrating robust sensing capability following internalization.
˙NO is a small, highly diffusible gas with a diffusion concentration of ∼200 μM in low oxygen and ∼80–100 μM in high oxygen condition.8,51 This rapid diffusion allows for effective extracellular sensing; however, this internalization may influence both ˙NO sensing and potential toxicity. By ensuring the MOF particles are taken up by macrophages, this internalization could enable the effective interaction between the MOF particles and intracellular ˙NO, enabling real-time detection at physiologically relevant sites of production. Therefore, this internalization-focused approach serves as an important foundation for evaluating PUC-9's utility as a sensitive and specific tool for ˙NO detection in biological settings.
4. Conclusions
In conclusion, PUC-9, a highly stable and luminescent amine-functionalized Co-based MOF, has proven to be an effective and selective sensor for nitric oxide in aqueous as well as biological system. Its unique 3D sql topology, coupled with free –NH2 groups within the framework, enables precise interaction with ˙NO, distinguishing it from other ROS/RNS species. The deamination pathway underlying the fluorescence quenching mechanism emphasizes the high sensitivity of PUC-9, which is supported by its low limit of detection (0.019 μM) and significant Stern–Volmer constant (0.13 × 10⁵ M−1). Characterization techniques such as FTIR, PXRD, and UV-visible spectroscopy confirmed its robust performance. PUC-9 demonstrates high sensitivity and specificity for ˙NO detection in biological systems while exhibiting minimal toxicity in living cells. Using both fluorescence and absorbance-based methods, we confirm that PUC-9 effectively detects ˙NO production (nM to μM range) in LPS-stimulated THP-1 cells, with results comparable to the standard Griess assay, reinforcing its relevance as a reliable ˙NO sensor.Furthermore, our internalization studies confirm that PUC-9 is actively taken up by THP-1 cells, as demonstrated by TEM imaging and ICP-MS analysis showing a dose-dependent increase in intracellular cobalt levels. This feature is particularly important because intracellular ˙NO concentrations are highly dynamic and localized, meaning that internalized PUC-9 can provide a more physiologically relevant assessment of ˙NO production within macrophages. Additionally, cellular uptake may enhance sensor stability and specificity by reducing extracellular interference, making PUC-9 a powerful tool for real-time intracellular ˙NO monitoring. Given its strong selectivity, intracellular accessibility, and biocompatibility, PUC-9 holds significant potential for future applications in biological research, clinical diagnostics, and environmental ˙NO monitoring.
Author contributions
Kushal Arya: synthesis, methodology, formal analysis, software, writing original draft, data curation, writing review and editing; Sheetal Negi: biological and in vitro cellular studies methodology, microscopy studies, writing and editing; Ajay Kumar: formal analysis, software, data curation, writing review and editing; Kanika Thakur: biological studies, writing review and editing; Ravinder Kumar: conceptualization, funding acquisition, methodology, writing original draft, validation, writing review and editing, supervision; Sanjay Mehra: XPS analysis, writing review and editing; Arvind Kumar: writing review and editing, supervision; Surinder Kumar Mehta: writing review and editing, supervision; Ramesh Kataria: conceptualization, funding acquisition, methodology, writing original draft, validation, writing review and editing, supervision; Vikram Saini: conceptualization, funding acquisition, methodology, writing original draft, validation, writing review and editing, supervision.Data availability
“The data supporting the research article entitled “Selective and Ultra-Sensitive Detection of Nitric Oxide Using Co-MOF” are available upon reasonable request from the corresponding author. This includes all experimental data, analytical results, and characterizations related to the synthesis and evaluation of the PUC-9 nanomaterials. Detailed methodologies for the synthesis, as well as data from single-crystal X-ray diffraction, FTIR spectroscopy, powder X-ray diffraction, thermogravimetric analysis, and electron microscopy, are available as supplementary materials. Additionally, all data pertaining to the detection of NO, including photoluminescence spectra and HRMS, can be provided upon request. The data are also part of the published article, which includes comprehensive descriptions of the materials and methods used in this research. All referenced data sources are accessible through their respective journal publications or databases as cited.”Conflicts of interest
The authors declare no competing financial interest.Acknowledgements
The authors express their gratitude to DST, Government of India, for funding through the PURSE (II) and FIST (II) grants [(SR/FIST/CS II-036/2015(C) & (G)], which supported the Single-crystal X-ray facility at the Department of Chemistry, Panjab University, Chandigarh. The authors also thank the DST, Government of India, for their financial assistance through the SERB-SURE grant (SUR/2022/001238). This work is also supported primarily through Hargobind Khorana Innovative Young Biotechnologist Award (BT/11/IYBA/2018/01) and in part by ICMR (EM/Dev/SG/5091/2023) to VS. Kushal Arya and Sheetal Negi acknowledges the financial support from CSIR, India, under the SRF program (09/135(0892)/2019-EMR-I) and ICMR, India respectively.References
- X. Lv, Y. Wang, S. Zhang, Y. Liu, J. Zhang and W. Guo, Chem. Commun., 2014, 50, 7499–7502 RSC.
- C. Yu, Y. Wu, F. Zeng and S. Wu, J. Mater. Chem. B, 2013, 1, 4152–4159 RSC.
- H. Yu, Y. Xiao and L. Jin, J. Am. Chem. Soc., 2012, 134, 17486–17489 CrossRef CAS PubMed.
- X. Zhu, J.-Q. Chen, C. Ma, X. Liu, X.-P. Cao and H. Zhang, Analyst, 2017, 142, 4623–4628 RSC.
- H. Liu, R. Chen, K. Wu, Y. Zhang, X. Wang and N. Zhou, Biosens. Bioelectron., 2024, 248, 116000 CrossRef CAS PubMed.
- K. C. Chinta, V. Saini, J. N. Glasgow, J. H. Mazorodze, M. A. Rahman, D. Reddy, J. R. Lancaster and A. J. C. Steyn, Nitric Oxide – Biol. Chem., 2016, 59, 28–41 CrossRef CAS PubMed.
- A. Kumar, S. Negi, T. Choudhury, V. Mutreja, S. Sunaina, S. C. Sahoo, A. Singh, S. K. Mehta, R. Kataria and V. Saini, Microchim. Acta, 2023, 190, 1–14 CrossRef.
- K. Gautam, S. Negi and V. Saini, Free Radical Res., 2021, 55, 655–670 CrossRef PubMed.
- S. Cheng, Y. Hou, X. Wen, D. Xu, X. Luo and H. Cao, Sens. Actuators, B, 2025, 422, 136601 CrossRef CAS.
- C. Y. Wang, C. C. Wang, X. W. Zhang, X. Y. Ren, B. Yu, P. Wang, Z. X. Zhao and H. Fu, Chin. Chem. Lett., 2022, 33, 1353–1357 CrossRef CAS.
- B. Muthuraj, R. Deshmukh, V. Trivedi and P. K. Iyer, ACS Appl. Mater. Interfaces, 2014, 6, 6562–6569 CrossRef CAS PubMed.
- T.-W. Shiue, Y.-H. Chen, C.-M. Wu, G. Singh, H.-Y. Chen, C.-H. Hung, W.-F. Liaw and Y.-M. Wang, Inorg. Chem., 2012, 51, 5400–5408 CrossRef CAS PubMed.
- H. Yu, L. Jin, Y. Dai, H. Li and Y. Xiao, New J. Chem., 2013, 37, 1688–1691 RSC.
- T. Nagano and T. Yoshimura, Chem. Rev., 2002, 102, 1235–1270 CrossRef CAS PubMed.
- P. N. Coneski and M. H. Schoenfisch, Chem. Soc. Rev., 2012, 41, 3753–3758 RSC.
- L. E. McQuade, J. Ma, G. Lowe, A. Ghatpande, A. Gelperin and S. J. Lippard, Proc. Natl. Acad. Sci. U. S. A., 2010, 107, 8525–8530 CrossRef CAS PubMed.
- X. Hu, J. Wang, X. Zhu, D. Dong, X. Zhang, S. Wu and C. Duan, Chem. Commun., 2011, 47, 11507–11509 RSC.
- M. H. Lim and S. J. Lippard, J. Am. Chem. Soc., 2005, 127, 12170–12171 CrossRef CAS.
- G. K. Vegesna, S. R. Sripathi, J. Zhang, S. Zhu, W. He, F.-T. Luo, W. J. Jahng, M. Frost and H. Liu, ACS Appl. Mater. Interfaces, 2013, 5, 4107–4112 CrossRef PubMed.
- T. Terai, Y. Urano, S. Izumi, H. Kojima and T. Nagano, Chem. Commun., 2012, 48, 2840–2842 RSC.
- H. Yu, X. Zhang, Y. Xiao, W. Zou, L. Wang and L. Jin, Anal. Chem., 2013, 85, 7076–7084 CrossRef CAS PubMed.
- V. Mutreja, A. Kumar, S. Sareen, K. Pathania, H. Sandhu, R. Kataria, S. V. Pawar, S. K. Mehta and J. Park, ChemistrySelect, 2022, 7, e202200448 CrossRef CAS.
- C. Sun, W. Shi, Y. Song, W. Chen and H. Ma, Chem. Commun., 2011, 47, 8638–8640 RSC.
- D. Mukherjee, S. Chand Pal, G. Das, K. R. Gore and M. C. Das, J. Environ. Chem. Eng., 2023, 11, 110528 CrossRef CAS.
- H. S. Li, S. H. Xing, Y. Xiao, C. Wang, Q. L. Guan, F. Y. Bai, Y. H. Xing and F. Xu, Chem. – Eur. J., 2023, 29, 1–13 Search PubMed.
- M. Şevik, S. M. Sezdi, E. Kavak, T. A. Arici and M. Arici, Cryst. Growth Des., 2023, 23, 5163–5172 CrossRef.
- M. Lei, F. Ge, S. Ren, X. Gao and H. Zheng, Sep. Purif. Technol., 2022, 286, 120433 CrossRef CAS.
- Q. Q. Li, M. J. Wen, Y. Sen Zhang, Z. S. Guo, X. Bai, J. X. Song, P. Liu, Y. Y. Wang and J. L. Li, J. Hazard. Mater., 2022, 423, 127132 CrossRef CAS PubMed.
- R. Verma, G. Dhingra, M. Kaur, D. Garg, I. Mohiuddin and A. K. Malik, J. Fluoresc., 2023, 33, 2085–2098 CrossRef CAS PubMed.
- P. Ju, M. Li, H. Yang, L. Jiang, L. Xia, R. Kong, E. Zhang and F. Qu, Inorg. Chem. Front., 2021, 8, 3096–3104 RSC.
- P. Wu, J. Wang, C. He, X. Zhang, Y. Wang, T. Liu and C. Duan, Adv. Funct. Mater., 2012, 22, 1698–1703 CrossRef CAS.
- W. Mandal, D. Majumder, S. Fajal, S. Let, M. M. Shirolkar and S. K. Ghosh, Mol. Syst. Des. Eng., 2023, 8, 756–766 RSC.
- S. Crispi, G. Nocito, F. Nastasi, G. Condorelli, A. G. Ricciardulli, P. Samorì, S. Conoci and G. Neri, Sens. Actuators, B, 2023, 390, 133957 CrossRef CAS.
- X. Sun, Y. Yan, Y. Wang, Y. Zhao, X. Dou, D. Zhang, L. Lu, G. Guo and X. Wang, Microchim. Acta, 2023, 190, 277 CrossRef CAS PubMed.
- M. Censabella, V. Iacono, A. Scandurra, K. Moulaee, G. Neri, F. Ruffino and S. Mirabella, Sens. Actuators, B, 2022, 358, 131489 CrossRef CAS.
- M. C. Burla, R. Caliandro, M. Camalli, B. Carrozzini, G. L. Cascarano, C. Giacovazzo, M. Mallamo, A. Mazzone, G. Polidori and R. Spagna, J. Appl. Crystallogr., 2012, 45, 357–361 CrossRef CAS.
- G. M. Sheldrick, Acta Crystallogr., Sect. C: Struct. Chem., 2015, 71, 3–8 Search PubMed.
- O. V. Dolomanov, L. J. Bourhis, R. J. Gildea, J. A. K. Howard and H. Puschmann, J. Appl. Crystallogr., 2009, 42, 339–341 CrossRef CAS.
- Richa, N. Kushwaha, S. Negi, A. Kumar, E. Zangrando, R. Kataria and V. Saini, Dalton Trans., 2021, 50, 13699–13711 RSC.
- V. Saini, K. C. Chinta, V. P. Reddy, J. N. Glasgow, A. Stein, D. A. Lamprecht, M. A. Rahman, J. S. Mackenzie, B. E. Truebody, J. H. Adamson, T. T. R. Kunota, S. M. Bailey, D. R. Moellering, J. R. Lancaster and A. J. C. Steyn, Nat. Commun., 2020, 11, 1–17 CrossRef PubMed.
- R. Alam, A. S. M. Islam, M. Sasmal, A. Katarkar and M. Ali, Org. Biomol. Chem., 2018, 16, 3910–3920 RSC.
- M. Wang, H. Dong, Y. Zhang, X. Zhu, M. Gu, Q. Zhu, X. Miao, Y. Zhou and M. Xu, Microchim. Acta, 2022, 189, 1–10 CrossRef PubMed.
- J. S. Hu, S. J. Dong, K. Wu, X. L. Zhang, J. Jiang, J. Yuan and M. D. Zheng, Sens. Actuators, B, 2019, 283, 255–261 CrossRef CAS.
- C. Zhang, S. Zhang, Y. Yan, F. Xia, A. Huang and Y. Xian, ACS Appl. Mater. Interfaces, 2017, 9, 13415–13421 CrossRef CAS PubMed.
- B. Sathyan, A. M. Tomy, N. Pm and J. Cyriac, RSC Adv., 2023, 13, 14614–14624 RSC.
- F. Zu, F. Yan, Z. Bai, J. Xu, Y. Wang, Y. Huang and X. Zhou, Microchim. Acta, 2017, 184, 1899–1914 CrossRef CAS.
- L. K. Keefer, R. W. Nims, K. M. Davies and D. A. Wink, Methods Enzymol., 1996, 268, 281–293 CAS.
- C. Orellana-Tavra, S. A. Mercado and D. Fairen-Jimenez, Adv. Healthcare Mater., 2016, 5, 2261–2270 CrossRef CAS PubMed.
- M. Durymanov, A. Permyakova, S. Sene, A. Guo, C. Kroll, M. Giménez-Marqués, C. Serre and J. Reineke, Mol. Pharmaceutics, 2019, 16, 2315–2325 CrossRef CAS PubMed.
- O. Lunov, T. Syrovets, C. Loos, J. Beil, M. Delacher, K. Tron, G. U. Nienhaus, A. Musyanovych, V. Mailänder, K. Landfester and T. Simmet, ACS Nano, 2011, 5, 1657–1669 CrossRef CAS PubMed.
- M. N. Möller and A. Denicola, Free Radicals Biol. Med., 2018, 128, 137–143 CrossRef PubMed.
Footnotes |
| † Electronic supplementary information (ESI) available. CCDC 2402336. For ESI and crystallographic data in CIF or other electronic format see DOI: https://doi.org/10.1039/d4tc04984e |
| ‡ Equal contribution. |
| This journal is © The Royal Society of Chemistry 2025 |