
The self-activated LiGa5O8 storage phosphor: insights into its photo/thermo/mechano-stimulated NIR luminescence†
Min
Jia
a,
Xiangyu
Zhang
 *b,
Xue
Yang
a,
Zehao
Lin
a,
Dingjun
Jia
a,
Yuqiang
Wang
a,
Sining
Yun
c and
Dangli
Gao
*a
*b,
Xue
Yang
a,
Zehao
Lin
a,
Dingjun
Jia
a,
Yuqiang
Wang
a,
Sining
Yun
c and
Dangli
Gao
*a
aCollege of Science, Xi’an University of Architecture and Technology, Xi’an, Shaanxi 710055, China. E-mail: gaodangli@163.com; gaodangli@xauat.edu.cn
bCollege of Science, Chang’an University, Xi’an, Shaanxi 710064, China. E-mail: xyzhang@chd.edu.cn
cFunctional Materials Laboratory (FML), School of Materials Science and Engineering, Xi’an University of Architecture and Technology, Xi’an, 710055, China
First published on 31st December 2024
Abstract
Multi-mode storage phosphors with photo/thermo/mechano-stimulated luminescence (PSL/TSL/ML) hold great potential applications in many fields such as biological imaging, human–machine interface, robotic manipulation, and stress/temperature visualization sensing. However, the physical mechanisms underlying this ‘self-sustaining’ luminescence are still debated, which in turn hinders the development of materials. Here, we demonstrate that the intrinsic defects such as the oxygen atom vacancies ( ) and interstitial oxygen atoms (
 ) in the matrix play an important role in the electronic structure and various physical properties of the LiGa5O8 storage phosphor by combining first-principles calculations and experimental methods. Particularly, the intrinsic defects lead to reduced bulk (B) and shear (G) moduli, Young's moduli (E), Poisson's ratio (v), B/G, and the bigger elastic anisotropy index (AU) and hardness (H) in three LiGa5O8 defect models, which are extremely advantageous for PSL/TSL/ML. We also demonstrate that the ML process, different from PSL/TSL processes, is intimately linked to the activation threshold of charge carriers in traps. This threshold can be lowered under axial stress by bandgap narrowing. This study provides not only direct evidence for potential variations in the ML process but also guidance for designing storage phosphors via defect engineering.
Introduction
Stimulated luminescence, including thermo/photo/mechano-stimulated luminescence (TSL/PSL/ML), represents the intelligent response of storage phosphors (i.e., optical batteries) to external stimuli, lasting for seconds or even longer under various conditions.1–5 Based on their unique stimulus-response, stimulated luminescence phosphors hold great application potential in many fields such as biological imaging, human–machine interface, robotic manipulation, and stress/temperature visualization sensing. Stimulated luminescence can be achieved in a single storage phosphor when the phosphor is driven by light energy, mechanical energy, or thermal energy. Among the stimulated luminescence, ML, in particular, is prevalent in nature and human activities, driven by ubiquitous mechanical energies such as wind, mechanical motion, and human joint movement, leading to broad applications in stress sensors, structural health diagnosis, various imaging technologies, and energy-saving sources and displays.6–12 In addition, the visualization of stress sensing based on ML phosphors provides new approaches for the development of emerging technologies like artificial intelligence, human–computer interaction, and the internet of things.13–16 Despite these advancements, a significant challenge facing stimulated luminescence applications is the low luminescence intensity and limited duration. The commonly accepted mechanisms suggest that the three forms of stimulated luminescence are closely related to traps. However, the precise mechanisms of trap-mediated charge capture and release, particularly in ML, remain unclear, directly hindering the development of stimulated luminescence storage materials, especially those for ML applications.Similar to the other stimulated luminescence, ML processes also stem from the combination of fluorescent centers and charge carriers de-trapped by traps in phosphors under dynamic loading.17 To achieve a high ML efficiency and reveal its mysterious mechanism, it is crucial to evaluate the role of matrix symmetry, defects, mechanical properties, and external mechanical load types in ML.18 Typically, stimulated luminescence phosphors are doped materials, but achieving uniform doping in low-dimensional particles is challenging. Additionally, most dopants are rare earth ions with complex 4f electron levels, complicating theoretical calculations of electronic band structures and obscuring the ML mechanisms related to defect manipulation.7 Therefore, developing high-performance, undoped ML materials is essential for elucidating the effects of defects and traps, and ultimately, the physical mechanism of ML.13
Throughout the literature, few undoped matrices exhibit ML. It is reported that undoped CaZnOS prepared under an argon atmosphere exhibits multiple oxygen vacancy-mediated green ML emission.19 ML has also been achieved in undoped CaLaAl3O7, and a mechanism is proposed based on stress-induced oxygen- and calcium-related defects.13 Although these studies have provided valuable insights into designing ML materials by defect engineering, their performance lags behind conventional persistent luminescence, particularly in terms of intensity that is even inaccessible by naked eyes. Advances in ML mechanisms20–24 have consistently linked ML to traps, highlighting the criticality of high energy transfer rates between localized levels and traps.25,26 However, the precise role of stress in manipulating traps and carriers in ML processes remains an open question, particularly the relationship between ML and matrix electronic structures, which limits the design and development of ML materials. Currently, the development of ML materials still relies on a trial-and-error approach.
LiGa5O8 (LGO), with its inverse spinel structure belonging to the space group Fd![[3 with combining overline]](https://www.rsc.org/images/entities/char_0033_0305.gif) m, is well-suited for forming rich traps and localized levels due to the volatilization of the light element Li and mutual substitution of Ga1 and Li (anti-site defects).27–29 Consequently, this structure with rich defects offers the potential for producing multi-field stimulated luminescence.
m, is well-suited for forming rich traps and localized levels due to the volatilization of the light element Li and mutual substitution of Ga1 and Li (anti-site defects).27–29 Consequently, this structure with rich defects offers the potential for producing multi-field stimulated luminescence.
Motivated by the aforementioned consideration, herein, we predicted self-activated LGO storage phosphors with stimulated luminescence emission based on first principles calculations. We combined experimental investigations (including photoluminescence excitation (PLE) spectra, emission spectra, afterglow spectra, various stimulated spectra and thermoluminescence (TL) curves) with theoretical studies (including stability, mechanical properties, and electronic structural properties of LGO structures with defects through first principles calculations) to reveal the relationship between defects and multi-field stimulated luminescence. Our findings indicate that defects introduce impurity energy levels in the bandgap, providing the necessary conditions for luminescence in wide bandgap semiconductors while also enhancing material flexibility through potential traps such as Li atom vacancies  , oxygen atom vacancies
  , interstitial oxygen atoms
  , and Li–Ga anti-site defects. Interestingly, under uniaxial stress loading, the bandgap structure decreases, submerging the defect levels within the valence/conduction band (VB/CB), thereby facilitating the release of charge carriers and subsequent ML.
Experimental
Chemicals
Materials and reagents: carbonates including Li2CO3 (99.99%) and Na2CO3 (99.9%), and oxide Ga2O3 (99.99%) were purchased from Aladdin. Anhydrous ethanol (C2H5OH, 99.8%), hydrochloric acid (AR, 36.0–38.0%), and polyvinyl alcohol (PVA, GR) were all obtained from China National Pharmaceutical Chemical Reagent Co., Ltd. All chemicals were used as received without further purification.Sample synthesis
The LGO storage phosphor was synthesized via the traditional high-temperature solid-state reaction method using Li2CO3, Na2CO3, and Ga2O3 as precursors. Based on the chemical formula of LGO, the raw materials were prepared and uniformly mixed in an agate mortar. Then, the finely mixed powder is pre-calcined in an air atmosphere for 2 h in an 800 °C chamber resistance furnace. Finally, the pre-calcined LGO powder was further annealed at 1350 °C for 5 h and then naturally cooled to room temperature.Computational details
The research on LGO was conducted using two density functional theory (DFT)30,31 based software packages: Medea Vienna ab initio simulation package (MedeA-VASP)32,33 and the Cambridge serial total energy package (CASTEP) codes.34 The optimization of structural performance adopts the Broyden Fletcher Goldfarb Shanno (BFGS) minimization method.35 The Perdew–Burke–Ernzerhof (PBE) exchange–correlation functionals use the generalized gradient approximation (GGA).36 The cut-off energy is set to 800 eV, and a high-precision grid spacing of less than 2π × 0.025 Å−1 is chosen. For the study of elastic constants and phonon spectra, the strain stress method and density functional perturbation theory (DFPT) method37 were used, respectively. Structural optimization and calculation of elastic constants were completed using the CASTEP, while the electronic band structure, electronic density of states, and phonon spectra at different strains were completed using MedeA-VASP. The electronic properties of several structures were predicted using the PBE functional. The elastic constants and modulus were calculated using the strain–stress method and Voigt–Reuss–Hill approximations, respectively.Characterization
The phase structure of the LGO phosphor was recorded using an X-ray diffractometer (XRD, D/Max2550GBt/PC) under Cu Kα (40 kV, 40 mA) irradiation of 1.5418 Å. The morphology and size of the sample were characterized using a scanning electron microscope (SEM, ZEISS Gemini 300). The optical performances were characterized using a Horiba spectrofluorometer (PTI Quanta Master 8000) equipped with a xenon lamp of 75 W. An adjustable 808 nm laser diode (power, 0–2 W) with a spot size of 9 × 4.5 mm2 and an adjustable 980 nm laser diode (power, 0–5 W) with a spot size of 6 × 6 mm2 are used as light sources. The TL curve of the persistent phosphor is obtained using custom-made heating apparatus (temperature range, 25–300 °C; heating rate, 1 °C s−1) integrated into the Horiba PTI spectrofluorometer's sample chamber. The stress flexible thin films were produced by mixing the LGO phosphor and PDMS. The patterned ultraviolet illuminated photo was obtained using a Canon EOS 60D camera.Results and discussion
Theoretical prediction via calculation
To provide theoretical basis for the experiment, DFT can be used to perform theoretical calculations on the material to gain further understanding of the material.38,39 As is well known, the stimulated luminescence is closely related to traps that originate from various defects in the materials.40,41 In undoped LGO oxide, ,
,  ,
,  and anti-defects are considered as natural intrinsic defects of the oxide.42–45 Based on the lowest energy principle, we selected three types of defects:
  ,
,  and
and  . According to Table S1 (ESI†), the relative enthalpy values of
  indicate that it has the smallest enthalpy value when inserted into the Ga1O6 gap. Therefore, the model of LGO with
  in the gap of Ga1O6 is used for the later calculation. Similarly, the
  is present in Ga1O6, leading to Ga1O5 in the model of LGO with
  .
.
We first calculated the elastic constants of these four models for checking their mechanical stability. Table 1 lists the elastic constants Cij of four models. C11 > 0, C44 > 0, C11 > |C12|, and (C11 + 2C12) > 0 are true in all four models of cubic phase LGO. According to the Born–Huang stability criterion, we can assert that these structure models are all mechanically stable.46 Moreover, in various defect models, the elastic tensor is clearly smaller than that of perfect LGO crystals, suggesting that defects can further increase deformation under the same stress.
 (recorded as the
  model), LGO with a
  (recorded as the
  model), and LGO with a
  (recorded as the
  model), with perfect LGO as the reference (recorded as the LGO model)
| Name | C 11 | C 12 | C 13 | C 22 | C 33 | C 44 | C 55 | C 66 | B | G | E | B/G | v | H | A U |
|---|---|---|---|---|---|---|---|---|---|---|---|---|---|---|---|

|
212 | 111 | 114 | 202 | 203 | 105 | 107 | 104 | 144 | 76 | 193 | 1.89 | 0.28 | 9.5 | 0.86 |

|
221 | 125 | 122 | 222 | 216 | 107 | 108 | 110 | 155 | 78 | 201 | 1.99 | 0.29 | 9.2 | 0.84 |

|
190 | 114 | 109 | 194 | 196 | 97 | 96 | 95 | 140 | 68 | 175 | 2.05 | 0.29 | 8.0 | 1.00 |
| LGO | 266 | 163 | 163 | 266 | 266 | 116 | 116 | 116 | 197 | 84 | 220 | 2.35 | 0.31 | 8.0 | 0.82 |
To further evaluate the brittleness and flexibility of the material, the Young's modulus (E) is calculated using the equation E = 9BG/(3B + G),47 where B represents the bulk modulus and G represents the shear modulus. As listed in Table 1, the elastic modulus of the defect models is much smaller than that of the prefect LGO lattice, indicating that defects lead to greater flexibility of LGO materials. The toughness and brittleness of the material are evaluated using Pugh standards.48 In particular, with B/G of 1.75 and v of 0.26 as critical values, when B/G and v are less than the critical values, the material is brittle; otherwise, it is classified as tough.49 In all four models, the B/G value is much greater than 1.75 and the v value is higher than 0.26, indicating that LGO with various defects is a high-toughness material.
It is generally agreed that the compounds with anisotropy in elasticity are advantageous for generating ML, since the internal electric field in certain preferred directions may be large enough to drive carrier trap de-trapping and generate ML. The three-dimensional (3D) and two-dimensional (2D) Young's moduli are employed to describe the mechanical anisotropy characteristics in the four model structures by Young's moduli deviating from the size of the sphere.50 In Fig. 1 and Fig. S1a–c (ESI†), these 3D views of these physical quantities all show different degrees of deformation, indicating anisotropy on the Young's modulus, shear moduli and Poisson ratio of the four models. The degree of 3D Young's modulus anisotropy can be described by the deviation from sphericity via the ratio of its maximum value to minimum value. The elastic anisotropy on Young's modulus is the largest in the  model (Emax/Emin = 267.60 GPa/129.12 GPa = 2.072) and is the opposite in the perfect LGO lattice (Emax/Emin = 290.12 GPa/142.88 GPa = 2.031). The universal elastic anisotropy index AU is as follows: AU = 5GV/GR + BV/BR − 6, where the V, R, G and B are the Voigt approximation, Reuss approximation, shear modulus and bulk modulus, respectively.51 The universal elastic anisotropy index AU is higher in the three defect structures (0.86, 0.84 and 1.00 for
  ,
,  and
and  , respectively) than in the perfect LGO lattice (0.82). Besides the bigger AU in the three defect models, one can observe in Table 1 the smaller B, G, E, B/G, and v and the bigger H in the defective model relative to those in the perfect crystal. These results suggest that there will be greater deformation under the same stress, and a larger rupture stress threshold in the three defective models, especially in the
  and
and  models.
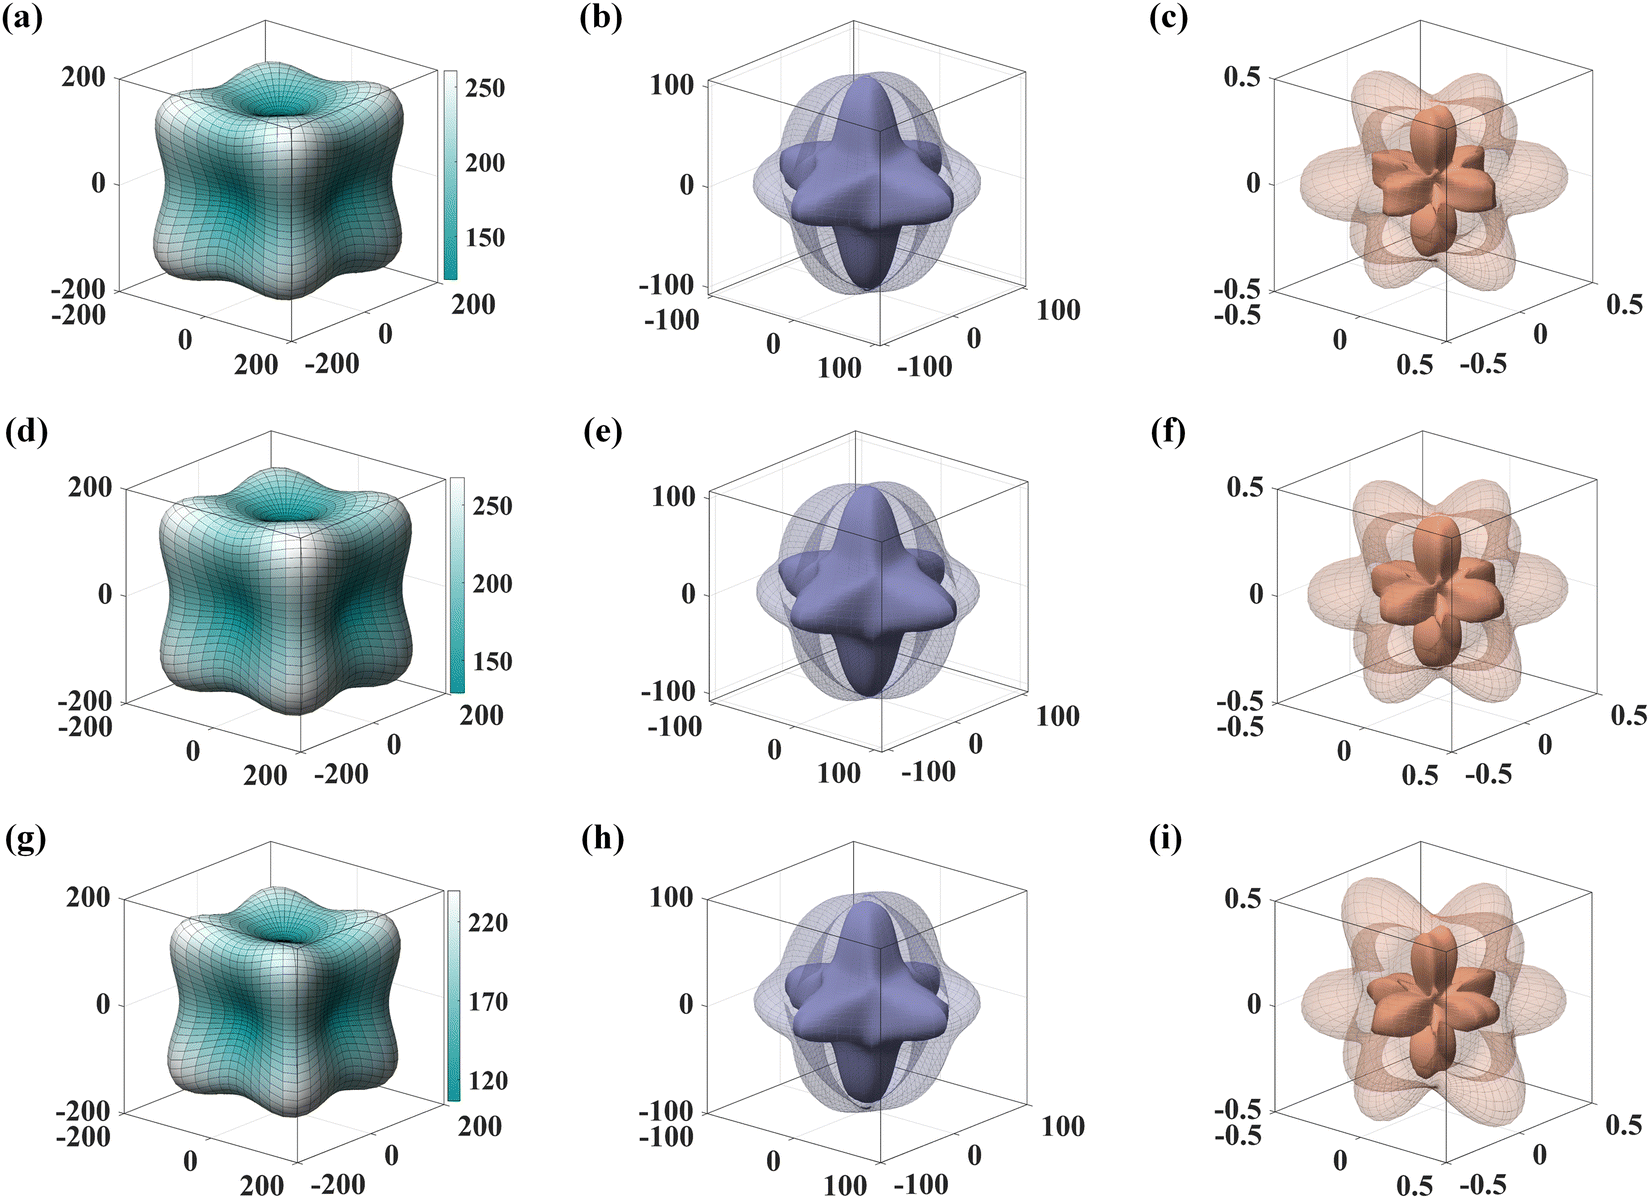 | ||
Fig. 1 Direction-dependent 3D view of Young's moduli, shear moduli and Poisson ratio for the  model (a)–(c), the model (a)–(c), the  model (d)–(f), and the model (d)–(f), and the  model (g)–(i). model (g)–(i). | ||
Fig. 2 and Fig. S1d–f (ESI†) show the 2D view of the elastic modulus of four structures on different surfaces. From Fig. 2 and Fig. S1d–f (ESI†), one can find that all closed curves of the elastic modulus of four structures deviate from the shape of a circle. The  model structure has the greatest Poisson's ratio and shear moduli in the (100) plane and (011) plane, and the distribution of other parameters of G and v for the four models is listed in Table S2 (ESI†). These results indicate the excellent mechanical anisotropy in the LGO matrix. Especially, the presence of
  defects in the LGO matrix further increases its mechanical anisotropy.
 | ||
Fig. 2 2D representation of Young's moduli, shear moduli and Poisson's ratio for the  model (a)–(c), model (a)–(c),  model (d)–(f), and model (d)–(f), and  model (g)–(i). Note that the solid and dashed lines are, respectively, the maximal and minimal shear moduli in (b), (e) and (h) and the maximal and minimal Poisson's ratio in (c), (f) and (i). model (g)–(i). Note that the solid and dashed lines are, respectively, the maximal and minimal shear moduli in (b), (e) and (h) and the maximal and minimal Poisson's ratio in (c), (f) and (i). | ||
Previous structural investigations have showed that approximately 80% of ML phosphors have a flexible framework, in which elastic anisotropy exists or can be expected. Besides anisotropy in the elastic modulus, factors such as crystal structures, point defects and their aggregation, and microstructures such as domains or domain walls have been shown to be closely related to the generation of ML. Point defects and their aggregation serve as traps for capturing charge carriers. However, the strain enables the flexible and anisotropic geometric configuration of trap change, leading to variations in the binding energy of traps and then possibly facilitating the escape of trap charges. Particularly, point defects and extended defects can locally break the structure for reducing de-trapping barriers of traps.52 Combining the aforementioned analysis, we reasonably believe that LGO with various defects (including  ,
,  and
and  ), which exhibits the highest anisotropy on the elastic modulus, the highest elastic index, and the best ductility, is most expected to obtain objective ML.
Encouraged by the possibility of obtaining stimulated luminescence, we calculated the distribution of impurity energy levels in LGO semiconductors with a wide bandgap, since the impurity level in the bandgap plays a crucial role in various luminescence-based processes. To further verify the attribution of impurity energy levels, the part density of state (PDOS) for four models is also conducted.
Fig. 3 presents the electronic band structures of the three models, including  ,
,  and
and  models. The electronic band structures and PDOS of LGO are shown in Fig. S2 (ESI†) as reference. We can find that all four structures are quasi-direct bandgap semiconductors. Note that the maximal valence band (MVB) and minimal conduction band (MCB) are mainly composed of O 2p and Ga 4s, 4p, respectively. Among the four structure models, the largest and smallest values of bandgap are found in the
  model (3.09 eV) and
  model (2.37 eV). Compared to pure LGO,
  ,
,  and
and  models did not show any changes in the main composition at the top of the VB and bottom of the CB, but obvious impurity bands appeared near the top/bottom of the VB/CB. By comparing impurity energy levels in the three defect models, it is found that the impurity energy level in the
  model has the two levels and is very close to the top of VB, and the electrons in the VB can easily jump to the defect level via thermal perturbation, leading to various transitions. So they are more likely to act as the afterglow centers during the PersL process. Fig. 3d–f depict the PDOS of LGO with defects. PDOS showed that the impurity bands were mainly composed of O 2p and Ga 4p, 3d orbital hybridization. In particular, two strong
  defect states appeared near the VBM. Moreover, the
  impurity energy level demonstrated the maximum density of states. These results indicate that strong
  energy states are expected as luminescent levels, while weak
  and
and  defect states may serve as traps in the afterglow and mechanical luminescence process. Considering both the Young's modulus and electronic bandgap structure together, we can conclude that the
  defects have a more significant effect on reducing the bandgap and enhancing the mechanics anisotropy than
  and
and  . The electron-difference densities show that the charge interactions in Ga–O are stronger than those in Li–O in the
  models (Fig. S3, ESI†), indicating the presence of a Ga1O4 group in possible photon processes.
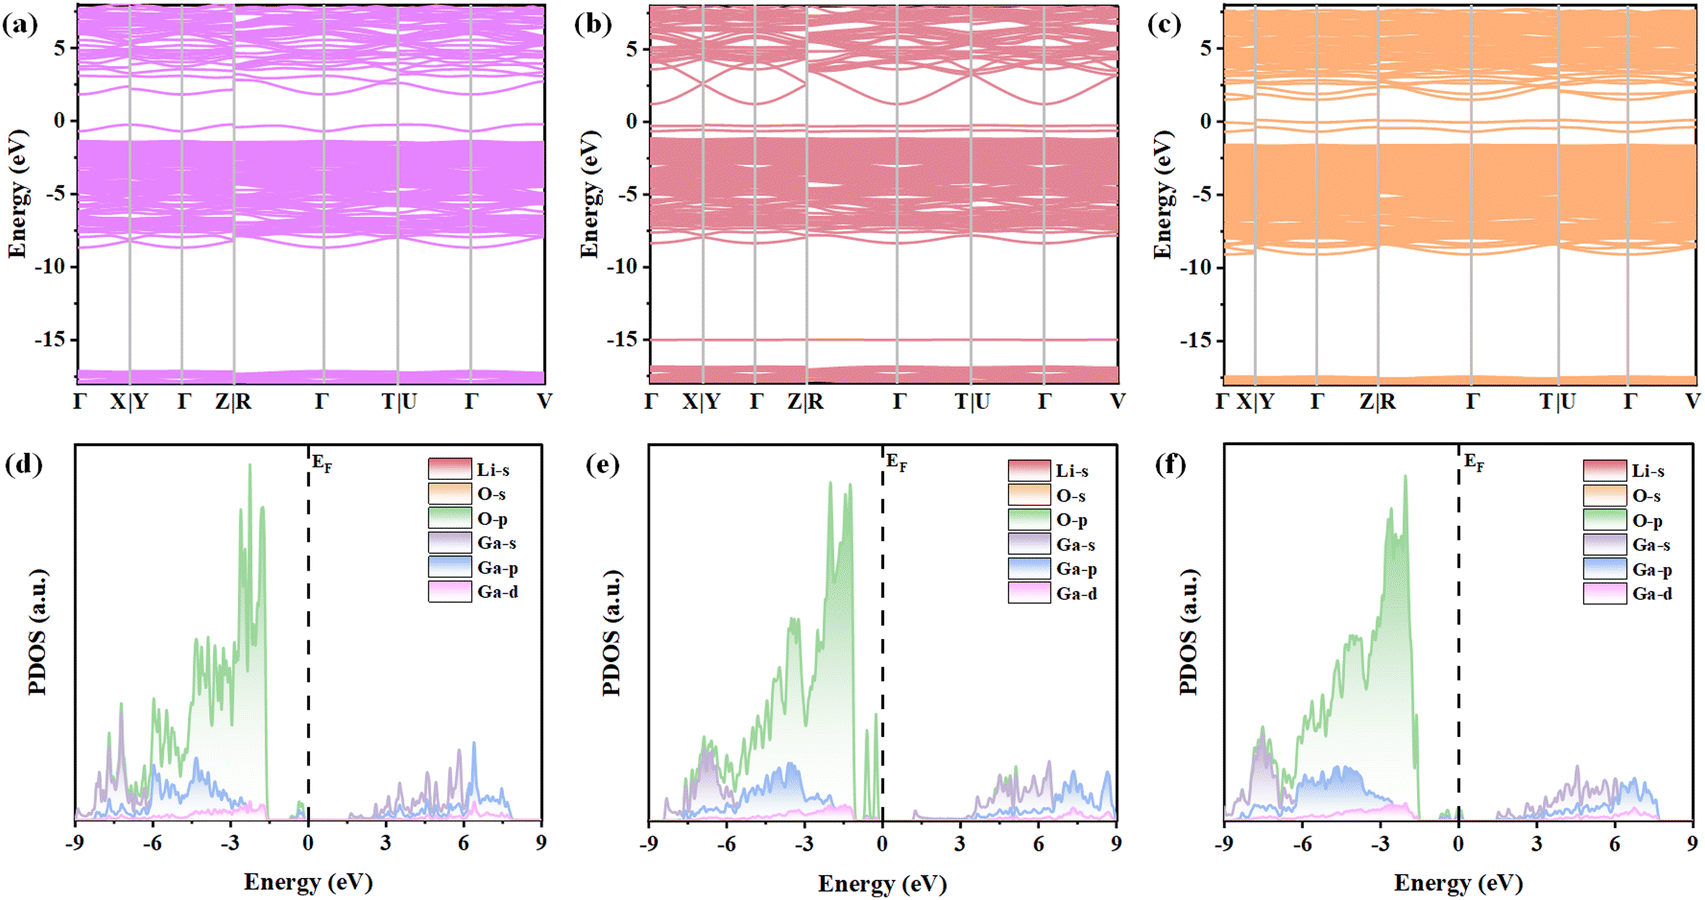 | ||
Fig. 3 The electronic band structures and PDOS for the  model (a) and (d), model (a) and (d),  model (b) and (e), and model (b) and (e), and  model (c) and (f). model (c) and (f). | ||
Considering that the interesting luminescence properties that are closely related to stress-induced electronic transition, the electronic structure under stress load is something that must be calculated using a quantum mechanical approach. Before calculating the stress-induced bandgap structure changes, we first employed phonon spectra to check the stability of the material structure (Fig. S4, ESI†). In particular, based on the predicted results using the phonon spectrum (the step sizes of strains: 2%), the  model can experience the largest uniaxial strains up to 6% along the x, y and z direction. Fig. 4b–d show the changes in the band structure. It can be observed that the orange impurity level remains unchanged in the energy level with increasing strain, locating at 0 eV. With the increase of strain, the CBM moves downwards, while the VBM moves upwards, leading to a decrease of the bandgap (from 2.379 to 1.844 eV in the x direction, 2.379 to 1.838 eV in the y direction and 2.379 to 1.821 eV in the z direction, respectively) and the shallowing of traps. From a geometrical point of view under single axial load, it causes the distortion of Ga1O6 and Li1O6 octahedrons by increasing the bond length of Ga–Li bonds and increasing the bond angles between Ga–O and Li–O bonds (Fig. 4a), leading to a weak interaction between Ga1O6 and LiO6 octahedrons, thereby weakening the potential field. As a result, single uniaxial stress causes changes in electronic energy levels by lattice distortion. Carefully observed, one can find that in the process of the VBM and CBM both shifting towards the middle, besides the decrease in the bandgap, the energy level gap between impurity energy levels also changes (Fig. 4b–d). For example, as the strain on the x-axis and z-axis increases, the impurity energy levels move towards the VBM direction; as the y-axis strain increases, the impurity energy level shifts towards the middle. At the same time, we also calculated and studied the PDOS under uniaxial strain (Fig. S5, ESI†) and the similar results are acquired. These results on the mechanically induced changes in the band structure suggest that mechanical stimulation may fine adjust the trap distribution by shifting the MCB and MVB to a certain extent.
 | ||
Fig. 4 Coordination structure diagram of the GaO6 octahedron and electron bandgap structures of LGO with the  model before and after applying stress. (a) Coordination structure diagram of GaO6, and (b)–(d) the electron bandgap structures under uniaxial strain along the x, y and z directions. Note that the pink and blue squares represent the CB and VB, respectively, while the orange and brown lines represent the two impurity bands. model before and after applying stress. (a) Coordination structure diagram of GaO6, and (b)–(d) the electron bandgap structures under uniaxial strain along the x, y and z directions. Note that the pink and blue squares represent the CB and VB, respectively, while the orange and brown lines represent the two impurity bands. | ||
Structure analysis
After the theoretical prediction on the defect structure and physical characteristics of LGO, relative experiments were carried out. The structural illustration of LGO with an anti-spinel structure in a space group of Fdm is shown in Fig. 5a, where there are three basic building units [Ga1O6], [LiO6] octahedrons, and [Ga2O4] tetrahedrons. Both Li and Ga1 are coordinated with six O atoms, forming [LiO6] and [Ga1O6] octahedrons, in which Li–O and Ga1–O give the same bond length of 2.05075 Å.6 Due to the similar ionic radii of Li+ (59 pm) and Ga3+ (62 pm), Li and Ga1 can replace each other, leading to the formation of anti-site defects.53 In order to meet charge balance,  ,
,  and
and  are generated simultaneously. Fig. 5b displays the XRD patterns of the LGO. Carefully observing the cationic coordination units in the following Fig. 5a, Ga3+ has four-coordination and six-coordination units. Therefore, due to lattice distortion by anti-site defects, interstitial oxygen atoms are more likely to form four-coordination Ga3+, which explains the reason for the higher state density of
  in the gap (Fig. 3e). All the diffraction peaks are consistent with the standard data of a stable cubic phase of the inverse spinel structure (PDF No. 76-0199), indicating a high yield of synthetic samples. Rietveld structure refinement indicates the successful preparation of cubic phase LGO (Fig. 5c).
 | ||
| Fig. 5 Structure and XRD patterns of LGO matrix phosphors. (a) The structure scheme. (b) Typical XRD patterns. (c) Rietveld refinement of the typical XRD pattern. | ||
Multi-modal spectral characteristics of LGO
As an experiment of conceptual evidence, Fig. 6a shows the photoluminescence (PL) spectra of the LGO phosphor with a strong broadband emission at 721 nm and a weak broadband emission at 521 nm, leading to an orange PL photo in the inset. The two broadband emission can be assigned to the transition of the and
and  defect states under excitation at 254 nm, which is consistent with the theoretical analysis.6,29 Monitoring red emission at 721 nm, the PL excitation (PLE) spectra are composed of four peaks at about 254 (4.88 eV), 297 (4.17 eV), 420 (2.95 eV), and 592 nm (2.09 eV), which can be assigned to matrix absorption,
  , [Ga2O4] tetrahedron transition, and
  defect energy level transition, respectively.54 Combining the PLE spectra monitored at 721 nm with the PL spectra, we can deduce that energy transfer occurs from the
  to
to  defect level. In addition, the PLE spectrum shows that
  vacancies have more energy levels than
  . DFT calculations indicate that
  has a high density of states, while the XRD crystal structure suggests that Ga in [Ga2O4] has active sites connecting interstitial oxygen and is prone to charge transfer between Ga3+ and O2−. This may explain why
  is more likely to act as a fluorescent centre, while
  vacancies are more inclined to act as defect centres. After the excitation light stopped, the measured afterglow spectrum shows a strong broadened emission band peaking at 721 nm and a weak narrowed band peaking at 521 nm, suggesting that it originated from the same colour centre (Fig. 6c). But the colour of the afterglow and ML is dominated by red as shown in the inset of Fig. 6c due to the weak and narrowed green luminescence band with a significantly shorter lifespan than the red afterglow (Fig. S6, ESI†). The stress flexible thin films composed of PDMS and LGO phosphor are shown in Fig. S7 (ESI†). The ML photo faintly shows the pressure distribution in the inset of Fig. 6c. Compared to the afterglow, there is an urgent need to increase the brightness of ML.
 | ||
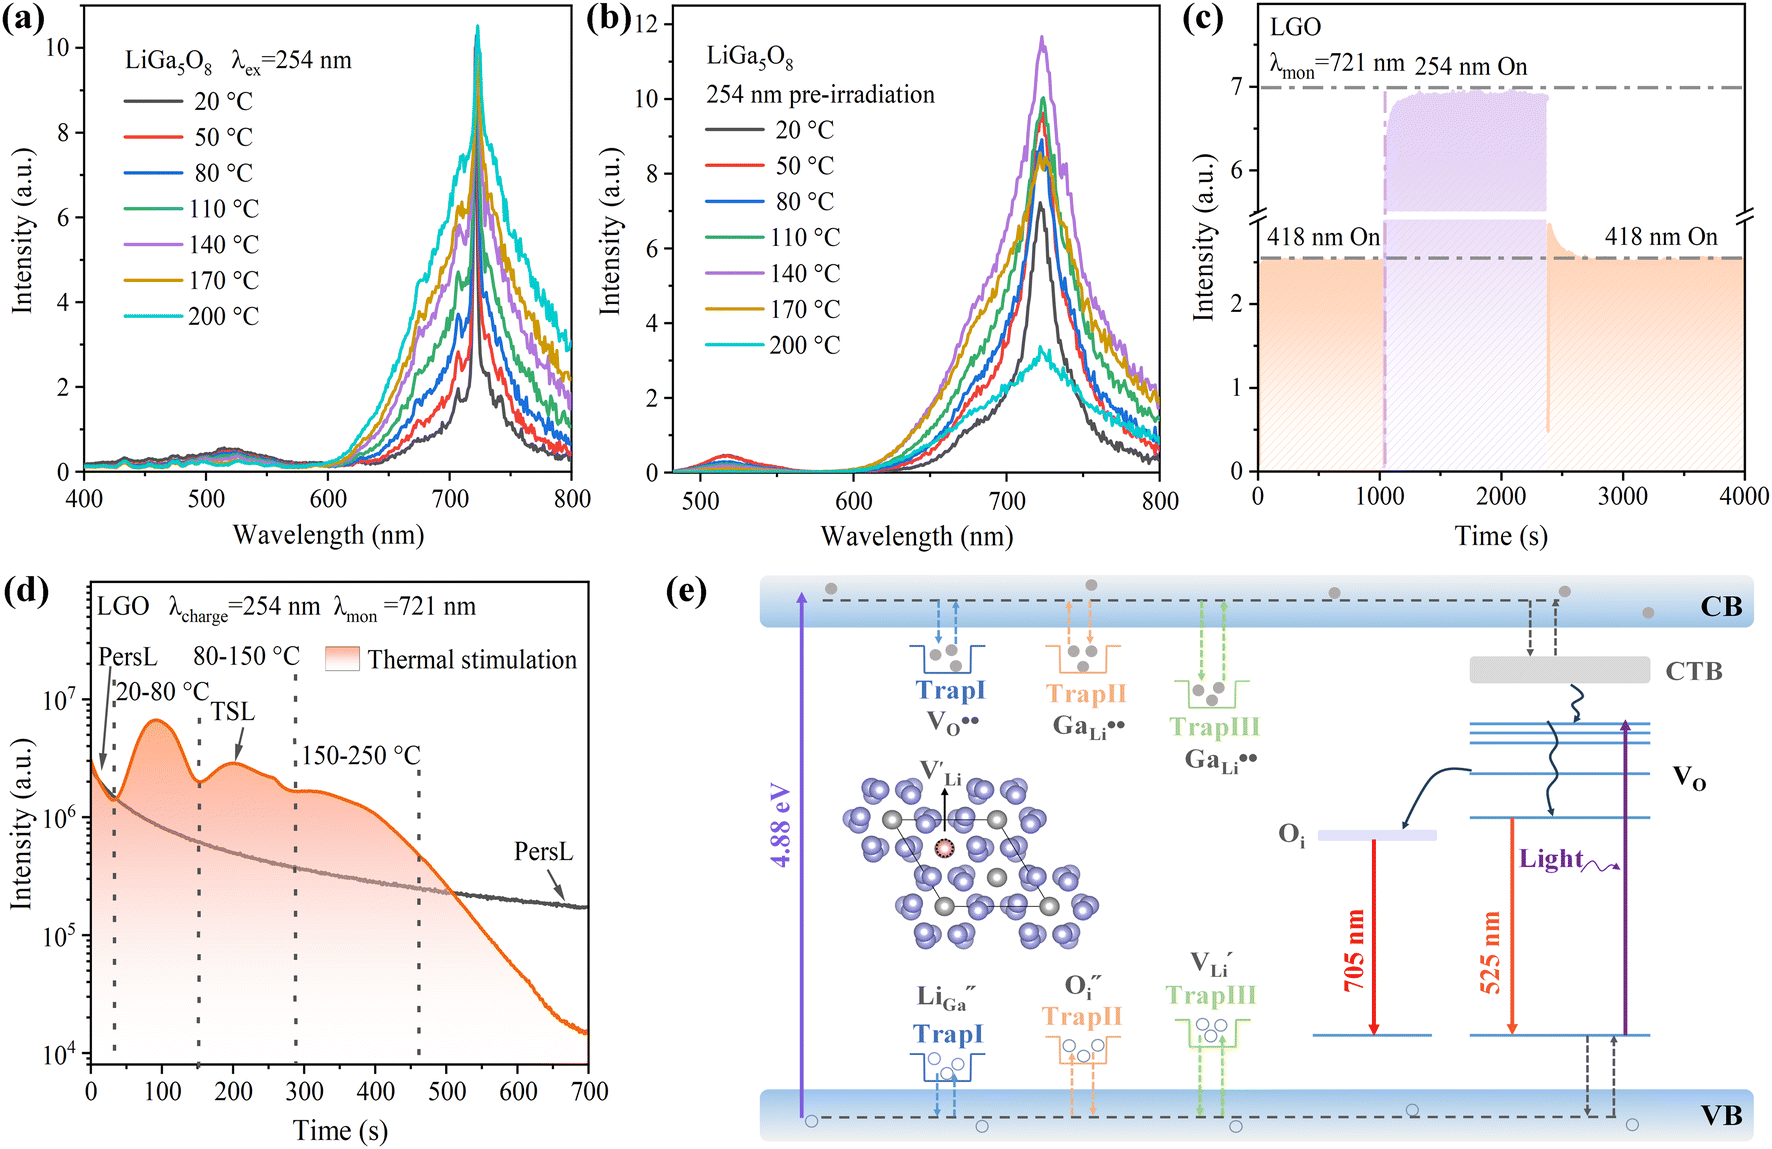
| Fig. 6 Spectral characteristics of LGO series phosphors. (a) PL emission spectra excited at 254 nm and PL photos in the inset. (b) PLE spectra monitored at 521 nm and 721 nm. (c) PersL emission spectra, and the PersL photo as well as the photo of stress distribution of the fluorescent film under steel wire mesh compression in the inset. (d) and (e) PSL signal obtained in a pulsed mode (on/off intervals, 20/20 s) using an 808/980 nm laser (power density, 0.4 W cm−2) on intrinsic decay curves (monitoring wavelength λmon = 721 nm). (f) TL curves monitored at 721/521 nm. Before the measurement of PersL, PersL decay curves and TL spectra, the sample is pre-charged with 254 nm UV light for 6 minutes. | ||
Interestingly, during the natural decay of afterglow, the decaying luminescence can be repeatedly enhanced by mechanical, thermal, and optical stimuli on decay curves. Even after the afterglow completely disappears, phosphor can be illuminated again by a near-infrared laser, heat, and machinery (Fig. 6d and e). The TL curve displays three types of depth traps (Fig. 6f). These TL glow peaks appeared around 350 K (peak I), 405 K (peak II) and 500 K (peak III). The average depths of trap I, II and III in LGO are estimated via equation E = (0.94![[thin space (1/6-em)]](https://www.rsc.org/images/entities/char_2009.gif) lnβ + 30.09) × kTm, in which E, β, k and Tm stand for the trap depth, the heating rate, the Boltzmann constant and the temperature of the TL peaks, respectively, and the results are ∼0.907 eV, 1.05 eV and 1.43 eV, respectively.55
lnβ + 30.09) × kTm, in which E, β, k and Tm stand for the trap depth, the heating rate, the Boltzmann constant and the temperature of the TL peaks, respectively, and the results are ∼0.907 eV, 1.05 eV and 1.43 eV, respectively.55
The PL intensity increase at 721 nm (originating from  ), while the PL intensity decrease at 520 nm (originating from
  vacancies) with elevating temperature (Fig. 7a). The PersL intensity at 721 nm increases first and then decreases with increasing temperature, reaching its maximum value at 140 °C (Fig. 7b). These results strongly support the conclusion of the PLE spectrum where energy transfer occurs from
  to
to  . Monitoring the PL dynamic spectrum at 721 nm (originating from
  ), the luminescence intensity after charging is significantly enhanced due to the addition of the afterglow decay curve to the steady-state PL (Fig. 7c), indicating
  serving as a local colour centre rather than as traps. PLE spectra demonstrate that both Ga1O6 and
  transfer energy to
  (Fig. 6b). Combining the multi-peak transitions (reflecting a multi-level structure) of
  on the PLE spectrum and weak PL intensity of
  on the PL spectrum, we infer that
  mainly acts as a trap. Fig. 7d shows that the PersL intensity at 721 nm can be finely tuned through thermal stimulation during the natural decay process. In addition to TSL and PSL, visual red ML can also be clearly recognized by the naked eye.
 | ||
| Fig. 7 Temperature-dependent luminescent performances of the LGO phosphor. (a) and (b) PL and PersL spectra. (c) PL dynamic spectrum monitored at 721 nm. (d) TSL signal obtained on decay curves (monitoring wavelength: λmon = 721 nm) under a heating mode with pulse fluctuations. (e) Schematic of the proposed mechanisms of PersL, PSL/TSL, ML and ML afterglow. | ||
Before measurements of the PersL emission spectra and the TSL decay curves, the sample is pre-irradiated using a 254-nm UV lamp for 6 min. Considering the experimental and theoretical results together, possible defects can be obtained by using the defect equations as follows:
 | (1) |
 | (2) |
 | (3) |
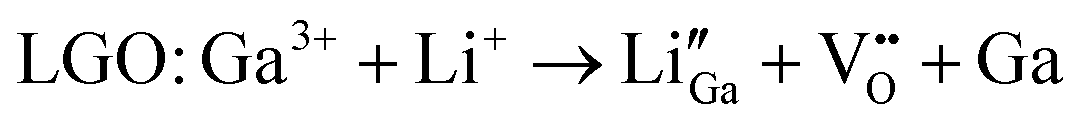
Based on the stability, ionization energy, trap distribution represented by TL, DFT calculation, and spectral analysis of the three types of traps, we can deduce the relative depth of the three pairs of traps and mark them on the luminescent mechanism diagram, as shown in Fig. 7e. Under 254 nm UV light irradiation, VB electrons are elevated to the CB, and a portion of electrons directly relax to the excited state of  ,
,  and/or Ga1O4 energy levels, resulting in PL emission. The remaining electrons and holes are captured by traps, including
  ,
,  , and
, and  . Under thermal/mechanical/optical stimulation, charge carriers are released and then combine with colour centres such as
  , resulting in multi-mode stimulated luminescence. Multi-mode luminescence mechanisms are proposed (Fig. 7e). The carriers trapped by three pairs of defect clusters in LGO first move from the deep trap level to shallow trap level, and then to the fluorescence centre via the CB and/or VB, resulting in ML, under mechanical stimulation.
Conclusions
In summary, the possible property of the target LGO material was calculated and predicted via the first principles combined with experimental analysis for exploring the relationship between stimulated luminescence and electronic structure. The results indicate that this flexible LGO material demonstrates excellent ductility and large anisotropy on mechanical properties. Under the application of an axial stress of 6%, the bandgap structure decreases from 2.670 to 1.916 eV, leading to the recombination of charge carriers and colour centres and subsequent ML. Excellent TSL/ML/PSL performances are closely related to the anisotropic elasticity distribution in LGO, which provides a preferred path for charge carriers. In addition, the intrinsic defects such as further enhance the anisotropic elasticity index and decrease the bandgap. Among the three pairs of defects,
  prefers to be the colour centre, while
  is mainly trap in three pairs of defect clusters due to greater stability in
  than
than  . This work provides not only new ideas for prediction and development of PersL materials but also a paradigm for the analysis of traps in persistent materials.
Data availability
The data that support the findings of this study are available from the corresponding author upon reasonable request.Conflicts of interest
There are no conflicts to declare.Acknowledgements
This work was supported by the National Natural Science Foundation of China (11604253), the Shaanxi Fundamental Science Research Project for Mathematics and Physics (23JSY003), the Shaanxi Key Science and Technology Innovation Team Project (2022TD-34), and the Natural Science Basic Research Program of Shaanxi Province (2023-JC-YB-567).Notes and references
- D. Gao, Q. Kuang, F. Gao, H. Xin, S. Yun and Y. Wang, Mater. Today Phys., 2022, 27, 100765 CrossRef CAS.
- D. Gao, J. Gao, F. Gao, Q. Kuang, Y. Pan, Y. Chen and Z. Pan, J. Mater. Chem. C, 2021, 9, 16634–16644 RSC.
- S. Ding, P. Chen, H. Guo, P. Feng, Y. Zhou, Y. Wang and J. Sun, J. Energy Chem., 2022, 69, 150–160 CrossRef CAS.
- X. Zhang, Z. Wang, C. Xu, D. Gao, Q. Pang, J. Xu and X. Wang, Laser Photonics Rev., 2024, 2401376 CrossRef.
- D. Gao, C. Du, Y. Wang, W. Xu, W. Gao, Q. Pang and Y. Wang, J. Mater. Chem. C, 2024, 12, 19487 RSC.
- N. Zhang, B. Tian, Z. Wang, A. T. Smith, Z. Ma, Z. Xue and L. Sun, Adv. Opt. Mater., 2021, 9, 2100137 CrossRef CAS.
- A. Feng and P. F. Smet, Materials, 2018, 11, 484 CrossRef PubMed.
- D. Tu, C. N. Xu, Y. Fujio, S. Kamimura, Y. Sakata and N. Ueno, Appl. Phys. Lett., 2014, 105, 011908 CrossRef.
- Z. Wang, B. Wang, X. Zeng, D. Peng and Y. Wang, Adv. Opt. Mater., 2023, 11, 2300623 CrossRef CAS.
- S. Peng, P. Xia, T. Wang, L. Lu, P. Zhang, M. Zhou and X. Xu, ACS Nano, 2023, 17, 9543–9551 CrossRef CAS.
- S. M. Jeong, S. Song, K. I. Joo, J. Kim, S. H. Hwang, J. Jeong and H. Kim, Energy Environ. Sci., 2014, 7, 3338–3346 RSC.
- Y. Zhuang, D. Tu, C. Chen, L. Wang, H. Zhang, H. Xue, C. Yuan, G. Chen, C. Pan, L. Dai and R. Xie, Light: Sci. Appl., 2020, 9, 182 CrossRef CAS PubMed.
- Y. Li, I. P. Koskin, Z. Ma, E. Benassi and Z. Wang, Dalton Trans., 2020, 49, 3942–3945 RSC.
- P. Xiong, M. Peng and Z. Yang, iScience, 2021, 24, 101944 CrossRef CAS.
- S. Wu, B. Xiao, Y. Xiao, P. Shao, Y. Wang and P. Xiong, Nano Energy, 2023, 116, 108811 CrossRef CAS.
- A. Qasem, P. Xiong, Z. Ma, M. Peng and Z. Yang, Laser Photonics Rev., 2021, 15, 2100276 CrossRef CAS.
- Y. Zhuang and R. Xie, Adv. Mater., 2021, 33, 2005925 CrossRef CAS.
- Y. Yan, S. Fang, Y. Li, Y. Xu, Y. Song, Z. Ma and Z. Wang, J. Mater. Chem. C, 2023, 11, 11509–11517 RSC.
- C. Pan, J. Zhang, M. Zhang, X. Yan, Y. Long and X. Wang, Appl. Phys. Lett., 2017, 110, 233904 CrossRef.
- X. Fan, J. Zhang, M. Zhang, C. Pan, X. Yan, W. Han, H. Zhang, Y. Long and X. Wang, Opt. Express, 2017, 25, 14238–14246 CrossRef CAS PubMed.
- X. Pan, Y. Zhuang, W. He, C. Lin, L. Mei, C. Chen and R. Xie, Nat. Commun., 2024, 15, 2673 CrossRef CAS.
- B. P. Chandra, V. K. Chandra and P. Jha, Phys. B, 2015, 463, 62–67 CrossRef CAS.
- K. S. Sohn, W. B. Park, S. Timilsina and J. S. Kim, Opt. Lett., 2014, 39, 1410–1413 CrossRef CAS.
- F. Seitz, Rev. Mod. Phys., 1946, 18, 384 CrossRef CAS.
- J. Zhang, X. Wang, G. Marriott and C. Xu, Prog. Mater. Sci., 2019, 103, 678–742 CrossRef CAS.
- H. Chen, L. Wu, T. Sun, R. Dong, Z. Zheng, Y. Kong, Y. Zhang and J. Xu, Appl. Phys. Lett., 2020, 116, 051904 CrossRef CAS.
- D. Chen, J. Eur. Ceram. Soc., 2014, 34, 4069–4075 CrossRef CAS.
- P. Xiong, M. Peng, K. Qin, F. Xu and X. Xu, Adv. Opt. Mater., 2019, 7, 1901107 CrossRef CAS.
- G. K. Behrh, M. Isobe, F. Massuyeau, H. Serier-Brault, E. E. Gordon, H. J. Koo, M. H. Whangbo, R. Gautier and S. Jobic, Chem. Mater., 2017, 29, 1069–1075 CrossRef CAS.
- P. Hohenberg and W. J. P. R. Kohn, Phys. Rev. [Sect.] B, 1964, 136, 864 CrossRef.
- W. Kohn, Chimia, 2000, 54, 50 CAS.
- B. Silvi and A. Savin, Nature, 1994, 371, 683–686 CrossRef CAS.
- A. D. Becke and K. E. Edgecombe, J. Chem. Phys., 1990, 92, 5397–5403 CrossRef CAS.
- S. J. Clark, M. D. Segall, C. J. Pickard, P. J. Hasnip, M. I. Probert, K. Refson and M. C. Payne, Z. Kristallogr. - Cryst. Mater., 2005, 220, 567–570 CrossRef CAS.
- B. G. Pfrommer, M. Côté, S. G. Louie and M. L. Cohen, J. Comput. Phys., 1997, 131, 233–240 CrossRef CAS.
- J. P. Perdew, K. Burke and M. Ernzerhof, Phys. Rev. Lett., 1996, 77, 3865 CrossRef CAS PubMed.
- S. Baroni, S. De Gironcoli, A. Dal Corso and P. Giannozzi, Rev. Mod. Phys., 2001, 73, 515 CrossRef CAS.
- T. Wang and F. Abild-Pedersen, J. Energy Chem., 2020, 58, 2095–4956 Search PubMed.
- A. Min, V. Maheskumar, D. H. Lee, A. Kumar, C. J. Moon, R. A. Senthil and M. Y. Choi, J. Energy Chem., 2024, 99, 541–552 CrossRef CAS.
- C. Jia, D. Gao, Z. Wang, X. Zhang, S. Yun, J. Z. Zhang and X. Wang, Mater. Today Chem., 2024, 39, 102182 CrossRef CAS.
- X. Hou, T. Wan, D. Gao, X. Zhang, C. Jia, C. Du, R. Chai, Q. Pang, S. Yun and Y. Wang, Mater. Today Chem., 2024, 39, 102170 CrossRef CAS.
- P. Xiong, B. Huang, D. Peng, B. Viana, M. Peng and Z. Ma, Adv. Funct. Mater., 2021, 31, 2010685 CrossRef CAS.
- L. Sun, B. Wang, G. Xing, C. Liang, W. Ma and S. Yang, Chem. Eng. J., 2023, 455, 140752 CrossRef CAS.
- Z. Wang, Z. Song, L. Ning, Z. Xia and Q. Liu, Inorg. Chem., 2019, 58, 8694–8701 CrossRef CAS PubMed.
- Z. Yi, P. Liu, X. Liu and Y. Xu, Inorg. Chem., 2023, 62, 19542–19551 CrossRef CAS PubMed.
- F. Mouhat and F. X. Coudert, Phys. Rev. B: Condens. Matter Mater. Phys., 2014, 90, 224104 CrossRef.
- R. Hill, Proc. Phys. Soc., London, Sect. A, 1952, 65, 349 CrossRef.
- S. F. Pugh, Philos. Mag., 1954, 45, 823–843 CAS.
- J. J. Lewandowski, W. H. Wang and A. L. Greer, Philos. Mag. Lett., 2005, 85, 77–87 CrossRef CAS.
- W. Hu, Y. Liu, D. Li, X. Zeng and C. Xu, Comput. Mater. Sci., 2014, 83, 27–34 CrossRef CAS.
- S. I. Ranganathan and M. Ostoja-Starzewski, Phys. Rev. Lett., 2008, 101, 055504 CrossRef PubMed.
- J. C. Zhang, Y. Z. Long, X. Yan, X. Wang and F. Wang, Chem. Mater., 2016, 28, 4052–4057 CrossRef CAS.
- S. M. Jeong, S. Song, S. K. Lee and N. Y. Ha, Adv. Mater., 2013, 25, 6194–6200 CrossRef CAS.
- P. Zhang, W. Xie, Z. Wang, Z. Lin, X. Huang, Z. Ju and W. Liu, Inorg. Chem. Front., 2022, 9, 4022–4029 RSC.
- S. Zhang, F. Zhao, S. Liu, Z. Song and Q. Liu, J. Rare Earths, 2024 DOI:10.1016/j.jre.2024.02.004.
Footnote |
| † Electronic supplementary information (ESI) available: Table S1 and Fig. S1–S7. See DOI: https://doi.org/10.1039/d4tc04818k |
| This journal is © The Royal Society of Chemistry 2025 |