
 Open Access Article
 This Open Access Article is licensed under a
 Creative Commons Attribution 3.0 Unported Licence
Going hi-res in bulk: flowless multiangle dynamic light scattering for detection on asymmetric flow field flow fractionation†
Lavinia Rita
Doveri‡
 a,
Giorgia
Dal Pan‡
a,
Giovanni
Tomaselli
a,
Tomás
Muñoz Santoro
b,
Piersandro
Pallavicini
a,
Carlos
Ortiz de Solorzano
b and
Yuri Antonio
Diaz Fernandez
*a
a,
Giorgia
Dal Pan‡
a,
Giovanni
Tomaselli
a,
Tomás
Muñoz Santoro
b,
Piersandro
Pallavicini
a,
Carlos
Ortiz de Solorzano
b and
Yuri Antonio
Diaz Fernandez
*a
ainLAB, Department of Chemistry, University of Pavia, Via Taramelli 12, Pavia, 27100, Italy. E-mail: ydf@unipv.it
bProgram in Biomedical Engineering, CIMA Universidad de Navarra, Cancer Center Clínica Universidad de Navarra (CCUN), Pamplona, Spain
First published on 7th May 2025
Abstract
Nanomedicine is an emerging field of research, demanding new analytical methods to respond to stringent regulatory and safety requirements. Particle size and size distributions are critical quality attributes that require accurate and affordable measurements suitable for both R&D activities and routine quality control in production pipelines. Here we propose a new approach combining multidetector asymmetric flow field flow fractionation (MD-AF4) with multiangle dynamic light scattering (MADLS) for determination of particle size on bioinspired colloids and on polymeric particles, without the need for calibration materials. We benchmarked our results against established analytical methods, using a set of model liposome formulations to cover a wide range of particle sizes. The liposomes, prepared by the traditional lipid thin-film extrusion method, were characterized by cryogenic transmission electron microscopy (cryoTEM) and MADLS, showing high monodispersity and long-term stability. These model samples allowed us to evaluate the effect of key variables on the performance of AF4 coupled to in-flow dynamic light scattering, identifying the influence of sample concentration on analytical bias for size determination. We extended the analysis to other types of particles (i.e. polystyrene and polymethyl methacrylate), which are relevant for environmental and drug delivery applications. Our results demonstrate that the analytical bias for in-flow DLS measurements follows a universal law, nearly independent of the chemical nature of the nanoparticles investigated. Subsequently, we combined MADLS and AF4 techniques, exploiting a programmable fraction collection system, enabling the accurate determination of particle size and number concentration in the absence of flow, and providing higher resolution for the size distributions. Our approach could be extended to any kind of colloid suitable for light scattering methods and paves the way for the revisitation of AF4-DLS instrumentation that may become widely available in the future, expanding the set of analytical tools for nanomedicine applications.
Introduction
Bio-inspired colloids are at the forefront of scientific and technological research, covering a wide range of applications from cosmetics and novel foods to vaccines and gene therapy.1,2 In the last few decades, the threat of emerging pandemics and the incidence of chronic diseases associated with the aging population have boosted the development of nanomedicines based on lipid colloids, expected to overcome the critical limitations of traditional pharmaceutics by improving drug delivery and reducing side effects.2–4 Liposome technologies remain at the center of the nanomedicine revolution, with a few commercial products approved for use in humans (e.g. anticancer Doxil®, antifungal Abelcet®, and analgesic Exparel®)4 and others currently undergoing clinical trials.5 However, transition from innovation to regulatory compliance has faced for years a huge barrier in terms of lack of harmonization for accurate, traceable characterization of critical quality attributes of liposomes, including particle size, size distribution, number concentration, internal structure and stability over time. Within the EU, strong investment from public bodies and industry has contributed to successful projects (e.g. ETPN - European Technology Platform in Nanomedicine; MetrINo - Metrology for Innovative Nanotherapeutics) that are fostering a step-change in the field. However, the need for new analytical tools to better characterize liposomes and for reliable strategies to benchmark these new methods against established techniques is growing faster than the capacity of the scientific community to address the challenge.Among the properties of liposomes under the radar, particle size is key to determining biodistribution and efficacy of liposome based nanomedicines.6–8 For this reason, considerable effort has been devoted to standardizing protocols for the determination of particle size using complementary analytical techniques.6,9–11 The term “size” must be sharply defined in this context, considering the actual measurand that each analytical technique can provide to avoid misleading interpretations. The two major particle size attributes for spherical liposomes are the diameter delimiting the volume of the vesicle and the hydrodynamic size that also considers the effective length of chemical moieties, anchored or absorbed on the external surface.
Cryogenic transmission electron microscopy (cryoTEM) can be considered the golden standard to investigate the structure and morphology of liposomes.2,3,12 This technique also provides direct information on particle size by measuring the diameter delimiting the vesicle volume; however reconstructing size distributions using cryoTEM data may not be straightforward. Correct sample preparation and data acquisition protocols are critical to ensuring the quality of information recorded by cryoTEM8,13,14 and different analytical biases may interfere with the determination of liposome size distributions by this technique.15 Additionally, cryoTEM is costly and relatively time-consuming, and for these reasons, it is not the first choice for routine analysis of liposomes. cryoTEM, however, has the clear advantage of producing visual images of the objects under study, providing a straightforward scientific language, very effective for communicating with policy makers and the general public.
At the other end, dynamic light scattering (DLS) and its more advanced version, multiangle dynamic light scattering (MADLS), are way faster and inexpensive, requiring minimal sample preparation and providing direct information on the hydrodynamic size of liposomes in a wide range of particle sizes.8,16 In recent years, off-the-shelf commercial DLS (and MADLS) instruments have become reliable and easy to use, contributing to the spreading of this technique in industrial settings, while enabling high-throughput quality control of production pipelines. Although the sample preparation is relatively simple, the choice of the appropriate concentration range is critical for the quality of DLS measurements and optimal conditions may vary depending on the instrument, the type of sample and the size range to be analyzed. Moreover, the principles of DLS rely on prior knowledge of the sample viscosity, limiting the applicability for unknown or rather complex matrices. In terms of resolution, MADLS provides better defined size distributions compared to single angle DLS, but it works better with monodispersed samples or multimodal samples composed of monodispersed subpopulations.17 Both techniques rely on average measurements over the bulk solution and struggle to provide reliable size descriptors for highly poly-dispersed samples.15
To overcome the limitations of DLS, it can be coupled to size-separation techniques, such as asymmetric flow field flow fractionation (AF4).6,9,18,19 AF4 is able to minimize matrix effects by exchanging the original dispersion media for an eluent phase of known composition while fractionating colloidal samples in subpopulations of particles with narrower size distributions that will elute at different retention times. AF4 coupled to UV-visible absorption or refractive index detectors requires calibration materials and/or theoretical assumptions to transform retention times into particle size values,20,21 but the combination of AF4 with DLS brings the best of both techniques: while AF4 separates the particles from the original matrix and generates fractograms of monodispersed subpopulations eluting at different retention times, DLS can directly measure particle size on these monodisperse subpopulation within a matrix of known viscosity and without the need for calibration. Despite these advantages, DLS detectors are underrepresented in AF4 scientific literature. Pioneering work from Sitar et al.22 suggested that in-flow DLS measurements can significantly underestimate the particle size, while Giorgi F. et al. showed the opposite effect.23 In both cases, the flow rate at the detector was indicated as a critical factor for analytical bias, but little is known regarding other factors that may affect or improve the performance of AF4-DLS measurements.
In this work, we propose a new approach to overcome the challenges of liposome characterization with AF4-DLS exploiting a programmable fraction collection system intercalated between the multidetector AF4-UV-DLS apparatus and an additional batch MADLS detector. This strategy allowed us to perform MADLS measurements in the absence of flow on the highly monodisperse fractions produced by AF4, improving the resolution of particle size distributions without compromising the accuracy of size determination. This approach has been benchmarked against conventional DLS and cryoTEM, exploiting a set of model monodispersed liposomes prepared in different size ranges. We hope that these promising results may encourage the scientific community and instrument manufacturers to revisit AF4-DLS instrumentation as a powerful, yet somehow underestimated tool to face emerging challenges on the characterization of nanomedicines and complex biological colloids.
Results and discussion
Structural characterization of model liposome systems
The strategy proposed here for the comparative study of dynamic light scattering coupled to asymmetric flow field flow fractionation (AF4-DLS) against established analytical techniques such as cryoTEM or conventional DLS requires model samples with high stability and defined properties in terms of particle size distribution, particle number concentration and polydispersity index. For this work, we prepared four types of liposomes exploiting the well-established thin film extrusion process24 as shown in Fig. 1. Each liposome family was produced from the same starting lipidic composition (50% DSPC, 38% cholesterol, and 5% PEG2000-DMG) adapted from the formulation of FDA approved Doxil®.25 These lipids are also included in the composition of the FDA approved lipid nanoparticles for mRNA and siRNA delivery.25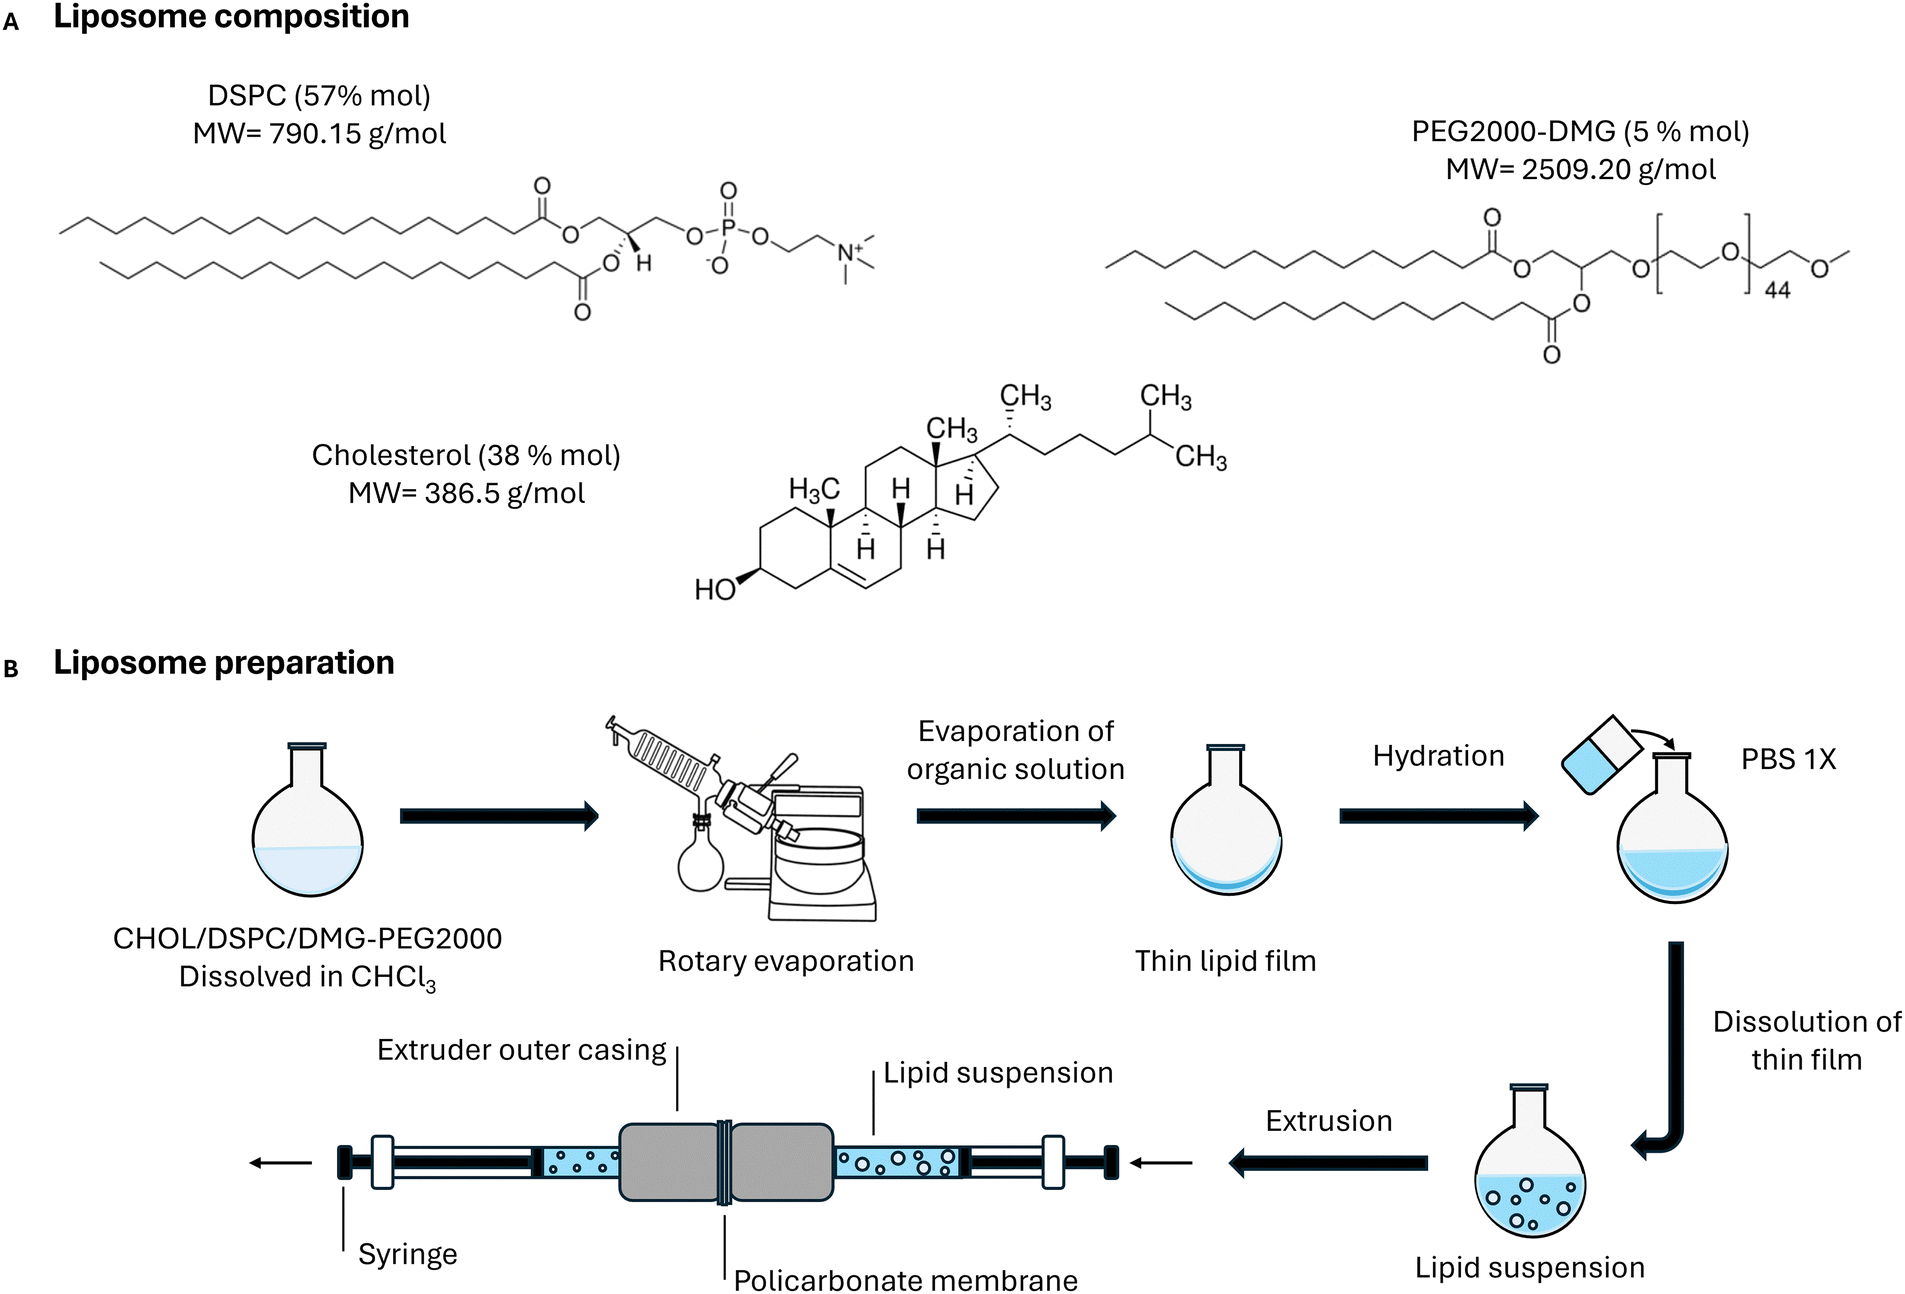 | ||
| Fig. 1 Lipid thin film extrusion process used to prepare the model liposomes. | ||
The lipid films were dispersed in PBS to form large vesicles and then extruded through different polycarbonate membranes with nominal pore sizes of 50 nm, 100 nm, 200 nm, and 400 nm, leading to the liposome types LP50, LP100, LP200, and LP400, respectively. The solutions obtained were initially characterized by multiangle dynamic light scattering (MADLS), displaying relatively narrow size distributions (Fig. 2A–D) and polydispersity indexes between 0.05 and 0.15 (Table 1), except for LP400 that resulted in a bi-modal size distribution, however displaying an acceptable polydispersity index below 0.2.
 | ||
Fig. 2 Size and structural characterization of the liposomes LP50, LP100, LP200 and LP400 (top to bottom horizontal rows). (A–D) Comparison of the size distributions in numbers obtained for each liposome type by multiangle dynamic light scattering (MADLS) and dynamic light scattering at the backscattering angle (backDLS). (E–H) cryoTEM size distribution (gray bars) compared to backDLS size distribution in numbers. The dark gray bars indicate the non-normalized size distribution of the sub-population of multilamellar liposomes determined by cryoTEM. (I–N) Representative cryoTEM images at magnification 28![[thin space (1/6-em)]](https://www.rsc.org/images/entities/char_2009.gif) 000× for the four liposome types investigated. 000× for the four liposome types investigated. | ||
| LP50 | LP100 | LP200 | LP400 | |
|---|---|---|---|---|
| All DLS sizes are expressed as Z-average diameter. PDI: polydispersity index at backDLS. Multilamellarity% was determined by cryoTEM.a Data for 0.3 mg mL−1 of liposomes, average of three measurements.b Average of LP50 n = 760; LP100 n = 457; LP200 n = 233; LP400 n = 217. | ||||
| Nominal size (nm) | 50 | 100 | 200 | 400 |
| CryoTEM size (nm)b | 98 ± 33 | 142 ± 44 | 168 ± 89 | 281 ± 143 |
| MADLS Size (nm)a | 121 ± 2 | 159 ± 3 | 203 ± 1 | 298 ± 102 |
| backDLS size (nm)a | 119 ± 3 | 153 ± 1 | 202 ± 4 | 312 ± 5 |
| PDIa | 0.04 ± 0.03 | 0.05 ± 0.01 | 0.13 ± 0.03 | 0.19 ± 0.01 |
| Particle concentrationa (×1010 particles per mL) | 5.94 ± 0.09 | 2.1 ± 0.5 | 0.5 ± 0.2 | 0.20 ± 0.08 |
| Z-Potentiala (mV) | −2.4 ± 0.6 | −2.1 ± 0.6 | −3.9 ± 0.7 | −2.0 ± 0.5 |
| Multilamellarity %b | 13 | 14 | 11 | 17 |
All particle size values, obtained by MADLS, differed significantly from the nominal sizes of the membrane pores, but followed an increasing trend from LP50, LP100, LP200, to LP400. We observed a good superposition of the MADLS size distributions and the size distributions determined at the back-scattering angle (i.e. 173°) for LP50 and LP100, while LP200 and LP400 showed differences depending on the acquisition configuration. This observation is particularly relevant in the context of our work because the DLS detector coupled online to our AF4 system operates in a back-scattering mode. We will discuss this fact further in the coming paragraphs. Exploiting DLS measurements in electrophoretic mode, we also determined the ζ potential for each liposome type, obtaining values close to zero (Table 1). Despite this, the particle size of the colloids was stable over several weeks, showing no tendency to aggregation or ripening, due to the steric stabilization of the poly-ethylene-glycol moieties of PEG2000-DMG molecules (stability data are presented in the ESI,† SI1). Particle number concentration was also stable over weeks, displaying values that ranged from 1 × 10⁹ NP mL−1 to 2 × 10¹⁰ NP mL−1 at a total lipid concentration of 0.1 mg mL−1. Comparing different liposome batches, prepared over 9 months and by different users, we confirmed that the thin film extrusion protocol was reproducible at the intermediate precision level for all liposome types investigated (ESI,† SI2). Particle size showed batch to batch variabilities below 12% for all liposomal formulations, while particle number concentration showed RDS < 10% for LP200 and LP400, and RDS < 40% for LP100 and LP50.
The size and morphology of the liposomal formulations were also investigated by cryogenic transmission electron microscopy (cryoTEM). This technique is the golden standard for structural characterization of liposomes, provided that reliable sample preparation methods are used.2,3,13,14 In our case, we adapted a cryogenic vitrification protocol based on grid-blotting and immediate plunge-freezing in liquid ethane (for details refer to the Experimental section). This sample preparation method ensured accurate preservation of the liposome morphology and direct imaging of the size and structure of liposomes at a single particle level. CryoTEM images were analyzed using a supervised segmentation algorithm based on segment anything models.26 This method provides a semi-automatically accurate segmentation of liposome contours, enabling robust and fast feature extraction for further analysis (see SI3 for further details, ESI†). The data obtained at the single liposome level allowed us to reconstruct the size distribution of the entire population (Fig. 2E–H) and to determine the average particle size (Table 1). By comparing the average size obtained by MADLS and by cryoTEM, we observed a systematic bias: the values obtained from MADLS exceeded cryoTEM values by around 17 nm for LP400, 17 nm for LP100, 23 nm for LP50 and 35 nm for LP200.
This discrepancy can be explained by taking into account different factors.15 MADLS analysis determines the hydrodynamic size, that may differ from the actual size of the particles observed at cryoTEM due to the presence of the solvation layer, including the polyethylene glycol shell. In the case of our liposomes, containing 5% of PEG moieties, we can hypothesize a “mushroom-like” conformation for the PEG moieties16 and estimate an increase in the hydrodynamic particle diameter of about 7 nm that cannot explain the large discrepancy observed between MADLS and cryoTEM size determinations for some liposome formulations. Another possible source of bias is the use of the Z-average (e.g. the harmonic intensity-weighted average size) for describing the liposome population by MADLS, which may differ from the arithmetic average directly obtained by cryoTEM, yet this bias is expected to be negligible for relatively monodisperse samples of spherical particles like the liposomes investigated here.15 Systematic errors can also arise during MADLS measurements, due to changes in refractive index as a function of particle size.
The analysis of cryoTEM images allowed us to identify a fraction of liposomes with lamellarity higher than one, which represented 13%, 14%, 11% and 17% of the entire liposome population for LP50, LP100, LP200 and LP400, respectively (Table 1). The fact that around 10–20% of the liposomes are multi-lamellar vesicles, with higher lipidic content compared to a simple liposome of the same size, has implications for the determination of particle size distribution and average size. Multilamellar liposomes display different refractive index and scattering profiles, compared to single-lamella liposomes, and they may interfere with the interpretation of bulk measurements such as MADLS (or single angle DLS) that rely on average values over the entire population. Furthermore, since multilamellar liposomes must be large enough to contain smaller vesicles, the sub-population of multilamellar vesicles may be shifted towards the large edge of the size distribution (Fig. 2E–H), increasing the apparent particle size measured by MADLS due to the higher scattering cross-sections for the “filled” vesicles compared to monolamellar liposomes. This effect can also increase the apparent number of particles at the high end of the size distribution. The biases seem particularly evident for LP400 samples, that displayed the highest fraction of multilamellar liposomes and showed also an apparently bimodal size distribution at MADLS, in contrast with the monodispersed size distribution observed at cryoTEM (Fig. 2). We estimated the multi-lamellarity contribution to DLS size distribution by simulating an increase in the statistical weight of multi-lamellar liposomes, obtaining estimated biases of 1 nm, 4 nm, 7 nm, 18 nm for LP50, LP100, LP200 and LP400, respectively. These values alone cannot account for the differences observed between particle size determined by cryoTEM and light scattering data, except for L400 that showed a good correspondence with the predicted value.
Despite the differences observed, when we performed a statistical Z-test to check if the size distributions obtained by cryoTEM, MADLS and backDLS were significantly different, we obtained Z values below the critical threshold (see SI3, ESI†), concluding that the distributions were statistically comparable. This result suggests a good benchmark among the three methods, but precludes quantitative discussions regarding differences between the different techniques. Nevertheless, qualitatively, DLS data acquired in a back-scattering configuration (i.e. 173°) seemed to correlate better with cryoTEM size distributions for all the liposome formulations investigated here (Fig. 2). Based on this evidence, we inferred that back-scattering DLS is less sensitive to fluctuations of lamellarity and refractive index across the liposome population, becoming a reliable tool to predict particle size in complex systems. This finding is particularly favorable for the scope of our work, considering that our AF4-DLS detectors operate precisely in a back-scattering mode. For this reason, in the following sections, we will report DLS data at 173° (i.e. back-scattering angle), unless otherwise specified.
Finally, another source of error in the determination of particle size could emerge from the inhomogeneous thickness of the vitrified ice layer within the cryoTEM samples obtained by blotting. This artifact may selectively exclude larger particles from the field of view, inducing a bias towards smaller sizes on cryoTEM analysis. In our experiments, this effect was mitigated by semi-randomized image acquisition on remote grid locations, and its contribution to the bias on size determination is expected to be relatively low.
Our data, at the current state, cannot elucidate whether all the factors discussed above or only some of them are synergistically contributing to the experimental bias observed in the determination of particle average size and size distribution by complementary analytical techniques. However, the good kinetic stability, relatively high monodispersity and specific size range of these liposome formulations enable their use as model systems to investigate fractionation and biases in the determination of particle size by asymmetric flow field flow fractionation coupled to dynamic light scattering (AF4-DLS), discussed in the following sections.
Evaluating the performance of AF4 separation methods
Exploiting the monodispersed liposomal formulations, prepared at four distinct particle diameters, we initially undertook a thorough investigation of different conditions that may affect the performance of a DLS detector for online determination of particle size in-flow during AF4 separation. Sitar et al. have shown before that high detector flow rates can introduce considerable bias in particle sizing by DLS.22 Based on these pioneering findings, we decided to expand the set of variables, by considering also the initial particle size and the particle number concentration, which are two parameters that could also affect the transient light scattering signal at the DLS detector. Additionally, we also explored for this work two different kinds of AF4 fractionation programs, namely an isocratic method adapted from ASTM E3409-24,27 and a smooth power-decay cross-flow program optimized ad hoc (representative data used for the optimization of the methods are presented in SI4, ESI†).Constant cross-flow AF4 has been historically preferred by users18,28,29 and it is currently at the international standardization level.27 It provides advantages in terms of relatively simple mathematical models capable of describing AF4 elution profiles under isocratic conditions. In the last few years, significant progress has been also made in the theory of programmed cross-flow AF4,9 and these methods are slowly gaining interest for their high versatility and faster analytical throughput, compared to equivalent constant cross-flow methods. In fact, differences in the crossflow profiles have a direct impact on the duration of the separation, the spread of the elution peaks, and the transient intensity signals at the detectors.
In Fig. 3 (and in ESI,† SI5) we present representative AF4 fractograms for the four model liposome systems investigated here, analyzed using two different separation programs and two on-line detectors, recording the UV-vis and the back-scattered DLS signals in tandem.
 | ||
| Fig. 3 Representative fractograms obtained by asymmetric flow field flow fractionation (AF4) for LP100 (A and C) and LP400 (B and D) using the power-decay crossflow method (first row) and the constant crossflow program (second row). Each plot shows the UV-vis signal as a continuous line and the transient DLS Z-average diameter measured at 173° as a scatter plot. Yellow time zones represent the AF4 focusing and blue time zones indicate elution at zero crossflow. Data for LP50 and LP200 are presented in SI5 (ESI†). | ||
The combination of the two online detectors allows the simultaneous determination of the analytical recovery and relative retention time by using the UV-vis signals, while particle size can be directly determined by the DLS response. For every combination of particle nominal size and separation program we observed a single peak at the UV-vis detector, typical of monodispersed nanoparticle populations. It is important to note the presence of a void peak, corresponding to the time at which the AF4 separation step initiates. The void peak was generally sharper and more evident for the power-decay crossflow method and allowed for the determination of the retention ratios for each sample type and AF4 method used.30
The key fractogram descriptors were reproducible across technical replicates (Table S5b, ESI†). Retention time showed RSD < 2% for power-decay crossflow, and slightly higher, yet acceptable values of RSD from 2% to 7% under constant crossflow. The full widths of the AF4 peaks were also stable among replicates, displaying RSD < 6% for all the combinations of sample types and separation methods. Similarly, the DLS particle size at the peak maximum was also reproducible, showing RSD < 4% across replicates. These results demonstrate that both separation methods are robust and reproducible, with a relatively low instrumental variability, which is a prerequisite to investigate the effect of key variables on the accuracy of size determination by AF4-DLS, discussed in the following sections.
Comparing fractograms obtained using the two AF4 methods, we qualitatively observed similar shapes for each liposome type, despite some quantitative differences (Table S5, ESI†). Under constant crossflow, fractogram UV-vis peaks were broader, spanning through a DLS size trace longer in time, suggesting a stronger separation power.31 Conversely, recovery values were systematically lower for the constant crossflow method, compared to the equivalent power-decay crossflow program, indicating a tradeoff between separation power and analytical recovery. Typical recovery values for the power-decay crossflow method lay around 95% for LP400, LP200 and LP100, dropping to around 88% for LP50. Under constant crossflow, we observed recovery values around 90% for bigger liposomes, reaching 79% for LP50. In all cases, analytical recoveries remained above the acceptance threshold of 70%,27 while retention ratios were below 0.2,27,30 demonstrating that both methods can efficiently separate sub-populations of liposomes even from the narrow size distributions of our model quasi-monodispersed formulations. The separation capacity of the two AF4 methods became evident in the DLS plots displayed in Fig. 3 (and SI5, ESI†), showing a smooth and steady increase of the Z average size as a function of time, alongside the signal of the UV-vis detector that represents the mass flow of lipids in the system.
Interestingly, we observed systematic differences in the determination of the DLS size depending on the AF4 method used, showing lower Z average values at the peak maximum for the power-decay crossflow method, compared to the constant crossflow method. The difference in size, determined by the two methods, ranged from 8% for LP50 to 16% for LP400. This result was unexpected, considering that for both methods we used the same detector flow rate (0.5 mL min−1). The flow at the detector has been identified by others22 as a major source of bias on the determination of particle size by AF4-DLS; however, our results suggest that in this case, with the same detector flow, two different elution methods can also provide values that differ more or less from the size determined by flowless techniques such as cryoTEM or batch MADLS. In the following section we further explore these findings by investigating fractions obtained after AF4 separation using batch MADLS, a technique that is intrinsically free from the bias introduced by flow effects.
Comparing off-line MADLS with in-flow DLS data
After demonstrating that the two AF4 methods can reliably fractionate liposomes in a wide range of nominal sizes, we exploited these methods to collect size fractions from our model liposome formulations, using a programmable fraction collection system at the end of the first detector pipeline. We set the fraction collector to produce individual fractions of 1 mL, which was the minimum recommended volume for direct analysis using MADLS. We subsequently reanalyzed the collected fractions using an additional MADLS detector, avoiding further dilution, due to the fact that the original sample injected in the AF4 system was already diluted at least three orders of magnitude within the AF4 channel during fractionation.MADLS analysis on the collected fractions allowed us to determine particle size, size distribution and particle number concentration. In Fig. 4 (and SI6, ESI†) we overlapped the transient DLS signals at the AF4 system with the size and scattering intensity of the corresponding fractions, measured in the absence of flow. We repeat these measurements for the four liposome types and the two separation methods investigated here. It is important to note that the time scales for each detector and for the fraction collector system were calibrated and corrected for the experimental delay due to connecting tubing, allowing for direct comparison of sequential detection on the same fraction of the sample. The backscattered intensity profiles in flow and on the collected fractions nicely overlapped and the maximum of each transient AF4-DLS signal matched the maximum intensity fraction, measured off-line by MADLS (Fig. 4A and B for LP100 and SI6 for all the other liposomes, ESI†). This result suggests that on-line DLS intensities are not intrinsically affected by the detector flow.
 | ||
| Fig. 4 Comparison of transient AF4-DLS and batch DLS data on the fractions for LP100 using the power decay crossflow method (first column) and constant crossflow method (second column). (A and B) DLS count rate as a function of time. (C and D) DLS Z-average diameter as a function of time. (E and F) Comparison of the transient AF4 size distributions in flow, the size distributions obtained from the collected fractions, and the original size distribution before fractionation. Data for LP50, LP200, and LP400 are presented in SI6 (ESI†). | ||
Conversely, several points of the transient DLS size plots (Fig. 4C and D and SI6, ESI†) deviated systematically from the size values measured on the respective fractions, particularly for those fractions collected at the center of the fractogram. As a consequence, the size at the intensity maxima measured in flow differed from the size determined on the individual fractions collected at the same retention time.
Combining intensity and size data from the individual fractions, we plotted the apparent intensity-weighted size distributions and compared them with the original size distribution before fractionation (Fig. 4E and F and SI6, ESI†). The Z-average size calculated by combining the data from different fractions of the same sample was similar to the size measured on the original sample before fractionation (Table 2). This result demonstrates that, under our experimental conditions, fractionation is not significantly affecting the composition of the particle size distributions and therefore the bias observed in the determination of size under flow cannot be ascribed to differential recovery at different size ranges.
| LP50 | LP100 | LP200 | LP400 | |||||
|---|---|---|---|---|---|---|---|---|
| PXF | CXF | PXF | CXF | PXF | CXF | PXF | CXF | |
| Batch backDLS size (nm) | 132.3 ± 0.8 | 170 ± 2 | 210 ± 3 | 312 ± 5 | ||||
| Fractions backDLS size (nm) | 133.1 ± 0.6 | 131.7 ± 0.4 | 170 ± 1 | 169 ± 1 | 210 ± 3 | 206.8 ± 0.3 | 301.1 ± 0.2 | 301 ± 2 |
| Flow Z-Average (nm) | 111 ± 1 | 116 ± 1 | 143 ± 2 | 151 ± 1 | 193 ± 3 | 192 ± 2 | 273 ± 1 | 286 ± 6 |
The size distributions recalculated from the fractions are narrower than the initial original size distributions. To explain this finding, we need to consider that although the liposomes investigated here are relatively monodispersed, they are actually a distribution of particles with slightly different sizes. DLS measurements on the entire population average across all particles, increasing the apparent dispersion of the size measured by DLS. After fractionation, the size distribution within each fraction becomes intrinsically narrower than the original population, leading to more reliable DLS data acquisition. Therefore, we can conclude that DLS measurements on the collected fractions may provide a more accurate description of the size distribution of the original population.
Interestingly, when we used the AF4-DLS intensity and size data in-flow to reconstruct the transient intensity-weighted size distribution of the population, we observed a different scenario (Fig. 4E and F and SI6, ESI†). Transient size distributions in-flow systematically shifted to smaller values of particle size compared to the original size distributions, leading to lower Z-average values (Table 2).
Qualitatively, the shape of the transient size distribution peaks also changed, leading to less symmetric profiles and suggesting that the differences observed were not a simple offset due to calibration but a dynamic response of the DLS detector under flow.
The drift of the transient particle size distribution was dependent on the concentration of the sample injected in the AF4 system: for higher concentrations, the transient size distribution shifted to lower values of particle size (Fig. 5). Our experiments covered a range of total lipid concentrations from 6 mg mL−1 to 0.5 mg mL−1, and the bias for the determination of the particle size using in-flow DLS reached up to 20% of the DLS size measured in batch (Table 3). Moreover, this effect was not attenuated by reducing the detector flow. We performed a series of experiments at a low detector flowrate of 0.2 mL min−1 (reported in SI7, ESI†), and we still observed a concentration dependent behavior for the transient size distributions. Z-Average size values at flow 0.2 mL min−1 were comparable to the values obtained at 0.5 mL min−1, suggesting that, under our experimental conditions, the detector flowrate alone cannot explain the bias on the determination of size by in-flow AF4-DLS.
 | ||
| Fig. 5 Effect of injected sample concentration on the transient AF4-DLS size distributions in flow obtained by the power-decay crossflow method for each liposome type: (A) LP50, (B) LP100, (C) LP200, (D) LP400. | ||
| Back DLS size (nm) | Injected sample concentration (mg mL−1) | Flow Z-Average (nm) | % Bias | |
|---|---|---|---|---|
| LP50 | 118.9 ± 0.4 | 6.0 | 94 | −20.9 |
| 3.0 | 102 | −14.2 | ||
| 1.0 | 111 | −6.6 | ||
| 0.5 | 115 | −3.3 | ||
| LP100 | 152.7 ± 0.9 | 6.0 | 124 | −18.8 |
| 3.0 | 134 | −12.2 | ||
| 1.0 | 145 | −5.0 | ||
| 0.5 | 147 | −3.7 | ||
| LP200 | 208 ± 2 | 6.0 | 181 | −13.0 |
| 3.0 | 191 | −8.2 | ||
| 1.0 | 198 | −4.8 | ||
| 0.5 | 199 | −4.3 | ||
| LP400 | 358 ± 8 | 6.0 | 298 | −16.8 |
| 3.0 | 317 | −11.5 | ||
| 1.0 | 331 | −7.5 | ||
| 0.5 | 351 | −2.0 |
These findings indicate that the choice of sample concentration is critical for the accurate determination of particle size by AF4-DLS, while detector flow may play a secondary role. Finding the optimal sample concentration range is a routine praxis for conventional DLS measurements, therefore it is not surprising that using DLS as an online detector for AF4 would require the same attention on the choice of the right range of sample concentrations. This concentration range may vary from sample type to sample type, among different instruments, and for different AF4 methods. One may expect that by using a DLS detector coupled to an AF4 system, the concentration of the particles will correlate with the transient scattered intensity at the DLS detector, which is a critical parameter for the quality of DLS data acquisition.
Interestingly, we observed a strong negative correlation between the bias in size measured by flow DLS and the transient count rate at the DLS detector for a series of AF4 fractions (Fig. 6A). Correlation coefficients ranging from −0.83 and −0.97 were observed for all the liposome types analyzed by the power crossflow AF4 method (Table 4). A relatively lower, yet significantly negative correlation, was also observed for the constant crossflow AF4 program, with correlation coefficients ranging from −0.36 to −0.91. Similarly, we observe also a negative correlation between the analytical bias on size determination and the key parameters of batch DLS measurements on the collected fractions, namely the count rate (Fig. 6B) and the particle number concentration for the individual fraction (SI8, ESI†).
 | ||
| Fig. 6 Correlograms of the relative bias (%Bias) on the determination of particle size by AF4-DLS in-flow and key DLS parameters for all the liposome fractions analyzed: (A) %Bias vs DLS count rate measured in-flow, (B) %Bias vs. count rate of the fractions measured without flow. Each combination of sample type and AF4 method is plotted on a different color. The solid line is an empirical non-linear fitting. The correlation between %Bias and particle number concentration and correlograms for individual sets of fractions are presented in SI8 (ESI†). | ||
| Correlation coefficients | ||||||
|---|---|---|---|---|---|---|
| Power crossflow method | Constant crossflow method | |||||
| Flow counts | Fractions counts | NP Conc. | Flow counts | Fractions counts | NP Conc. | |
| LP50 | −0.910 | −0.913 | −0.667 | −0.900 | −0.861 | −0.897 |
| LP100 | −0.974 | −0.932 | −0.908 | −0.904 | −0.903 | −0.903 |
| LP200 | −0.830 | −0.779 | −0.862 | −0.366 | −0.279 | −0.520 |
| LP400 | −0.841 | −0.733 | −0.641 | −0.454 | −0.506 | −0.386 |
The negative correlation observed between the bias on the in-flow AF4-DLS size and the transient scattered intensity is consistent with the deviation observed between the Z-average in-flow and the DLS size on the relative fractions (Fig. 4C and D), discussed above. We noted that the points at the center of the fractogram, showing higher scattered intensity, displayed larger deviation with respect to the measurements performed in batch on the relative fractions. The fractions in the center of the fractogram are also at the center of the size distribution, and underestimation of their size will have a big impact on the calculation of Z-average values under flow. However, the biases experienced under the flow DLS can be overcome by using flowless batch MADLS measurements of the different fractions obtained after AF4 separation.
Extending the applicability of the method to other polymeric particles
The results obtained for liposomes, discussed in the previous sections, could have a direct impact on the field of nanomedicine. The chemical composition of the liposome formulations used here is based on systems already approved for use as nanovectors,1,3 yet the reach of our findings could be wider. To demonstrate this, we investigated two additional classes of polymeric nanoparticles, the first class made of polystyrene (PS) and the second class composed of polymethylmethacrylate (PMMA). These materials are particularly relevant from the environmental perspective due to the increasing threat of nanoplastic pollution32 and have been also exploited for drug delivery systems.33–35 The particles used for this part of the work were spherical, displayed colloidal stability and narrow size distributions, as demonstrated by PDI values below 0.1 and negative Z potentials, determined by MADLS analysis (full characterization data are presented in SI9, ESI†). We successfully performed MD-AF4 experiments on these two types of particles, applying the same power-decay fractionation method used for the liposomes, and adjusting the mobile phase to account for the different chemical nature of the new particles (details described in the Experimental section).The synthetic polymeric particles were perfectly monodispersed and their size traces in the AF4 fractograms were relatively flat (see representative data in SI10, ESI†), compared to the broader liposome samples (Fig. 3). Using the MD-AF4 data, we were able to re-calculate the Z-average of the population measured in-flow for various particle concentrations, associated with different DLS count rates. We compared the in-flow data with particle size determined by batch DLS measurements in the absence of flow to estimate the analytical bias as a function of count rate (ESI,† SI11). We observed, for the polymeric particles, an increase in the analytical bias for increasing particle concentrations and increasing DLS count rates, in agreement with the results observed for the liposomes. Moreover, when we plotted together the analytical biases as a function of the DLS count rate for the two polymeric particles and for all four liposome formulations (Fig. 7), we obtained a convergent linear trend that encompassed all the data points with a remarkably high linear regression coefficient. This result is outstanding, considering the variety of structures, chemical compositions and particle sizes conveyed in this plot. Therefore, the underlying phenomenon, driving this bias on size determination as a function of the scattering count rate, is nearly independent of the intrinsic properties of the particles and must be explained from the very working principles of the DLS technique.
 | ||
| Fig. 7 Correlogram of the relative bias (%Bias) on the determination of average particle size by AF4-DLS in-flow as a function of batch DLS count rate. The different particle types are represented by different colors and the best linear regression equation for all data points is reported. | ||
DLS relies on the determination of the time-dependent intensity autocorrelation function in a dynamic regime dominated by the Brownian motion of the particles and by the presence of single scattering events across the population of particles probed. It is reasonable to assume that at higher particle concentrations the likelihood for a photon to encounter multiple scatters before reaching the detector will be increased, leading to an artificially faster decay of the autocorrelation function and to an effective reduction of the measured particle size.36 Under these conditions, the analytical bias for the determination of particle size can be approximated by the expression:
 | (1) |
Experimental
Materials
1,2-Dioctadecanoyl-sn-glycero-3-phosphocholine 18:0 (DSPC) and 1,2-dimyristoyl-rac-glycero-3-methoxypolyethylene glycol-2000 (DMG-PEG2000) were purchased from Avanti Research. Cholesterol, phosphate saline buffer tablets, sodium chloride (NaCl) and chloroform were obtained from Merck Life Science s.r.l. (Milan, Italy). Polystyrene nanobeads (PS) were supplied by Alfatest (Roma Italy) and poly methylmetacrilate nanoparticles (PMMA) were acquired from PolyAn GmbH (Berlin Germany). Extruder device Liposofast basic and polycarbonate membranes of 19 mm diameter with pore sizes: 50 nm, 100 nm, 200 nm and 400 nm were purchased from Avestin Europe GmbH (Mannehim, Germany). Phosphate buffered saline (PBS) 0.1 used as a dispersant and mobile phase in the experiments was prepared by dissolving 2 tablets in 400 mL of MilliQ water (Millipore system by Merck). Before use, the PBS 0.1 M phase was filtered through 0.2 μm cellulose acetate membrane filters obtained from Carlo Erba Reagents s.r.l (Milan, IT). Regenerated cellulose (RC) channel membranes, Novachem, and other channel components were purchased from Alfatest s.r.l. (Rome, Italy).
Liposome preparation
The liposomal formulation was composed of phosphatidylcholine (DSPC), cholesterol (chol), and PEG-lipid (DMG-PEG2000) at 56:38:5 lipid molar ratio, which is the equivalent lipid molar ratio of the Doxil® approved liposomes.25 Liposomes were prepared by thin film hydration followed by extrusion as reported by Olson et al.24 with some modifications. In detail, lipids were dissolved in chloroform in a round bottom flask and the organic solvent was removed using a rotary evaporator. The homogeneous dried thin film formed was then hydrated with PBS buffer 0.01 M and vigorously shaken in a vortex mixer until complete dissolution. Usually the lipid concentration was adjusted to a concentration range between 3 and 12 mg mL−1 by dilution with PBS 0.01 M. Liposomes were extruded through polycarbonate membranes with different nominal pore sizes (50 nm, 100 nm, 200 nm, 400 nm) eleven times using the Liposofast basic equipment38 and then stored at 4 °C.
Liposome characterization
Multi detector-Asymmetric flow field flow fractionation (MD-AF4)
 | (2) |
| Flow rates (mL min−1) | Sample injection flow | 0.2 | ||
| Focus flow | 0.7 | |||
| Channel flow (during elution) | 0.5 | |||
| Crossflow (initial) | 0.4 | |||
| Power decay | 0.1 | |||
| Time and flow parameters (as a sequence in the method) | Mode (min) | Step duration (min) | Type | XF (mL min−1) |
| (1) system equilibration step | 2 | 0 | ||
| (2) focus + injection | 10 | — | ||
| (3) Elution | 5 | constant | 0.4 | |
| (4) Elution | 40 | Power (exp 0.1) | ||
| (5) Elution | 20 | Constant | 0 | |
| Flow rates (mL min)−1 | Sample injection flow | 0.2 | |
| Focus flow | 2.3 | ||
| Channel flow (during elution) | 0.5 | ||
| Crossflow (during field-on elution) | 0.1 | ||
| Time and flow parameters (as a sequence in the method) | Mode (min) | Step duration (min) | XF (mL min−1) |
| (1) System equilibration step | 2 | 0 | |
| (2) Focus +injection | 8 | — | |
| (3) Elution | 1.5 | 2 | |
| (4) Elution | 45 | 0.1 | |
| (5) Elution | 15 | 0 | |
The second parameter evaluated to assess the efficiency of fractionation was the retention ratio R:30
 | (3) |
As a guidance, liposomes were injected at concentrations of 0.1 mg mL−1 (total lipid) during the experiments without crossflow. Conversely, for the experiments with cross flow, liposome concentrations were from 0.5 mg mL−1 to 6 mg mL−1 with an injection loop of 50 μL.
Optimization of AF4 methods
Fractionation methods have been optimized following the general approach suggested by Gigault et al.30 For the constant crossflow method, we explored the crossflow suggested by ASTM27 0.3 mL min−1 and lower 0.1–0.2 mL min−1, and we chose the optimal 0.1 mL min−1 that allows the highest recovery with our experimental set up. For the power decay crossflow elution program, key parameters were optimised, including (i) crossflow rate (ranging from 0.3 to 0.5 mL min−1), (ii) injection time (3, 7 and 10 min), and (iii) power decay exponent (0.05, 0.1 and 0.2). Details and representative results are described in the ESI.†CryoTEM experiments
Sample vitrification was performed using a Mark IV Vitrobot (Thermo Fisher Scientific). Grids were previously glow-discharged at 30 mA for 30’’ in a GloQube (Quorum Technologies) and then 3 μL of LP solution was applied onto the grids of specific types. In detail, for LP50 at a concentration of 3 mg mL−1 (in PBS 0.01 M solution), we used Quantifoil R1.2/1.3 Cu 300-mesh grid, for LP100 at 1.5 mg mL−1 (in PBS 0.01 M), we used Quantifoil R2/2 Cu 300-mesh grid, for LP200 and LP400 at 6 mg mL−1, we used Quantifoil R2/2 Cu 300-mesh grid. The choice of the grids was based on the size and expected coverage of the liposome solutions, to avoid overcrowding. Immediately after sample application, the grids were blotted for 2” or 10” in a chamber at 4 °C and 100% humidity and then plunge-frozen into liquid ethane. Vitrified grids were transferred to a Talos Arctica (Thermo Fisher Scientific) operated at 200 kV and equipped using a Ceta 16 M detector (Thermo Fisher Scientific). Images were acquired at a nominal magnification of 45000×, corresponding to a pixel size of 2.3 Å per pixel with a defocus of −3.0 μm, and at a magnification of 28000×, corresponding to a pixel size of 3.7 Å per pixel with a defocus of −3.0 μm.
Cryo TEM image processing
Segmentation, classification and quantification of liposomes have been carried out using a semi - automated macro developed for Fiji/ImageJ, an open source Java-based image processing software.40 The macro was developed by the Imaging Platform at the Center for Applied Medical Research (CIMA).The Fiji/ImageJ macro was designed to classify and quantify liposomes by first preprocessing individual 2D cryoelectron microscopy images followed by semi-automated segmentation through manual input using various versions of the segment anything model (SAM).
First, the input image was normalised and scaled, converted to 8-bit format, standardizing pixel intensities, and scaled to accurately quantify liposome size and positioning, ensuring precise measurements during the analysis. Then pre-processed by removing intensity outliers from the image to reduce noise using a threshold-based approach, background subtraction using a rolling ball algorithm and contrast enhancement focusing on relevant structures like liposome membranes. The segmentation task was performed using the EfficientVitSAM10 model provided by SAMJ -IJ.26 The SAMJ-IJ plugin integrates segment anything models (SAMs) into Fiji, facilitating easy image annotation for microscopy images.41 Segmentations were done using different SAM models (EfficientViTSAM variants). As a result, full liposome mask ROIs were created as annotations managed with FIJI's ROI manager. Throughout the segmentation liposomes are classified into single, multilamellar, and inner types. Annotations were exported for future re-training and quantification. The size and spatial locations and the statistical features of the annotated liposomes were then extracted. Each set of liposome annotations is saved separately.
Conclusions
In this work we investigated the conditions that lead to analytical bias in the determination of the size of liposomes and polymeric particles using in-flow AF4-DLS. For this purpose, we prepared four different liposome families, varying particle average size and size distribution, to cover a size range from 50 nm to 500 nm. The liposomes were characterized by MADLS and cryoTEM, showing narrow size distributions and excellent stability over time. The preparation method was validated at an intermediate precision level and the critical quality attributes of the liposomes showed acceptable batch to batch variabilities. Moreover, by comparing cryoTEM, MADLS and backDLS data we found that backDLS measurements are less susceptible to interference related to fluctuations of refractive index across the liposome population due to multilamellarity effects. Using these model liposome systems we also demonstrated that, under our experimental conditions, the entity of the detector flow in AF4-DLS is not playing a significant role, however the transient intensity at the detector, and consequently the concentration of the sample injected in the AF4 is critical. We observed a universal trend between analytical bias and scattering count rate, nearly independent of particle size and chemical composition. The bias of in-flow DLS determination can be overcome by the new approach proposed, combining a programmable sample collection system and batch MADLS measurements at the end of the AF4 detector line. The results from this approach are in good agreement with cryoTEM and conventional DLS measurements on the original samples, suggesting that our strategy could be used for validation of the new analytical method in the future. Although the proposed system is not fully automated, we hope that the interesting findings presented here will shift the interest of the scientific community and of instrument manufacturers to reconsider AF4-MADLS as a promising calibration-free and bias-free tool to face the emerging challenges of the nanomedicine revolution.Abbreviations
| AF4 | Asymmetric flow field flow fractionation |
| cryoTEM | Cryogenic transmission electron microscope |
| CXF | Constant crossflow |
| DLS | Dynamic light scattering |
| FDA | Food and drug administration (USA) |
| LP | Liposomes |
| MALDS | Multi-angle dynamic light scattering |
| PBS | Phosphate buffer saline |
| PDI | Poly dispersity index |
| PMMA | Polymethyl methacrylate nanoparticles |
| PS | Polystyrene nanoparticles |
| PXF | Power decay crossflow |
| R% | Recovery % |
| R | Retention ratio |
Data availability
Data supporting this article have been included as part of the ESI.†Conflicts of interest
There are no conflicts to declare.Acknowledgements
The authors acknowledge support from the Department of Chemistry of the University of Pavia and from the Ministero dell’Università e della Ricerca (MUR) through the program “Dipartimenti di Eccellenza (2023–2027)”. This research was in part granted among the activities of the National Center for Gene Therapy and Drugs Based on RNA Technology, funded in the framework of the National Recovery and Resilience Plan (NRRP), Mission 4 “Education and Research”, Component 2 “From Research to Business”, Investment 1.4 “Strengthening research structures for supporting the creation of National Centres, national R&D leaders on some Key Enabling Technologies”, funded by the European Union - Next Generation EU, Project CN00000041, CUP B93D21010860004, Spoke 9. The authors acknowledge the support from Grant PID2021-122409OB-C22 financed by MICIU/AEI/10.13039/501100011033 and FEDER, UE, A way to make Europe (COdS). Part of this work was carried out at NOLIMITS, an advanced imaging facility established by the Università degli Studi di Milano. The authors particularly thank Diane Marie Valerie Jeanne Bonnet from NOLIMITS for technical support and fruitful discussions. Part of this work was performed at Parco Tecnico Scientifico PTS-Pavia (Italy).Notes and references
- S. Giordani, V. Marassi, A. Zattoni, B. Roda and P. Reschiglian, J. Pharm. Biomed. Anal., 2023, 236, 115751 CrossRef CAS PubMed.
- D. Guimarães, A. Cavaco-Paulo and E. Nogueira, Int. J. Pharm., 2021, 601, 120571 CrossRef PubMed.
- D. Lombardo and M. A. Kiselev, Pharmaceutics, 2022, 14(3), 543 CrossRef CAS PubMed.
- S. Shah, V. Dhawan, R. Holm, M. S. Nagarsenker and Y. Perrie, Adv. Drug Delivery Rev., 2020, 154–155, 102–122 CrossRef CAS PubMed.
- M. Germain, M. E. Meyre, L. Poul, M. Paolini, C. Berjaud, F. Mpambani, M. Bergere, L. Levy and A. Pottier, Sci. Rep., 2018, 8, 1–11 CAS.
- J. Parot, F. Caputo, D. Mehn, V. A. Hackley and L. Calzolai, J. Controlled Release, 2020, 320, 495–510 CrossRef CAS PubMed.
- M. Danaei, M. Dehghankhold, S. Ataei, F. Hasanzadeh Davarani, R. Javanmard, A. Dokhani, S. Khorasani and M. R. Mozafari, Pharmaceutics, 2018, 10, 1–17 CrossRef PubMed.
- S. Peretz Damari, D. Shamrakov, M. Varenik, E. Koren, E. Nativ-Roth, Y. Barenholz and O. Regev, Int. J. Pharm., 2018, 547, 648–655 CrossRef CAS PubMed.
- F. Caputo, D. Mehn, J. D. Clogston, M. Rösslein, A. Prina-Mello, S. E. Borgos, S. Gioria and L. Calzolai, J. Chromatogr. A, 2021, 1635, 461767 CrossRef CAS PubMed.
- A. Zattoni, B. Roda, F. Borghi, V. Marassi and P. Reschiglian, J. Pharm. Biomed. Anal., 2014, 87, 53–61 CrossRef CAS PubMed.
- Y. Fan, M. Marioli and K. Zhang, J. Pharm. Biomed. Anal., 2021, 192, 113642 CrossRef CAS PubMed.
- L. Tonggu and L. Wang, Ultramicroscopy, 2020, 208, 112849 CrossRef CAS PubMed.
- I. ASTM, E3143-18a, 2018, i, 1–8.
- L. E. Franken, E. J. Boekema and M. C. A. Stuart, Adv. Sci., 2017, 4, 1–9 Search PubMed.
- S. K. Filippov, R. Khusnutdinov, A. Murmiliuk, W. Inam, L. Y. Zakharova, H. Zhang and V. V. Khutoryanskiy, Mater. Horiz., 2023, 10, 5354–5370 RSC.
- R. Nordström, L. Zhu, J. Härmark, Y. Levi-Kalisman, E. Koren, Y. Barenholz, G. Levinton and D. Shamrakov, Pharmaceutics, 2021, 13, 1–19 CrossRef PubMed.
- Malvern Panalytical, Improved Component Resolution with Multi-Angle DLS (MADLS), 2019.
- V. Vezočnik, K. Rebolj, S. Sitar, K. Ota, M. Tušek-Žnidarič, J. Štrus, K. Sepčić, D. Pahovnik, P. Maček and E. Žagar, J. Chromatogr. A, 2015, 1418, 185–191 CrossRef PubMed.
- S. Giordani, V. Marassi, A. Placci, A. Zattoni, B. Roda and P. Reschiglian, Molecules, 2023, 28, 6201 CrossRef CAS PubMed.
- K. G. Wahlund, J. Chromatogr. A, 2013, 1287, 97–112 CrossRef CAS PubMed.
- M. Wagner, S. Holzschuh, A. Traeger, A. Fahr and U. S. Schubert, Anal. Chem., 2014, 86, 5201–5210 CrossRef CAS PubMed.
- S. Sitar, V. Vezocňik, P. Macěk, K. Kogej, D. Pahovnik and E. Žagar, Anal. Chem., 2017, 89, 11744–11752 CrossRef CAS PubMed.
- F. Giorgi, D. Coglitore, J. M. Curran, D. Gilliland, P. Macko, M. Whelan, A. Worth and E. A. Patterson, Sci. Rep., 2019, 9, 1–6 CrossRef CAS PubMed.
- F. Olson, C. A. Hunt, F. C. Szoka, W. J. Vail and D. Papahadjopoulos, Biochim. Biophys. Acta, Biomembr., 1979, 557, 9–23 CrossRef CAS PubMed.
- C. Hald Albertsen, J. A. Kulkarni, D. Witzigmann, M. Lind, K. Petersson and J. B. Simonsen, Adv. Drug Delivery Rev., 2022, 188, 114416 CrossRef CAS PubMed.
- Y. Xiong, B. Varadarajan, L. Wu, X. Xiang, F. Xiao, C. Zhu, X. Dai, D. Wang, F. Sun, F. Iandola, R. Krishnamoorthi and V. Chandra, arXiv, 2023, preprint, arXiv:2312.00863v1 DOI:10.48550/arXiv.2312.00863.
- I. ASTM, E3409-24, 2024, 545-545-3.
- J. Kuntsche, C. Decker and A. Fahr, J. Sep. Sci., 2012, 35, 1993–2001 CrossRef CAS PubMed.
- S. Hupfeld, D. Ausbacher and M. Brandl, J. Sep. Sci., 2009, 32, 1465–1470 CrossRef CAS PubMed.
- J. Gigault, J. M. Pettibone, C. Schmitt and V. A. Hackley, Anal. Chim. Acta, 2014, 809, 9–24 CrossRef CAS PubMed.
- P. S. Williams, Anal. Bioanal. Chem., 2016, 408, 3247–3263 CrossRef CAS PubMed.
- K. Kik, B. Bukowska and P. Sicińska, Environ. Pollut., 2020, 262, 114297 CrossRef CAS PubMed.
- R. Juneja and I. Roy, RSC Adv., 2014, 4, 44472–44479 RSC.
- M. Jayaraman, P. Dutta, J. Telang and S. Krishnan, Nanomed. Cancer Diagnosis Ther., 2021, 1–45 Search PubMed.
- M. Zatorska-Płachta, G. Łazarski, U. Maziarz, A. Foryś, B. Trzebicka, D. Wnuk, K. Chołuj, A. Karewicz, M. Michalik, D. Jamroz and M. Kepczynski, ACS Omega, 2021, 6, 12168–12178 CrossRef PubMed.
- R. Ragheb and U. Nobbmann, Sci. Rep., 2020, 10, 1–9 CrossRef PubMed.
- C. M. Sorensen, R. C. Mockler and W. J. O’Sullivan, Phys. Rev. A: At., Mol., Opt. Phys., 1978, 17, 2030–2035 CrossRef CAS.
- R. C. MacDonald, R. I. MacDonald, B. P. M. Menco, K. Takeshita, N. K. Subbarao and L. Rong Hu, Biochim. Biophys. Acta, Biomembr., 1991, 1061, 297–303 CrossRef CAS PubMed.
- S. Sitar, V. Vezocňik, P. Macěk, K. Kogej, D. Pahovnik and E. Žagar, Anal. Chem., 2017, 89, 11744–11752 CrossRef CAS PubMed.
- C. A. Schneider, W. S. Rasband and K. W. Eliceiri, Nat. Methods, 2012, 9, 671–675 CrossRef CAS PubMed.
- Segment-anything-models-java, SAMJ-IJ plugin, GitHub, https://github.com/segment-anything-models-java/SAMJ-IJ, accessed May 2025.
Footnotes |
| † Electronic supplementary information (ESI) available. See DOI: https://doi.org/10.1039/d4tb02790f |
| ‡ These authors contributed equally to this work. |
| This journal is © The Royal Society of Chemistry 2025 |