
 Open Access Article
 This Open Access Article is licensed under a
 Creative Commons Attribution 3.0 Unported Licence
High proton conductivity of HxWO3 at intermediate temperatures: unlocking its application as a mixed ionic–electronic conductor
Rantaro
Matsuo
 ,
Tomoyuki
Yamasaki
* and
Takahisa
Omata
*
,
Tomoyuki
Yamasaki
* and
Takahisa
Omata
*
Institute of Multidisciplinary Research for Advanced Materials, Tohoku University, Katahira 2-1-1, Sendai 980-8577, Japan. E-mail: omoyuki.yamasaki.a1@tohoku.ac.jp; Tel: +81-22-217-5215
First published on 31st October 2025
Abstract
Hydrogen tungsten bronzes (HxWO3), known for their mixed protonic–electronic conduction near room temperature, are extensively studied for electrochromic and gasochromic applications. However, their proton transport properties at elevated temperatures—particularly in the intermediate-temperature range (200–500 °C)—remain unexplored. This study revealed the proton transport behavior of HxWO3, focusing on its potential as a proton-conducting mixed ionic–electronic conductor (MIEC) for intermediate-temperature electrochemical applications. By employing a proton-conducting phosphate glass as an electron-blocking electrode, we selectively measured the partial proton conductivity of sintered HxWO3. Hydrogen incorporation into the sintered WO3 pellet was found to occur preferentially near the surface, forming an approximately 500 μm-thick hydrogen-rich region. This region reached a composition of x = 0.24 and exhibited proton conductivity exceeding 10−1 S cm−1 at 275 °C—well above those of the state-of-the-art perovskite proton conductors. Impedance spectroscopy revealed distinct features of proton transport, including an isotope effect. The proton diffusion coefficient was 100–1000 times greater than that of H∼0.0001TiO2, which exhibits mixed protonic–electronic conduction via hydrogen dissolution. The larger proton diffusion coefficient of H0.24WO3 suggests that large polaron formation enhances proton mobility. These findings unlock new functionality of HxWO3 as a MIEC in the intermediate-temperature range, paving the way for the development of next-generation hydrogen energy conversion systems.
Introduction
Tungsten trioxide (WO3) is a well-known transition metal oxide that exhibits pronounced optical and electronic changes upon hydrogen incorporation.1–10 When exposed to hydrogen gas at elevated temperatures or subjected to electrochemical hydrogen injection using acidic electrolytes, WO3 forms hydrogen tungsten bronzes (HxWO3). WO3 can accommodate a large amount of hydrogen (up to x ∼ 0.5),11 corresponding to proton density (nH) on the order of 1021 cm−3. Upon hydrogen dissolution, hydrogen atoms are incorporated into the lattice and ionize into protons and electrons, as described by eqn (1) in Kröger–Vink notation:12 | (1) |
The electrons introduced along with protons localize on tungsten atoms, leading to the reduction of W6+ ions to W5+. These changes result in a characteristic blue coloration and an increase in electronic conductivity. These coupled optical and electronic changes have been widely utilized in electrochromic13–15 and gasochromic devices,16,17 hydrogen sensors,18–20 and resistive switching devices that operate via ion injection.21,22
Since the optical and electronic responses in HxWO3 are associated with proton diffusion processes, HxWO3 is characterized as a proton-conducting mixed ionic–electronic conductor (MIEC), and the dynamics of proton transport have attracted significant research interest. The proton diffusion process has been studied using various techniques such as proton nuclear magnetic resonance (1H NMR)23–27 and electrochemical measurements.28–30 Changes in optical absorption31–33 have been also utilized as experimentally accessible indicators of proton migration. These previous studies have revealed that the proton diffusion coefficient in HxWO3 strongly depends on crystallinity and hydrogen content. Although the reported values exhibit scatter due to the difficulty of the measurements, many studies have suggested relatively large diffusion coefficients compared with other oxides.34–36 While the prospect of fast proton diffusion has attracted considerable interest, the practical applications of HxWO3 are limited to gasochromic and electrochromic devices operating near room temperature. Only a few reports have explored other uses of its mixed conduction.37,38
Owing to its intrinsic mixed protonic–electronic conductivity, HxWO3 is a promising candidate for electrochemical devices operating at elevated temperatures, such as protonic ceramic fuel cells and steam electrolysis systems.39 In such devices, mixed protonic–electronic conductors are particularly advantageous because they allow electrochemical reactions to extend beyond narrow triple-phase boundaries (gas–electrolyte–electrode) to broader two-phase boundaries (gas–electrode).40 This can reduce electrode polarization resistance and improve the overall efficiency, which is especially beneficial for operation in the intermediate-temperature range (200–500 °C), where sluggish electrode kinetics often limit performance. Thus, demonstrating high proton conductivity of HxWO3 in the intermediate-temperature range would unlock the potential use of HxWO3 as a MIEC, contributing to the development of next-generation energy devices such as hydrogen permeable membranes and fuel cells.
This study investigates the proton conductivity of HxWO3 in the intermediate-temperature range using an electron-blocking method. A proton-conducting phosphate glass with a proton transport number of unity41 is employed as an electron-blocking electrode, enabling selective detection of protonic conduction in HxWO3 while suppressing electronic contributions. The partial proton conductivity of sintered HxWO3 is above 10−2 S cm−1 at 250 °C, which significantly exceeds that of well-known perovskite-type proton conducting oxides. We discuss the large proton diffusion coefficient underlying the high proton conductivity in terms of the activation energy and the magnitude of the pre-exponential factor.
Experimental
Sample preparation
The sintered WO3 samples were prepared by spark plasma sintering (SPS; SPS-511S, Fuji Electronic Industrial Co., Ltd, Japan). The raw yellowish green WO3 powder (99.9%, Kojundo Chemical Laboratory Co., Ltd, Japan) was ground using a mortar and pestle made of stabilized ZrO2, put into a carbon mold with a diameter of 20 mm, and then sintered at 800 °C under 50 MPa for 10 min in vacuum. All sintered pellets were polished to a uniform thickness of 2.3 mm. The as-sintered sample had a black appearance, owing to oxygen deficiency caused by annealing under an atmosphere with low oxygen chemical potential. After subsequent annealing in pure oxygen at 600 °C for 40 h, the sinters turned back yellowish green, indicating that oxygen vacancies were filled with oxygen. The apparent density of the sinters, determined by the Archimedes method, was approximately 99% of the theoretical density. To promote hydrogen incorporation into the sintered WO3 samples, a 100 nm-thick Pd film6,42 was deposited on both faces by magnetron sputtering (JFC-1600, JEOL, Japan), followed by annealing in a hydrogen atmosphere at 300 °C for up to 144 h. After hydrogen annealing, the surface of the sinter turned dark blue, indicating the formation of W5+ due to hydrogen incorporation, i.e., the formation of HxWO3. A cross-sectional scanning electron microscope image (FE-SEM; JSM-7800F, JEOL, Japan) of HxWO3 confirmed fine grains and no visible open pores (see Fig. S1), consistent with the high apparent density.Evaluation of hydrogen incorporation into sintered WO3
The crystalline phase in the sintered HxWO3 was identified by X-ray diffraction (XRD; SmartLab, Rigaku, Japan) using Cu-Kα radiation. Prior to measurement, the sintered pellet was mechanically polished to obtain a flat surface for accurate diffraction analysis. To evaluate the depth profile of hydrogen, a two-dimensional hydrogen concentration map was acquired by using time-of-flight secondary ion mass spectrometry (TOF-SIMS; TOF-SIMS5, ION-TOF GmbH, Germany) over a 500 μm-wide region from the outer surface of the cross-sectional face of the HxWO3 pellet. The amount of hydrogen dissolved in the sintered HxWO3 was quantified by thermal desorption spectrometry (TDS) using a quadrupole mass spectrometer (QMASS; M-200QA, ANELVA, Japan). A small piece of the sintered sample (approximately 0.1 g), either oxygen- or hydrogen-annealed, was placed in a SiO2-glass crucible, which was then set in a closed-end alumina tube. The tube was placed in a furnace and connected to an analyzing chamber equipped with a QMASS. After the experimental apparatus, comprising the sample and analyzing chambers, was evacuated by using a turbomolecular pump (TMU-261, Pfeiffer Vacuum, Germany) down to <1 × 10⁻⁷ Pa at room temperature, the furnace was heated up to 1000 °C at a rate of 2.5 °C min−1. H2O (m/z = 18) and H2 (m/z = 2) gases released from the samples were detected by the QMASS and quantified using La(OH)3 and TiH2 as standard samples. Details of the TDS apparatus and experimental procedure have been described elsewhere.43 If hydrogen dissolution proceeds according to eqn (1), the amount of hydrogen in the sintered HxWO3 could in principle also be evaluated from measurements of the electron carrier density. However, since reliable determination of the electron carrier density in HxWO3 is challenging due to its polaronic behavior,44–46 we did not attempt such an analysis in this study.Partial proton conductivity measurements
The partial proton conductivity was measured by the electron-blocking method using the proton-conducting phosphate glass (36HO1/2–4NbO5/2–2BaO–4LaO3/2–4GeO2–1BO3/2–49PO5/2 glass) with a thickness of 20–30 μm and a proton transport number of unity41 as the electron-blocking electrode. The junction between the sintered HxWO3 and the glass was fabricated through hot-pressing, as previously reported.47,48 To reduce interfacial resistance across the junction between the sintered HxWO3 and the glass, a 100 nm-thick Pd buffer layer deposited by rf-magnetron sputtering (1′′ sputter cathode, Kenix, Japan) was inserted in the junction. Next, 100 nm-thick Pd reversible electrodes for protons and electrons were deposited on both ends of the cell by rf-magnetron sputtering. The conductivity was measured by using both DC and AC-impedance methods (VersaSTAT-3F, Princeton Applied Research, USA) at 200–275 °C under dry H2 or deuterium (D2) atmospheres without any additional drying treatment. The applied voltage for the DC measurement was 100 mV. For AC-impedance measurements, the frequency range varied from 100 mHz to 1 MHz with an amplitude of 10 mV (rms).Results & discussion
Hydrogen incorporation into sintered WO3
Fig. 1(a) presents the XRD patterns obtained from the surface and core regions of the WO3 pellet annealed in H2 for 144 h at 300 °C. The inset shows a cross-sectional image of the pellet, with the measured regions corresponding to the XRD data. The cross-section reveals a sharp transition from the dark blue surface to a pale blue core. The diffraction peaks from the surface and core are indexed to the tetragonal and monoclinic phases of WO3, respectively.49,50 The blue coloration deepens as the hydrogen content increases,4 and its crystal structure varies accordingly—monoclinic for x ≲ 0.1, orthorhombic for 0.1 ≲ x ≲ 0.15, and tetragonal for 0.15 ≲ x ≲ 0.5.1,51 These results suggest that the outer surface of the pellet is hydrogen-rich, while the inner core is hydrogen-poor. | ||
| Fig. 1 (a) XRD patterns of the surface (red) and core regions (blue) of the HxWO3 pellet. The inset shows a cross-sectional optical microscope image of the pellet, revealing a sharp color transition from the dark blue surface to the pale blue core. (b) Depth profile of hydrogen-related ions (H− and OH−) obtained by TOF-SIMS near the phase boundary in the cross section of HxWO3. | ||
Fig. 1(b) displays the hydrogen depth profile of the sinter annealed in H2 for 144 h at 300 °C, obtained by lateral averaging a two-dimensional hydrogen distribution map measured by using TOF-SIMS. The hydrogen signal is less detectable at the edge of the pellet, but a hydrogen-rich region is clearly observed near the surface. The concentration gradually begins to decrease around a depth of 500 μm, corresponding to the color boundary, and approaches the background level toward the core. Further details on the TOF-SIMS measurement are provided in Fig. S2.
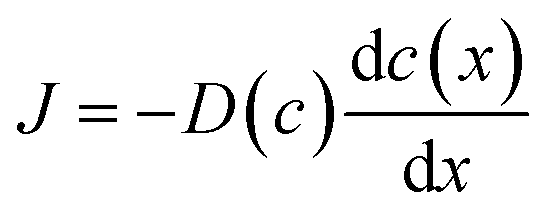
The hydrogen-rich surface and hydrogen-poor core regions were separated through mechanical grinding, and the hydrogen content in each region was determined by TDS. The hydrogen content was determined to be x = 0.24 in the hydrogen-rich surface and x = 0.0048 in the hydrogen-poor core (Fig. S3). Fig. S4 shows the time evolution of the color-change front observed in the sintered pellets during hydrogen annealing. The front advanced slowly into the pellet with time, indicating that the inward progression of hydrogenation of WO3 is markedly sluggish. Even after 144 h at 300 °C, the hydrogen-rich region extended only to a depth of ∼500 μm from the surface. This slow advance suggests that the overall hydrogen flux is governed by the low proton diffusivity in the WO3 pellet. However, the SIMS depth profiles reveal that there is no hydrogen concentration gradient within the hydrogen-rich region. According to Fick's law,
 | (2) |
Proton conductivity of HxWO3 in hydrogen atmosphere
Fig. 2(a) shows a schematic illustration of the electron-blocking cell, together with a top-view photograph of the sample. The phosphate glass was tightly laminated onto the surface of the sintered HxWO3, which exhibited high apparent density so that mechanical gas leakage through the pellet can be neglected. This configuration provides a well-defined interface that allows reliable characterization of proton conduction under electron-blocking conditions (Fig. S5). Nevertheless, the cell inevitably includes multiple interfaces, and electronic currents arising from hydrogen evolution reactions at these interfaces may flow. We discussed their contributions to the electrical measurements, as shown in SI Section S5.1. | ||
| Fig. 2 (a) Schematic image of the electron-blocking cell along with a top-view photograph. (b) Time evolution of the DC current (under a 100 mV applied bias) during the sequential switching of the atmosphere from H2 to D2 and back to H2 at 250 °C. | ||
Fig. 2(b) shows the current–time profile measured under the application of a constant DC voltage of 100 mV as the atmosphere was switched between H2 and D2. The increase and decrease in current upon switching between H2 and D2 clearly demonstrate an isotope effect, suggesting that protons contribute to the current and that electronic conduction is effectively suppressed by the phosphate glass.
Fig. 3(a) shows the decay of the transient current immediately after the application of a DC voltage of 100 mV, indicating that the electron-blocking cell contains not only a resistive component associated with proton transport, but also a capacitive component. To examine the details of this behavior, the frequency-dependent responses of the cell were measured by AC impedance spectroscopy. Fig. 3(b) shows the overall Nyquist plot of the electron-blocking cell, revealing the following distinct components: a high-frequency intercept resistance (R1), mid-frequency arcs, and a low-frequency inclined straight-line response. Among these, the straight line observed in the low-frequency region has a slope close to 1, indicative of Warburg impedance (Rw).52 As shown in the enlarged view in Fig. 3(c), two distinct arcs are observed in the mid-frequency region. These are denoted as R2 and R3 and are visually highlighted in red and blue, respectively, for clarity.
 | ||
| Fig. 3 (a) Current decay after applying a 100 mV DC bias under a hydrogen atmosphere at 250 °C. (b) Nyquist plot of the AC impedance measured under the same conditions as in (a). (c) Enlarged view of the mid-frequency region in (b) along with the simplified equivalent circuit (top) used for fitting and the fitting result (green line). | ||
The equivalent circuit of the asymmetric electron-blocking cell can be described by a complex transmission line model that represents mass and charge transport, as shown in Fig. S7.53 The model includes elements related to charge transport at interfacial regions, leading to a complex impedance response. However, this complex impedance response makes it difficult to readily identify the resistive component associated with proton transport in HxWO3. Although the transmission line model provides a physically meaningful representation of the system, previous studies have shown that fitting with a series of Randles circuits yields nearly equivalent results.48,54 Therefore, while the transmission line model is more appropriate for physical interpretation, we herein discuss the fitting results based on the simplified equivalent circuit shown in the upper part of Fig. 3(c).
As a first step, the contribution from proton transport in the glass electrode can be readily separated, as its relaxation is the fastest and appears as a distinct high-frequency resistance. As shown in Fig. S8, the temperature dependence of R1 agrees well with the reported value of the proton-conducting glass,41 allowing it to be assigned to proton transport within the glass. The remaining impedance components were identified through the subsequent measurements.
Fig. 4(a) presents the Nyquist plots of the electron-blocking cell measured under H2 and D2 atmospheres. Switching the atmosphere from H2 to D2 increased not only R1, reflecting the isotope effect in the glass electrode, but also R2 and R3. This phenomenon provides evidence that these arcs are associated with proton-related processes such as proton transport in HxWO3 or interfacial charge transfer. The corresponding resistance values are plotted in Fig. 4(b).
 | ||
| Fig. 4 (a) Nyquist plots of the impedance spectra measured under H2 (top) and D2 (bottom) atmospheres at 250 °C. (b, left) Fitted resistance values of R1, R2, and R3 under H2 and D2. (b, right) Corresponding resistance ratios (R(D2)/R(H2)) representing isotope effects for each component. (c) Nyquist plots of impedance spectra measured under H2 at 250 °C for samples with different thicknesses (2.3 mm and 1.8 mm, polished). (d, left) Fitted resistance values of R1, R2, and R3 for 2.3 mm- and 1.8 mm-thick samples. (d, right) Corresponding resistance ratios (R(1.8 mmt)/R(2.3 mmt)) for each component. | ||
To further elucidate the assignment of the R2 and R3 components, we performed impedance measurements on HxWO3 pellets of different thicknesses. The pellet with an initial thickness of 2.3 mm was mechanically polished by 500 μm from the side opposite to the glass layer to reduce its thickness to 1.8 mm. The corresponding Nyquist plots are shown in Fig. 4(c), and the changes in the R1, R2, and R3 components are summarized in Fig. 4(d). As noted in Fig. S4, the thickness of the hydrogen-rich region is approximately 500 μm. Therefore, removing an area of approximately 500 μm from one side of the pellet effectively reduces the thickness of the hydrogen-rich region by about half, while leaving the hydrogen-poor core nearly unchanged. This reduction primarily affected the R2 component, which suggests that R2 corresponds to the proton transport resistance within the hydrogen-rich region.
In contrast, the low-frequency element Rw exhibited only minor changes upon isotope substitution or variation in pellet thickness. Rw is therefore interpreted as proton diffusion in the hydrogen-poor monoclinic region, where proton transport is limited by the inherently low diffusion coefficient and the scarcity of carrier protons.
Finally, the R3 component exhibited a clear isotope effect but only minor dependence on pellet thickness. This behavior indicates that R3 is clearly associated with proton-related resistance, and its large capacitance further supports an interfacial origin (Fig. S9). As discussed in SI Section S5.1, the contributions of the Pd/glass and Pd/HxWO3 interfaces can be regarded as negligible. We therefore attribute R3 mainly to proton transport across the boundary between the hydrogen-rich and hydrogen-poor regions.
Fig. 5(a) displays the Arrhenius plot of the proton conductivity (σH) of HxWO3 measured in a hydrogen atmosphere. The conductivity was calculated for the hydrogen-rich H0.24WO3 region (thickness: 1 mm) from the R2 component. The corresponding electronic conductivity (σe), determined by the DC four-probe method (Fig. S10(a)), is also plotted. Although the proton transport number in the measured temperature range is relatively low (<1 × 10⁻³), σH reaches 1 × 10⁻¹ S cm−1 at 275 °C. This value significantly exceeds that of perovskite-type proton-conducting electrolytes in the intermediate-temperature range,55–57 indicating that HxWO3 holds promise as an electrode material when combined with such electrolytes.
 | ||
| Fig. 5 (a) Arrhenius plot of conductivity. The proton conductivity (σH) of H0.24WO3 is shown as red closed circles, and the electronic conductivity (σe) as blue open circles. For comparison, σH values of proton-conducting oxide electrolytes are also plotted: BaSc0.8Mo0.2O2.8 (BSM20; purple line),55 BaZr0.4Sc0.6O3−δ (BZS60; green line),56 and BaZr0.85Y0.15O3−δ (BZY15; orange line).57 (b) Arrhenius plot of the proton diffusion coefficient (DH) and activation energy (Ea). The red circles represent the values calculated from the σH of H0.24WO3 measured in this study. Black open circles are the values for crystalline HxWO3 thin film (x ∼ 0.1), as reported by Randin et al.30 For comparison, DH along the ab-plane and c-axis of H∼0.0001TiO2, reported by Johnson et al., are shown as blue and green lines, respectively.36 | ||
Fig. 5(b) presents the temperature dependence of the proton diffusion coefficient (DH) in H0.24WO3 calculated from proton conductivity and proton carrier density using the Nernst–Einstein relation:
 | (3) |
Herein, we compare the proton diffusion behavior of HxWO3 with that of rutile-type HxTiO2, which also incorporates protons via hydrogen dissolution (eqn (1)).58,59 Like WO3, TiO2 undergoes a transition from a d0 to a d1 electronic configuration upon hydrogen incorporation, leading to the formation of Ti3+ species. However, the amount of hydrogen incorporated into TiO2 is significantly smaller than that in WO3, typically resulting in proton densities on the order of 1018 to 1019 cm−3 corresponding to a hydrogen composition of x ∼ 0.0001.36 In both HxWO3 and HxTiO2, equal amounts of protons and electrons are introduced by hydrogen dissolution, leading to coupled proton–electron transport, referred to as ambipolar diffusion.60 Notably, the DH of H0.24WO3 is 100–1000 times greater than that of H∼0.0001TiO2 along its one-dimensional c-axis diffusion pathways.36,61 In HxTiO2, the electrons tend to localize at Ti sites, forming small polarons  with low mobility.62,63 The negative charge of these polarons electrostatically attracts protons and acts as proton traps, thereby limiting the proton mobility. In contrast, in HxWO3, the electrons introduced via hydrogen dissolution are likely to form polarons with a relatively larger polaron radius, as suggested by the small activation energies (Ea) for electronic conduction (Fig. S10(b)).44,45,64 These highly mobile and delocalized electrons do not produce strong localized electrostatic fields that immobilize protons, accounting for the larger DH of H0.24WO3 than that of H∼0.0001TiO2.
Interestingly, H0.24WO3 exhibits Ea for proton diffusion that is comparable to or even higher than that of H∼0.0001TiO2 along the c-axis, despite the significantly higher diffusion coefficient. The temperature dependence of diffusion coefficient can be determined using the Arrhenius equation:
 | (4) |
 | (5) |
| H0.24WO3 | H∼0.0001TiO2 (c-axis) | |
|---|---|---|
| D 0/cm2 s−1 | 10 | 0.002 |
Conclusions
This study reported on the proton conductivity of hydrogen tungsten bronze (HxWO3) in the intermediate-temperature range using an electron-blocking method with a phosphate glass electrolyte. The sample exhibited a spatially inhomogeneous hydrogen distribution, consisting of a hydrogen-rich surface region (x = 0.24) and a hydrogen-poor core (x = 0.0048). The limited penetration depth of hydrogen (∼500 μm) even after prolonged annealing suggests that the low diffusion coefficient in the hydrogen-poor region restricts further hydrogen incorporation. The impedance component corresponding to proton conduction in H0.24WO3 was separated from the overall impedance based on comparative measurements obtained using isotope substitution and pellets with different thicknesses. The resulting proton conductivity of H0.24WO3 reached 10−1 S cm−1 at 275 °C under a H2 atmosphere. This value significantly exceeds that of perovskite-type proton-conducting electrolytes in the intermediate-temperature range, which suggests that HxWO3 is a promising electrode material for use in combination with these electrolytes. A comparison with rutile-type H∼0.0001TiO2 revealed that H0.24WO3 possesses proton diffusion coefficients that are 100–1000 times larger, indicating the formation of large polarons of electrons. The delocalized electrons do not electrostatically trap protons at specific positions, thereby allowing efficient proton migration. Furthermore, H0.24WO3 exhibits a larger D0 than that of H∼0.0001TiO2. This phenomenon likely reflects the presence of a wide variety of accessible proton migration pathways or reduced vibrational constraints in the activated state in H0.24WO3, contributing to its high proton diffusivity despite a comparable or higher Ea. These results highlight the critical role of entropic contributions in the proton diffusion process of HxWO3, offering a new perspective for designing proton-conducting materials with high proton conductivity.Author contributions
Rantaro Matsuo: investigation, visualization. Tomoyuki Yamasaki: investigation, visualization, funding acquisition, writing – original draft. Takahisa Omata: conceptualization, funding acquisition, supervision, writing – review & editing.Conflicts of interest
There are no conflicts to declare.Data availability
All data supporting this article are included in the SI. Supplementary information: microstructure of sintered HxWO3, hydrogen distribution in the HxWO3 measured by TOF-SIMS, quantification of hydrogen in the sintered HxWO3 by TDS, growth behavior of the hydrogen-rich region by hydrogen annealing, details of the electron-blocking measurement, and electronic conductivity of HxWO3. See DOI: https://doi.org/10.1039/d5ta05331e.Acknowledgements
This work was supported in part by JSPS KAKENHI Grant Numbers 21H04607 and 24K17762. This work was partly performed under the Cooperative Research Program of the “Network Joint Research Center for Materials and Devices” (No. 20241114) and “Dynamic Alliance for Open Innovation Bridging Human, Environment, and Materials”. This work was also partly supported by the Material Solutions Center (MaSC), Tohoku University, and the Central Analytical Facility (CAF), Institute of Multidisciplinary Research for Advanced Materials (IMRAM), Tohoku University, Japan.References
- O. Glemser and C. Naumann, Z. Für Anorg. Allg. Chem., 1951, 265, 288–302 CrossRef CAS.
- P. G. Dickens and R. J. Hurditch, Nature, 1967, 215, 1266–1267 CrossRef CAS.
- P. A. Sermon and G. C. Bond, J. Chem. Soc., Faraday Trans. 1, 1976, 72, 730–744 RSC.
- G. Nagy and R. Schiller, Int. J. Hydrogen Energy, 1989, 14, 567–572 CrossRef CAS.
- Z. Hussain, Appl. Opt., 2002, 41, 6708–6724 CrossRef CAS PubMed.
- R. Matsuo, T. Yamasaki, I. Suzuki, S. Kawanishi and T. Omata, J. Phys. Chem. C, 2025, 129, 1516–1524 CrossRef CAS.
- G. Hollinger and P. Pertosa, Chem. Phys. Lett., 1980, 74, 341–344 CrossRef CAS.
- A. Hjelm, C. G. Granqvist and J. M. Wills, Phys. Rev. B:Condens. Matter Mater. Phys., 1996, 54, 2436–2445 CrossRef CAS PubMed.
- J. Zhu, M. Vasilopoulou, D. Davazoglou, S. Kennou, A. Chroneos and U. Schwingenschlögl, Sci. Rep., 2017, 7, 40882 CrossRef CAS PubMed.
- E. Billeter, A. Sterzi, O. Sambalova, R. Wick-Joliat, C. Grazioli, M. Coreno, Y. Cheng, A. J. Ramirez-Cuesta and A. Borgschulte, Phys. Rev. B, 2021, 103, 205304 CrossRef CAS.
- P. J. Wiseman and P. G. Dickens, J. Solid State Chem., 1973, 6, 374–377 CrossRef CAS.
- F. A. Kröger and H. J. Vink, J. Phys. Chem. Solids, 1958, 5, 208–223 CrossRef.
- B. W. Faughnan, R. S. Crandall and M. A. Lampert, Appl. Phys. Lett., 1975, 27, 275–277 CrossRef CAS.
- M. Shizukuishi, E. Kaga, I. Shimizu, H. Kokado and E. Inoue, Jpn. J. Appl. Phys., 1981, 20, 581 CrossRef CAS.
- H. Xie, Z. Wang, M. A. Khalifa, Y. Ke, J. Zheng and C. Xu, ACS Appl. Mater. Interfaces, 2023, 15, 30469–30478 CrossRef CAS PubMed.
- A. Georg, W. Graf, R. Neumann and V. Wittwer, Sol. Energy Mater. Sol. Cells, 2000, 63, 165–176 CrossRef CAS.
- S. Hwan Cho, J. Min Suh, B. Jeong, T. Hyung Lee, K. Soon Choi, T. Hoon Eom, T. Kim and H. Won Jang, Chem. Eng. J., 2022, 446, 136862 CrossRef CAS.
- M. Horprathum, T. Srichaiyaperk, B. Samransuksamer, A. Wisitsoraat, P. Eiamchai, S. Limwichean, C. Chananonnawathorn, K. Aiempanakit, N. Nuntawong, V. Patthanasettakul, C. Oros, S. Porntheeraphat, P. Songsiriritthigul, H. Nakajima, A. Tuantranont and P. Chindaudom, ACS Appl. Mater. Interfaces, 2014, 6, 22051–22060 CrossRef CAS PubMed.
- Y. Sugawara, Y. Sakaizawa, A. Shibata, I. Muto and N. Hara, ISIJ Int., 2018, 58, 1860–1867 CrossRef CAS.
- X. Pan, D. Wu, Q. Xie, X. Zang, C. Zhang, M. Hua and J. Jiang, Chem. Eng. Technol., 2025, 48, e70005 CrossRef CAS.
- X. Yao, K. Klyukin, W. Lu, M. Onen, S. Ryu, D. Kim, N. Emond, I. Waluyo, A. Hunt, J. A. del Alamo, J. Li and B. Yildiz, Nat. Commun., 2020, 11, 3134 CrossRef CAS PubMed.
- F. Zhang, Y. Zhang, L. Li, X. Mou, H. Peng, S. Shen, M. Wang, K. Xiao, S.-H. Ji, D. Yi, T. Nan, J. Tang and P. Yu, Nat. Commun., 2023, 14, 3950 CrossRef CAS PubMed.
- M. A. Vannice, M. Boudart and J. J. Fripiat, J. Catal., 1970, 17, 359–365 CrossRef CAS.
- P. G. Dickens, D. J. Murphy and T. K. Halstead, J. Solid State Chem., 1973, 6, 370–373 CrossRef CAS.
- K. Nishimura, Solid State Commun., 1976, 20, 523–524 CrossRef CAS.
- D. A. Claridge, P. G. Dickens and J. B. Goodenough, Appl. Phys. A, 1989, 49, 65–68 CrossRef.
- Cl. Ritter, W. Müller-Warmuth and R. Schöllhorn, Berichte Bunsenges. Phys. Chem., 1986, 90, 357–360 CrossRef CAS.
- M. L. Hitchman, Thin Solid Films, 1979, 61, 341–348 CrossRef CAS.
- B. Reichman, A. J. Bard and D. Laser, J. Electrochem. Soc., 1980, 127, 647 CrossRef CAS.
- J.-P. Randin and R. Viennet, J. Electrochem. Soc., 1982, 129, 2349 CrossRef CAS.
- Á. Vértes and R. Schiller, J. Appl. Phys., 1983, 54, 199–203 CrossRef.
- S. Burkhardt, M. T. Elm, B. Lani-Wayda and P. J. Klar, Adv. Mater. Interfaces, 2018, 5, 1701587 CrossRef.
- M. S. Friedrich, T. K. Hecker, A. G. Strack, P. Tuchecker and P. J. Klar, Adv. Phys. Res., 2024, 3, 2400019 CrossRef.
- E. Mollwo, Z. Phys., 1954, 138, 478–488 CrossRef CAS.
- P. Weiser, Y. Qin, W. Yin, M. Stavola, W. B. Fowler and L. A. Boatner, Appl. Phys. Lett., 2016, 109, 202105 CrossRef.
- O. W. Johnson, S. −H. Paek and J. W. DeFord, J. Appl. Phys., 1975, 46, 1026–1033 CrossRef CAS.
- B. Yan, R. P. Bisbey, A. Alabugin and Y. Surendranath, J. Am. Chem. Soc., 2019, 141, 11115–11122 CrossRef CAS PubMed.
- R. Huang, S. Liu, Z. He, G. Ye, W. Zhu, H. Xu and J. Wang, ACS Nano, 2023, 17, 19098–19108 CrossRef CAS.
- T. Norby, ECS Trans., 2017, 80, 23–32 CrossRef CAS.
- S. B. Adler, Chem. Rev., 2004, 104, 4791–4844 CrossRef CAS PubMed.
- T. Yamaguchi, S. Tsukuda, T. Ishiyama, J. Nishii, T. Yamashita, H. Kawazoe and T. Omata, J. Mater. Chem. A, 2018, 6, 23628–23637 RSC.
- S.-I. Han, M. Kumar, L. T. Duy, R. Yeasmin, C. Park, G. Jung, H. Kim, A. S. Khan, H. Dang and H. Seo, Sens. Actuators, B, 2024, 404, 135259 CrossRef CAS.
- T. Omata, K. Okuda, S. Tsugimoto and S. Otsuka-Matsuo-Yao, Solid State Ionics, 1997, 104, 249–258 CrossRef CAS.
- V. Wittwer, O. F. Schirmer and P. Schlotter, Solid State Commun., 1978, 25, 977–980 CrossRef CAS.
- F. Schirmer and E. Salje, Solid State Commun., 1980, 33, 333–336 CrossRef.
- D. Emin, Polarons, Cambridge University Press, Cambridge, 2012 Search PubMed.
- I. Suzuki, M. Tashiro, T. Yamaguchi, T. Ishiyama, J. Nishii, T. Yamashita, H. Kawazoe and T. Omata, Int. J. Hydrogen Energy, 2020, 45, 16690–16697 CrossRef CAS.
- T. Shiraiwa, T. Yamasaki, K. Kushimoto, J. Kano and T. Omata, J. Am. Chem. Soc., 2025, 147, 30757–30767 CrossRef CAS PubMed.
- P. M. Woodward, A. W. Sleight and T. Vogt, J. Phys. Chem. Solids, 1995, 56, 1305–1315 CrossRef CAS.
- T. Vogt, P. M. Woodward and B. A. Hunter, J. Solid State Chem., 1999, 144, 209–215 CrossRef CAS.
- P. G. Dickens, J. H. Moore and D. J. Neild, J. Solid State Chem., 1973, 7, 241–244 CrossRef CAS.
- J. Bisquert and V. S. Vikhrenko, Electrochim. Acta, 2002, 47, 3977–3988 CrossRef CAS.
- E. Bumberger, A. Nenning and J. Fleig, Phys. Chem. Chem. Phys., 2024, 26, 15068–15089 RSC.
- J. Fleig, H.-R. Kim, J. Jamnik and J. Maier, Fuel Cells, 2008, 8, 330–337 CrossRef CAS.
- K. Saito and M. Yashima, Nat. Commun., 2023, 14, 7466 CrossRef.
- J. Hyodo, K. Kitabayashi, K. Hoshino, Y. Okuyama and Y. Yamazaki, Adv. Energy Mater., 2020, 10, 2000213 CrossRef CAS.
- D. Han and T. Uda, J. Mater. Chem. A, 2018, 6, 18571–18582 RSC.
- P. F. Chester and D. H. Bradhurst, Nature, 1963, 199, 1056–1057 CrossRef CAS.
- V. Koudriachova, S. W. de Leeuw and N. M. Harrison, Phys. Rev. B:Condens. Matter Mater. Phys., 2004, 70, 165421 CrossRef.
- Z. Wu and M. Liu, Solid State Ionics, 1996, 93, 65–84 CrossRef CAS.
- J. B. Bates, J. C. Wang and R. A. Perkins, Phys. Rev. B:Condens. Matter Mater. Phys., 1979, 19, 4130–4139 CrossRef CAS.
- N. A. Deskins and M. Dupuis, Phys. Rev. B:Condens. Matter Mater. Phys., 2007, 75, 195212 CrossRef.
- T. Brant, N. C. Giles and L. E. Halliburton, J. Appl. Phys., 2013, 113, 053712 CrossRef.
- G. Austin and N. F. and Mott, Adv. Phys., 1969, 18, 41–102 CrossRef.
- A. Yelon, B. Movaghar and R. S. Crandall, Rep. Prog. Phys., 2006, 69, 1145 CrossRef CAS.
| This journal is © The Royal Society of Chemistry 2025 |