
 Open Access Article
 This Open Access Article is licensed under a
 Creative Commons Attribution 3.0 Unported Licence
Mapping phase instability to electrochemical degradation in SrTi1−xFexO3−δ under solid oxide cell fuel-electrode conditions†
Jakob M.
Reinke
 * and
Scott A.
Barnett
* and
Scott A.
Barnett
Department of Materials Science and Engineering, Northwestern University, Evanston, Illinois 60208, USA
First published on 27th March 2025
Abstract
SrTi1−xFexO3−δ (STF) is a promising fuel electrode into which reducible cations can be substituted to yield exsolution of catalytically active nanoparticles, improving performance. Since prior studies have focused on STF with Fe content x = 0.7, questions remain as to whether other compositions provide better stability and performance over a range of fuel compositions. The present study examines a wider composition range from x = 0.5 to 0.8 at 850 °C. Furthermore, phase evolution during exposure to varying H2/H2O is observed in situ using X-ray diffraction and correlated directly with impedance spectroscopy observations of electrochemical characteristics and stability. All STF compositions exhibited good phase and polarization resistance stability in the perovskite structure for a pH2/pH2O ratio of 1. However, decomposition occurred in more reducing fuels (pH2/pH2O ≥ 10), into Ruddlesden–Popper (R–P) perovskite, strontium oxide, and metallic Fe, after an incubation time of ∼2–4 h, the same time frame over which polarization resistance increased rapidly. That is, the results show a clear correlation between phase decomposition and rapid electrochemical degradation. The results suggest that the R–P transformed oxide was less electrochemically active despite the presence of exsolved Fe. Decreasing the Fe content x resulted in slower and reduced decomposition, but slightly higher initial polarization resistance values.
Introduction
New and improved electrode materials are of interest for a next generation of solid oxide cells (SOCs) aiming to achieve improved performance, better long-term stability, and the ability to operate over a wide range of conditions.1–3 One area of active interest is the use of Mixed Ionic and Electronic Conducting (MIEC) oxide fuel electrodes to avoid the drawbacks of Ni cermet electrodes.4 Many prospective MIEC electrode materials possess the ABO3 perovskite crystal structure5,6 and, as such, they lack a metallic catalyst that can help promote the overall hydrogen oxidation or steam reduction processes. Thus, perovskite electrode characteristics are often improved by the addition of catalyst nanoparticles, either via infiltration or a process called exsolution. In exsolution, the oxide of a catalytically active transition metal is dissolved in a host metal oxide lattice and then is preferentially reduced;7 the resulting metallic nanoparticles are well-dispersed and exhibit good stability against coarsening due to their characteristic “socketing” in the host lattice surface.8 As shown previously, exsolution can substantially reduce fuel electrode polarization resistance,9–12 likely by promoting hydrogen dissociation.13 Exsolution has been applied in a range of applications such as methane reforming, power generation from ammonia, and solid state protonic devices.14The present study focuses on the phase evolution during the active exsolution process for the case of a SOC fuel electrode. Ideally, exsolution should be a self-limiting process where, after the reducible cation(s) have been reduced to metal nanoparticles decorating the oxide surface, the remaining oxide phase remains stable. However, exsolution of B-site cations may leave the host lattice in an A-site enriched state (depending on initial stoichiometry). This, along with the reduction in oxygen content upon exposure to a reducing gas ambient, can affect the perovskite phase stability. Exsolution in some systems has been shown to yield a phase transformation from the ABO3 perovskite phase to an An+1BnO3n+1 Ruddlesden–Popper (R–P) perovskite,15–21 but the effect of this phase transformation on electrode performance is generally not distinguished from the effects of exsolution. It is not known if the R–P phase corresponding to a given perovskite has MIEC properties that make it an inferior electrode, or if volume changes associated with the transformation may degrade the electrode. Thus, it is important to know whether the perovskite structure of an electrode material is stable during exsolution and, failing that, if the R–P phase is stable and provides desirable performance.
In this study, we focus on the phase changes that occur upon reduction of the perovskite fuel electrode Fe-substituted strontium titanate (SrTi1−xFexO3−δ, STF), which has been applied successfully as a SOC fuel electrode.22–24 STF is often substituted with Ni or Ru to promote Ni–Fe or Ru–Fe nanoparticle exsolution and thereby improve fuel electrode performance.11,25,26 In these cases, the driving force for exsolution should be far greater than that of any decomposition process to ensure stable electrode performance. However, the present study aims to determine the stability of the base oxide STF; note that Fe exsolution has been observed from STF.22 Since exsolution of cations such as Ni and Ru is generally nearly complete, leaving the oxide as essentially pure STF, the results of this study are relevant not only to STF but also STF substituted with other exsolving cations. Most work to date on STF-based fuel electrodes has been for the x = 0.7 composition, so little is known about the stability and performance of other compositions. The present study expands the range of SrTi1−xFexO3−δ, to include x = 0.5 (STF-5), x = 0.6 (STF-6), x = 0.7 (STF-7), and x = 0.8 (STF-8). Prior work on these compositions has shown that both STF-5 and STF-8 decompose at 850 °C under highly reducing conditions with STF-8 having also been shown to decompose at 700 °C, albeit more slowly.27 The aim is to determine the thermodynamic stability of each composition in a range of fuel compositions, to observe phase transformations, and to correlate these results with the material's electrochemical performance. To ensure that sluggish kinetics do prevent characterization of phase transformations, all experiments take place at 850 °C. Both ex situ and in situ X-ray diffraction (XRD) are used to examine bulk structural changes and scanning-transmission electron microscopy (STEM) is used in conjunction with energy dispersive X-ray spectroscopy (EDS) to determine morphological and compositional changes. The performance of STF fuel electrodes is examined using symmetric cells.
Experimental
Materials synthesis and sample fabrication
SrTi1−xFexO3−δ with x = 0.5 (STF-5), x = 0.6 (STF-6), x = 0.7 (STF-7), and x = 0.8 (STF-8) powders were synthesized from stoichiometric ratios of SrCO3 (Sigma Aldrich, 99.9%), TiO2 (Alfa Aesar, 99.9%), and Fe2O3 (Alfa Aesar, 99.8%), as discussed elsewhere.27 The powders were ball milled in ethanol on a roller mill using spherical zirconia ball milling media for 24 hours prior to sintering at 1100 °C for 10 hours. After sintering, the STF powder was once again ball milled for 24 hours in ethanol. For cell testing, STF and GDC powders were suspended in a binder (V-737, Heraeus) with a 1![[thin space (1/6-em)]](https://www.rsc.org/images/entities/char_2009.gif) :1.2 powder:binder weight ratio. GDC ink was screen printed onto commercial SSZ substrates (Hionic 2.0, FuelCellMaterials) as a reaction barrier between SSZ and STF and fired at 1400 °C for 2 hours. Prepared STF inks were then printed onto the GDC barrier layer and fired at 1050 °C for 4 hours. Finally, gold current collection grids (Au-I ink, FuelCellMaterials) were screen printed onto STF electrodes. For all reductions, samples were heated in air, followed by 30 minutes in inert gases (Ar, N2) prior to reduction. Unless otherwise specified, a nominal gas flow rate of 100 sccm was utilized.
:1.2 powder:binder weight ratio. GDC ink was screen printed onto commercial SSZ substrates (Hionic 2.0, FuelCellMaterials) as a reaction barrier between SSZ and STF and fired at 1400 °C for 2 hours. Prepared STF inks were then printed onto the GDC barrier layer and fired at 1050 °C for 4 hours. Finally, gold current collection grids (Au-I ink, FuelCellMaterials) were screen printed onto STF electrodes. For all reductions, samples were heated in air, followed by 30 minutes in inert gases (Ar, N2) prior to reduction. Unless otherwise specified, a nominal gas flow rate of 100 sccm was utilized.
Materials characterization
STF powders were characterized using ex situ powder XRD analysis (Rigaku Smartlab and Scintag XDS-2000) and in situ powder XRD analysis (Rigaku Smartlab Gen2 with Anton Paar Reaction Chamber XRK 900) using Cu Kα radiation. Ex situ measurements were done during 4 h furnace treatments at 850 °C in 50% H2–50% H2O, 91% H2–9% H2O, and 97% H2–3% H2O gas mixtures that are typically present at various points in operating SOC stacks. For in situ powder XRD analysis, a scan speed of 5° min−1 was utilized, allowing for 13.25 scans of from 28–48° 2θ/hour accounting for instrument resetting. This is as close to continuous measurements as was reasonably achievable while maintaining the needed 2θ resolution. By ensuring a scan rate with full measurements lasting less than 5 minutes, XRD patterns could be considered relatively stationary, with higher 2θ values being unaffected by phase changes occurring as the X-ray detector measured signals in intermediate 2θ ranges. Dilute H2/H2O mixtures, used instead of pure H2/H2O due to in situ instrument constraints, were created by mixing 3% H2 in N2 and 3% H2O in N2 at a nominal total flow rate of 400 sccm. Note that the effective oxygen partial pressure in the fuel depends only on the H2/H2O partial pressure ratio, so the dilute mixtures are effectively identical to pure gases for the present equilibrium measurements. Thus, the in situ gas compositions corresponding to 50% H2–50% H2O was 97% N2–1.5% H2–1.5% H2O (pO2 = 1.3 × 10⁻¹⁸ atm), to 91% H2–9% H2O was 97% N2–2.7% H2–0.3% H2O (pO2 = 1.3 × 10⁻²⁰ atm), and to 97% H2–3% H2O was 97% N2–2.91% H2–0.09% H2O (pO2 = 1.2 × 10⁻²¹ atm). All peak identifications were performed using XRD patterns obtained through the Materials Project.28 Powder particles were imaged and compositionally mapped using a HD2300 Dual EDS Scanning Transmission Electron Microscope (Hitachi, Ltd).EIS measurements were conducted using an Ivium Vertex potentiostat in combination with a HiMUX multiplexer (Ivium Technologies) in a frequency range from 0.1 to 104 Hz and an excitation amplitude of 10 mV using a 4-point probe and automatic current range determination. For fitting purposes, only impedance data for f < 1 kHz were utilized as higher frequency measurements were dominated by interference from the potentiostat. Measured data was analyzed using an in-house python batch-analysis script utilizing the impedance.py package29 and a complex nonlinear least squares solver.
Results and discussion
Results on the phase structure of different STF compositions in different fuel compositions are presented first. The ex situ XRD results provide an overview of the phases present. The in situ XRD generally confirmed the validity of the ex situ measurements, i.e., the phases observed in situ at high temperatures persisted upon cooling to room temperature prior to the ex situ measurements. Of course, the in situ measurements allow for real-time observation of the phase evolution. Transmission electron microscopy (TEM) measurements are then presented that show the morphology changes upon reduction and the associated phase changes. Finally, electrochemical measurement results are presented for cells maintained under the different fuel compositions.Ex situ X-ray diffraction measurements
XRD data was collected from STF powder reduced at 850 °C for at least 4 h; the relatively high temperature was used to yield fast transport kinetics such that the material is expected to approach equilibrium. Reductions were done in 50% H2–50% H2O, 91% H2–9% H2O, and 97% H2–3% H2O (corresponding to pH2/pH2O ratios = 1, 10, and 39, respectively). The results for STF-7 are shown in Fig. 1. STF-7 prior to reduction showed only perovskite peaks in the XRD scans for all STF compositions. The same is true after reduction in the less reducing pH2/pH2O = 1 and pH2/pH2O = 10 fuel compositions. Since the pH2/pH2O = 1 condition is significantly less reducing than the other tested conditions, we would expect slower kinetics for the development of any side phases. Therefore, these reductions were undertaken for 72 hours to ensure the perovskite is fully stable. For pH2/pH2O = 39, Fig. 1 shows evidence that a Ruddlesden–Popper (R–P) phase was present, even though the perovskite and R–P peaks are partially overlapped. However, the presence of an α-Fe phase could not be confirmed because the reflections expected were mostly overlapped with R–P peaks; other measurements showing the presence of Fe in this condition are presented later. Ex situ X-ray results for other STF compositions are similar27 and shown in Fig. S1 in the ESI.† | ||
| Fig. 1 Ex situ XRD patterns of as-prepared STF-7 and after reduction in different H2/H2O ratios at 850 °C for 4 h. | ||
In situ X-ray diffraction measurements
In situ XRD was carried out on STF-5 and STF-8 during reduction in various gas compositions at 850 °C. The 2θ range from 28–48° was chosen to allow for full characterization of the perovskite by including its (110), (111), and (200) peaks.30 Crucially, the (111) perovskite peak does not overlap with any R–P peaks.Fig. 2 through Fig. 4 display heatmap representations of the in situ XRD data from STF-5 and STF-8 with pH2/pH2O = 1, 10, and 39. In pH2/pH2O ratios = 1, only the cubic perovskite peaks were observed over 24 h, the (110) reflection at ≈32°, the (111) at ≈39.5°, and the (200) at ≈46° (note that these peaks were shifted relative to Fig. 1 due to the larger lattice spacings at the higher measurement temperature). This shows that there was no detectable new phase formation, consistent with the above ex situ results for STF-7. In the more reducing pH2/pH2O = 10 fuel (Fig. 3) and most reducing pH2/pH2O = 39 fuel gas conditions, STF-5 and STF-8 decomposed into an R–P phase. However, while STF-5 still has a significant perovskite phase fraction, as seen through the presence of (111) peak intensity up through 24 h, the (111) peak intensity in STF-8 is mostly eliminated over 24 h, indicating complete decomposition of the perovskite. Furthermore, for STF-8, the full decomposition of the perovskite phase is indicated by the complete disappearance of the (110) and (200) perovskite peaks and the appearance of R–P phase peaks after ∼2–3 h of reduction. Due to the overlap between the R–P and α-Fe phase reflections, this data does not show whether the α-Fe is present when the decomposition occurs.
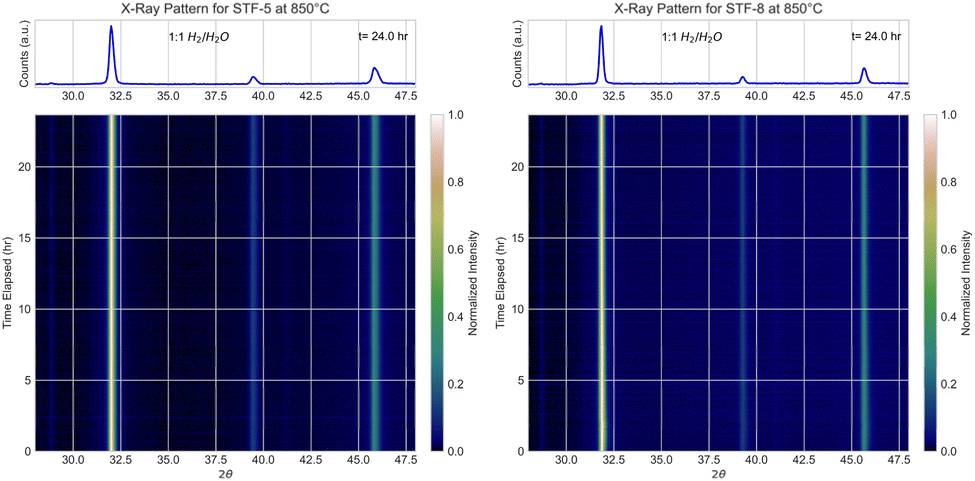 | ||
| Fig. 2 In situ XRD patterns of STF-5 and STF-8 in in pH2/pH2O = 1 at 850 °C. The heatmaps present 2θ values along the x-axis, time in hours along the y-axis, and intensity through a color gradient with increasing intensity corresponding to a brighter pixel. | ||
 | ||
| Fig. 3 In situ XRD patterns for STF-5 and STF-8 in pH2/pH2O = 10 at 850 °C. | ||
Fig. 3 and 4 show that there is an incubation period of ≈2 h preceding decomposition. The incubation period and degree of decomposition can be quantified by tracking the change in normalized relative intensity of the perovskite (111) peak at 2θ ≈ 40°, which does not overlap with an R–P peak, as shown in Fig. 5 for pH2/pH2O = 39. For other pH2/pH2O ratios, refer to Fig. S3.†Table 1 summarizes the observed incubation periods and the periods over which decomposition occurs (based the period of most intense decrease in the strength of the (111) perovskite peak). Increasing the Fe content in STF and decreasing pO2 decreases both the incubation period and the time to initial decomposition. Additionally, the material decomposes more completely into the R–P phase for STF-8 than for STF-5, as shown through the appearance of an additional phase over 24 hours. This phase could not be definitively identified, but evidence suggests it may be a rock salt SrO phase. It is notable that the appearance of the α-Fe phase does not precede the appearance of the R–P phase in any composition characterized here. However, the overlap between α-Fe and R–P phase peaks makes it impossible to make a definitive claim as to whether the appearance of the α-Fe and R–P phases coincides, or whether the decomposition to the R–P phase triggers the reduction of iron to α-Fe. The ex situ results in Fig. 1 are generally consistent with the in situ reductions in Fig. 2–4, where longer reductions generally led to more complete conversion to R–P. Based on both in situ and ex situ XRD patterns, it appears as though the incubation time and subsequent transformation may be related to a gradual decrease in the oxygen content during exposure to the reducing fuel.
 | ||
| Fig. 4 In situ XRD patterns for STF-5 and STF-8 in pH2/pH2O = 39 at 850 °C. | ||
 | ||
| Fig. 5 Relative intensity of (111) perovskite peaks during powder reduction in pH2/pH2O = 39 at 850 °C. | ||
| Material | Incubation period pH2/pH2O = 10 (h) | Decomposition duration pH2/pH2O = 10 (h) | Incubation period pH2/pH2O = 39 (h) | Decomposition duration pH2/pH2O = 39 (h) |
|---|---|---|---|---|
| STF-5 | 2.2 | 2.6 | 1.4 | 2.6 |
| STF-8 | 1.6 | 2.4 | 1.2 | 2.4 |
Note that monitoring the X-ray diffraction patterns of powders during cooling has previously shown some structural rearrangement from the R–P towards the perovskite phase when cooling at a relatively slow rate (5 °C min−1 or slower), complicating the comparison between the ex situ XRD patterns taken at room temperature and the in situ taken at high temperature. This is shown for STF-8 after reduction in pure H2 in Fig. S2 in the ESI.†
STEM-EDS observations
Scanning Transmission Electron Microscope – Energy Dispersive X-ray Spectroscopy (STEM-EDS) was used to compositionally map STF powders. This is particularly useful for observing the Fe phase, which is obfuscated by overlaps with R–P peaks in the above XRD. All powders used for these EDS measurements had first been reduced while conducting in situ XRD measurements. To ensure that phases present at room temperature closely match the phases observed at operating conditions, a further XRD scan was conducted at room temperature after cooling at a nominal rate of 10 °C min−1. These scans show good phase continuity before and after cooling. This means that the particles shown below have bulk phase compositions as shown in the in situ XRD heatmaps in Fig. 2–4.Fig. 6 shows that under the least reducing conditions tested (pH2/pH2O = 1), Sr, Ti, and Fe contents were homogeneous throughout all particles for STF-8, apart from a few localized regions with a higher Fe content. This agrees with the XRD data in Fig. 2 showing no evidence of decomposition.
 | ||
| Fig. 6 Images and EDS maps of Sr, Ti, and Fe taken from STF-8 powder reduced in pH2/pH2O = 1 for 24 hours at 850 °C. The left and right sides show two different representative regions. | ||
Fig. 7 shows images and EDS maps of two different regions of STF-8 after reduction in pH2/pH2O = 39. Significant decomposition is seen; some regions have decomposed into separate pure Fe particles and Sr- and Ti-rich oxide particles only, but in other regions an additional Sr-rich phase is observed. The EDS spectrum for a representative SrO particle (Fig. 8) confirms that these are essentially pure SrO, as no Fe or Ti can be detected. Cu, C and Al peaks in the EDS spectrum are presumably from the Cu/C TEM grid and the Al sample holder, respectively.
 | ||
| Fig. 7 EDS maps of STF-8 reduced in pH2/pH2O = 39 for 24 hours at 850 °C. The left and right sides show two different types of decomposition that are typically observed. The left side shows a region that has decomposed into separate Fe and Sr- and Ti-rich particles. The right side shows a region with the same decomposition but with the presence of an additional Sr-rich phase. | ||
 | ||
| Fig. 8 Image, EDS map, and EDS spectrum observed at a typical SrO growth from STF-8 reduced in pH2/pH2O = 39 for 24 hours at 850 °C. | ||
Fig. 9 shows images and EDS maps from STF-5 powder after reduction in pH2/pH2O = 39. The results here appear to be intermediate between Fig. 6 and 7, with considerable apparent Fe exsolution but with some residual Fe remaining in the Sr and Ti rich regions, suggesting that the original oxide remains partially intact for this lower Fe content despite the highly reducing conditions. Minimal SrO growths were present in some areas, but less prevalent than in STF-8 (Fig. 7). One such growth can be seen in the vertical, dendrite-like branch emerging roughly from the middle of the particle agglomeration in the right-hand electron micrograph. This branch-like structure, similar to the far larger branches found in STF-8, is fully devoid of Ti and Fe. The lower prevalence of SrO is reasonable given that when the original perovskite decomposes into Fe and oxide, a larger fraction of the B-site Ti remains that can be mostly accommodated by changing to a Sr-rich R–P structure.
 | ||
| Fig. 9 EDS maps of STF-5 reduced in pH2/pH2O = 39 at 850 °C. The left and right sides show two different representative regions. | ||
The appearance of SrO in STF under reducing conditions is previously unreported, to our knowledge. Although no SrO phase can be clearly identified in the above XRD scans, this is due to the close overlap between the major perovskite and phase peaks at ≈32° and the (111) and (200) peaks of SrO. The EDS maps definitively show that the decomposition of STF not only yields Fe-rich regions (identified through XRD as α-Fe), but eventually yields SrO particles, indicating a full decomposition of the perovskite.
Symmetric cell electrochemical impedance spectroscopy (EIS)
Fig. 10 shows Nyquist and Bode plots of EIS measurements that were designed to explore how STF instabilities affect electrochemical performance stability. The results shown are for cells in pH2/pH2O = 1 and pH2/pH2O = 10, after ∼5 h of testing and after 200 h of testing. The response is dominated by a low-frequency arc that has previously been associated with the surface charge transfer and ionic transport processes in the STF electrode.13 The small higher frequency response has been discussed as charge transfer at the electrode/electrolyte interface.13 The overall polarization resistance Rp increases with testing time for both fuel compositions, but the increase is much larger for the 10:1 ratio.
 | ||
| Fig. 10 Representative Nyquist and Bode plots for STF-7. The high frequency intercept is set to zero in the Nyquist plot, to clearly show changes in the polarization characteristics. | ||
Fig. 11 shows Rpversus time taken from EIS data for STF-7 such as that shown in Fig. 10, with an additional test at pH2/pH2O = 39 included. Rp increases with time in all cases, but there is a much more pronounced increase between ∼5 and 20 h for the higher pH2/pH2O tests. The relatively slow increase for pH2/pH2O = 1 may be due to normal electrode break-in. Note that similar results are observed for the other electrode compositions as shown in Fig. S4 in the ESI† with large Rp increases for the more reducing fuel compositions that correlate with decomposition of the STF perovskite phase. The large Rp increase over the first ∼20 h correlates well with the pH2/pH2O values for which phase changes are observed by XRD and EDS as shown above, suggesting that the phase changes are the cause of the degradation. This is shown more clearly in Fig. 12, which gives the time dependences of both Rp and the (111) peak intensity from in situ XRD data, for STF-5 and pH2/pH2O = 10. STF-5 was chosen because it decomposes the most slowly, thereby making it easier to resolve the time-dependent changes. The onset of decomposition as indicated by a rapid drop in (111) peak intensity corresponds closely to with a rapid increase in Rp. However, it is not clear whether the Rp increase results from the perovskite to R–P transformation, because the R–P phase may have inferior electrochemical properties, or the appearance of the insulating SrO phase. The initial fast decrease in Rp in the first hour of testing, seen for the more reducing gas compositions, may be connected to a rapid increase in oxygen vacancies leading to improved ionic conductivity and decreased polarization resistance.
 | ||
| Fig. 11 Polarization resistance for STF-7 at 850 °C. | ||
 | ||
| Fig. 12 Comparison of polarization resistance and perovskite phase fraction for STF-5 in pH2/pH2O = 10. | ||
Conclusions
Sr(Ti1−xFex)O3−δ (STF-x) electrode compositions with 0.5 ≤ x ≤ 0.8 showed significant crystallographic instabilities under highly reducing fuel conditions (pH2/pH2O ≥ 10) in in situ and ex situ XRD, forming metallic Fe and a Ruddlesden–Popper phase. The lower Fe content (lower x) STF compositions showed somewhat higher stability; however, they are still not stable enough for use as SOC electrodes in highly reducing environments. The decomposition of the perovskite appears to cause a clear decrease in electrochemical performance in the first ∼20 hours of operation in highly reducing conditions for all compositions tested. All compositions of STF show full stability in 50% H2, 50% H2O, however, which indicates that in less reducing conditions (e.g., as used in electrolysis), STF is still likely to be a viable SOC fuel electrode. Thus, exsolution-active fuel electrode materials such as Ni-doped and Ru-doped STF can be considered for such applications with moderate pH2/pH2O ratios. While the initial exsolution of Fe may help further catalyze reactions, the decomposition and accompanying increase in charge transport resistance of the bulk electrode would decrease the catalytic benefits of Ni or Ru electrocatalytic doping. To expand the stability window of STF in highly reducing condition, decreasing the Fe:Ti B-site ratio to decrease the equilibrium oxygen vacancy concentration may represent a viable strategy for expanding the stability window of STF. Similarly, increasing the oxidation state of cations on the A-site or B-site of the perovskite through substitution might be pursued for improved stability. However, such substitutions may decrease ionic conductivity in STF, leading to worse overall electrode performance.
Data availability
Data for this article, including animations as well as raw data for EIS and XRD are available at https://github.com/pantomim/STF_Stability/.Conflicts of interest
There are no conflicts to declare.Acknowledgements
The authors gratefully acknowledge financial support by the Department of Energy Basic Energy Sciences under grant # DE-SC0016965. This work made use of the Jerome B. Cohen X-Ray Diffraction Facility supported by the MRSEC program of the National Science Foundation (DMR-1720139) at the Materials Research Center of Northwestern University and the Soft and Hybrid Nanotechnology Experimental (SHyNE) Resource (NSF ECCS-1542205). This work also made use of the BioCryo facility (RRID:SCR_021288) of Northwestern University’s NUANCE Center, which has received support from the SHyNE Resource (NSF ECCS-2025633), the IIN, and Northwestern's MRSEC program (NSF DMR-2308691).References
- T. Mori, R. Wepf and S. P. Jiang, J. Phys.: Energy, 2020, 2, 031001 CAS.
- M. Shen, F. Ai, H. Ma, H. Xu and Y. Zhang, iScience, 2021, 24, 103464 CrossRef CAS PubMed.
- W. Zhang, J. Wei, F. Yin and C. Sun, Mater. Chem. Front., 2023, 7, 1943–1991 RSC.
- X. Shao, R. A. Budiman, T. Sato, M. Yamaguchi, T. Kawada and K. Yashiro, J. Power Sources, 2024, 609, 234651 CrossRef CAS.
- M. Bilal Hanif, M. Motola, S. qayyum, S. Rauf, A. khalid, C.-J. Li and C.-X. Li, Chem. Eng. J., 2022, 428, 132603 CrossRef CAS.
- A. N. Zainon, M. R. Somalu, A. M. Kamarul Bahrain, A. Muchtar, N. A. Baharuddin, M. A. S. A., N. Osman, A. Abdul Samat, A. K. Azad and N. P. Brandon, Int. J. Hydrogen Energy, 2023, 48, 20441–20464 CrossRef CAS.
- K. Kousi, C. Tang, I. S. Metcalfe and D. Neagu, Small, 2021, 17, 2006479 CrossRef CAS PubMed.
- D. Neagu, T.-S. Oh, D. N. Miller, H. Ménard, S. M. Bukhari, S. R. Gamble, R. J. Gorte, J. M. Vohs and J. T. S. Irvine, Nat. Commun., 2015, 6, 8120 CrossRef PubMed.
- C. Arrivé, T. Delahaye, O. Joubert and G. Gauthier, J. Power Sources, 2013, 223, 341–348 Search PubMed.
- Y. Gao, D. Chen, M. Saccoccio, Z. Lu and F. Ciucci, Nano Energy, 2016, 27, 499–508 Search PubMed.
- T. Zhu, H. E. Troiani, L. V. Mogni, M. Han and S. A. Barnett, Joule, 2018, 2, 478–496 Search PubMed.
- D.-M. Amaya-Dueñas, G. Chen, A. Weidenkaff, N. Sata, F. Han, I. Biswas, R. Costa and K. A. Friedrich, J. Mater. Chem. A, 2021, 9, 5685–5701 RSC.
- T. Zhu, D. E. Fowler, K. R. Poeppelmeier, M. Han and S. A. Barnett, J. Electrochem. Soc., 2016, 163, F952–F961 CrossRef CAS.
- D. Neagu, J. T. S. Irvine, J. Wang, B. Yildiz, A. K. Opitz, J. Fleig, Y. Wang, J. Liu, L. Shen, F. Ciucci, B. A. Rosen, Y. Xiao, K. Xie, G. Yang, Z. Shao, Y. Zhang, J. M. Reinke, T. A. Schmauss, S. Barnett, R. Maring, V. Kyriakou, U. Mushtaq, M. N. Tsampas, Y. Kim, R. O’Hayre, A. J. Carrillo, T. Ruh, L. Lindenthal, F. Schrenk, C. Rameshan, E. I. Papaioannou, K. Kousi, I. Metcalfe, X. Xu and G. Liu, J. Phys.: Energy, 2023, 5, 031501 Search PubMed.
- C. Yang, J. Li, Y. Lin, J. Liu, F. Chen and M. Liu, Nano Energy, 2015, 11, 704–710 Search PubMed.
- H. Arandiyan, Y. Wang, J. Scott, S. Mesgari, H. Dai and R. Amal, ACS Appl. Mater. Interfaces, 2018, 10, 16352–16357 Search PubMed.
- Z. Wang, Y.-M. Yin, Y. Yu, Y. Song, Z.-F. Ma and J. Yin, Int. J. Hydrogen Energy, 2018, 43, 10440–10447 Search PubMed.
- S. Park, Y. Kim, Y. Noh, T. Kim, H. Han, W. Yoon, J. Choi, S.-H. Yi, W.-J. Lee and W. B. Kim, J. Mater. Chem. A, 2019, 8, 138–148 Search PubMed.
- M. Qin, T. Tan, K. Li, Z. Wang, H. Yang, Z. Liu, M. Zhou, T. Liu, C. Yang and M. Liu, Int. J. Hydrogen Energy, 2020, 45, 21464–21472 CrossRef CAS.
- T. Tan, M. Qin, K. Li, M. Zhou, T. Liu, C. Yang and M. Liu, Int. J. Hydrogen Energy, 2020, 45, 29407–29416 Search PubMed.
- X. Xi, Z.-S. Cao, X.-Q. Shen, Y. Lu, J. Li, J.-L. Luo and X.-Z. Fu, J. Power Sources, 2020, 459, 228071 Search PubMed.
- A. Nenning, L. Volgger, E. Miller, L. V. Mogni, S. Barnett and J. Fleig, J. Electrochem. Soc., 2017, 164, F364–F371 Search PubMed.
- J.-H. Zhang, F.-Z. Han, C.-X. Li and S.-L. Zhang, J. Electrochem. Soc., 2022, 169, 044520 Search PubMed.
- F.-Z. Han, J.-H. Zhang, S.-L. Zhang and C.-X. Li, Ceram. Int., 2023, 49, 2410–2418 CrossRef CAS.
- R. Glaser, T. Zhu, H. Troiani, A. Caneiro, L. Mogni and S. Barnett, J. Mater. Chem. A, 2018, 6, 5193–5201 CAS.
- T. Zhu, H. Troiani, L. V. Mogni, M. Santaya, M. Han and S. A. Barnett, J. Power Sources, 2019, 439, 227077 CrossRef CAS.
- J. M. Reinke, T. A. Schmauss, Y. Zhang, D. Cox and S. A. Barnett, ECS Trans., 2023, 111, 475 CrossRef CAS.
- A. Jain, S. P. Ong, G. Hautier, W. Chen, W. D. Richards, S. Dacek, S. Cholia, D. Gunter, D. Skinner, G. Ceder and K. A. Persson, APL Mater., 2013, 1, 011002 Search PubMed.
- M. D. Murbach, B. Gerwe, N. Dawson-Elli and L.-k. Tsui, J. Open Source Softw., 2020, 5, 2349 CrossRef.
- S.-L. Zhang, D. Cox, H. Yang, B.-K. Park, C.-X. Li, C.-J. Li and S. A. Barnett, J. Mater. Chem. A, 2019, 7, 21447–21458 RSC.
Footnote |
| † Electronic supplementary information (ESI) available. See DOI: https://doi.org/10.1039/d4ta08700c |
| This journal is © The Royal Society of Chemistry 2025 |