
 Open Access Article
 This Open Access Article is licensed under a
 Creative Commons Attribution 3.0 Unported Licence
Synergistic effect of an oxygen-defective TiNb2O7 anode and lithiated polyacrylic acid for high-power lithium-ion storage†
Doosoo
Kim
a,
Siddhartha
Nanda
a,
Jong Heon
Kim
a,
Robson S.
Monteiro
b,
Luanna Silveira
Parreira
b and
Hadi
Khani
 *ac
*ac
aTexas Materials Institute and Materials Science and Engineering Program, The University of Texas at Austin, TX 78712, Austin, USA. E-mail: Hadi.Khani@austin.utexas.edu
bCompanhia Brasileira de Metalurgia e Mineração (CBMM), Gerais 38183903, Brazil
cWalker Department of Mechanical Engineering, The University of Texas at Austin, Austin, Texas 78712, USA
First published on 19th December 2024
Abstract
TiNb2O7 (TNO) is a promising anode material for lithium-ion batteries due to its higher power capability and theoretical capacity compared to traditional graphite anodes. This study addresses three issues with TNO: low electronic conductivity, time- and energy-consuming synthesis methods, and the absence of a stable interface with the electrolyte when discharged to below 1 V. The ultrafast (≈60 s) Joule heating method yields an oxygen-defective TNO (OD-TNO) with enlarged d-spacings and oxygen vacancies at the edge-shared octahedral sites, enhancing Li+ diffusion and increasing electronic conductivity by 60![[thin space (1/6-em)]](https://www.rsc.org/images/entities/char_2009.gif) 000 times. The use of a Li+-rich polyacrylic acid binder (Li50%-PAA) provides uniform, protective coverage around the TNO particles, resulting in better electrolyte stability and Li+ transport properties at the TNO/electrolyte interface. The charge storage mechanism in the OD-TNO/Li50%-PAA anode involves pseudocapacitive-type Li+ intercalation redox reactions for charging times of >40 minutes (scan rates < 1 mV s−1), while faster charging shows that the intercalation process occurs entirely through a diffusion mechanism. A full cell of an OD-TNO/Li50%-PAA anode with a LiNi0.5Mn1.5O4 cathode exhibits a capacity of 153.78 mA h g−1 over 400 cycles with 92.4% capacity retention at 1C, highlighting the practical potential of OD-TNO/Li50%-PAA for high-energy and high-power density Li+ storage.
000 times. The use of a Li+-rich polyacrylic acid binder (Li50%-PAA) provides uniform, protective coverage around the TNO particles, resulting in better electrolyte stability and Li+ transport properties at the TNO/electrolyte interface. The charge storage mechanism in the OD-TNO/Li50%-PAA anode involves pseudocapacitive-type Li+ intercalation redox reactions for charging times of >40 minutes (scan rates < 1 mV s−1), while faster charging shows that the intercalation process occurs entirely through a diffusion mechanism. A full cell of an OD-TNO/Li50%-PAA anode with a LiNi0.5Mn1.5O4 cathode exhibits a capacity of 153.78 mA h g−1 over 400 cycles with 92.4% capacity retention at 1C, highlighting the practical potential of OD-TNO/Li50%-PAA for high-energy and high-power density Li+ storage.
Introduction
Rechargeable lithium-ion batteries (LIBs) with high energy and power density, long cycle life, and reliable safety are considered a promising solution to meet the growing global demand for energy storage devices in consumer electronics and all-electric vehicles (EVs).1–4 However, the fast discharging of current LIBs poses a significant safety risk when flammable organic liquid electrolytes are used. This risk is due to the nucleation and growth of metallic dendrites on the carbon anode, which can cause internal short circuits, thermal runaway, and battery combustion.5,6 Graphitic carbon is currently the most widely used intercalation-type anode in LIBs, but it has inherent safety concerns because Li+ intercalation occurs at a potential close to that of lithium metal.7 At high discharge rates and under harsh operating conditions, such as charging at low temperatures, graphite electrodes become polarized to the point that reactive lithium metal dendrites can nucleate on the anode surface and cause “soft” short-circuiting of the cell.8 To overcome the limitations of carbon-based anodes, attention has turned to alternative anode materials with electrochemical redox couples for Li+ intercalation/deintercalation that are higher than the lithium plating/stripping potential, fall within the electrochemical stability window of the organic liquid electrolyte, and deliver more energy than graphite anodes at higher rates.9–11 As one alternative to graphite anodes, spinel Li4Ti5O12 (LTO) has gained prominence due to its “zero strain” behavior, offering advantages such as a higher operating potential (∼1.55 V vs. Li+/Li), minimal volume expansion during Li+ intercalation, and excellent thermal stability, leading to improved safety and cyclability. However, its widespread adoption has been hindered by its lower electronic conductivity and theoretical capacity compared to graphite (175 mA h g−1vs. 372 mA h g−1). Consequently, there is a need for an anode material with LTO-like characteristics but significantly higher specific capacity.12 Niobium-based oxides have emerged among the numerous transition-metal oxides as appealing anode candidates due to their non-toxicity, air- and water-stability, easy fabrication, and low-cost precursors.13–16 Among these, TiNb2O7 (TNO) with a Wadsley–Roth block phase stands out as the most promising candidate with three accessible redox couples (i.e., Ti4+/Ti3+, Nb5+/Nb4+, and Nb4+/Nb3+) within the electrochemical stability window of the organic liquid electrolyte. These redox reactions allow TNO to accommodate five lithium ions (i.e., TiNb2O7 + 5Li+ + 5e− → Li5TiNb2O7), delivering a maximum capacity of 388 mA h g−1, which is greater than that of a graphite anode (372 mA h g−1).17,18 Importantly, the potentials of these redox couples (i.e. Li+ intercalation/deintercalation) are high enough to preclude electrolyte decomposition and lithium dendrite nucleation at high rates, thereby improving battery safety under rigorous conditions (e.g., high power and low temperature).However, TNO has intrinsically poor electronic conductivity (<10−9 S cm−1) due to both Nb5+ and Ti4+ being in their d0 configuration, resulting in inferior rate capabilities. To enhance electronic conductivity and ionic diffusivity of TNO, various methods have been explored, including carbon coating,19,20 particle size reduction,21,22 metal-ion doping,23–25 and oxygen-defective engineering.26,27 In particular, defect engineering in bulk materials through oxygen vacancies introduces basic intrinsic defects capable of inducing lattice distortions, enhancing electronic conductivity and charge transport kinetics, thereby influencing the energy storage characteristics of electrode materials.28 However, existing methods for creating oxygen defects in metal oxides typically involve chemical or electrochemical reduction agents or vacuum sintering conditions.29 In this work, we employed a simple and scalable ultrafast heating method (≈1 minute) under an argon atmosphere to thermally reduce TNO (transition from the d0 to d1 configuration), creating oxygen vacancies at high temperatures (1250 °C), thereby boosting the electronic conductivity. Nevertheless, enhancing the electronic conductivity can lead to accelerated electrolyte decomposition on TNO materials, especially when discharged to below 1.0 V (vs. Li+/Li) due to the absence of a stable SEI layer.30 This is particularly significant because, while most attention has been focused on electrochemical performances above 1.0 V (vs. Li+/Li) to avoid the electrochemical reduction of the liquid electrolyte, there has been limited emphasis on achieving a high capacity close to the theoretical capacity of TNO (5 Li insertion), which requires a deeper discharge. Therefore, concurrent efforts to develop an artificial layer that can assist in forming a stable and low-resistance SEI layer, while shielding the liquid electrolyte from reduction at the TNO surface and allowing for rapid Li+ conduction, are essential.31,32 While SEI-forming additives or particle coatings have been widely used to create SEI layers in various battery materials, using polymeric binders to mimic the function of the SEI layer is a promising strategy.33,34 These polymeric binders serve as a multifunctional component: they provide particle-to-particle cohesion, mitigate volume expansion, enhance adhesion to the current collector, and play a key role in forming a stable SEI layer.35,36 Traditional poly(vinylidene fluoride) (PVDF) is the most widely used binder material for LIBs due to its excellent electrochemical stability. However, the PVDF binder has limitations, such as poor thermal stability and mechanical properties due to its weak van der Waals interactions with active materials and the current collector, which cannot withstand volume expansion of electrode materials.37,38 Additionally, the PVDF binder requires the use of the environmentally unfriendly solvent N-methyl-2-pyrrolidone (NMP), promoting extensive research into various polymeric binders, including carboxymethyl cellulose–styrene butadiene rubber, alginate, poly(vinyl alcohol), and poly(acrylic acid) (PAA).39,40 PAA has received particular attention for silicon and graphite anode materials because it provides better adhesion properties through hydrogen bonding between its carboxylate groups and the surface oxygen atoms of active materials and current collectors.41 Compared to the PAA binder, lithiated PAA (Lix-PAA) offers even more uniform and robust adhesion to the active materials due to its greater water solubility, enhanced elasticity, and higher coverage of hydrogen bonding between COOH groups and oxygen atoms on the surface of active materials.35,42 In this study, we have substituted 50% of the hydrogen atoms in PAA with lithium ions, utilizing it as a binder for TNO-based anodes. This modified binder serves a dual purpose: it not only bonds the particles together (TNO and carbon particles) and attaches them to the current collector but also ensures full coverage on TNO particles, thereby mitigating electrolyte decomposition while facilitating the transfer of lithium ions at the interface of TNO/electrolyte. Additionally, the lithiated PAA binder uses deionized water as the solvent, thereby eliminating the need for toxic NMP in conventional PVDF-based electrode slurry.
This study presents the ultrafast high-temperature synthesis (UHS) of oxygen-deficient TNO (TiNb2O6.93) materials (hereafter referred to as OD-TNO) using a Joule heating device, achieving synthesis in just 60 seconds. The resulting OD-TNO materials exhibit an electronic conductivity of 3.03 × 10⁻⁴ S cm−1, which is nearly 60000 times greater than that of TNO materials synthesized through conventional furnace-based methods (TiNb2O7, hereafter referred to as C-TNO) that require hours of heating at 1250 °C. This enhancement in conductivity is attributed to the partial transition from the d0 to d1 electronic configuration, enabled by oxygen deficiencies primarily on the edge-shared sites of TNO. These oxygen deficiencies coincide with the partial reduction of Ti4+ and Nb5+, leading to not only an enhancement in electronic conductivity but also an acceleration in Li+ diffusion in OD-TNO due to d-spacing expansion. This enhanced ionic and electronic conductivity has resulted in a 40.7% higher rate capability at 10C in OD-TNO compared to C-TNO. Additionally, this study demonstrates that replacing the conventional PVDF binder with lithiated PAA further increases the rate capabilities and significantly extends the life cycle of the TNO anode, reducing capacity loss from 59.4% in PVDF-based electrodes to less than 26.7% in Li-PAA-based electrodes when cells are discharged to 0.5 V (vs. Li+/Li) over 800 cycles. The full-cell, comprising an OD-TNO anode with 50% lithiation of the PAA binder paired with a high-voltage LNMO cathode, delivers a remarkable capacity (150 mA h g−1 at 1C rate), rate performance (31.8% capacity retention at 10C rate), and cycle life (98.9% capacity retention at the 100th cycle). Given the scalability and simplicity of the UHS process for TNO synthesis, it is well-suited for large-scale industrial applications. This study demonstrated that using the UHS process for synthesizing oxygen-deficient TNO, combined with incorporating a lithium-rich binder, offers a promising synergetic approach that not only reduces the synthesis cost and environmental impact but also enhances battery performance beyond that of conventional TNO with a PVDF binder.
Results and discussion
The overall synthesis process of both C-TNO and OD-TNO is schematically shown in Fig. 1a and explained in detail in the Experimental section. C-TNO is generally synthesized through a conventional solid-state method in a muffle furnace through a time- and energy-consuming process. Table S1† lists the various reported methods along with their corresponding experimental times (ranging from 3 to 96 hours) for the synthesis of TNO samples. In this work, densified pellets of OD-TNO were successfully synthesized using a one-step ultrafast high-temperature synthesis (UHS) system, operated via a Joule heating process. The experimental setup and operational principles of the UHS system have been documented in our previous studies.43,44 Initially, to investigate the effect of different phases of Nb2O5 precursors on the synthesis temperature of OD-TNO, we used three Nb2O5 precursors with monoclinic, orthorhombic, and mixed phases. The pure orthorhombic and monoclinic phases were obtained by sintering ammonium niobate oxalate hydrate for 5 hours at 700 and 1100 °C, respectively (Fig. S1†). Fig. S2 and S3† show the XRD patterns of TNO compounds synthesized using different Nb2O5 precursors at various synthesis temperatures. The results revealed that regardless of the phase of Nb2O5 precursors, impurities were observed up to 1000 °C synthesis temperature, while achieving pure TiNb2O7 required a minimum temperature of 1100 °C. This observation suggests that the orthorhombic Nb2O5 precursor must undergo a phase transition to the monoclinic phase at 1100 °C to obtain a pure TNO phase using the UHS method. The XRD result (Fig. S4†) of TNO prepared from a mixture of monoclinic and orthorhombic Nb2O5 at 1100 °C also shows a pure TNO phase, reinforcing the rapid transition of orthorhombic Nb2O5 to monoclinic Nb2O5 at 1100 °C, which is necessary to form the pure TNO phase. However, we chose to push the synthesis temperature even higher, reaching the maximum UHS temperature of 1250 °C, to induce the maximum oxygen deficiency through a rapid thermal shock to TNO within a short sintering time of 60 seconds. At such high temperatures, the transition from slow solid-state reactions to rapid liquid-phase assisted reactions occurs. This thermal shock significantly increases the contact area between reactants, resulting in higher levels of disorder within the system.45 Consequently, the diffusion of atoms or ions is enhanced, which is a crucial factor in determining the reaction rates of solid phases.46 As a result, the UHS system enables the synthesis of highly pure TNO at 1250 °C within seconds under an oxygen-free atmosphere, resulting in an oxygen-deficient TiNb2O7−x sample with a much darker color than the white C-TNO (Fig. 1a). The dark color of OD-TNO indicates a reduction in its band gap.28 Such a color change has also been observed in oxygen-deficient Ti2Nb10O29, resulting from the partial reduction of Ti4+ and Nb5+ to their lower oxidation states (i.e., Ti3+ and Nb4+) to maintain charge neutrality following the partial removal of oxygen.47 The crystalline structure and purity of C-TNO and OD-TNO were confirmed through XRD characterization. The results indicate that OD-TNO was successfully synthesized using the UHS system, despite the process requiring significantly less time compared to the C-TNO sample (60 s vs. 24 hours). Fig. 1b and c show that the XRD patterns of both samples are well-indexed with the monoclinic space group (C2/m) TiNb2O7 (JCPDS#: 01-070-2009), which features disordered Nb and Ti atoms along with a 2D interstitial space for Li insertion. In the 3 × 3 block TNO structure, each Ti and Nb atom is coordinated to six oxygen atoms, forming M-O octahedra at five distinct metal sites: M1–M5 (M: Nb/Ti) (Fig. 1d and e). These octahedra are connected through corner and edge sharing, creating a crystallographic-shear framework structure—a characteristic of Wadsley–Roth phases.48 The comparison of enlarged XRD patterns of the C-TNO and OD-TNO materials (Fig. 1c), however, reveals that all the peaks of OD-TNO are slightly (≈0.1° 2θ) shifted to a smaller angle compared to those of C-TNO, indicating that interplanar spacing and unit cell volume of OD-TNO are increased. In particular, the d-spacings for the (300) and (20![[6 with combining macron]](https://www.rsc.org/images/entities/char_0036_0304.gif) ) planes have increased from 3.44 and 3.40 Å in C-TNO to 3.46 and 3.41 Å in OD-TNO, respectively; this will be discussed in a later section. This increase in volume can be attributed to the larger ionic radius of Nb4+ (0.68 Å) and Ti3+ (0.67 Å), resulting from the partial thermal reduction of Nb5+ (0.64 Å) and Ti4+ (0.605 Å). These ions undergo reduction simultaneously as oxygen atoms are removed during the UHS of OD-TNO. Rietveld refinement was performed to fit the XRD experimental data using FullProf Suite software, as shown in Fig. S5.† The refined lattice parameters and agreement factors at convergence are reported in Table S2.† The refined unit cell parameters for OD-TNO (a = 20.363 Å, b = 3.797 Å, c = 11.885 Å, β = 120.208°, and V = 794.89 Å3) indicate a lattice expansion and a 0.07% increase in volume compared to C-TNO due to the presence of oxygen vacancies. To determine the concentration of oxygen vacancies in OD-TNO, thermogravimetric analysis (TGA) experiments were conducted by oxidizing OD-TNO at 1000 °C under a flow of pure O2 gas. The observed mass increase in OD-TNO before and after the experiment corresponded to the incorporation of oxygen atoms into the oxygen-deficient sites. Based on the recorded mass (with a resolution of 0.1 μg) at room temperature before and after the oxidation, the concentration of oxygen vacancies was calculated to be approximately 1% (corresponding to TiNb2O6.93). Furthermore, the powder color changed from dark to white after the experiment, further confirming the oxidation process.
) planes have increased from 3.44 and 3.40 Å in C-TNO to 3.46 and 3.41 Å in OD-TNO, respectively; this will be discussed in a later section. This increase in volume can be attributed to the larger ionic radius of Nb4+ (0.68 Å) and Ti3+ (0.67 Å), resulting from the partial thermal reduction of Nb5+ (0.64 Å) and Ti4+ (0.605 Å). These ions undergo reduction simultaneously as oxygen atoms are removed during the UHS of OD-TNO. Rietveld refinement was performed to fit the XRD experimental data using FullProf Suite software, as shown in Fig. S5.† The refined lattice parameters and agreement factors at convergence are reported in Table S2.† The refined unit cell parameters for OD-TNO (a = 20.363 Å, b = 3.797 Å, c = 11.885 Å, β = 120.208°, and V = 794.89 Å3) indicate a lattice expansion and a 0.07% increase in volume compared to C-TNO due to the presence of oxygen vacancies. To determine the concentration of oxygen vacancies in OD-TNO, thermogravimetric analysis (TGA) experiments were conducted by oxidizing OD-TNO at 1000 °C under a flow of pure O2 gas. The observed mass increase in OD-TNO before and after the experiment corresponded to the incorporation of oxygen atoms into the oxygen-deficient sites. Based on the recorded mass (with a resolution of 0.1 μg) at room temperature before and after the oxidation, the concentration of oxygen vacancies was calculated to be approximately 1% (corresponding to TiNb2O6.93). Furthermore, the powder color changed from dark to white after the experiment, further confirming the oxidation process.
 | ||
| Fig. 1 (a) Schematic illustration of the overall synthesis process for C-TNO and OD-TNO, (b) XRD patterns of C-TNO and OD-TNO, (c) enlarged views of XRD patterns, and (d and e) crystal structure of TNO showing T1 and T2 tunnels along with five distinct octahedral metal (Nb/Ti) sites. | ||
The microstructures of OD-TNO and C-TNO materials were characterized by TEM, with the results presented in Fig. 2. The TEM analyses were performed by using a scanning/transmission electron microscope equipped with a spherical aberration corrector for the probe-forming optics. Elemental mappings of O, Ti and Nb atoms for an OD-TNO particle in Fig. 2a–d show the uniform distribution of these elements throughout the nanoparticle used for HRTEM analysis. As shown in Fig. 2e, OD-TNO exhibits distinct lattice fringes with an interplanar spacing of 0.34 nm, corresponding to the (300) plane of TNO, which exhibited the highest peak intensity in the XRD pattern of OD-TNO (Fig. 1b). By adjusting specific zone axes with a double-tilt holder, the selected area electron diffraction (SAED) patterns of OD-TNO confirmed a single-crystal structure spot, as evidenced by the presence of characteristic dot diffraction spots (Fig. 2f). The SAED pattern was acquired along the [010] direction, where lithium ions are first intercalated. This pattern confirms the presence of the (300), (20), and (302) planes along the [010] direction, all of which were identified in the magnified XRD peaks (Fig. 1c). To quantitatively assess oxygen vacancies, high-angle annular dark field (HAADF) and annular bright field (ABF) techniques were employed. The green atoms in Fig. 2g represent Nb and Ti atoms that randomly occupy octahedral sites. Analysis of HAADF images for both C-TNO and OD-TNO samples in Fig. 2h and k, respectively, confirmed that the arrangement of green atoms depicted in Fig. 2g is repeated, indicating that the direction of the as-shown materials is along the [010] axis. In addition, the bright appearance of Ti and Nb atoms is attributed to the stronger electron scattering capability due to their higher atomic numbers (Z).49 Since the contrast of ABF images is highly sensitive to light elements such as oxygen, oxygen atoms that were not visible in the HAADF images are now visible in ABF images (Fig. 2i and l). As shown in Fig. 2g, the interatomic distances, labeled as a, b, and c, were measured for a total of 15 atoms, comprising 5 × a, 5 × b, and 5 × c, highlighted by a single yellow box in Fig. 2i and l. Notably, for the same number of atoms, the interatomic distance in OD-TNO is approximately 0.2 nm greater than that in C-TNO. This observation aligns with the XRD data of OD-TNO and C-TNO samples, indicating a larger interplanar spacing and unit cell volume for OD-TNO due to the partial thermal reduction of Nb5+ and Ti4+ to lower valence states with larger atomic radii, accompanied by the formation of oxygen vacancies. Furthermore, this finding is corroborated by the results of Raman and XPS experiments, as will be discussed later. In C-TNO synthesized by the conventional method, oxygen atoms are more clearly visible compared to OD-TNO, where the oxygen vacancies make the oxygen atoms appear fainter. Line profiles for oxygen atoms were analyzed in the yellow-boxed areas in Fig. 2i and l, with the results shown in Fig. 2j and m, respectively. The signal from C-TNO is much stronger than that of OD-TNO, apparently due to the presence of oxygen vacancies in OD-TNO.
 | ||
| Fig. 2 (a–d) TEM image of OD-TNO along with the corresponding elemental mapping of oxygen, titanium and niobium; (e) HRTEM image of OD-TNO; (f) selected area electron diffraction (SAED) pattern of OD-TNO; (g) crystal structure of a TiNb2O7 unit cell highlighted with green dots in (h), viewed along the [010] plane; (h) HAADF STEM image, (i) ABF STEM image, and (j) the line profile of oxygen intensities in C-TNO; (k) HAADF STEM image, (l) ABF STEM image, and (m) line profile along the oxygen intensities in OD-TNO. | ||
X-ray photoelectron spectroscopy (XPS) characterization was performed on C-TNO and OD-TNO samples to investigate their chemical compositions and valence states. Fig. S6† illustrates the XPS survey spectra, and Fig. 3a–c show the high-resolution XPS spectra of Nb 3d, Ti 2p, and O 1s for both C-TNO and OD-TNO. In the XPS Nb 3d spectrum of C-TNO, two characteristic peaks corresponding to Nb5+ 3d3/2 (209.6 eV) and Nb5+ 3d5/2 (206.8 eV) confirm that Nb exists in the 5+ charge state in C-TNO. Similarly, the Ti 2p spectrum of C-TNO exhibits two peaks assigned to Ti4+ 2p1/2 (464.1 eV) and Ti4+ 2p3/2 (458.4 eV).9 However, the high-resolution XPS spectra of Nb 3d and Ti 2p spectra for OD-TNO reveal broader peaks compared to those in C-TNO, which are also shifted to lower binding energies, indicating that Nb5+ and Ti4+ are partially reduced through a thermal reduction during the UHS process. The XPS O 1s of C-TNO shows peaks corresponding to lattice oxygen (Ti–O and Nb–O) at 529.5 eV and hydroxyl oxygen at 533.5 eV. In OD-TNO, the XPS O 1s spectrum shares similar peaks, with the addition of a hump at around 531.5 eV attributed to oxygen vacancies (Vo),50 confirming that partial thermal reduction of Nb5+ and Ti4+ occurs concurrently with the formation of oxygen-deficient sites in OD-TNO.
 | ||
| Fig. 3 XPS spectra of (a) Nb 3d, (b) Ti 2p, and (c) O 1s for C-TNO and OD-TNO; (d) Raman spectra of C-TNO and OD-TNO; current–time curves of (e) Al/C-TNO pellet/Al and (f) Al/OD-TNO pellet/Al under DC polarization at various applied constant voltages. | ||
Raman spectroscopy was employed to compare the metal–oxygen bonding forces in C-TNO and OD-TNO. Among the five octahedral metal sites (M1–M5, M: Nb/Ti) in the (3 × 3) TiNb2O7 structure (Fig. 1e), only the M1 site is purely corner-sharing, with no shared edges, while the M2, M3, M4, and M5 sites share two, four, three, and four octahedral edges, respectively. Raman spectra (Fig. 3d) of both samples show two bands at around 994 cm−1 and 881 cm−1, assigned to Nb–O bonds at the edge-shared and corner-shared NbO6 octahedra, and two other bands at 644 cm−1 and 535 cm−1 corresponding to Ti–O bonds at edge-shared and corner-shared TiO6 octahedra, respectively.51 The bands below 350 cm−1 are attributed to the vibrations of Nb–O and Ti–O bending or complex motions resulting from the interaction of the cations. Notably, the peaks corresponding to edge-shared NbO6 octahedra and edge-shared TiO6 octahedra in OD-TNO are slightly shifted to lower frequencies compared to those of C-TNO, while the Raman shift for corner-shared TiO6 and NbO6 octahedra remains unchanged. This shift suggests the presence of oxygen vacancies at the edge-shared NbO6 and TiO6 octahedral sites (M2, M3, M4, and M5) and is consistent with the lower bond strength of Nb4+–O and Ti3+–O compared to Nb5+–O and Ti4+–O bonds, respectively. The preference for oxygen vacancies at edge-shared sites, rather than at M1 sites, indicates that these sites are more energetically favorable for vacancy formation and that the crystal structure can accommodate defects more easily at these sites without significantly destabilizing the overall lattice.
The partial reduction of Nb5+ and Ti4+, transitioning from the d0 to d1 electronic configuration, is expected to provide intrinsic electronic conduction within the OD-TNO material. To assess the electronic conductivities of C-TNO and OD-TNO, the modified Hebb–Wagner method was adopted.52 This method uses two ion-blocking aluminum metal (Al) electrodes, ensuring that the measured current is solely attributable to current leakage. The UHS-prepared TNO pellets were sandwiched between these Al electrodes and assembled into a split-cell. Various constant voltages ranging from 100 mV to 500 mV were applied, and the corresponding steady-state current values were recorded over time at each voltage. The current–time curves for Al/C-TNO/Al and Al/OD-TNO/Al are shown in Fig. 3e and f, respectively. By analyzing the trend lines of the applied constant voltage and the obtained steady-state current, resistance values for each TNO pellet were derived (see the insets of Fig. 3e and f). The calculated electronic conductivities for C-TNO and OD-TNO are found to be 4.94 × 10⁻⁹ S cm−1 and 3.03 × 10⁻⁴ S cm−1, respectively. The results indicate that the electronic conductivity of OD-TNO is more than 60000 times larger than that of C-TNO. This increase in conductivity results from the introduction of free electrons into the structure (i.e., n-type doping), shifting the Fermi level from the valence band to the conduction band.45 A similar substantial increase in conductivity has also been observed when the insulating d0-TiNb2O7 (C-TNO) is electrochemically lithiated to form the electrically conductive Li0.25TiNb2O7, where the resistivity decreases from 1 × 10⁹ Ω cm to 5 × 101 Ω.48 Due to its significantly improved electronic conductivity, OD-TNO is expected to show improved rate performance in electrochemical cells compared to those based on C-TNO.
We initially investigated the electrochemical performance of C-TNO and OD-TNO mixed with the conventional PVDF binder and conductive Super P. The C-TNO pellets and the UHS-prepared pellets of OD-TNO underwent a planetary ball-milling process to reduce their particle size. SEM images (Fig. S7†) of both C-TNO and OD-TNO revealed irregularly shaped particles with sizes ranging from hundreds of nanometers to two microns, well-mixed with conductive Super P particles. This indicates that ball-milled TNO samples produced by both the conventional solid-state method and the UHS system have similar sizes, thereby minimizing differences in electrochemical performance attributable to size effects.
In Fig. 4a, the voltage profiles of the initial cycles of C-TNO and OD-TNO with a PVDF binder at 0.2C are presented. The discharge curves of the two samples exhibited the same redox profile with three distinct regions: a steep downslope from OCV (≈2.98 V) to 1.75 V attributed to the Ti4+/Ti3+ redox couple, a plateau in the voltage range of 1.7–1.4 V mainly contributed by mainly Nb5+/Nb4+ and partially by Ti4+/Ti3+ redox couples, and a long voltage drop from 1.4 to 0.5 V due to the Nb4+/Nb3+ redox couple.53 The initial discharge capacities of C-TNO and OD-TNO are 320.48 and 354.43 mA h g−1, with coulombic efficiencies of 83.5% and 81.78%, respectively. In the third cycle, however, the capacities of C-TNO and OD-TNO decrease to 258.93 and 280.4 mA h g−1, and coulombic efficiencies increase to 94.85 and 95.34%, respectively. The improved coulombic efficiency in the third cycle is attributed to the formation of an SEI layer that significantly reduces electrolyte reduction.
 | ||
| Fig. 4 Electrochemical performances of C-TNO/PVDF and OD-TNO/PVDF electrodes: (a) initial voltage profiles at 0.2C (solid and dashed lines indicate the 1st cycle and 3rd cycles, respectively), (b) rate capabilities, (c) cycling stability after rate capabilities at 1C; electrochemical performances of OD-TNO/PVDF and OD-TNO/Li50%-PAA electrodes: d) initial voltage profiles at 0.2C (solid and dashed lines indicate the 1st cycle and 3rd cycles, respectively), (e) rate capabilities; (f) schematic of the role of the Li-PAA binder (Li50%-PAA) with TNO materials; (g) long-term cycle stability of half-cells with OD-TNO/PVDF and OD-TNO/Li50%-PAA electrodes at 1C after cells were subjected to C-rate tests. For rate capabilities, the final (5th) cycle at each C-rate is reported. | ||
Fig. 4b compares the rate capabilities of the two samples from 0.2C to 10C. The results show that OD-TNO exhibited higher charge and discharge capacities than C-TNO at all C-rates, due to its enhanced electronic conductivity and larger unit cell volume. The larger unit cell volume of TNO, achieved through trace doping with metal ions having a larger ionic radius than Nb or Ti, has been reported to significantly promote lithium-ion diffusion kinetics by enlarging Li+ diffusion pathways.1,50,54 At discharge rates of 0.2, 0.5, 1, 2, 5, and 10C, C-TNO delivered discharge capacities of 243.95, 201.46, 175.52, 149.33, 112.96, and 84.5 mA h g−1, respectively. In comparison, OD-TNO demonstrated improvements in rate performance, delivering 264.10, 225.14, 201.56, 176.72, 143.86, and 118.86 mA h g−1, respectively, at the same current densities. By reducing the current densities from 10C (after 30 cycles) to 1C, the capacities were fully recovered to 177.86 mA h g−1 for C-TNO and 204.36 mA h g−1 for OD-TNO. However, we observed a 44.2 and 42.0% capacity decay for C-TNO and OD-TNO, respectively, from their initial capacities to 99.18 and 118.48 mA h g−1 after 300 cycles (Fig. 4c). This decay is attributed to the electrochemical decomposition of electrolytes when TNO is discharged to less than 1 V (vs. Li+/Li), indicating the inability of the formed SEI layer to prevent the electrolyte decomposition. The higher rate of electrochemical reduction (i.e., decomposition) of the electrolyte on OD-TNO is apparently due to its much higher electronic conductivity compared to C-TNO. Therefore, developing a stable SEI layer or a new coating method that can mimic the SEI function and isolate OD-TNO from direct contact with liquid electrolyte while allowing for the diffusion of lithium ions could be a promising solution to alleviate the capacity decay resulting from electrolyte decomposition.31,32
While PVDF has shown promising electrochemical, chemical, and mechanical properties as the most used electrode binder, it is an ion insulator binder and provides a nonuniform, porous coverage on active materials due to its semi-crystallinity and poor chemical interaction (e.g., van der Waals forces) with metal oxide particles.55 PVDF also tends to swell and gel in nonaqueous liquid electrolytes, allowing excessive transport of liquid electrolyte to the electrode surface in the event that the electrochemical decomposition of electrolyte is a concern. To overcome these shortcomings, a functionalized polymeric binder with the following features is required: (1) uniform, nonporous coverage on active material particles, (2) elastic adhesion between the TNO particles, TNO–carbon particles, and TNO-/carbon-current collector, and (3) the ability to transport lithium ions across the liquid electrolyte and TNO particles while providing a protective layer that minimizes the electrolyte decomposition at the electrode/electrolyte interface. Considering these properties, PAA-based binders can offer enhanced bonding capabilities through the hydrogen bonding provided by their carboxylic functional groups. Intramolecular hydrogen bonding within PAA chains, along with hydrogen bonds formed with active materials and a current collector, leads to significantly improved coverage and adhesion of the binder.33,56 To impart Li+-conducting properties to PAA, we substituted hydrogen ions with lithium ions at levels of 25%, 50%, and 75%. The resulting PAA-based binders are referred to as Li25%-PAA, Li50%-PAA, and Li75%-PAA hereafter, respectively. Compared to the PAA binder, the lithiated PAA (Lix-PAA) binder has been shown to provide stronger adhesion because PAA contains an agglomeration of –COOH groups due to a higher number of intermolecular/intramolecular hydrogen bonds. The substitution of lithium for hydrogen in the carboxylic groups promotes the polyacrylate chains to stretch due to electrostatic repulsion between adjacent –COOLi groups and increases the elasticity of the polymer, providing enhanced hydrogen bonding between COOH groups and oxygen atoms in the active electrode materials.35,42 For electrochemical comparison, different OD-TNO based electrodes with a PVDF binder, as well as four different PAA-based binders (PAA, Li25%-PAA, Li50%-PAA, and Li75%-PAA), were prepared and their electrochemical performances are illustrated in Fig. 4d, e, and S8.† Among PAA-based binders, the Li50%-PAA binder demonstrates superior electrochemical performance in terms of both rate performance and cycling stability. The effect of Li50%-PAA (denoted as Li-PAA in the figures) on enhancing the electrochemical properties is schematically illustrated in Fig. 4f. The improved cycling stability can be attributed to the optimal number of hydrogen bonds within the Li50%-PAA matrix, between the TNO surface and Li50%-PAA, and between Li50%-PAA and the current collector (Fig. S9†). The enhanced rate performance is due to the high concentration of lithium ions in the Li50%-PAA binder, which promotes efficient Li+ transport between the liquid electrolyte and TNO particles.
In Fig. 4d, voltage profiles of the first and third cycle for OD-TNO using PVDF and Li50%-PAA binders are presented. The initial discharge capacity of OD-TNO with a PVDF binder is 354.43 mA h g−1, with a coulombic efficiency of 81.78%. In comparison, the initial discharge capacity of OD-TNO with the Li-PAA binder is 370.74 mA h g−1, with a coulombic efficiency of 82.53%. Notably, after three cycles, the capacity for OD-TNO/Li50%-PAA decreases to 296.25 mA h g−1 while the coulombic efficiency increases to 99.0%. Similarly, the capacity of OD-TNO/PVDF dropped to 280.4 mA h g−1, with a coulombic efficiency of 95.3%. This decrease in capacity in the initial cycles is related to the electrolyte decomposition and the evolution of the SEI layer.30 The small plateau at around 0.75 V indicates the electrochemical reduction of the liquid electrolyte, which disappears after the formation cycles. Importantly, the coulombic efficiency of OD-TNO/Li50%-PAA remains above 99.8% after three formation cycles, with no significant capacity changes in the subsequent cycles (Fig. S10†). In contrast, OD-TNO/PVDF reaches a coulombic efficiency of 95.3% after three cycles, and the capacity continues to decay until the 10th cycle when the coulombic efficiency reaches an average value of 99.5%.
As shown in Fig. 4e, the results of rate capability tests from 0.2C to 10C demonstrate that OD-TNO with the Li50%-PAA binder exhibits better rate capabilities than with the PVDF binder, with capacities of 291.24, 267.85, 247.39, 221.44, 181.71, and 149.54 mA h g−1 at 0.2, 0.5, 1, 2, 5, and 10C, respectively. In comparison, OD-TNO with the PVDF binder shows capacities of 264.1, 225.14, 201.56, 176.72, 143.86, and 118.86 mA h g−1 at 0.2, 0.5, 1, 2, 5, and 10C, respectively. When the discharge rate is set back to 1C after 30 cycles, as shown in Fig. 4g, OD-TNO/Li50%-PAA achieves a recovered capacity of 247.12 mA h g−1 and retains 73.26% of this capacity after 800 cycles. In contrast, OD-TNO with the PVDF binder shows much faster capacity decay, maintaining only 40.6% of its initial capacity after 800 cycles. This is due to the lack of a stable SEI in OD-TNO/PVDF compared to OD-TNO/Li50%-PAA, resulting in continuous electrolyte decomposition at OD-TNO, as indicated by its lower coulombic efficiency (99.8% for OD-TNO/Li50%-PAA vs. 99.5% for OD-TNO/PVDF). The instability of the SEI layer in the TNO electrode with a PVDF binder is attributed to the formation of a thick SEI layer during lithium insertion, which partially brakes during subsequent lithium extraction, causing the SEI layer to gradually increase over long-term cycles.30 XRD analysis of binders shows that PVDF has a semi-crystalline structure, whereas PAA and Li50%-PAA exhibit amorphous characteristics (Fig. S11 and S12†). Amorphous materials are identified by broad, diffuse humps rather than sharp diffraction peaks, particularly in the low-angle region (5–30° 2θ), indicating the short-range atomic order typical of amorphous structures and the absence of long-range periodicity. Even after replacing 50% of the hydrogen atoms in its carboxylic groups with lithium ions, Li50%-PAA retained its amorphous characteristics, as confirmed by XRD results that showed no significant structural changes. Amorphous Li50%-PAA, as opposed to the semi-crystalline PVDF polymer, tightly envelops TNO, and significantly reduces the direct contact between the liquid electrolyte and the electronically conductive OD-TNO particles (Fig. 4f). However, we observed a drastic increase in the coulombic efficiency with both OD-TNO/Li50%-PAA and OD-TNO/PVDF in the third cycle, suggesting that the SEI layer is mostly formed in the first cycle, although it is more stable in the case of OD-TNO/Li50%-PAA. Our findings demonstrate that, in addition to Li50%-PAA forming a protective layer around the TNO surface to minimize the direct exposure of the active material to the electrolyte,33 it also contributes to the SEI formation in the initial cycle. This contribution could occur through the reduction of COOH groups to COOLi and/or by preferentially changing the local concentration of LiPF6 and solvents at the TNO surface, resulting in a stable SEI layer enriched with lithium compounds (e.g., LiF, LixPFyOz, and ROCOOLi).57,58
To corroborate the improved performance of OD-TNO with the Li50%-PAA binder, electrochemical impedance spectroscopy (EIS) was conducted on half cells with OD-TNO electrodes prepared with PVDF and Li50%-PAA binders. Fig. 5a displays the Nyquist plots of the as-prepared electrodes with the inset showing the equivalent circuit used for data fitting. The equivalent circuit includes two main components: a semicircle in the medium frequency range, indicating the charge transfer resistance (Rct) at the TNO/electrolyte interface with different binders, and the diagonal line at low frequencies (100–150 ohm), corresponding to the Warburg impedance associated with lithium-ion diffusion within the bulk of the TNO electrode.59 The calculated impedance values after fitting are shown in Table S3.† The Rs values, represented by the intercept of the semicircle at high frequency, correspond to the electrolyte and electrode resistance and are nearly identical across all electrodes (≈2–3 Ω). However, the charge transfer resistance (Rct) in OD-TNO electrodes with different binders varies significantly, emphasizing the role of lithium-ion accessibility in the charge transfer process. The Rct values, observed as the semicircles in the Nyquist plots, are 96.17 Ω for OD-TNO/PVDF, 58.46 Ω for OD-TNO/PAA, and 33.94 Ω for OD-TNO/Li50%-PAA. Among these, OD-TNO with the Li50%-PAA binder exhibited the lowest Rct value, whereas OD-TNO with the PVDF binder showed the highest value. As will be shown later, this improvement in charge transfer is attributed to the better access of TNO materials to desolvated lithium ions supplied by the Li50%-PAA coating, along with an SEI layer that has a lower thickness and higher electronic and/or ionic conductivity.60 Furthermore, the slope of the straight line in OD-TNO with the Li50%-PAA binder (≈75.6°) is steeper than that of OD-TNO with the PVDF binder (≈52.4°), indicating faster diffusion of lithium ions when the Li50%-PAA binder is used. This enhanced lithium-ion transport kinetics is due to the Li-conductive nature of the Li50%-PAA binder, which we will discuss further.
 | ||
| Fig. 5 (a) Experimental Nyquist plots of OD-TNO with PVDF and Li-PAA binders, with an inset showing the equivalent circuit model used to fit the EIS data; (b) GITT curves for OD-TNO with PVDF and Li-PAA binders, showing the amount of lithium ions intercalated into the TNO structure at each step; (c) GITT-driven lithium diffusion coefficients for the Li+ insertion process; (d) schematic of different lithium-ion pathways in the TNO structure; (e) CV curves for C-TNO/PVDF; (f) CV curves for OD-TNO/Li-PAA; (g) determination of b-values for peak cathodic currents over a sweep rate range of 0.05–1 mV s−1 for C-TNO/PVDF and OD-TNO/PVDF; (h) determination of b-values for peak cathodic currents in different sweep rate ranges (0.05–1 mV s−1 and 1–50 mV s−1) for C-TNO/Li-PAA and OD-TNO/Li-PAA; (i) comparison of cathodic peak shifts at different sweep rates. | ||
Galvanostatic intermittent titration technique (GITT) measurements were conducted to examine the Li+ diffusion coefficients at different states of charge. Fig. 5b and S13† present the GITT curves of different electrodes obtained by applying a constant current density of 0.1C for 10 min followed by a rest time of 60 min within a voltage window of 1.0–3.0 V. The Li+ diffusion coefficients are calculated based on Fick's second law of diffusion from eqn (1):
 | (1) |
To investigate DLi+ within the bulk of TNO, the GITT was used to compare OD-TNO and C-TNO with the same binder, Li50%-PAA. The results in Fig. 5c show that for both electrodes, DLi+ follows the same trends from OCV to a potential of 1.0 V. The trend indicates that both C-TNO/Li50%-PAA and OD-TNO/Li50%-PAA exhibit nearly the same DLi+ when discharged from OCV to 1.3 V, corresponding to the insertion of three lithium ions into 4i(1) and 4i(2) sites (inside T1 and T2 tunnels), followed by occupation of the 4i(3) and 4i(4) sites (Fig. 5d). Beyond a discharge voltage of 1.3 V to 0.8 V, a 25% increase in DLi+ was observed for OD-TNO/Li50%-PAA, which corresponds to the insertion of four lithium ions (Fig. 5b–d) into the 4i(5) and 8j sites by the reduction of Nb4+ to Nb3+ (i.e., Li4TiNb2O7).64,65 This result indicates that enlarged d-spacing in OD-TNO leads to enhanced lithium transport from 4i(1) and 4i(2) sites to 4i(5) sites and from 4i(3) to 8j sites, while Li+ migration along the T1 and T2 channels is minimally affected, if at all.
In order to deep-dive into the electrochemical behavior of OD-TNO and C-TNO with Li50%-PAA and PVDF binders, cyclic voltammetry (CV) tests were carried out at various scan rates from 0.05 to 1 mV s−1 (Fig. 5e and f). For comparison, CV results for C-TNO/Li50%-PAA and OD-TNO/PVDF are shown in Fig. S15.† Given that the current follows a power-law relationship with the sweep rate, the relationship can be expressed as i = avb, where a and b are adjustable parameters. Applying a logarithmic transformation to this equation results in the linear form log(ip) = b log(v) + log(a).66 By plotting the logarithm of the peak current (log(ip)) against the logarithm of the sweep rate (log(v)), the values of a and b can be determined from the intercept (log(a)) and slope (b) of the resulting linear plot, respectively. The results for OD-TNO and C-TNO with Li50%-PAA and PVDF binders are depicted in Fig. 5g and h. A b-value of 0.5 indicates that the rate of the electrochemical reaction (i.e., current) is controlled by semi-infinite linear diffusion of Li+, whereas a value of 1 indicates that the current is controlled by capacitive-type intercalation. It should be noted that the CVs have been collected from half cells where the lithium plating and stripping rate at the lithium-metal electrode is fast enough to consider that the current is limited by the rate of the electrochemical reaction at TNO electrodes. For OD-TNO/PVDF and C-TNO/PVDF electrodes, a b-value of ≈0.5 indicates that cathodic current (intercalation process) for both samples is limited by Li+ diffusion, which is a characteristic of an intercalation process. When the binder is changed to Li50%-PAA, OD-TNO and C-TNO show a cathodic b-value of ≈0.83 and 0.89, respectively, in the sweep-rate range of 0.05–1 mV s−1, revealing that the kinetics of electrochemical reactions are dominated by a faster, pseudocapacitive-type Li+ intercalation redox reaction; however, when the sweep rates are increased to 50 mV s−1 (corresponding to charging times of 50 s), these electrodes show a transition from pseudocapacitive-type to diffusion-controlled charge storage from a sweep rate higher than 1 mV s−1. This was observed by a b-value of ≈0.58 and 0.61 in the sweep-rate range of 1–50 mV s−1 for C-TNO/Li50%-PAA and OD-TNO/Li50%-PAA, respectively, with an indication of slightly faster redox kinetics in OD-TNO/Li50%-PAA. For charging times < 40 minutes (scan rate > 1 mV s−1), the charge storage mechanism exhibits no indication of capacitive-like intercalation, and the intercalation process occurs entirely through diffusion mechanisms. We attribute this to the limitations of the Li50%-PAA binder or the formed SEI layer in providing rapid Li+ transport from the bulk electrolyte to TNO at high charging rates, whereas the Li50%-PAA binder can facilitate effective Li+ transport only at sweep rates below 1 mV s−1. This behavior is evident when comparing the b-value for OD-TNO/PVDF (b = 0.51) and OD-TNO/Li50%-PAA (b = 0.89) at sweep rates below 1 mV s−1; the higher b-value of OD-TNO/PVDF indicates that its charge storage mechanism is primarily driven by Li+ diffusion, whereas OD-TNO/Li50%-PAA exhibits less limitation by Li+ diffusion and shows a faster pseudocapacitive-type Li+ intercalation.67
A comparison of the cathodic peak shift (ΔEc) between C-TNO/Li50%-PAA and OD-TNO/Li50%-PAA over a sweep range of 0.05 to 500 mV s−1 demonstrates significantly lower ΔEc values for OD-TNO/Li50%-PAA (Fig. 5i). At a sweep rate of 1 mV s−1, the ΔEc for OD-TNO/Li50%-PAA is 0.029 V, whereas it is 0.058 V for C-TNO/Li50%-PAA at the same sweep rate. This difference becomes more pronounced at higher sweep rates; for instance, at 10 mV s−1 (corresponding to ≈4 min charging), the ΔEc for OD-TNO/Li50%-PAA is 0.073 V, compared to 0.211 V for C-TNO/Li50%-PAA, representing a threefold increase in overpotential. This observation indicates that, although both materials use the Li50%-PAA binder, OD-TNO/Li50%-PAA exhibits faster kinetics for Li+ intercalation compared to C-TNO/Li50%-PAA. The significant reduction in the Li+ intercalation overpotential for OD-TNO/Li50%-PAA can also be attributed to the larger d-spacing as well as higher electronic conductivity of OD-TNO as compared to C-TNO, resulting in faster Li+ diffusion and faster charge transfer. This observation is consistent with the GITT results in Fig. 5c. OD-TNO/Li50%-PAA not only provides a facile intercalation, but its low ΔEc is also a key indicator of its high-power capability. This is of particular importance because as the charging time decreases (corresponding to higher current densities), the peak separation in battery materials increases due to polarization effects.67,68 Greater peak separation implies that more energy is needed to charge the battery than the energy it can release during discharge. This inefficiency is a key factor in evaluating the overall performance and energy retention capability of the battery. In summary, for sweep rates below 1 mV s−1, the Li50%-PAA binder promotes fast pseudocapacitive-type Li+ intercalation by providing a high concentration of Li+ at the electrode surface, whereas the oxygen deficiency in OD-TNO enables faster diffusion-controlled Li+ intercalation and results in lower overpotentials at sweep rates greater than 1 mV s−1.
To understand the characteristics of binders and their interaction with TNO particles, the surface of OD-TNO coated with PVDF and Li50%-PAA binders was characterized by SEM and TEM (Fig. 6a–h). Fig. 6a and e depict the boundary between the binder-coated TNO and the uncoated TNO surface. When zooming in on the red boxes in Fig. 6a and e, the morphological characteristics of PVDF and Li50%-PAA on the OD-TNO surface are distinctly contrasted as shown in Fig. 6b and f. Fig. 6b and c show that the coated PVDF exhibits spherical and spider web morphology, which stems from its semi-crystalline nature, as confirmed by XRD (Fig. S10†). This uneven, porous coverage leaves a significant portion of the OD-TNO surface directly exposed to the liquid electrolyte. In contrast, the amorphous Li50%-PAA polymer binder covers the entire OD-TNO surface uniformly (Fig. 6f and g). This observation is further corroborated by the TEM images. As shown in Fig. 6h, Li50%-PAA uniformly surrounds the TNO particles, whereas in Fig. 6d, the porous layer of PVDF spheres is visible on the surface, corresponding to the PVDF (002) plane. This observation is primary due to the weak van der Waals force interaction between the PVDF binder and TNO, as well as the semi-crystalline nature of PVDF. These characteristics prevent PVDF from compactly covering the TNO, allowing easy access for electrolyte components to the TNO surface, leading to continuous electrolyte decomposition and SEI layer growth.30,35,41 In contrast, the hydrogen bonding in the amorphous Li50%-PAA binder results in a strong and tight attachment to the surface of TNO, preventing direct contact between the liquid electrolyte and the TNO surface. To investigate the thickness of the SEI layer on OD-TNO when using either the Li50%-PAA or PVDF binder, we performed TEM analyses of electrode samples after 50 cycles. The TEM images in Fig. 6i and j illustrate the SEI layer formed on OD-TNO with the PVDF binder, revealing a relatively thick SEI layer of approximately 12–20 nm. In contrast, the TEM images of OD-TNO with the Li50%-PAA binder (Fig. 6k and l) show a thinner SEI layer, measuring around 4–7 nm. The formation of a thick SEI layer on OD-TNO with the PVDF binder increases resistance by impeding lithium-ion transport and consuming a substantial amount of lithium ions. Furthermore, thick SEI layers are prone to breaking during cycling, leading to continuous electrolyte decomposition and the subsequent formation of additional SEI layers.69 TEM images of the SEI layer provide clear evidence supporting the lower Rct observed in OD-TNO/Li50%-PAA compared to the OD-TNO/PVDF electrode (Fig. 5a).
 | ||
| Fig. 6 SEM images of (a–c) PVDF-coated OD-TNO and (e–g) Li50%-PAA-coated OD-TNO: SEM images were taken at the boundary between binder-coated and uncoated areas on the TNO pellet to reveal the different morphologies; TEM images of OD-TNO particles coated with (d) PVDF and (h) Li50%-PAA binders; TEM images of the SEI layer on the OD-TNO particles: (i and j) with the PVDF binder and (k and l) with the Li50%-PAA binder. | ||
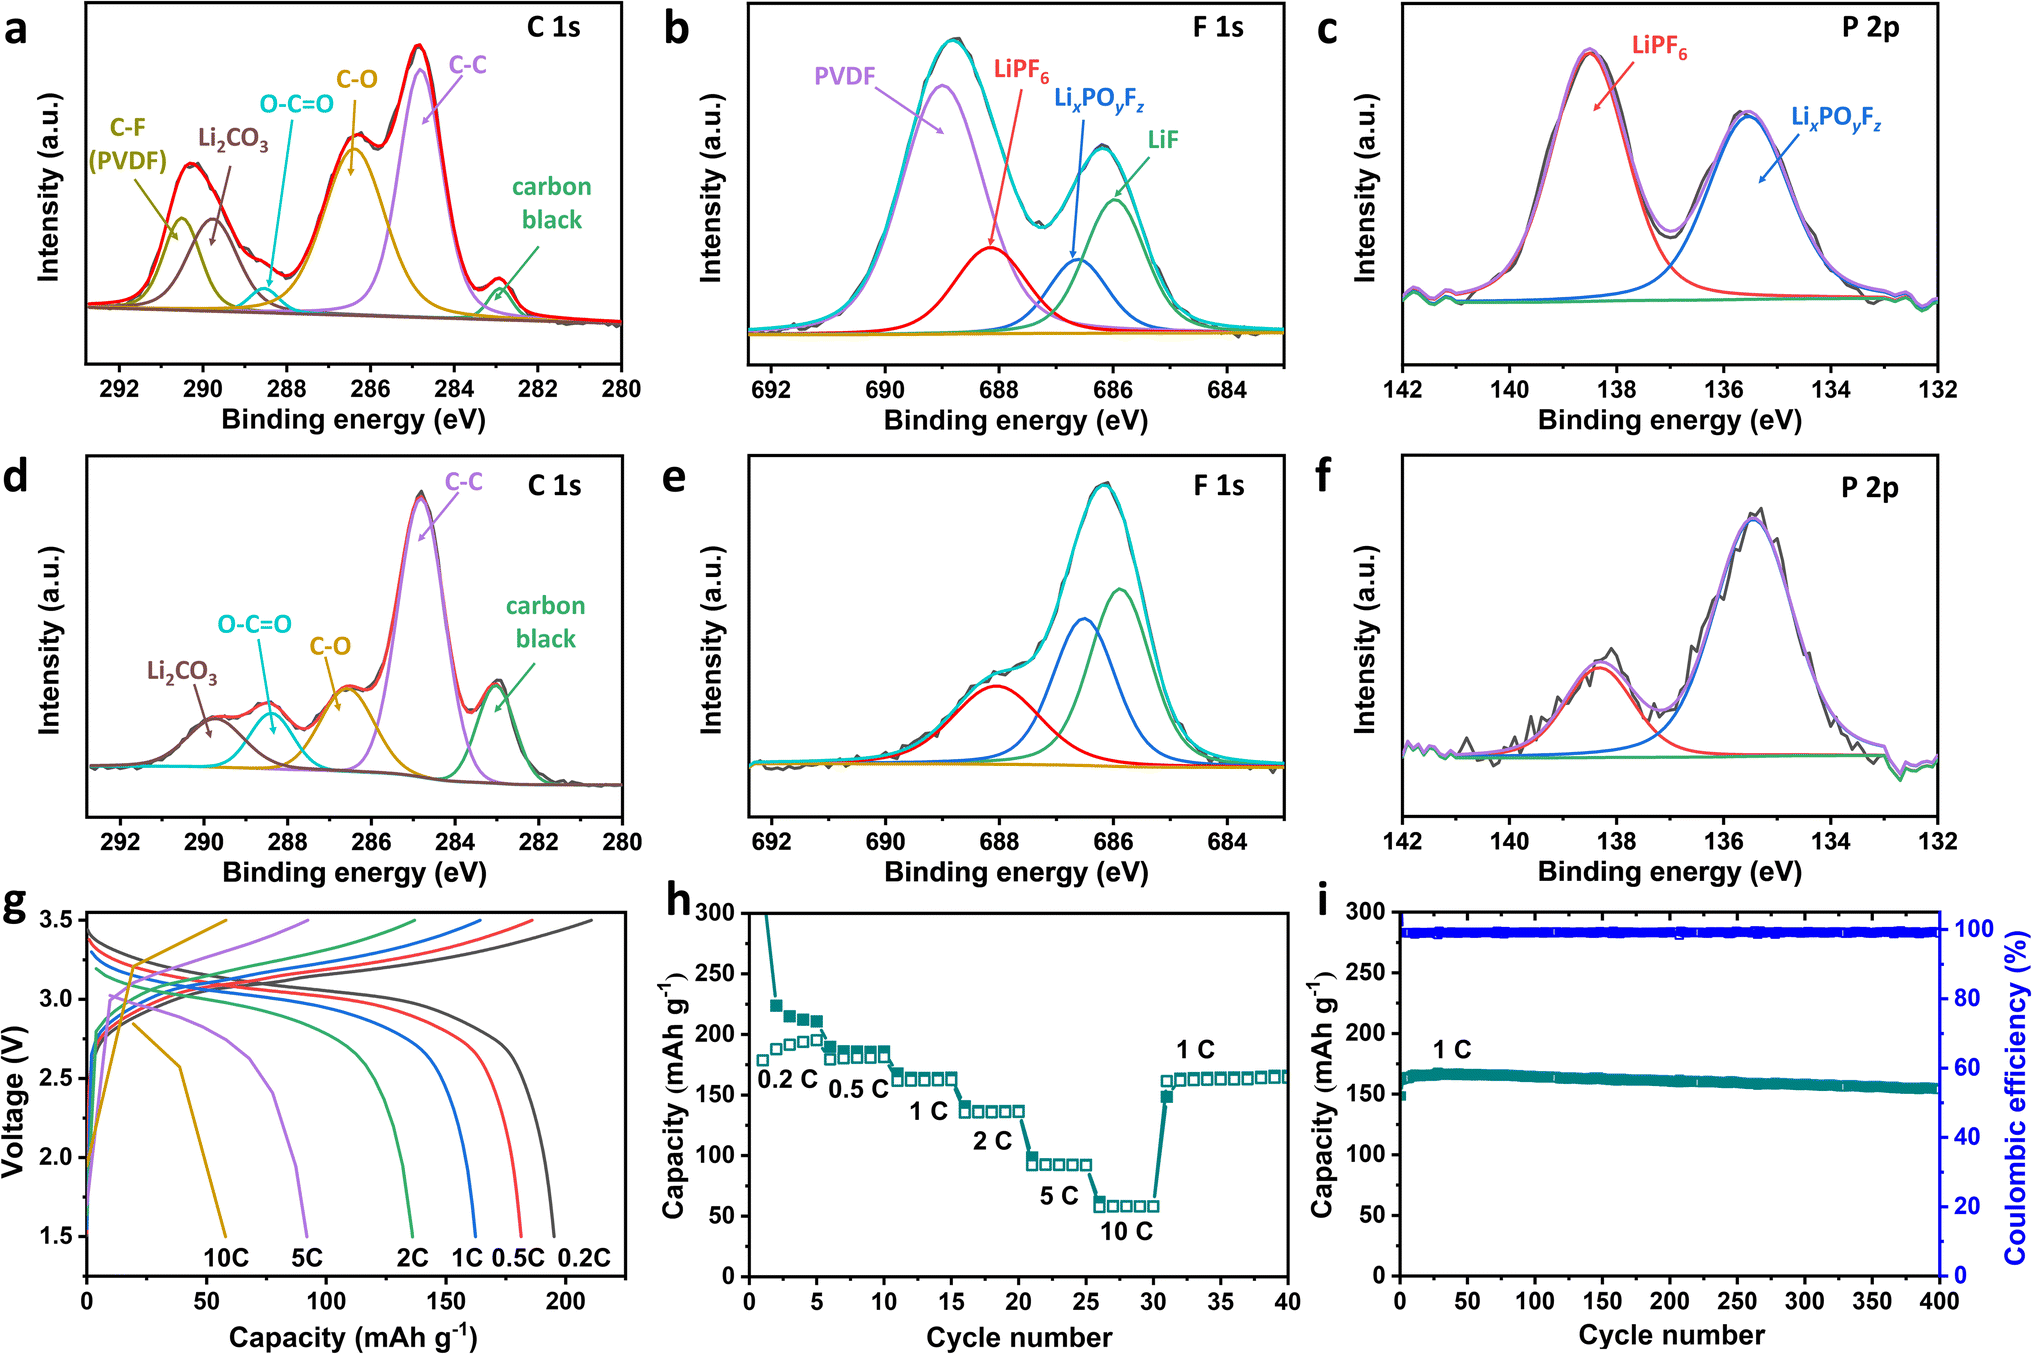
The high-resolution XPS analysis of the C 1s, F 1s, and P 2p spectra was performed to investigate the chemical composition of the SEI layer formed on OD-TNO particles with either the PVDF or Li50%-PAA binder after 50 cycles. The deconvoluted peaks of the XPS spectra (Fig. 7a–f) reveal that, apart from the C–F peaks associated with the PVDF binder observed in both the C 1s and F 1s spectra of OD-TNO/PVDF (Fig. 7a and b),70 the SEI composition shares similar chemical species in both cases.71 However, the relative component ratios differ significantly. For instance, the C 1s spectra (Fig. 7a and d) show that the relative intensity of the Li2CO3 peak is higher in the SEI layer formed on OD-TNO with the PVDF binder compared to that with the Li50%-PAA binder. This increase in Li2CO3 is attributed to the greater decomposition of LiPF6 and carbonate solvents on the OD-TNO/PVDF surface. The Li+-insulating nature of Li2CO3 contributes to higher resistivity and is a key factor in the higher charge transfer resistance (Rct) observed in OD-TNO/PVDF compared to OD-TNO/Li50%-PAA. The high C–O ratio in the SEI composition of OD-TNO/PVDF (Fig. 7a) suggests that the SEI layer predominantly forms from compounds derived from carbonate solvent decomposition. In contrast, the lower C–O ratio in OD-TNO/Li50%-PAA (Fig. 7d) indicates a reduced contribution of carbonate solvent decomposition to SEI formation. Similarly, the O–C![[double bond, length as m-dash]](https://www.rsc.org/images/entities/char_e001.gif) O peak, attributed to electrolyte decomposition products such as ROCO2Li, is prominent in OD-TNO/PVDF but significantly reduced or absent in OD-TNO/Li50%-PAA, even though the –COOH and –COOLi groups in the Li50%-PAA binder also contribute to the O–CO peak region (Fig. 7a and d).72 The F 1s and P 2p spectra for both electrodes also reveal a similar SEI composition, including LiF, lithiated fluorophosphates (LixPOyFz), and LiPF6. The appearance of the LiPF6 peak is not solely attributed to residual unwashed salt but also to the in situ diffusive incorporation of Li+PF6− into the SEI layer during its formation.73 LiF and LixPOyFz are generated from the decomposition of LiPF6.30 The significant increase in the intensity of LixPOyFz in OD-TNO/Li50%-PAA indicates that oxygen-containing functional groups (–COOH and –COOLi) or even residual water trapped in the binder after the drying step react more extensively with LiPF6 (or its decomposition product), forming a LixPOyFz-rich SEI layer. This layer can protect the OD-TNO surface from parasitic side reactions.74 In conclusion, TEM and XPS analyses revealed that OD-TNO/Li50%-PAA forms a thinner SEI layer compared to OD-TNO/PVDF. This thin, LixPOyFz-rich SEI layer not only suppresses electrolyte decomposition but also contains a high concentration of Li+ ions, significantly reducing lithium-ion transfer resistance. It should be noted that the SEI on OD-TNO/Li50%-PAA comprises both components from the Li50%-PAA binder and typical SEI constituents resulting from electrolyte decomposition, including LiF, LixPOyFz, and ROCO2Li.
O peak, attributed to electrolyte decomposition products such as ROCO2Li, is prominent in OD-TNO/PVDF but significantly reduced or absent in OD-TNO/Li50%-PAA, even though the –COOH and –COOLi groups in the Li50%-PAA binder also contribute to the O–CO peak region (Fig. 7a and d).72 The F 1s and P 2p spectra for both electrodes also reveal a similar SEI composition, including LiF, lithiated fluorophosphates (LixPOyFz), and LiPF6. The appearance of the LiPF6 peak is not solely attributed to residual unwashed salt but also to the in situ diffusive incorporation of Li+PF6− into the SEI layer during its formation.73 LiF and LixPOyFz are generated from the decomposition of LiPF6.30 The significant increase in the intensity of LixPOyFz in OD-TNO/Li50%-PAA indicates that oxygen-containing functional groups (–COOH and –COOLi) or even residual water trapped in the binder after the drying step react more extensively with LiPF6 (or its decomposition product), forming a LixPOyFz-rich SEI layer. This layer can protect the OD-TNO surface from parasitic side reactions.74 In conclusion, TEM and XPS analyses revealed that OD-TNO/Li50%-PAA forms a thinner SEI layer compared to OD-TNO/PVDF. This thin, LixPOyFz-rich SEI layer not only suppresses electrolyte decomposition but also contains a high concentration of Li+ ions, significantly reducing lithium-ion transfer resistance. It should be noted that the SEI on OD-TNO/Li50%-PAA comprises both components from the Li50%-PAA binder and typical SEI constituents resulting from electrolyte decomposition, including LiF, LixPOyFz, and ROCO2Li.
 | ||
| Fig. 7 High-resolution XPS spectra of the SEI layer on OD-TNO particles after 50 cycles: (a) C 1s, (b) F 1s, and (c) P 2p for OD-TNO/PVDF, and (d) C 1s, (e) F 1s, and (f) P 2p for OD-TNO/Li50%-PAA. (g) Voltage profiles of the full cell with an OD-TNO/Li50%-PAA anode and LNMO cathode at different C-rates, (h) rate capabilities of the full cell, and (i) cycle stability data recorded after the rate capability test. | ||
To investigate the synergetic effect of OD-TNO and Li50%-PAA binder on the electrochemical performance in a full cell, an OD-TNO/Li50%-PAA anode was paired with a high-voltage LiNi0.5Mn1.5O4 (LNMO) cathode, which has a redox potential of 4.7 V (vs. Li+/Li). An N/P ratio of 0.94 was adopted after full cell optimizations. Fig. S16† illustrates the charge/discharge mechanism in a full cell with a TNO anode, an LNMO cathode, and a liquid electrolyte. The electrochemical measurements were conducted in the potential range of 1.5 to 3.5 V (vs. TNO), with the charge–discharge results displayed in Fig. 7g. The full cell (OD-TNO/Li50%-PAA//1 M LiPF6 in EC/DEC/DMC//LNMO) delivers an output potential of 3.1 V, providing a discharge capacity of 195.17 mA h g−1 with a coulombic efficiency of 92.63% at 0.2C. Fig. 7h shows the rate capabilities of this full cell from 0.2C to 10C. At discharge rates of 0.2, 0.5, 1, 2, 5, and 10C, the full cell delivered discharge capacities of 195.17, 181.35, 162.33, 136.01, 91.94, and 57.90 mA h g−1, respectively. The cycling stability of the full cell was evaluated at 1C, with the results shown in Fig. 7i. After C-rate tests, the highest discharge capacity reached up to 166.44 mA h g−1. Even after 400 cycles, the cell delivered 153.78 mA h g−1, with a capacity retention of 92.4%. The electrochemical results demonstrate that the full cell based on the OD-TNO/Li50%-PAA anode and high-voltage LNMO cathode holds promising practical value for high-power applications while delivering higher energy density and safety compared to LIBs made with an LFP cathode and graphite anode.
Conclusion
In summary, TiNb2O7 (TNO) was successfully synthesized using an ultrafast high-temperature sintering system (UHS). Unlike the conventional, time-consuming muffle furnace method that requires hours of processing, the UHS method produces TNO materials with improved electronic and ionic properties in just 60 seconds. During this rapid thermal shock, Nb5+ and Ti4+ atoms in TNO undergo partial thermal reduction, creating oxygen deficiency at the edge-shared metal sites. This process transitioned the electronic states in TNO from d0 to d1, shifting the Fermi level from the valence band to the conduction band, resulting in 60000 times higher electronic conduction in OD-TNO compared to C-TNO. Half-cell results from discharging both OD-TNO/PVDF and C-TNO/PVDF to 0.5 V (vs. Li+/Li) show a coulombic efficiency of ≈82%, with a capacity decay of 42.0–44.2% after 300 cycles due to the lack of a stable SEI layer. Investigations into different binders revealed that while the PVDF binder does not provide good coverage around TNO particles, leading to continuous electrolyte decomposition, PAA lithiated at 50% forms a uniform coating on the TNO particles. The Li50%-PAA binder creates a Li+-conducting polymeric layer around the TNO particles, reducing the exposed active material area and stabilizing the SEI layer in the first cycle. GITT results showed that the Li50%-PAA binder facilitates faster lithium transport from the electrolyte to the OD-TNO surface compared to the PVDF binder, due to the Li+ conducting nature of Li50%-PAA. CV analyses further indicated that for OD-TNO/PVDF and C-TNO/PVDF electrodes, the current is limited by Li+ diffusion, which is characteristic of an intercalation process. In contrast, for OD-TNO and C-TNO with a Li+-rich Li50%-PAA binder, the kinetics of electrochemical reactions are dominated by a faster, pseudocapacitive-type Li+ intercalation redox reaction. The full cell, pairing the OD-TNO/Li50%-PAA anode with an LNMO cathode, delivers a discharge capacity of 153.78 mA h g−1 after 400 cycles at 1C. These results demonstrate the feasibility of OD-TNO/Li50%-PAA as a superior anode material with improved electron and Li+ conductivity, capable of pairing with a high-voltage LNMO cathode to exceed the energy density and power density of LFP-based lithium-ion batteries. However, further electrolyte optimization or coating strategies are required to enhance the cathodic stability of electrolytes at LNMO cathodes for longer cycle life.
Experimental section
Synthesis of C-TNO and OD-TNO
The solid-state method was used to synthesize different TiNb2O7 materials from two metal oxide precursors: niobium pentoxide (Nb2O5) and titanium dioxide (TiO2). Pure orthorhombic and monoclinic phases of Nb2O5 were synthesized by sintering ammonium niobate oxalate hydrate (C4H4NNbO9·xH2O, 99.99%, Sigma-Aldrich) for 5 hours at 700 and 1100 °C, respectively. Nb2O5 with mixed monoclinic and orthorhombic phases (purity 99.8%) was provided by CBMM. First, TiO2 (99.8%, Sigma-Aldrich) and Nb2O5 were mixed in a molar ratio of 1:1 using high-energy ball milling (SPEX, 8000D Mixer/Mill) for 1 hour. Then, the resulting mixture was cold-pressed into pellets, referred to as “precursor pellets”. For the conventional solid-state synthesis of C-TNO, precursor pellets were sintered in a muffle furnace at 1250 °C with a heating rate of 5 °C min−1 for 24 hours and allowed to cool naturally to room temperature. For the synthesis of OD-TNO, an ultrafast high-temperature annealing system (UHS) using a lab-made Joule heating device was employed. In this process, the precursor pellet was placed between two pieces of graphite foil as heating elements within the UHS. The detailed setup and methodology of the UHS are described in our previous publications.43,44 In the UHS process, the current is minutely controlled to reach the desired heating rate and final temperature. The precursor pellets underwent annealing at various temperatures ranging from 800–1250 °C for 30 seconds under an argon atmosphere. The annealing process was repeated twice, with a 3 minute rest period between cycles, to mitigate thermal damage to the heating chamber, electrical connections, and graphite foil. Subsequently, the densified C-TNO and OD-TNO pellets were crushed in a mortar and pestle and then subjected to wet ball milling in isopropanol solvent via planetary ball milling (Across International, PQ-N04) for eight hours at a speed of 300 rpm to reduce the particle size. After wet ball milling, the samples were dried in an oven at 80 °C for 12 hours. Finally, the C-TNO and OD-TNO particles were mixed with Super P carbon (C) in a weight ratio of 8:1 and subjected to the wet ball milling process for homogeneous mixing.
Synthesis of Li-PAA
The lithiated PAA binder was prepared by dissolving PAA powder (Sigma-Aldrich, average M.W. = 450000) in deionized (DI) water, followed by the addition of a stoichiometric amount of LiOH (Lix-PAA, x = 0, 0.25, 0.5, and 0.75) to neutralize the COOH functional groups in the PAA structure. The degree of substitution, x, represents the normalized ratio between LiOH and the PAA monomer, where one mole of LiOH can neutralize one mole of COOH functional groups in the PAA structure. Li-PAA refers to the optimal lithiated PAA binder at 50% lithiation: Li50%-PAA.
Material characterization
The structure of TNO materials was characterized by X-ray diffraction (XRD, Rigaku Miniflex 600) from 10° to 80° with a scan rate of 2° min−1. The surface morphologies and microstructures were investigated by scanning electron microscopy (SEM, Thermo Scientific, Apreo 2 C) coupled with energy-dispersive X-ray spectroscopy (EDS) and aberration-corrected scanning transmission electron microscopy (STEM, JEOL NEOARM – 200 kV). The valence states of elements in the materials were studied by X-ray photoelectron spectroscopy (XPS, PHI, VersaProbe 4). For SEI analysis using XPS, the half-cells were cycled 50 times and disassembled at a fully delithiated state (3 V vs. Li+/Li) inside a glovebox. The delithiated TNO electrodes were carefully removed and immersed in a vial of DMC solvent, where they were gently agitated several times to remove residual salts and solvents. Subsequently, the electrodes were rinsed in a second vial of fresh DMC, with the process repeated twice for thorough cleaning. After washing, the electrodes were vacuum-dried in the glovebox antechamber to ensure complete solvent removal. Finally, the dried electrodes were placed in an airtight sample holder inside the glovebox, and then transported and directly loaded into the XPS chamber. Raman spectra of both C-TNO and OD-TNO were obtained using a Raman spectrometer (Horiba, LabRAM HR Evolution) with a 532 nm excitation wavelength laser. To calculate the concentration of oxygen vacancies in OD-TNO, a fresh OD-TNO sample was analyzed using TGA equipment (DSC/TGA, Mettler Toledo, TGA/DSC 3+) under a flow of pure oxygen gas. The sample was oxidized by heating from room temperature to 1000 °C at a rate of 10 °C min−1, holding it at 1000 °C for 10 minutes, and then cooling it back to room temperature. The sample mass was measured with high precision (resolution of 0.1 μg) inside the TGA both before and after the experiment. The observed mass increase was attributed to the incorporation of oxygen atoms into the oxygen-deficient sites.Electrochemical measurements
Working electrodes were prepared by mixing 90 wt% of the as-prepared active materials (C-TNO@C and OD-TNO@C) with 10 wt% of the binder. The binders used were poly(vinylidene) fluoride (PVDF) dissolved in N-methyl pyrrolidone (NMP), polyacrylic acid (PAA) dissolved in ethanol, and lithium-substituted polyacrylic acid (Li25%-PAA, Li50%-PAA, and Li75%-PAA) dissolved in DI water. The total weight ratio of the active material to Super P to binder was 8:1:1. The prepared electrode slurry was stirred overnight, followed by casting onto copper foil by a doctor blade method and drying at 80 °C in a vacuum oven for 12 hours. Half cells were fabricated into CR2032 coin cells using the as-prepared TNO electrode as a working electrode, lithium-metal foil as a counter electrode, glass microfiber (Whatman, grade GF/C) as a separator, and 1 M LiPF6 in EC/DMC/DEC (1:1:1 vol%, Sigma-Aldrich) as the electrolyte. The high-voltage LiNi0.5Mn1.5O4 (LNMO, NEI Corp.) cathode, with an LNMO/Super P/PVDF weight ratio of 80/10/10, was prepared using the same process as that for the TNO electrodes. The full cells were fabricated using an LNMO cathode, TNO anode, and glass microfiber separator, and 1 M LiPF6 in EC/DMC/DEC (1:1:1 vol%) electrolyte. An N/P ratio of 0.94 was adopted for the full cells, and the reported capacities are based on the gravimetric capacity of the TNO anode. Galvanostatic charge–discharge tests were performed using a battery tester (Neware, BTS3000). Cyclic voltammetry (CV), electrochemical impedance spectroscopy (EIS), and the galvanostatic intermittent titration technique (GITT) were conducted using a multichannel potentiostat (Biologic, VMP-300). For rate capability tests, the 5th cycle tested at each C-rate was chosen for reporting.
Data availability
The data supporting this article have been included as part of the ESI.†Author contributions
Conceptualization: DK, HK; methodology: DK, SN, JHK, HK; supervision: HK; writing—original draft: DK; writing—review & editing: RSM, LSP, HK.Conflicts of interest
There are no conflicts to declare.Acknowledgements
This work was supported by the Companhia Brasileira de Metalurgia e Mineração (CBMM).References
- Y. Zhang, C. Kang, W. Zhao, B. Sun, X. Xiao, H. Huo, Y. Ma, P. Zuo, S. Lou and G. Yin, Energy Storage Mater., 2022, 47, 178–186 CrossRef
.
- S. Gong, Y. Wang, Q. Zhu, M. Li, Y. Wen, H. Wang, J. Qiu and B. Xu, J. Power Sources, 2023, 564, 232672 CrossRef CAS
- K. Kang, Y. S. Meng, J. Breger, C. P. Grey and G. Ceder, Science, 2006, 311, 977–980 CrossRef CAS PubMed
- G. Ceder, MRS Bull., 2010, 35, 693–701 CrossRef CAS
- H. Park, H. B. Wu, T. Song, X. W. Lou and U. Paik, Adv. Energy Mater., 2015, 5, 1401945 CrossRef
- A. Manthiram, J. Phys. Chem. Lett., 2011, 2, 176–184 CrossRef CAS
- X. Wen, C. Ma, C. Du, J. Liu, X. Zhang, D. Qu and Z. Tang, Electrochim. Acta, 2015, 186, 58–63 CrossRef CAS
-
P. K. Allan, N. Louvain and L. Monconduit, in Prospects for Li-Ion Batteries and Emerging Energy Electrochemical Systems, World Scientific, 2018, pp. 1–55 Search PubMed
- S. Lou, X. Cheng, Y. Zhao, A. Lushington, J. Gao, Q. Li, P. Zuo, B. Wang, Y. Gao and Y. Ma, Nano Energy, 2017, 34, 15–25 CrossRef CAS
- Z. Chen, H. Li, L. Wu, X. Lu and X. Zhang, Chem. Rec., 2018, 18, 350–380 CrossRef CAS PubMed
- H. Li, X. Liu, T. Zhai, D. Li and H. Zhou, Adv. Energy Mater., 2013, 3, 428–432 CrossRef CAS
- B. Guo, X. Yu, X.-G. Sun, M. Chi, Z.-A. Qiao, J. Liu, Y.-S. Hu, X.-Q. Yang, J. B. Goodenough and S. Dai, Energy Environ. Sci., 2014, 7, 2220–2226 RSC
- P. Shen, B. Zhang, Y. Wang, X. Liu, C. Yu, T. Xu, S. S. Mofarah, Y. Yu, Y. Liu and H. Sun, J. Nanostruct. Chem., 2021, 11, 33–68 CrossRef
- L. Yan, X. Rui, G. Chen, W. Xu, G. Zou and H. Luo, Nanoscale, 2016, 8, 8443–8465 RSC
- Y. Zhao, Q. Yuan, L. Yang, G. Liang, Y. Cheng, L. Wu, C. Lin and R. Che, Nano-Micro Lett., 2025, 17, 15 CrossRef CAS PubMed
- W. Wang, Q. Zhang, L. Yang, G. Liang, X. Xiong, Y. Cheng, L. Wu, C. Lin and R. Che, Adv. Sci., 2024, 2411291 CrossRef PubMed
- J.-T. Han, Y.-H. Huang and J. B. Goodenough, Chem. Mater., 2011, 23, 2027–2029 CrossRef CAS
- N. V. Kosova, D. Z. Tsydypylov, E. S. Papulovskiy and O. B. Lapina, J. Phys. Chem. C, 2022, 126, 13607–13616 CrossRef CAS
- R. Qian, H. Lu, T. Yao, F. Xiao, J.-W. Shi, Y. Cheng and H. Wang, ACS Sustainable Chem. Eng., 2021, 10, 61–70 CrossRef
- H. Lyu, J. Li, T. Wang, B. P. Thapaliya, S. Men, C. J. Jafta, R. Tao, X.-G. Sun and S. Dai, ACS Appl. Energy Mater., 2020, 3, 5657–5665 CrossRef CAS
- H. Li, L. Shen, G. Pang, S. Fang, H. Luo, K. Yang and X. Zhang, Nanoscale, 2015, 7, 619–624 RSC
- H. Aghamohammadi and R. Eslami-Farsani, J. Power Sources, 2022, 535, 231418 CrossRef CAS
- Y.-S. Hsiao, L.-Y. Chang, C.-W. Hu, C.-Z. Lu, N.-J. Wu, Y.-L. Chen, T.-H. Hsieh, J.-H. Huang, S.-C. Hsu and H.-C. Weng, Appl. Surf. Sci., 2023, 614, 156155 CrossRef CAS
- A. Shi, Y. Zhang, S. Geng, X. Song, G. Yin, S. Lou and L. Tan, Nano Energy, 2024, 123, 109349 CrossRef CAS
- Y.-S. Hsiao, C.-W. Chang-Jian, H. C. Weng, H.-H. Chiang, C.-Z. Lu, W. K. Pang, V. K. Peterson, X.-C. Jiang, P.-I. Wu and C.-P. Chen, Appl. Surf. Sci., 2022, 573, 151517 CrossRef CAS
- W. Zhu, B. Zou, C. Zhang, D. H. Ng, S. A. El-Khodary, X. Liu, G. Li, J. Qiu, Y. Zhao and S. Yang, Adv. Mater. Interfaces, 2020, 7, 2000705 CrossRef CAS
- H. Choi, T. Kim and H. Park, Electrochim. Acta, 2022, 404, 139603 CrossRef CAS
- A. A. Voskanyan, K. Jayanthi and A. Navrotsky, Chem. Mater., 2022, 34, 10311–10319 CrossRef CAS
- D. Zu, H. Wang, S. Lin, G. Ou, H. Wei, S. Sun and H. Wu, Nano Res., 2019, 12, 2150–2163 CrossRef CAS
- X. Wu, S. Lou, X. Cheng, C. Lin, J. Gao, Y. Ma, P. Zuo, C. Du, Y. Gao and G. Yin, ACS Appl. Mater. Interfaces, 2018, 10, 27056–27062 CrossRef CAS PubMed
- J. B. Goodenough and Y. Kim, Chem. Mater., 2010, 22, 587–603 CrossRef CAS
- X. Zhang, R. Kostecki, T. J. Richardson, J. K. Pugh and P. N. Ross, J. Electrochem. Soc., 2001, 148, A1341 CrossRef CAS
- S. Komaba, K. Shimomura, N. Yabuuchi, T. Ozeki, H. Yui and K. Konno, J. Phys. Chem. C, 2011, 115, 13487–13495 CrossRef CAS
- F. Jeschull, M. J. Lacey and D. Brandell, Electrochim. Acta, 2015, 175, 141–150 CrossRef CAS
- D. Dang, Y. Wang, M. Wang, J. Hu, C. Ban and Y.-T. Cheng, ACS Appl. Energy Mater., 2020, 3, 10940–10949 CrossRef CAS
- S. N. Mishra, S. Punyasloka, B. S. Mantripragada, A. Pradhan and N. Matsumi, ACS Appl. Energy Mater., 2023, 6, 11954–11962 CrossRef CAS
- S. Choi, T.-w. Kwon, A. Coskun and J. W. Choi, Science, 2017, 357, 279–283 CrossRef CAS PubMed
- N. Salem, M. Lavrisa and Y. Abu-Lebdeh, Energy Technol., 2016, 4, 331–340 CrossRef CAS
- T.-w. Kwon, Y. K. Jeong, E. Deniz, S. Y. AlQaradawi, J. W. Choi and A. Coskun, ACS Nano, 2015, 9, 11317–11324 CrossRef CAS PubMed
- J. Kim, J. Choi, K. Park, S. Kim, K. W. Nam, K. Char and J. W. Choi, Adv. Energy Mater., 2022, 12, 2103718 CrossRef CAS
- J. Yang, P. Li, F. Zhong, X. Feng, W. Chen, X. Ai, H. Yang, D. Xia and Y. Cao, Adv. Energy Mater., 2020, 10, 1904264 CrossRef CAS
- S. Komaba, K. Okushi, T. Ozeki, H. Yui, Y. Katayama, T. Miura, T. Saito and H. Groult, Electrochem. Solid-State Lett., 2009, 12, A107 CrossRef CAS
- J. Cui, J. H. Kim, S. Yao, A. Guerfi, A. Paolella, J. B. Goodenough and H. Khani, Adv. Funct. Mater., 2023, 33, 2210192 CrossRef CAS
- J. Cui, S. Yao, A. Guerfi, C. Kim, J. B. Goodenough and H. Khani, Energy Storage Mater., 2022, 53, 899–908 CrossRef
- Q. Wu, Y. Kang, G. Chen, J. Chen, M. Chen, W. Li, Z. Lv, H. Yang, P. Lin and Y. Qiao, Adv. Funct. Mater., 2024, 2315248 CrossRef CAS
- A. J. Martinolich, J. A. Kurzman and J. R. Neilson, J. Am. Chem. Soc., 2016, 138, 11031–11037 CrossRef CAS PubMed
- R. Inada, T. Mori, R. Kumasaka, R. Ito, T. Tojo and Y. Sakurai, Int. J. Appl. Ceram. Technol., 2019, 16, 264–272 CrossRef CAS
- K. J. Griffith, I. D. Seymour, M. A. Hope, M. M. Butala, L. K. Lamontagne, M. B. Preefer, C. P. Koçer, G. Henkelman, A. J. Morris and M. J. Cliffe, J. Am. Chem. Soc., 2019, 141, 16706–16725 CrossRef CAS PubMed
- S. Deng, H. Zhu, G. Wang, M. Luo, S. Shen, C. Ai, L. Yang, S. Lin, Q. Zhang and L. Gu, Nat. Commun., 2020, 11, 132 CrossRef CAS PubMed
- K. Tian, Z. Wang, H. Di, H. Wang, Z. Zhang, S. Zhang, R. Wang, L. Zhang, C. Wang and L. Yin, ACS Appl. Mater. Interfaces, 2022, 14, 10478–10488 CrossRef CAS PubMed
- N. Eror and U. Balachandran, J. Solid State Chem., 1982, 45, 276–279 CrossRef CAS
- F. Han, A. S. Westover, J. Yue, X. Fan, F. Wang, M. Chi, D. N. Leonard, N. J. Dudney, H. Wang and C. Wang, Nat. Energy, 2019, 4, 187–196 CrossRef CAS
- K. Tang, X. Mu, P. A. van Aken, Y. Yu and J. Maier, Adv. Energy Mater., 2013, 3, 49–53 CrossRef CAS
- C. Yang, C. Lin, S. Lin, Y. Chen and J. Li, J. Power Sources, 2016, 328, 336–344 CrossRef CAS
- C. Li, S. Nie and H. Li, Chem. - Eur. J., 2024, 30, e202303733 CrossRef CAS PubMed
- Z. Zhang, T. Zeng, Y. Lai, M. Jia and J. Li, J. Power Sources, 2014, 247, 1–8 CrossRef CAS
- C. C. Nguyen, T. Yoon, D. M. Seo, P. Guduru and B. L. Lucht, ACS Appl. Mater. Interfaces, 2016, 8, 12211–12220 CrossRef CAS PubMed
- K. L. Browning, R. L. Sacci, M. Doucet, J. F. Browning, J. R. Kim and G. M. Veith, ACS Appl. Mater. Interfaces, 2020, 12, 10018–10030 CrossRef CAS PubMed
- C. Lei, X. Qin, S. Huang, T. Wei and Y. Zhang, ChemElectroChem, 2021, 8, 3379–3383 CrossRef CAS
- T. R. Jow, S. A. Delp, J. L. Allen, J.-P. Jones and M. C. Smart, J. Electrochem. Soc., 2018, 165, A361 CrossRef CAS
- B. Babu and M. Shaijumon, Electrochim. Acta, 2020, 345, 136208 CrossRef CAS
- K. Ise, S. Morimoto, Y. Harada and N. Takami, Solid State Ionics, 2018, 320, 7–15 CrossRef CAS
- J. Kim, S. Park, S. Hwang and W.-S. Yoon, J. Electrochem. Sci. Technol., 2022, 13, 19–31 CrossRef CAS
- M. Catti, I. Pinus and K. Knight, J. Solid State Chem., 2015, 229, 19–25 CrossRef CAS
- H. Yu, H. Lan, L. Yan, S. Qian, X. Cheng, H. Zhu, N. Long, M. Shui and J. Shu, Nano Energy, 2017, 38, 109–117 CrossRef CAS
- J. Wang, J. Polleux, J. Lim and B. Dunn, J. Phys. Chem. C, 2007, 111, 14925–14931 CrossRef CAS
- V. Augustyn, J. Come, M. A. Lowe, J. W. Kim, P.-L. Taberna, S. H. Tolbert, H. D. Abruña, P. Simon and B. Dunn, Nat. Mater., 2013, 12, 518–522 CrossRef CAS PubMed
- J. Liu, J. Wang, C. Xu, H. Jiang, C. Li, L. Zhang, J. Lin and Z. X. Shen, Adv. Sci., 2018, 5, 1700322 CrossRef PubMed
- F. Luo, G. Chu, X. Xia, B. Liu, J. Zheng, J. Li, H. Li, C. Gu and L. Chen, Nanoscale, 2015, 7, 7651–7658 RSC
- R. M. Torres and A. Manthiram, Small, 2024, 20, 2309350 CrossRef CAS PubMed
- C. Zhou, X. Gong, Y. Feng, J. Lu, Y. Fu, Z. Wang and J. Liu, J. Colloid Interface Sci., 2022, 619, 158–167 CrossRef CAS PubMed
- J. He, C. Das, F. Yang and J. Maibach, Electrochim. Acta, 2022, 411, 140038 CrossRef CAS
- B. Philippe, R. Dedryvère, M. Gorgoi, H. Rensmo, D. Gonbeau and K. Edström, Chem. Mater., 2013, 25, 394–404 CrossRef CAS
- S. Ghosh, J. Dutta, K. K. Garlapati, M. Parvin, C. Gupta, H. N. Dixit and S. K. Martha, J. Power Sources, 2024, 623, 235440 CrossRef CAS
Footnote |
| † Electronic supplementary information (ESI) available. See DOI: https://doi.org/10.1039/d4ta06697a |
| This journal is © The Royal Society of Chemistry 2025 |