 Open Access Article
Creative Commons Attribution 3.0 Unported Licence
Degradation mechanisms in low-voltage Wadsley–Roth TiNb2O7 electrodes upon cycling with Li†
Benjamin Mercier-Guyon *a,
Jean-François Colin
 a,
Adrien Boulineaub,
Carolina del mar Saavedra Rios
 a and
Sébastien Martineta
aUniv. Grenoble Alpes, CEA, LITEN, DEHT, Laboratoire des Matériaux, Grenoble, France. E-mail: jean-francois.colin@cea.fr
bUniv. Grenoble Alpes, CEA, LITEN, DTNM, Laboratoire de Caractérisation Avancée pour l’Energie, Grenoble, France
First published on 14th May 2025
Abstract
Drawing more and more interest, Wadsley–Roth phases, and more specifically titanium-niobium oxide (TNO), are considered serious competitors of Li4Ti5O12 exhibiting a higher capacity and thus a larger specific energy. Many groups reported advanced synthesis routes for this material but only a little consideration was given to the study of the lithiation and degradation mechanisms. In this work, we report a singular evolution in the cycling performance of TiNb2O7, synthesized with a normal solid-state route. Indeed, performances at high rates are strongly varying depending on its cycling history. To understand the underlying phenomena, we carried out many investigations, in particular by coupling in situ and post mortem structural characterization studies.
Introduction
For many years, the lithium titanate spinel Li4Ti5O12 (LTO) was used in Li-ion batteries (LiBs) requiring longer lifetimes and higher safety that cannot be provided by graphite negative electrodes. Having also a very good power ability, this material might have been perfect for hybrid electric vehicles requiring high rate cycling and fast charge even at low temperature. However, a restrained theoretical specific capacity (175 mA h g−1)1 and a gassing phenomenon drastically hinder the commercial deployment of this material.2 To overcome these limitations, Goodenough et al. showed in 2011 that TiNb2O7 (TNO) can be used as a negative electrode material,3 retaining LTO's advantages (e.g. high power ability, long life and safety) but offering a higher theoretical capacity of 388 mA h g−1. This value is almost twice that of LTO due to the possible exchange of 5 electrons per structural unit (Ti4+/Ti3+ and Nb5+/Nb3+ ×2) and is now comparable to that of graphite.4The crystal structure of this Wadsley–Roth phase can be described as a shear structure composed of ReO3-like blocks interconnected by edge-sharing. This structure leads to the formation of m × n × ∞ blocks (m and n denote the width and height of the block) connected to another block (Fig. 1).
 | ||
| Fig. 1 Crystal structure of TiNb2O7, displaying 3 × 3 blocks of Ti/Nb–O6 octahedra (purple: y = 0/1 and green: y = 0.5/1.5). Primitive cells are drawn in black.5 | ||
Light and dark colored blocks are offset by half of the lattice parameter along the b axis.
Many studies report advanced synthesis routes for this material such as solvothermal synthesis,6 carbon nanotube grafting7 and spray drying8 but only a little consideration was given to the study of the lithiation and degradation mechanisms.
Cava et al.4 published the very first study reporting lithium insertion in various Wadsley–Roth compositions. Using X-Ray Diffraction (XRD), they characterized the structure of fourteen phases, highlighting the presence of different types of cavities in the structure that can be used as insertion sites for lithium. However, they used n-butyllithium for chemical lithiation that may induce significant differences with electrochemical lithiation.
The first report on the structural evolution of the material during an electrochemical charge/discharge was published in 2014 by Guo and co-workers,9 using in situ XRD to characterize the process. They observed that lithiation occurs in a succession of three distinct mechanisms. Structural changes could be described by one biphasic mechanism occurring from Li1TiNb2O7 to Li1.75TiNb2O7 between two solid solutions.
From this point, the theory of coexistence between two phases, corresponding to the visible plateau on the electrochemical lithiation curve, seems to be accepted for this kind of material, although never demonstrated by refinement.10–13
In 2020, based on a sychrotron operando study14 conducted on a distinct phase, Nb16W5O55, and corroborated by ab initio calculation,15 Griffith et al.14 asserted that the structure undergoes a series of three solid solution transformations.
More recently, Saber et al. carried out an in-depth DFT simulation study of the mechanisms involved in the lithiation/delithiation of LixTiNb2O7 (ref. 16) following a previously published study by Griffith et al.17 The team reported an unusual redox mechanism for an active insertion material where, for a stoichiometry of x < 1, electrons are accommodated by the bonding states of the metal–metal dimers. However, for values of 1 < x < 2, a transition between cation-centered and dimer-centered redox centers occurs to accommodate the highly induced distortion. This mechanism led to significant structural changes in the host cell and the oxygen octahedron. Similarly, Ahn and coworkers18 highlighted the importance of edge sharing between different block structures demonstrating the local high-speed diffusion of lithium for the Nb–O system.
In addition, we find in the literature a great disparity in the types of electrochemical tests performed on TNOs. Many studies have measured TNO power ability by increasing the delithiation rate while keeping the lithiation rate low and constant.19 Nevertheless, to the best of our knowledge, no other teams have ever tried to compare performances at high rates with or without prior slow rates.
Considering these elements, we carried out a study on the performance degradation during cycling, by linking electrochemical measurements and structural characterization by in situ XRD, post mortem SEM and HRSTEM observation. Finally, Raman spectroscopy has also been performed, to propose a new mechanism to explain the losses of lithiation capacity at high C-rate cycling.
Experimental
Material synthesis
In this study, the mixed oxide TiNb2O7 was prepared via a single step solid-state synthesis.Titanium oxide (TiO2 anatase, 99.0%, Huntsman) and niobium pentoxide (Nb2O5, 99.9%, Aldrich) powders have been used as precursors and introduced in stoichiometric amounts. The mixture was ball-milled (PM 100 CM, Retsch) for 4 hours at 400 rpm in a 50 mL agate bowl with balls. Vballs/Vbowl = 0.4 (where Vballs stands for the volume of the balls and Vbowl the volume of the bowl) and Vballs/Vreagents = 10 ratios were used. Finally, the product is calcined at 1100 °C for 16 hours in a muffle furnace under an air atmosphere.
After natural cooling, the powder was crushed manually with an agate mortar and pestle.
Physicochemical characterization
XRD measurements were performed in an 8–80° 2θ range with a Bruker D8 Advance diffractometer. Copper Kα radiation was used with a step size of 0.004°. For in situ measurement, we have chosen to use a variable slit, with a step of 0.015° from 2θ = 16 to 50° and 0.5 seconds per step.After collection, data were processed with Le Bail and Rietveld refinements via JANA2006 software.20,21 Phase identification has been performed with EVA software, provided by Bruker and powered by the ICDD PDF4+ database.
Particle and electrode morphologies were characterized with a Field Emission Scanning Electron Microscope (FE-SEM) LEO 1530 from Zeiss.
Raman spectroscopy was carried out on a Renishaw Raman spectrometer using WiRE 4.0 software. The wavelength used was 532 nm with a laser power of 1 mW. Post mortem characterization studies were realized using an airtight mount with a quartz window to avoid degradation reactions with air and moisture.
Scanning Transmission Electron Microscopy (STEM) has been performed using a Titan Themis microscope (Thermofisher) operated at 200 kV. Quantitative EDX mappings have been performed thanks to the “Super-X” detector system.
Electrochemical characterization
Electrochemical performances were tested with a CR2032-like half-cell assembled in an argon-filled glove box ([H2O] and [O2] < 0.1 ppm).For this purpose, the working electrodes are prepared with a mixture of TNO and an electronic conductor (Super P C65) in an agate mortar with cyclohexan. After total evaporation of the latter, a solution of PVDF 1530 (Solef ®) at 10 wt% in N-methyl-2-pyrrolidone (NMP, Sigma Aldrich) is added until a weight formulation of 80 wt% active material, 10 wt% electronic conductor, 10 wt% binder and a dry extract content of 25% are reached.
The resulting ink is then coated onto aluminum foil using a 100 μm slit. After 24 hours of drying at 60 °C, electrodes with a diameter of 14 mm are cut and pressed at 10 tons. Electrode loading is about 2.2 mg cm−2 and corresponds to a theoretical area capacity of 0.85 mA h cm−2.
After drying at 80 °C for 24 hours under vacuum, coin cells are assembled with a 16 mm diameter lithium metal disk as a negative electrode (135 μm thick Li metal foil, Rockwood Lithium GmbH) with a polypropylene separator (CG2400, Celgard). Polypropylene felt (Viledon, Freudenberg) is also added to improve the wettability of the electrode by the electrolyte.
150 μL of a solution of EC/PC/DMC (1![[thin space (1/6-em)]](https://www.rsc.org/images/entities/char_2009.gif) :
:![[thin space (1/6-em)]](https://www.rsc.org/images/entities/char_2009.gif) 1
1![[thin space (1/6-em)]](https://www.rsc.org/images/entities/char_2009.gif) :
:![[thin space (1/6-em)]](https://www.rsc.org/images/entities/char_2009.gif) 3 vol) + LiPF6 (1 M) (LP100, UBE Industries) were used as electrolyte.
3 vol) + LiPF6 (1 M) (LP100, UBE Industries) were used as electrolyte.
Galvanostatic cycling was carried out on an Arbin laboratory battery tester at different C-rates (assuming C = 388 mA g−1) in a potential range within 3–0.8 V vs. Li+/Li. Two main types of programs were used. The first one (iso C-rate) was used to perform the tests either at C/10 or 10C. In that case, the cycles were all performed with the same C-rate for both discharge and charge steps: e.g. a 10C-rate for all cycles. Another program used was called a “power ability test” (later called PAT) comprising 5 cycles at C/10 followed by a power ramp (C/5 → C → 3C → 5C → 10C) and back at C/10 for 90 cycles. For this PAT program, symmetric charging/discharging C-rates were also used at each power step.
For in situ XRD measurements, a mixture of 70% of TNO and 30% of Super P was prepared and dried for 48 h at 120 °C under vacuum. A cell with a 250 μm Be window was assembled in an argon-filled glove box ([H2O] and [O2] < 0.1 ppm) with 30 mg of mixture and 1 mL of a solution of EC/PC/DMC (1![[thin space (1/6-em)]](https://www.rsc.org/images/entities/char_2009.gif) :
:![[thin space (1/6-em)]](https://www.rsc.org/images/entities/char_2009.gif) 1
1![[thin space (1/6-em)]](https://www.rsc.org/images/entities/char_2009.gif) :
:![[thin space (1/6-em)]](https://www.rsc.org/images/entities/char_2009.gif) 3 vol) + LiPF6 (1 M) leading to a capacity of 8.15 mA h. A lithium metal counter electrode (ϕ = 14 mm) was used and separated from the working electrode using a Whatman glass fibre separator.
3 vol) + LiPF6 (1 M) leading to a capacity of 8.15 mA h. A lithium metal counter electrode (ϕ = 14 mm) was used and separated from the working electrode using a Whatman glass fibre separator.
The galvanostatic intermittent titration technique (GITT) was applied, with a BioLogic VSP cycler, using an equivalent current pulse of 0.25 Li at C/20 and 6.4 hours of relaxation.
Results and discussion
Highlighting the degradation of the material upon cycling
After synthesis, the material has been characterized with a first powder XRD measurement. Le Bail and Rietveld refinement have been realized and are displayed on Fig. 2.As shown on the diffractogram, no impurity is evidenced and each peak can be indexed with the expected C2/m space group with these cell parameters a = 20.3824(1) Å, b = 3.8016(1) Å, c = 11.9009(1) Å and β = 120.21(1)°; these results are consistent with the values available in the literature.22 The resulting atomic parameters are given in Table 1.
| Structural data and information | |||||||
|---|---|---|---|---|---|---|---|
| Species | Label | Coordinates | Occupancy | Uiso (Å2) | Site | ||
| x | y | z | |||||
| Nb | Nb1 | 0.000 | 0.000 | 0.000 | 1.000 | 0.03(1) | 2a |
| Nb | Nb2 | 0.186(2) | 0.000 | 0.004(2) | 0.770 | 0.02(1) | 4i |
| Ti | Ti2 | 0.186(2) | 0.000 | 0.004(2) | 0.230 | 0.02(1) | 4i |
| Nb | Nb3 | 0.079(2) | 0.000 | 0.638(2) | 0.674 | 0.02(1) | 4i |
| Ti | Ti3 | 0.079(2) | 0.000 | 0.638(2) | 0.326 | 0.02(1) | 4i |
| Nb | Nb4 | 0.888(2) | 0.000 | 0.632(2) | 0.735 | 0.01(1) | 4i |
| Ti | Ti4 | 0.888(2) | 0.000 | 0.632(2) | 0.265 | 0.01(1) | 4i |
| Nb | Nb5 | 0.290(2) | 0.000 | 0.367(2) | 0.487 | 0.02(1) | 4i |
| Ti | Ti5 | 0.290(2) | 0.000 | 0.367(2) | 0.513 | 0.02(1) | 4i |
| O | O1 | 0.162(2) | 0.000 | 0.595(2) | 1.000 | 0.01 | 4i |
| O | O2 | 0.379(2) | 0.000 | 0.605(2) | 1.000 | 0.01 | 4i |
| O | O3 | 0.582(2) | 0.000 | 0.596(2) | 1.000 | 0.02 | 4i |
| O | O4 | 0.797(2) | 0.000 | 0.638(2) | 1.000 | 0.02 | 4i |
| O | O5 | 0.236(1) | 0.000 | 0.159(2) | 1.000 | 0.02 | 4i |
| O | O6 | 0.701(2) | 0.000 | 0.000 | 1.000 | 0.02 | 4i |
| O | O7 | 0.912(2) | 0.000 | 1.007(2) | 1.000 | 0.03 | 4i |
| O | O8 | 0.020(2) | 0.000 | 0.412(2) | 1.000 | 0.02 | 4i |
| O | O9 | 0.867(2) | 0.000 | 0.166(2) | 1.000 | 0.02 | 4i |
| O | O10 | 0.500 | 0.000 | 0.000 | 1.000 | 0.03 | 2b |
| O | O11 | 0.049(2) | 0.000 | 0.201(2) | 1.000 | 0.02 | 4i |
A structural model reported in the literature (ICCD 00-039-1407) was used as the starting point for the refinement. Atomic occupancies were not refined, as the initial model already provided a satisfactory fit to the experimental data. Moreover, in the starting model, the isotropic displacement parameters (Uiso) varied across the different crystallographic sites. These differences were preserved, as they are consistent with the distinct coordination environments and connectivities of the octahedra associated with each metal site. These structural variations influence the degrees of vibrational freedom for the respective metal atoms. The same strategy was applied to the oxygen atoms.
Scanning electron microscopy images show micrometric and spheroidal particles composing the material as can be seen in Fig. S2.†
High-resolution transmission electron microscopy
Transmission electron microscopy is a powerful technique for both visual and structural characterization of a material at the atomic level through different imaging modes. In our case, we have chosen to use this technique on the pristine TiNb2O7 electrodes, with the aim of correlating and confirming previous XRD results as well as for post mortem samples.In our study, pristine observation of TiNb2O7 showed in Fig. 3(A) displays a typical particle of the active material. As can be seen in Fig. 3(B) and (C), the particle does not show any inhomogeneity in terms of Ti and Nb atom repartition. In addition, Fig. 3(D) shows a really well-arranged structure in accordance with the expected structure. The electron diffraction pattern of this structure has been simulated and perfectly matches with a [010] zone axis. We also provide an interpretation of the HRSTEM image with the repartition of Ti and Nb atoms obtained from XRD.
Different types of electrochemical tests have been carried out. First, we choose to test our TNO with two different programs, a galvanostatic iso C-rate charge–discharge program fixed at 10C and a so-called power ability test, applying different iso charge–discharge C-rates, a complementary measurement regarding studies currently published on this type of material.
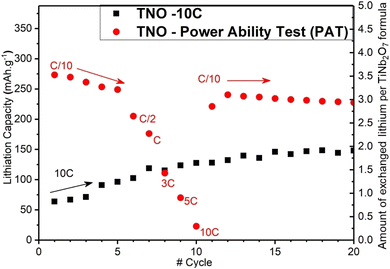
As illustrated in Fig. 4, insertion capacity measured for the 10C step during the power ability test is much lower than that measured on the cell cycled at 10C only. The capacity is reduced from 125 mA h g−1 (equivalent to 1.75 Li per unit at the tenth cycle) to 20 mA h g−1 (equivalent to 0.25 Li per unit also at the tenth cycle). It is therefore possible that carrying out slow cycles on a TNO electrode would lead to internal degradation.
In addition, as illustrated in Fig. 5, we performed rapid cycling between 3 and 0.8 V vs. Li/Li+ at 10C (part II) and 5C (part III) on an electrode that has already undergone a full power ability test but with its lithiation capacity constrained to 125 mA h g−1, in order to highlight the influence of the depth of lithiation on performances.
It should be noted that lithium can be unstable under high-rate conditions. However, we do not find any influence of the counter electrode on the results presented in this study. Indeed, our findings demonstrate that the material exhibits improved performance when subjected exclusively to high rates, while degradation is observed when a low rate is applied first. If lithium degradation at high rates were a significant factor, an opposite trend would be expected.
It is important to note that in the literature addressing this topic, the absence of standards concerning cycling tests (particularly concerning the presence of a constant voltage step, high and low cut potentials, rest periods, etc.) and the occasional lack of details prevent drawing direct comparisons between studies.
As we can see in Fig. 5, the discharge capacity measured during 10C and 5C rate sequences are extremely close to the expected ones.
On the other hand, as can be seen in Fig. S2,† when cycled in the full potential windows through the power ability test part, 10C cycling shows an extremely low lithiation capacity, indicating difficulty for the lithium to reach the insertion sites. Low rate cycling and more specifically deep lithiation of the material could create irreversible damage and interfere with the proper functioning of TNO as a negative electrode material.
For a deeper understanding of the lithiation and degradation mechanism that occurs in TiNb2O7, we have chosen to further investigate the structural changes using in situ XRD measurement.
In situ X-ray diffraction
Fig. 6 shows the in situ XRD patterns collected on a TiNb2O7/Lithium metal half-cell and the associated electrochemical discharge/charge curve for the first Li+ insertion/extraction.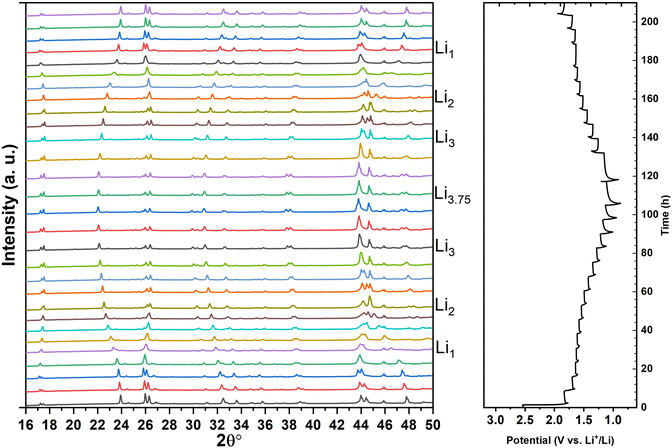 | ||
| Fig. 6 In situ X-ray powder diffraction patterns during the first cycle of discharge/charge and the electrochemical profile associated. | ||
As can be seen from the potentiostatic profile, the insertion of Li+ seems to take place in 3 distinct stages, with breaks in the curve. The initial and final parts are then connected by a pseudo plateau, leading to a total discharge capacity of 290 mA h.g−1 (i.e. 3.75 Li+/formula). This capacity is consistent with our coin cell results and with the literature.23
A strong and reversible evolution of peak positions indicating a solid solution mechanism can be clearly seen all along cycling. The analysis of the intensity evolution of all reflections in Fig. 6 and 7 does not indicate the apparition of any new phase that would witness the phase transition process contrary to what is commonly admitted in the literature for the pseudo-plateau region.
To confirm this conclusion and reject any possibility of a closely related 2nd phase that would be hidden in peak broadening, a careful Le Bail refinement analysis of all diffractograms was carried out. Once again this analysis shows that a monophasic solution was sufficient to fit the material diffractogram at any point of the cycling curve. An example of refinement with one phase is given in Fig. 8 for the diffractogram taken at the middle of this plateau, where the biphasic character of the mechanism would be emphasized if a phase transition existed, showing a very good agreement between fit and observation.
 | ||
| Fig. 8 Single phase Rietveld refinement of lithiated TiNb2O7 acquired in the middle of the discharge plateau, for an equivalent lithium content of 1.5. | ||
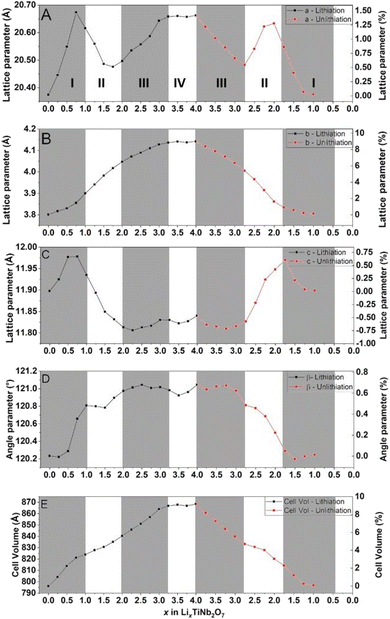
The obtained cell parameters are reported in Fig. 9.
All diffractograms have been refined similarly i.e. a, b, c, β, and metallic atom positions, which also makes it possible to characterize the global evolution of the structure for the whole electrochemical process, lithiation and delithiation. The use of a beryllium window induces a bias in the intensity interpretation preventing the refinement position of less intense atoms such as O.
Fig. 9 reports the evolution of lattice parameters. The a and c axes evolve in three stages. First, these two parameters increase up to +1.5% for the a axis and +0.75% for the c axis at 0.75 Li/formula. From there, the dimensions decrease, down to +0.5% for the a axis to 1.75 Li and −0.75% to 2.25 Li for the c axis. Finally, these two parameters will increase again until the end of the lithiation located at 4 Li and showing a transformation of + 1.4% for the a axis and – 0.4% for the c axis.
Regarding the variation of the b axis and the β angle, these parameters increase almost linearly throughout the lithium insertion and show a final total variation of +9% for the b axis and +0.7% for the β angle. Due to these lattice parameter variations, TiNb2O7 undergoes a total volume expansion of +9.3%. The standard deviations of the cell parameters obtained from the Le Bail refinement are below 0.001 Å, making the corresponding error bars imperceptible on the plotted graph.
Previous studies have shown that Wadsley–Roth structures contain multiple distinct lithiation sites.4 The changes in the slope observed during electrochemical cycling are likely associated with the sequential lithiation of these different sites, each inducing specific distortions within the structural framework. The data presented in Fig. 9 represent a preliminary attempt to identify and differentiate these lithiation sites. Regarding the stabilization of cell parameters observed at the end of discharge, it is assumed that no lithiation of the material is occurs during that stage. As discussed earlier, the final part of the discharge process is dominated by the formation of a solid electrolyte interphase (SEI), due to the high surface area of carbon available in our electrode configuration. This process is largely irreversible and accounts for the absence of a corresponding stable phase during the charging process.
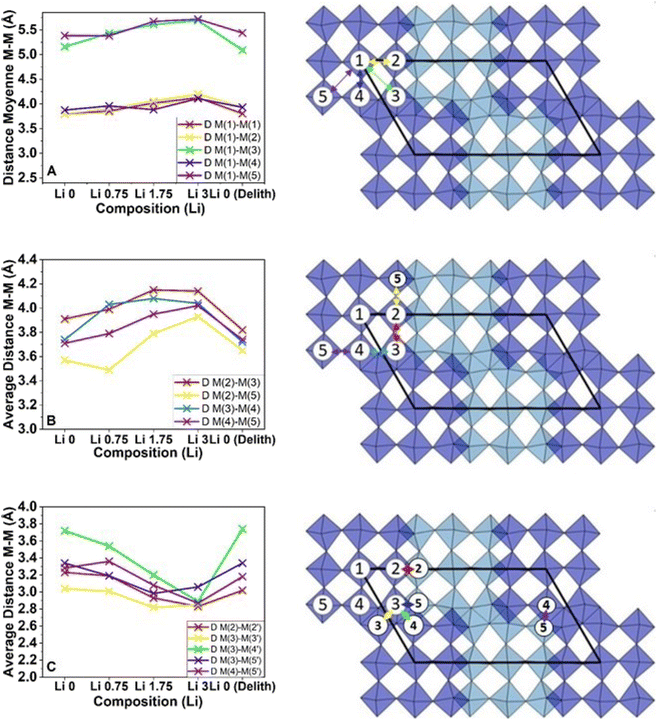
These multiple refinements and the generation of structures corresponding to the lattice parameters also allowed quantifying the evolution of the different distances between cations in the lattice. These results are reported in Fig. 10 (numerical data available in Table S1†).
First, we can notice that the blocks do not have perfectly symmetrical dimensions. The blocks are elongated along the c axis. It is interesting to see that the dimensions forming the primary structure, i.e. between the cations of the blocks labeled as M1–Mx with 0 < x < 6, vary by ≈ 8% during lithiation. A similar behavior is observed between the octahedra located at the block's edge denoted as M2–M3/5, M3–M4 and M4–M5. Moreover, as expected from the initial and final diffractograms, the dimensions of the octahedra are extremely close between their pristine and final states, showing a small expansion for internal dimensions and almost zero variation for the edge.
An entirely different phenomenon can be observed this time regarding the evolution of the dimensions between blocks. For all lithiation steps, a contraction of dimensions can be observed in M2–M2′, M3–M3′, M3–M5′ and M4–M5′, leading to an average shrinkage of the framework of 12%, mainly directed by the evolution of M3–M4′ dimensions. In addition, this evolution is not fully reversible, resulting in a final decrease of ≈1%.
A high irreversible capacity is also observed. This can be due to the non-electrochemically optimized set-up used for the in situ measurement. The large quantity of carbon additive used in the formulation develops a high specific surface area that can lead to significant SEI (Solid Electrolyte Interphase) formation and potential lithium trapping.
However, as expected, the evolution of the global structure seems to be perfectly reversible. Lattice parameters return to their initial values at the end of the first cycle.
Post mortem characterization
From the obtained results, it appears that the structure does not evolve after a whole cycle of lithium insertion, which is not consistent with previous results displayed in Fig. 4.To understand the origin of the modification observed in electrochemical performances, post mortem characterization studies have also been carried out. Fig. 11 shows the HRSTEM observations carried out on the powder after a cycle was performed at a slow rate (C/20) that leads to deep lithiation (+3.75 Li per units).
Panels A, B and C show the observation made on a particle and the distribution of metallic elements (Ti & Nb) obtained by EDX. It can be noted that these distributions do not appear to have been impacted by the cycling.
However, transmission electron microscopy at higher magnification reveals a significant surface amorphization extending over almost 5 nm. This evolution, not previously reported, could be a significant barrier to the diffusion of lithium ions, especially when using fast cycling rates. Nevertheless, the internal structure of the grains does not appear to have been impacted, as the crystallographic lattice can be perfectly indexed according to a [1–50] zone axis. Also, the chemistry of the particles seems to be unaffected by these evolutions, even in the amorphous part of the particles, as the ratio between Ti and Nb remains equal to 1![[thin space (1/6-em)]](https://www.rsc.org/images/entities/char_2009.gif) :
:![[thin space (1/6-em)]](https://www.rsc.org/images/entities/char_2009.gif) 2, as demonstrated in Fig. 12.
2, as demonstrated in Fig. 12.
 | ||
| Fig. 12 Elemental mappings obtained by STEM-EDX on the pristine sample previously shown in Fig. 3 (A and B) and post mortem (C and D) particles shown in Fig. 11. B and D show concentration profiles obtained from particles presented in A and C along the yellow lines. | ||
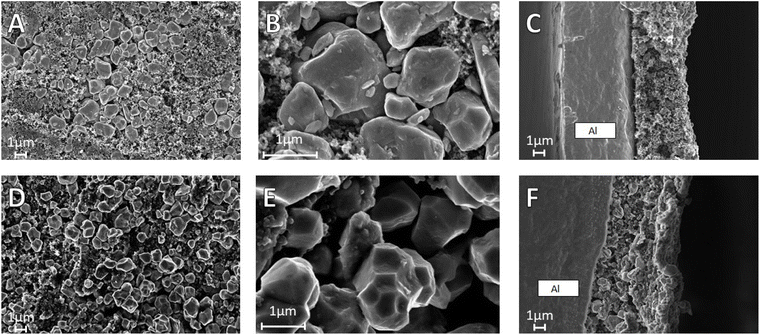
Fig. 13 presents SEM pictures obtained on pristine electrodes (A, B and C) and post mortem electrodes after the power ability test (D, E and F).
The pristine electrode shows a good distribution of TiNb2O7 particles inside a carbon matrix. At higher magnification, particles look mainly round shaped with an average diameter of 1 μm, without any traces of defects. The cross-section observation reveals a good homogeneity throughout the thickness of the coated layer, without delamination.
Post mortem observations show a significant change in the general appearance of the electrode, with segregation of the active material above the carbonaceous conductor. The morphology of the TiNb2O7 particles is also modified with the appearance of facets, with convex surfaces, that can be linked to the anisotropic volume change during cycling. The sectional view shows that the deformation observed on TiNb2O7 is also happening inside the electrode depth indicating that it is not only a surface effect. Moreover, we see the formation of empty spaces around grains without the electronic conductor in contact. This less homogeneous repartition of carbon could explain a part of the lower power performances after deep lithiation.
These different observations could be explained by the important volume dilatation during lithiation revealed with in situ XRD measurements; the repeated volume changes could have impacted the electrode structure and favors the carbon sedimentation.
Post mortem XRD spectra acquired after 25, 50 and 100 cycles realized at C/10 between 3 and 0.8 V vs. Li+/Li, presented in Fig. 14, do not display any major evolution of the active material structure. At least, the whole intensity seems to decrease during consecutive cycles.
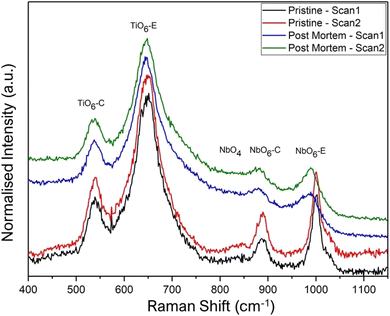
We also performed Raman measurements in the backscattering geometry on pristine and cycled powders retrieved from the cycled electrode to identify Raman active vibration of TiNb2O7. We present the normalized spectra in Fig. 15.
As expected, 4 main vibrations have been identified, due to the 2 kinds of positions occupied by both titanium and niobium octahedra: (i) 645 and 1000 cm−1 vibrations can be assigned respectively to Ti and Nb octahedron edge positions and (ii) 540 and 890 cm−1 vibrations may be attributed to Ti and Nb octahedra in corner positions. These 4 main vibrations can be detected as a signature for all pristine and post mortem samples.
A weak vibration, which seems to disappear during cycling, is observed at around 840 cm−1 for the pristine sample and is tentatively assigned to NbO4 tetrahedra in the literature.24,25
This environment has been observed in other Wadsley–Roth phases at the junctions of ReO3 blocks and could potentially exist as defects between macroblocks composed of Ti and Nb octahedra. Interestingly, it has been suggested that these crystalline defects, which resemble shear planes, might serve as diffusion channels for lithium ions when used at high speeds, potentially facilitating their access to deeper sites.14 However these NbO4 defects could not be directly observed by HRSTEM.
Conclusions
In this work, a titanium niobium mixed oxide was synthesized by an all solid state route optimized by ball milling. This material, a Wadsley–Roth phase displaying an interesting structure in shear ReO3, is really promising as an active material for Li-ion negative electrodes, especially for applications requiring high power performances and fast-charge ability for a long cycle life.The electrochemical tests presented here have put in light that the performances are strongly dependent on both the C-rates used and the electrochemical cycling history of the electrode under test. As the first major result, a strong loss in power ability was highlighted when cycling is carried out at low rates and with a deep lithiation.
To explain this degradation, various electrochemical characterization studies were carried out and coupled to advanced characterization techniques. The realization of in situ XRD run experiments showed that the lithiation process consists of a succession of 3 solid solution domains with a high volume change. Although this evolution is fully reversible, the important volume change (10%) has an impact on the electrode structure with a degradation of the conductive network structure.
Nevertheless, the joint SEM observation and Raman spectroscopy on pristine and post mortem samples highlighted the significant modification of the structure of the surface of the grain after deep lithiation, showing the clear amorphization of the structure. These modifications may explain the loss of power ability in this TiNb2O7 material.
Data availability
The data used in this study are available upon request from the corresponding authors. Due to certain restrictions related to confidentiality or specific agreements, not all data can be made publicly available, but they will be shared to the extent possible upon justified request. A file containing the ESI† has also been included with the submission to complement the results presented in this paper.Conflicts of interest
There are no conflicts to declare.Acknowledgements
The authors acknowledge CEA-INSTN for PhD funding awarded to Benjamin Mercier-Guyon. This project has received funding from the European Union's Horizon 2020 research and innovation program under grant agreement no. 875126 (CoFBAT).Notes and references
- Nanomaterials for Lithium-Ion Batteries: Fundamentals and Applications, ed. R. Yazami, Pan Stanford Publ, Singapore, 2014 Search PubMed.
- I. Belharouak, G. M. Koenig, T. Tan, H. Yumoto, N. Ota and K. Amine, J. Electrochem. Soc., 2012, 159, A1165–A1170 CrossRef CAS.
- J. T. Han and J. B. Goodenough, Chem. Mater., 2011, 23, 3404–3407 CrossRef CAS.
- R. J. Cava, D. W. Murphy and S. M. Zahurak, J. Electrochem. Soc., 1983, 130, 2345–2351 CrossRef CAS.
- L. Hu, L. Luo, L. Tang, C. Lin, R. Li and Y. Chen, J. Mater. Chem. A, 2018, 6, 9799–9815 RSC.
- K. Ise, S. Morimoto, Y. Harada and N. Takami, Solid State Ionics, 2018, 320, 7–15 CrossRef CAS.
- C. Lin, L. Hu, C. Cheng, K. Sun, X. Guo, Q. Shao, J. Li, N. Wang and Z. Guo, Electrochim. Acta, 2018, 260, 65–72 CrossRef CAS.
- G. Zhu, Q. Li, Y. Zhao and R. Che, ACS Appl. Mater. Interfaces, 2017, 9, 41258–41264 CrossRef CAS PubMed.
- B. Guo, X. Yu, X. G. Sun, M. Chi, Z.-A. Qiao, J. Liu, Y.-S. Hu, X.-Q. Yang, J. B. Goodenough and S. Dai, Energy Environ. Sci., 2014, 7, 2220–2226 RSC.
- H. Yu, J. Zhang, R. Zheng, T. Liu, N. Peng, Y. Yuan, Y. Liu, J. Shu and Z.-B. Wang, Mater. Chem. Front., 2020, 4, 631–637 RSC.
- H. Yu, H. Lan, L. Yan, S. Qian, X. Cheng, H. Zhu, N. Long, M. Shui and J. Shu, Nano Energy, 2017, 38, 109–117 CrossRef CAS.
- H. Yu, X. Cheng, H. Zhu, R. Zheng, T. Liu, J. Zhang, M. Shui, Y. Xie and J. Shu, Nano Energy, 2018, 54, 227–237 CrossRef CAS.
- X. Zhu, J. Xu, Y. Luo, Q. Fu, G. Liang, L. Luo, Y. Chen, C. Lin and X. S. Zhao, J. Mater. Chem. A, 2019, 7, 6522–6532 RSC.
- K. J. Griffith, K. M. Wiaderek, G. Cibin, L. E. Marbella and C. P. Grey, Nature, 2018, 559, 556–563 CrossRef CAS PubMed.
- C. P. Koçer, K. J. Griffith, C. P. Grey and A. J. Morris, Chem. Mater., 2020, 32, 3980–3989 CrossRef PubMed.
- M. Saber, S. S. Behara and A. Van der Ven, Chem. Mater., 2023, 35, 9657–9668 CrossRef CAS PubMed.
- K. J. Griffith, I. D. Seymour, M. A. Hope, M. M. Butala, L. K. Lamontagne, M. B. Preefer, C. P. Koçer, G. Henkelman, A. J. Morris, M. J. Cliffe, S. E. Dutton and C. P. Grey, J. Am. Chem. Soc., 2019, 141, 16706–16725 CrossRef CAS PubMed.
- Y. Ahn, T. Li, S. Huang, Y. Ding, S. Hwang, W. Wang, Z. Luo, J. Wang, G. Nam and M. Liu, Adv. Funct. Mater., 2023, 2310853 Search PubMed.
- S. Lou, Y. Ma, X. Cheng, J. Gao, Y. Gao, P. Zuo, C. Du and G. Yin, Chem. Commun., 2015, 51, 17293–17296 RSC.
- V. Petříček, M. Dušek and L. Palatinus, Z. fur Krist. – Cryst. Mater., 2014, 229(5), 345–352 CrossRef.
- V. Petříček, M. Dušek and J. Plášil, Z. fur Krist. – Cryst. Mater., 2016, 231(10), 583–599 CrossRef.
- R. B. Von Dreele and A. K. Cheetham, Proc. R. Soc. London, Ser. A, 1974, 311–326 CAS.
- F. Yu, S. Wang, R. Yekani, A. La Monaca and G. P. Demopoulos, J. Energy Storage, 2024, 112482 CrossRef.
- A. McConnell, J. Aderson and C. Rao, Spectrochim. Acta, Part A, 1976, 32, 1067–1076 CrossRef.
- J. M. Jehng and I. E. Wachs, Chem. Mater., 1991, 3, 100–107 CrossRef CAS.
Footnote |
| † Electronic supplementary information (ESI) available. See DOI: https://doi.org/10.1039/d4ta06441k |
| This journal is © The Royal Society of Chemistry 2025 |


