DOI:
10.1039/D4TA06374K
(Paper)
J. Mater. Chem. A, 2025,
13, 3474-3483
Accelerating the electrochemical performance of solid oxide fuel cells using a Ce(Gd, Bi, Yb)O2−δ diffusion barrier layer acting as an oxygen reservoir at high-current loading conditions†
Received
7th September 2024
, Accepted 26th November 2024
First published on 6th December 2024
Abstract
Gadolinium-doped ceria (GDC) is widely used as an effective diffusion barrier layer in solid oxide fuel cells (SOFCs) to avoid the undesired reactions between the electrolyte (typically yttria-stabilized zirconia, YSZ) and electrode materials due to impurity interdiffusion. In practice, these reactions cannot be sufficiently suppressed, as the high sintering temperature of GDC hinders the formation of dense and thin barrier layers. To address this problem, we herein investigated the ability of a ternary dopant system Ce(Gd, Bi, Yb)O2−δ (Gd0.135Yb0.015Bi0.02Ce0.83O2−δ, GYBC) deposited as a novel diffusion barrier layer on YSZ to enhance the SOFC performance. A dense and thin GYBC buffer layer was successfully fabricated by ultrasonic spraying followed by low-temperature sintering at 1250 °C, and the corresponding unit cell (Ni-YSZ/YSZ/GYBC/La0.4Sr0.6Co0.2Fe0.8O3−δ (LSCF)-GDC/LSCF) delivered a high power density of 2.32 W cm−2 at 800 °C. Furthermore, GYBC favored the cathodic oxygen reduction reaction (ORR) by enhancing the oxygen supply capacity. As a result, the replacement of a commercial GDC layer by the GYBC layer increased the oxygen reservoir activity at high current densities and thus enhanced the electrochemical performance by 16%.
Introduction
Solid oxide fuel cells (SOFCs) are highly promising as a clean energy source, offering high energy efficiency and low emissions. While SOFC technology has recently made strides towards commercialization for power generation, concerns remain regarding durability and electrode stability, particularly due to their high-temperature operating conditions.1–3 Consequently, advanced materials and electrodes enable high SOFC performance without compromising long-term stability.4–6 In particular, the performance and degradation resistance of SOFCs are strongly influenced not only by the employed diffusion barriers but also by the efficiency of air utilization at the cathode,7–10 with decreases in this efficiency resulting in cathode (and, hence, SOFC) performance and durability loss.10–12 To address these issues, doped ceria interlayers between solid electrolytes and electrodes have become a popular strategy for improving the stability and performance of solid electrochemical cells (SOCs).12–15 In particular, gadolinium-doped ceria (GDC) is widely used as a diffusion barrier layer in SOFCs because of its high ionic conductivity and impurity resistance. However, the high-temperature sintering of GDC (above 1300 °C) can result in the migration of Gd3+ and Ce4+ ions and thus induce the formation of quaternary compounds and solid solutions to deteriorate SOFC stability and performance.16–18 The resistance of a GDC interlayer + yttria-stabilized zirconia (YSZ) electrolyte system was reported to minimally increase with increasing GDC sintering temperature, while the power density concomitantly decreased despite the accompanying increase in GDC conductivity.19 Therefore, to prevent secondary inter-diffusion reactions, the interlayer must be sintered at lower temperatures.19–22 Optimizing sintering conditions carefully is important to maintain a balance between preventing interdiffusion and enhancing material properties. Binary doping of ceria is an attractive method for tuning its properties by providing sufficient oxygen-ion diffusion pathways via oxygen vacancy formation, facilitating oxygen-ion hopping and increasing ionic conductivity.23 Eressa et al. reported that the Yb and Sm co-doping of ceria increases its electrical conductivity by promoting oxygen-ion transfer in the lattice, as the ionic radius of Yb3+ exceeds that of Ce4+.24 Guan et al. reported that Bi doping decreases the densification activation energy of GDC, i.e., promotes densification, because of the low energy of Bi–O bonds.25 However, the ternary doping of ceria has rarely been investigated as a means of fabricating thin and dense diffusion barrier layers for SOCs. To bridge the above gap, we herein prepared the ternary doping system of Ce(Gd, Bi, Yb)O2−δ (GYBC) and examined its ability to prevent interdiffusion reactions between the cathode and the YSZ electrolyte when used as a low-sintering-temperature diffusion barrier layer on an YSZ electrolyte in high-performance SOFCs.26 GYBC was found to exhibit a larger oxygen storage capacity (OSC) than GDC, promote the oxygen reduction reaction, and increase the overall cell performance27 at high current densities and cell durability. The optimized ternary doped cerium oxide (GYBC) buffer layer effectively responded to oxygen starvation conditions by continuously supplying oxide ions. Thus, GYBC was concluded to act as an efficient oxygen reservoir and diffusion barrier layer, enabling the fabrication of high-performance SOFCs.
Experimental
Preparation of slurry for ultrasonic spraying
Yttria (8 mol%)-stabilized zirconia (LTC, Republic of Korea), Gd0.1Ce0.9O2−δ (GDC 10, Fuel Cell Materials, USA), Gd0.2Ce0.8O2−δ (GDC 20, Fuel Cell Materials, USA), Gd0.135Yb0.015Bi0.02Ce0.83O2−δ (GYBC, Kceracell, Republic of Korea), NiO (Fuel Cell Materials, USA), La0.4Sr0.6Co0.2Fe0.8O3−δ (LSCF, Fuel Cell Materials, USA), and La0.8Sr0.2MnO3−δ (LSM, Fuel Cell Materials, USA) powders were used as electrode materials. The slurry for ultrasonic spraying was fabricated using electrode material powders, dispersant (BYK 2055, USA), binder (polyvinyl butyral, PVB, Sigma-Aldrich), and solvents (ethanol and isopropanol).
Characterization
X-ray diffraction (XRD) analysis (D/MAX 2200V/PC, Rigaku, Japan) was performed in the 2θ range of 20–90° using Cu Kα radiation, and the acquired data were subjected to Rietveld refinement using the GSAS II software.28–30 For electrical conductivity measurements, the samples were shaped into rectangular bars measuring 3 cm × 3 cm × 10 cm. Platinum wires and electrodes were fabricated by applying organic pastes (TR-7907, Tanaka Kinkinzoku Kogyo K. K., Tokyo, Japan) and firing at 900 °C to remove the organic components. Conductivity was measured according to a standard four-terminal direct-current method using a custom jig and Keithley 2400 source meter. Measurements were conducted at every 50 °C upon heating from 600 to 900 °C at 5 °C min−1. Powder shrinkage behavior was characterized using a dilatometer (DIL L76, Linseis, Germany) upon heating in air from 25 to 1500 °C at 10 °C min−1. Porosity was measured using the Archimedes method for circular pellets sintered at 1250 °C for 2 h, and cross-sectional morphology and elemental distribution analyses were performed using field-emission scanning electron microscopy (FE-SEM; JSM-7600F, JEOL, Japan) coupled with energy-dispersive X-ray spectroscopy.
Quantitative elemental analysis of GYBC before and after sintering was conducted using ICP-OES (Optima 8300 DV, PerkinElmer, USA) analysis. Oxygen vacancies were characterized by Raman spectroscopy (LabRAM ARAMIS, HORIBA, Japan) using a 532 nm laser at room temperature in air. Thermogravimetric analysis (Manufacturing Technology, Republic of Korea) was performed at heating and cooling rates of 10 °C min−1 to evaluate the oxygen loss and uptake following a redox cycle in air/1% H2 at 800 °C. Temperature-programmed oxidation (TPO; AUTOCHEM II 2920, Micromeritics, USA) analysis was conducted to analyze oxygen absorption and desorption.
Cell fabrication
Single cells of two types were prepared, namely electrolyte-supported cells (ESCs) and anode-supported cells (ASCs). The YSZ electrolyte (thickness ≈ 150 μm) used in ESCs was purchased from Thermotech. In the case of ESCs, the anode was fabricated by ultrasonically spray-coating a mixture of NiO (70 wt%) and doped ceria (30 wt%; GDC 10, GDC 20, or GYBC) powders on the anode side of the YSZ electrolyte, and the thickness of the deposited layer was controlled using a 10 mm diameter disk. The doped ceria slurry was then coated as a buffer layer on the cathode side of the YSZ electrolyte by ultrasonic spraying and sintered at 1250 °C for 2 h. Subsequently, the cathode was fabricated by spray-coating a slurry containing LSM and doped ceria (50![[thin space (1/6-em)]](https://www.rsc.org/images/entities/char_2009.gif) :50, w/w) on the cathode side, and LSM was sprayed on each face of the YSZ disk, which was then fired at 1100 °C for 2 h. For ASC fabrication, a NiO–YSZ anode and YSZ electrolyte were prepared by tape casting (Samsung Electronics). GDC 20 and GYBC buffer layers were formed on the YSZ surface using ultrasonic spraying followed by sintering at 1250 °C for 2 h. Subsequently, the buffer layer was spray-coated by the cathode layer (LSCF:GDC 10 = 50:50, w/w), and the cell was sintered at 1050 °C for 2 h.
:50, w/w) on the cathode side, and LSM was sprayed on each face of the YSZ disk, which was then fired at 1100 °C for 2 h. For ASC fabrication, a NiO–YSZ anode and YSZ electrolyte were prepared by tape casting (Samsung Electronics). GDC 20 and GYBC buffer layers were formed on the YSZ surface using ultrasonic spraying followed by sintering at 1250 °C for 2 h. Subsequently, the buffer layer was spray-coated by the cathode layer (LSCF:GDC 10 = 50:50, w/w), and the cell was sintered at 1050 °C for 2 h.
Cell performance testing
Cell performance was measured using four Pt metal lead lines and two Pt meshes as commercial current collectors in humidified 3% hydrogen and air supplied at a flow rate of 100 mL min−1. Current density–voltage curves were recorded at temperatures of 700–900 °C. Impedance spectra (BioLogic, VMP-300, France) were recorded at frequencies between 0.1 Hz and 1 MHz using an amplitude of 10 mV and fitted using the ZView program to extract ohmic resistance (Rs) and polarization resistance (Rp). The effects of the buffer layer were examined by calculating the distribution of relaxation times (DRT) from impedance data followed by complex nonlinear least squares fitting.
Results and discussion
The realization of high cathodic performance relies on the efficient utilization of oxygen ions transported from the electrolyte and typically involves SOC stability and performance enhancement via buffer layer introduction. Fig. 1(a) illustrates the structure of the GYBC buffer layer containing electrolyte-supported SOFCs prepared herein. The XRD patterns of conventional GDC 10 (Gd0.1Ce0.9O2−δ) and GDC 20 (Gd0.2Ce0.8O2−δ) structures are comparable to that of the new GYBC (Gd0.135Yb0.015Bi0.02Ce0.83O2−δ) structure. GDC 10, GDC 20, and GYBC had the fluorite structure without a secondary phase.
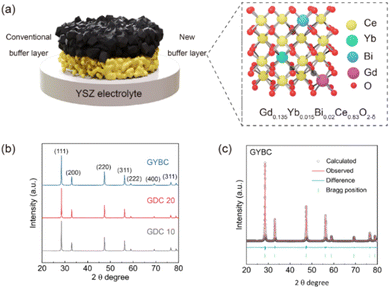 |
| | Fig. 1 (a) Schematic of electrolyte-supported solid oxide fuel cells with conventional (Gd-doped CeO2, less dense) and Ce(Gd, Yb, Bi)O2−δ (GYBC, more dense) buffer layers. (b) X-ray diffraction patterns of GDC 10, GDC 20, and GYBC powders recorded at room temperature. (c) Rietveld refinement results obtained for GYBC powder. | |
Thus, GYBC, a ternary doping system, successfully incorporated Gd3+ (1.07 Å), Yb3+ (0.98 Å), and Bi3+ (1.17 Å) into the CeO2 lattice to form a single-phase solid solution.31–34 The above XRD patterns were subjected to Rietveld refinement (Fig. 1(c) and S1†) to establish the effects of doping on lattice parameters, with the results presented in Table 1. GDC 10, GDC 20, and GYBC had cubic structures with a space group of Fm![[3 with combining macron]](https://www.rsc.org/images/entities/char_0033_0304.gif) m and lattice parameters of 5.4203(3), 5.4252(3), and 5.4204(3) Å, respectively. Despite the high dopant content of GYBC, its lattice parameter was closer to that of GDC 10 than to that of GDC 20. The lattice parameter of CeO2 is known to increase with the increasing content of Gd3+ and decrease with the increasing content of Yb3+.35
m and lattice parameters of 5.4203(3), 5.4252(3), and 5.4204(3) Å, respectively. Despite the high dopant content of GYBC, its lattice parameter was closer to that of GDC 10 than to that of GDC 20. The lattice parameter of CeO2 is known to increase with the increasing content of Gd3+ and decrease with the increasing content of Yb3+.35
Table 1 Rietveld refinement parameters obtained for GDC 10, GDC 20, and GYBC powders
|
|
GDC 10 |
GYBC |
GDC 20 |
| Crystal structure |
Cubic |
Cubic |
Cubic |
| Space group |
Fmm |
Fmm |
Fmm |
|
a = b = c (Å) |
5.42(031) |
5.42(036) |
5.42(518) |
| Lattice volume (Å3) |
159.248 |
159.252 |
159.677 |
|
R
wp
|
5.755 |
5.826 |
9.127 |
|
x
2
|
4.50 |
4.38 |
7.22 |
Therefore, the lattice parameter of GYBC did not show significant variation because of the compensating effects of Gd3+ and Yb3+. The XRD patterns of mixed powders sintered at 1250 °C (Fig. S2†) show no secondary phases and impurities, indicating that GYBC, GDC 10, and GDC 20 exhibited high chemical stability. The conductivity of GYBC exceeded those of GDC 10 and GDC 20 at all temperatures, particularly at high temperatures (Fig. 2(a) and (b)), reaching 0.079 S cm−1 at 800 °C, which is higher than the values of GDC 10 (0.049 S cm−1) and GDC 20 (0.068 S cm−1). The conductivity value was similar to that of GDC 10 (0.045 S cm−1) reported in the previous literature.36 The corresponding activation energies ranged from 0.7 to 0.9 eV and were similar to those previously reported for doped ceria.36–38 In particular, the activation energy of GYBC (0.759 eV) was lower than those of GDC 10 (0.768 eV) and GDC 20 (0.774 eV). This behavior suggested that the conduction mechanism of GYBC resembled that of conventional GDC 10 and GDC 20. Fig. 2(c) presents the thermogravimetric analysis (TGA) results for GDC 10, GDC 20, and GYBC in ambient air, conducted to quantify the oxygen vacancy formation. The mass changes observed in the TGA curves allow estimation of the oxygen non-stoichiometry (δ) in each material.26 Notably, GYBC shows significantly higher weight loss at the final temperature compared to GDC 10 and GDC 20, indicating a more substantial release of lattice oxygen. Additionally, the δ versus time plot in Fig. S4† illustrates that GYBC releases lattice oxygen both more rapidly and in greater amounts than either GDC 10 or GDC 20.39 To investigate the sintering behavior and determine the sintering temperature, the shrinkage of each powder pellet was measured using a dilatometer, as shown in Fig. S3.† GDC 10, GDC 20, and GYBC exhibited similar sintering behaviors, featuring shrinkage onset temperatures of 1000, 900, and 900 °C, respectively, with the lower value of GYBC ascribed to the presence of Bi. In all cases, shrinkage was completed at ∼1200 °C. Thus, sintering at 1250 °C for 2 h was considered appropriate for all three materials (depending on sintering additives and the type of dopant).20,40–42 The sinterability of GDC 10, GDC 20, and GYBC was investigated by FE-SEM imaging of cross-sections and surfaces (Fig. 2(d)–(f) and S6†). In the case of GYBC (Fig. 2(f) and S6(c)†), pronounced particle necking and no notable pores were observed after sintering, whereas no such necking (i.e., low sinterability) was observed for GDC 10 and GDC 20 (Fig. 2(d) and (e), respectively). Additionally, pellet porosity (Fig. S5†) decreased in the order of GDC 10 (12.7%) > GDC 20 (7.2%) > GYBC (0.31%). These results suggested that the introduction of Bi reduced the sintering temperature.43
 |
| | Fig. 2 (a) Conductivity–temperature and (b) corresponding Arrhenius plots for GDC 10, GDC 20, and GYBC. (c) TG curves for GDC 10, GDC 20, and GYBC. Cross-sectional field-emission scanning electron microscopy (FE-SEM) images of (d) GDC 10, (e) GDC 20, and (f) GYBC pellets sintered at 1250 °C. | |
Thus, the redesigned GYBC could be used as a buffer layer with a dense structure, suppressing the formation of secondary phases. However, Bi is known to be a highly volatile material; quantitative analysis by inductively coupled plasma-optical emission spectroscopy (ICP-OES) was performed to determine the Bi content of sintered GYBC (Fig. S7†). Sintering had no notable effect on the contents of Gd and Yb but decreased the Bi content from 0.024 to 0.014 mol%. We concluded that some of the Bi was volatilized and facilitated sintering, while the remaining Bi contributed to the increased conductivity of GYBC. Electrochemical analysis was conducted on electrolyte-supported cells (ESCs) with LSM electrodes and GDC 10, GDC 20, and GYBC buffer layers. The unit cell configuration and microstructure of the GYBC-based ESC are illustrated in Fig. 3(a) and (b), respectively. The GYBC buffer layer, with approximately 2–3 μm thickness, exhibited a well-integrated network structure with the electrolyte and electrode layers. As shown in Fig. S9,† GDC 10 demonstrated significantly greater necking formation compared to GDC 20. Fig. 3(c) and (d) present the performance comparison of GDC 10, GDC 20, and GYBC cells at 800 °C. The maximum power density decreased in the order of GYBC (0.268 W cm−2) > GDC 10 (0.230 W cm−2) > GDC 20 (0.163 W cm−2). To delve deeper into the influence of the buffer layer on the electrode process, impedance spectra were recorded at 800 °C (Fig. 3(e)). While the high-frequency resistances (Rs) of the three cells were comparable, the polarization resistances (Rp) exhibited significant differences, increasing in the order of GYBC (1.19 Ω cm2) < GDC 10 (1.75 Ω cm2) < GDC 20 (2.29 Ω cm2). The improved performance of the GYBC cell, particularly evident at lower temperatures (Fig. S8†), can be attributed to its reduced polarization resistance. Fig. 3(f) presents the Arrhenius plots used to determine the activation energies of Rs and Rp for cells utilizing GDC 10, GDC 20, and GYBC as electrode and interlayer materials. The Rs activation energy of the GYBC cell (0.80 eV) was lower than those of the GDC 10 (0.83 eV) and GDC 20 (0.89 eV) cells, suggesting an enhanced kinetics of the oxygen exchange reaction at the cathode interface. Furthermore, these results indicated that conductivity contributed to the Rs activation energy (Fig. 2(a)). The Rp activation energy of the GYBC cell (1.26 eV) was lower than those of the GDC 10 (1.35 eV) and GDC 20 (1.34 eV) cells, suggesting the high performance of GYBC in the anode/electrolyte interface as well. To understand the origin of this enhanced electrochemical performance, we investigated the formation of oxygen vacancies by Raman spectroscopy (Fig. 4). The survey spectra of GDC 10, GDC 20, and GYBC (Fig. 4(a)) featured a dominant peak of the symmetric stretching of the Ce–O8 crystal unit (fluorite structure) at 464.4 cm−1 and weaker peaks in the oxygen vacancy range (500–700 cm−1).44–46 The main peak positions were similar for all three samples, but the main peak widths varied. GDC 20 exhibited a broader peak, indicating a higher degree of lattice disorder and defect content, compared to GDC 10 and GYBC, which had similar peak widths.46,47 In addition, the full width at half maximum of this peak was proportional to the dopant amount, which indicated that doping resulted in Ce–O bond breakage. This result confirmed that GYBC contained elements with large ionic radii (Gd3+: 1.07 Å, Yb3+: 0.98 Å, and Bi3+: 1.17 Å) Ce4+ (0.97 Å) and featured a dopant content higher than that of GDC 10 and lower than that of GDC 20. The oxygen vacancy peaks were deconvoluted into those of extrinsic (550 cm−1) and intrinsic (600 cm−1) vacancies (Fig. 4(b)). The formation of extrinsic vacancies was ascribed to the substitution of a tetravalent ion (Ce4+) by a trivalent one (Gd3+, Bi3+, or Yb3+) and the resulting charge compensation.48–50 The substitution reactions can be described using the Kröger–Vink notation:
 |
| | Fig. 3 (a) Schematic of the employed electrolyte-supported cells (ESCs), (b) microstructure of the GYBC ESC, (c) current density–power density–voltage curves of GDC 10, GDC 20, and GYBC ESCs recorded at 800 °C, (d) maximum power densities of GDC 10, GDC 20, and GYBC ESCs obtained at 800 °C, (e) Nyquist plots of GDC 10, GDC 20, and GYBC ESCs recorded at 800 °C, and (f) Arrhenius plots of Rs and Rp for GDC 10, GDC 20, and GYBC ESCs. | |
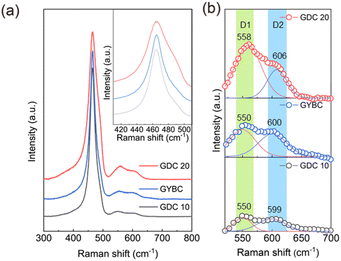 |
| | Fig. 4 Raman spectra of GDC 10, GDC 20 and GYBC. (a) Full-range spectra and (b) oxygen vacancy peaks deconvoluted into signals of intrinsic (blue) and extrinsic (red) vacancies. | |
For further analysis, extrinsic and intrinsic defects were separated into D1 (550 cm−1) and D2 (600 cm−1) peaks. The amount of defects in the three samples was estimated by calculating the ratio of the D1 or D2 peak intensity to the F2g band intensity; these parameters, called D1/F2g and D2/F2g, respectively, are summarized in Table 2.44 The results showed that the amount of extrinsic oxygen vacancies induced by trivalent element doping followed the order of GDC 20 > GYBC > GDC 10. Among them, GYBC showed higher intrinsic oxygen vacancies than GDC 10 and GDC 20. The formation of intrinsic oxygen vacancies is attributed to the reduction of Ce4+ to Ce3+.51 The total oxygen vacancy concentration decreased in the order of GDC 20 > GYBC > GDC 10. The enhanced properties of GYBC are expected to facilitate oxygen ion migration even under oxygen-deficient conditions. These properties help to improve the electrical conductivity and electrochemical performance.
Table 2 Raman parameters calculated for GDC 10, GDC 20, and GYBC
|
|
D1/F2g |
D2/F2g |
D/F2g |
| GDC 10 |
0.061 |
0.045 |
0.106 |
| GYBC |
0.143 |
0.096 |
0.238 |
| GDC 20 |
0.110 |
0.097 |
0.207 |
To evaluate the characteristics of GYBC in an oxygen atmosphere, we measured its OSC, TPO, and oxygen transfer number and compared them with those of GDC 10 and GDC 20. GYBC showed a greater weight change during the redox cycle compared to GDC 10 and GDC 20 (Fig. 5(a)). The average oxygen storage capacity (OSC) followed the order of GDC 10 (70.4 μmol O2 per g) < GDC 20 (73.7 μmol O2 per g) < GYBC (133.6 μmol O2 per g), with GYBC exhibiting the highest value (Fig. 5(b)). This result is associated with the doped elements in GYBC. In the case of Yb, which has an atomic radius similar to that of Ce, the binding energies of Yb–O and Ce–O are comparable. However, for Gd, the Gd–O binding energy is significantly higher than that of Ce–O.52 Furthermore, Bi, which has a larger atomic radius than Ce4+, has been reported in several studies to form a weaker Bi–O bond compared to the Ce–O bond.25 These weaker bonds may contribute to the increased OSC observed in GYBC. The high OSC of these GYBC compounds is expected to improve their performance as buffer layers or electrode materials. Fig. 5(c) presents the results of O2-TPD measurements,53 revealing that oxygen desorption peaks were observed for all samples. The low-temperature peaks (<400 °C) were ascribed to oxygen desorption from the catalyst surface. In particular, the desorption peaks around 300 °C were ascribed to the desorption of surface active oxygen species, e.g., O2−, O−, and O2.53–56 The low-temperature peak was most intense for GYBC, in which case it was observed at 311 °C, whereas the most intense peaks of GDC 10 and GDC 20 were observed at 330 and 317 °C, respectively. Thus, the oxidation temperature decreased with increasing dopant and oxygen vacancy contents. GYBC also showed good Ox adsorption ability due to the interaction between Bi and Ce,34 thus featuring an oxidation temperature lower and an oxygen desorption peak stronger than those of GDC 10 and GDC 20. Hence, GYBC was assumed to be more sensitive to the reaction with oxygen on the surface than GDC 10 and GDC 20.
 |
| | Fig. 5 (a) Oxygen storage/release curves, (b) oxygen storage capacities, (c) O2 temperature-programmed desorption curves, and (d) oxygen transfer numbers of GDC 10, GDC 20, and GYBC. | |
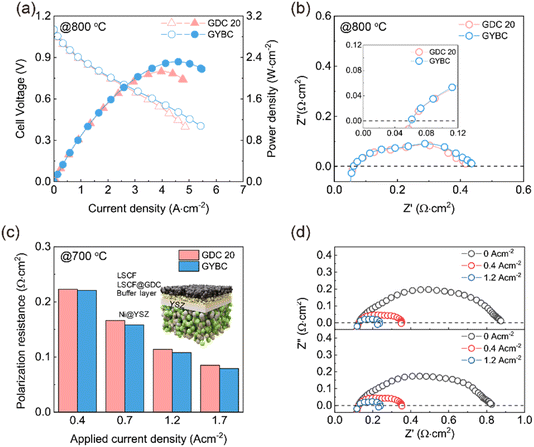
This improved sensitivity was expected to correlate with the OSC data in Fig. 5(b). Oxygen transfer numbers were calculated in the temperature range of 600–900 °C using open-circuit voltage (OCV) measurements between air (cathode) and oxygen (anode) (Fig. 5(d)). GDC 10, GDC 20, and GYBC pellets were sintered to full density at 1500 °C. The measured values were comparable to those of GDC 20 reported in previous studies.57 At all temperatures, GYBC exhibited higher oxygen transfer numbers (and thus superior oxygen ion transport efficiency) than GDC 10 and GDC 20. These results indicate that GYBC not only shows high sensitivity to oxygen ions but also has enhanced capacity for oxygen storage/release and facilitates oxygen ion transport. This high oxygen transfer number suggests that GYBC is not only suitable as a buffer layer for future SOC applications but is also a promising electrode material. Our results demonstrated that an optimized GYBC buffer layer maintained high electrochemical performance and acted as a suitable oxygen source during high-current-density operation to achieve enhanced cell (especially ASC) performance. Fig. 6 presents the electrochemical performances of GDC 20 and GYBC ASCs. Owing to the high ionic conductivity and OSC of GYBC, the corresponding cell delivered a power density of 2.32 W cm−2 at 800 °C, outperforming the GDC 20 cell (2.14 W cm−2) (Fig. 6(a) and S10†). The outstanding oxygen storage capacity (OSC) of GYBC appears to enhance the cell performance by storing oxygen within the lattice and continuously supplying oxygen ions to the electrolyte.58 However, under the OCV conditions in the EIS analysis at 800 °C, the Rs values were similar, while the Rp values for the GYBC and GDC 20 cells were 0.35 and 0.37 Ω cm2, respectively, in contrast with the cell performance (Fig. 6(b)). Therefore, electrochemical analysis was concluded to be essential for understanding the inverse relationship between the performance and Rp of these two samples during operation. Specifically, there is a need to gain insight into the real-time supply and flow of oxygen within a high current range. Therefore, electrochemical analysis was performed on the impedance spectra of the ASCs under applied current. Fig. 6(c) shows that in both cases, Rp decreased with increasing applied current density, indicating the concomitant acceleration of oxygen and hydrogen evolution reactions due to electrode activation.59,60 Moreover, starting from an applied current density of 0.7 A cm−2, GYBC (0.17 Ω cm2) demonstrated a lower Rp than GDC 20 (0.16 Ω cm2). This observation reflects the superior OSC of GYBC, indicating the significant enhancement of the overall electrochemical reaction during practical cell operation. As shown in Fig. 6(d), the Rp of both cells markedly decreased with increasing current density, which indicated the concomitant acceleration of the electrochemical reaction involved in electrode activation. To investigate the oxygen chemical capacitance of these interlayers under different applied current conditions, DRT analysis was conducted to identify the primary processes at the electrodes. We further conducted DRT analysis for ASCs with different oxygen storage layers at 700 °C and various applied current densities (Fig. 7(a)),61,62 identifying four peaks, namely P1 (O2− transport at the electrode/electrolyte interface), P2 (surface exchange of O2), P3 (electrochemical reaction of H2 at the anode), and P4 (gas diffusion).63–65 Upon the application of current, a trend of decreasing resistance was observed for P1 and P3 while concomitantly disappearing for P2 and P4. However, for a clear understanding of the OSC behavior, one must focus on the characteristics of P1, which corresponds to the storage and release of oxygen ions in the OSC layer. In general, DRT analysis involves R-CPE parallel circuits (RQ elements) to identify multistep electrode reactions. Accordingly, we estimated the capacitance (Cct) associated with the charge transfer of oxygen ions at the electrode/electrolyte interface as follows66–68
where
fmax is the frequency of the P1 maximum and
Rct is the charge-transfer resistance of oxygen ions (P1). As shown in
Fig. 7(b), the GYBC cell achieved a higher
Cct than the GDC 20 cell at current densities above 0.4 A cm
−2, which corresponds to oxygen starvation conditions. Furthermore, the
Cct of the GYBC cell increased more rapidly than that of the GDC 20 cell in response to the applied current. This difference is particularly pronounced at current densities exceeding 1.2 A cm
−2. These results suggest that (1) GYBC exhibits high oxygen storage capability (OSC) under alternating current (ASC) conditions, and (2) OSC plays a crucial role in enhancing the cell performance under oxygen-deficient conditions. The higher performance of GYBC cells compared to that of GDC 20 cells is attributed to their greater oxygen capacitance at high current densities. This increased oxygen capacitance enables more charge to be released at the cathode/electrolyte interface, leading to faster reaction rates and providing a significant advantage for solid oxide fuel cell (SOFC) performance in oxygen-deficient environments. The comparison of MPD to similar SOFC configurations with a ceria-based buffer layer previously reported is summarized in
Table 3. Thus, the optimized GYBC buffer layer helped maintain high electrochemical performance and acted as a reliable oxygen source during high-current-density operation, particularly in the case of ASCs.
Fig. 8 shows the cross-sectional microstructures and elemental distributions of spent GDC 20 and GYBC ASCs. The GYBC buffer layer (thickness = 5.0 μm) was thinner than the GDC 20 layer (5.52 μm) because of the better sinterability of the former (the originally deposited coating had the same thickness). Both buffer layers were uniformly coated with the YSZ electrolyte. No Sr segregation was observed in both cells, which suggested that similar to GDC 20, GYBC acted as a buffer (albeit with lower thickness) to prevent secondary phase formation. This research focuses on the problem of performance degradation in SOFCs, placing particular emphasis on suppressing secondary phase formation, which occurs because of the reaction between the electrolyte and cathode material and is a major cause of performance degradation in SOFCs. This problem can be mitigated through the development of new buffer layer materials, such as GYBC. Compared with the widely used GDC 10 and GDC 20, GYBC exhibited a denser structure at the same sintering temperature and oxygen storage capability (
Fig. 9(a) and (b)). This structure played an important role in effectively suppressing the formation of secondary phases while ensuring high oxygen-ion storage/release performance. Therefore, GYBC holds considerable promise as a buffer layer material. The electrochemical analysis results presented in
Fig. 9(c) and (d) highlight the performance of the ASC with a GYBC buffer layer, showing that high OSCs were achieved at different temperatures, with the maximum power densities at 850, 800, 750, and 700 °C equaling 2.68, 2.32, 1.83, and 1.22 W cm
−2, respectively. This high performance was attributed to the effective oxygen transport and storage capacity of GYBC, which also contributed to the overall performance improvement by decreasing the electrical resistance.
Fig. 9(e) compares the performances of ASCs with GDC 20 and GYBC buffer layers, revealing the superiority of the latter cell. Thus, the GYBC buffer layer not only exhibited good oxygen storage/release capabilities but also effectively suppressed secondary phase formation, improving the overall SOFC performance.
 |
| | Fig. 6 (a) Current density–power density–voltage curves of GDC 20 and GYBC anode-supported cells (ASCs) recorded at 800 °C, (b) Nyquist plots of GDC 20 and GYBC ASCs recorded at 800 °C, (c) polarization resistances of GDC 20 and GYBC ASCs determined at different applied current densities and 700 °C, and (d) Nyquist plots of GDC 20 and GYBC ASCs recorded at different applied current densities and 700 °C. | |
 |
| | Fig. 7 (a) Distribution of relaxation time (DRT) plots of the ASC with GDC 20 and GYBC buffer layer applied bias, and (b) capacitances of GDC 20 and GYBC determined at different applied current densities. | |
Table 3 Summary of electrochemical performance in the current study and comparative literature
| Materials |
@800 °C |
@750 °C |
Ref. |
| Anode |
Electrolyte |
Interlayer |
Cathode |
MPD (W cm−2) |
R
p (Ω cm2) |
MPD (W cm−2) |
R
p (Ω cm2) |
| Ni-YSZ |
YSZ (5 μm) |
GYBC (5 μm) |
LSCF-GDC/LSCF |
2.32 |
0.374 |
1.83 |
0.463 |
This work |
| Ni-YSZ |
YSZ (5 μm) |
GDC 20 (5 μm) |
LSCF-GDC/LSCF |
2.13 |
0.353 |
1.72 |
0.472 |
This work |
| Ni-YSZ |
YSZ (8 μm) |
GDC 10 (3 μm) |
LSCF (30 μm) |
1.641 |
0.326 |
1.012 |
0.572 |
69
|
| Ni-YSZ |
YSZ (8 μm) |
GDC 10 (3 μm) |
LSCF (30 μm) |
1.122 |
0.279 |
0.713 |
0.677 |
69
|
| Ni-YSZ |
YSZ (14 μm) |
GDC 10 (7 μm) |
LSCF-GDC (25 μm) |
|
|
1.180 |
|
70
|
| Ni-YSZ |
YSZ (8 μm) |
GDC 10 (1.4 μm) |
LSCF |
1.34 |
0.13 |
1.03 |
|
71
|
 |
| | Fig. 8 Cross-sectional FE-SEM images and elemental mappings of ASCs with (a) GDC 20 buffer layer cell and (b) with GYBC buffer layers. | |
 |
| | Fig. 9 (a) Schematic structures and (b) average oxygen storage capacities of GDC10, GDC 20 and GYBC-based ASCs, (c) current density–power density–voltage curves and (d) Nyquist plots of the GYBC ASC recorded at different temperatures, and (e) effects of temperature on the maximum power densities of the GDC 20- and GYBC-based ASCs. | |
Conclusions
The fluorite-structured GYBC was designed as an innovative buffer layer for SOFCs: the material showed high conductivity (7.89 × 10⁻² S cm−1 at 800 °C) and oxygen transfer capacity in an oxidizing atmosphere and good sinterability at relatively low temperatures, which was attributed to Bi doping, which increased the sinterability due to weak Bi–O bonds and high conductivity values due to Yb doping. Oxygen ion mobility was further investigated through OSC and O2-TPD analyses, which demonstrated that the oxygen storage/release capacity and oxygen sensitivity of GYBC were superior to those of GDC 10 and GDC 20. Thus, GYBC outperformed GDC 10 and GDC 20 as a buffer layer and electrode material for ESCs. To confirm the OSC effect, we examined an ASC with a GYBC buffer layer (Ni-YSZ/YSZ/GYBC/LSCF-GDC/LSCF), revealing that this layer effectively prevented secondary phase formation and stabilized the electrolyte interface, acting as an efficient oxygen source at high current densities. The above ASC exhibited an enhanced power density of 2.32 W cm−2 at 800 °C. Thus, the high oxygen ion mobility and oxygen storage/release capability of GYBC make it a promising high-density buffer layer and electrode material for SOFCs.
Data availability
The data supporting this article have been included as part of the manuscript and ESI.†
Conflicts of interest
There are no conflicts to declare.
Acknowledgements
This work was supported by the New and Renewable Energy Core Technology Development of the Korea Institute of Energy Technology Evaluation and Planning (KETEP) granted financial resource from the Ministry of Trade, Industry & Energy, Republic of Korea (20213030030220 and 20223030040040). The authors also thank the Ceramic Strategic Technology R&D program through the Korea Institute of Ceramic Engineering & Technology (KICET) (grant NTIS no. 240002182). This work was supported by the Technology Innovation Program (RS-2024-00432125) the Korea Evaluation Institute of Industrial Technology (KEIT) and the Ministry of Trade, Industry & Energy (MOTIE) of the Republic of Korea.
Notes and references
- R. M. Ormerod, Chem. Soc. Rev., 2003, 32, 17–28 RSC.
- J. Zamudio-García, L. Caizán-Juanarena, J. M. Porras-Vázquez, E. R. Losilla and D. Marrero-López, J. Power Sources, 2022, 520, 230852 CrossRef.
- M. Singh, D. Zappa and E. Comini, Int. J. Hydrogen Energy, 2021, 46, 27643–27674 CrossRef CAS.
- B. Timurkutluk, C. Timurkutluk, M. D. Mat and Y. Kaplan, Renewable Sustainable Energy Rev., 2016, 56, 1101–1121 CrossRef CAS.
- E. D. Wachsman and K. T. Lee, Science, 2011, 334, 935–939 CrossRef CAS.
- I. Sreedhar, B. Agarwal, P. Goyal and A. Agarwal, J. Solid State Electrochem., 2020, 24, 1239–1270 CrossRef CAS.
- H. A. Ishfaq, M. Z. Khan, Y. M. Shirke, S. Qamar, A. Hussain, M. T. Mehran, R.-H. Song and M. Saleem, Appl. Catal., B, 2023, 323, 122178 CrossRef CAS.
- O. Yamamoto, Y. Takeda, R. Kanno and M. Noda, Solid State Ionics, 1987, 22, 241–246 CrossRef CAS.
- C. Sun, R. Hui and J. Roller, J. Solid State Electrochem., 2010, 14, 1125–1144 CrossRef CAS.
- Z. Gao, L. V. Mogni, E. C. Miller, J. G. Railsback and S. A. Barnett, Energy Environ. Sci., 2016, 9, 1602–1644 RSC.
- S. P. Simner, M. D. Anderson, M. H. Engelhard and J. W. Stevenson, Electrochem. Solid-State Lett., 2006, 9, A478 CrossRef CAS.
- H. Yokokawa, H. Tu, B. Iwanschitz and A. Mai, J. Power Sources, 2008, 182, 400–412 CrossRef CAS.
- Y. B. Kim, T. M. Gür and F. B. Prinz, ECS Trans., 2011, 35, 1155 CrossRef CAS.
- S.-Y. Park, J. H. Ahn, C.-W. Jeong, C. W. Na, R.-H. Song and J.-H. Lee, Int. J. Hydrogen Energy, 2014, 39, 12894–12903 CrossRef CAS.
- J.-J. Choi, D.-S. Park, B.-G. Seong and H.-Y. Bae, Int. J. Hydrogen Energy, 2012, 37, 9809–9815 CrossRef CAS.
- R. Kiebach, W.-W. Zhang, W. Zhang, M. Chen, K. Norrman, H.-J. Wang, J. R. Bowen, R. Barfod and P. V. Hendriksen, J. Power Sources, 2015, 283, 151–161 CrossRef CAS.
- B. C. Steele, Solid State Ionics, 2000, 129, 95–110 CrossRef CAS.
- H. Xu, K. Cheng, M. Chen, L. Zhang, K. Brodersen and Y. Du, J. Power Sources, 2019, 441, 227152 CrossRef CAS.
- H. Sumi, S. Takahashi, Y. Yamaguchi and H. Shimada, J. Asian Ceram. Soc., 2021, 9, 609–616 CrossRef.
- A. Mehranjani, D. Cumming, D. Sinclair and R. Rothman, J. Eur. Ceram. Soc., 2017, 37, 3981–3993 CrossRef CAS.
- M. E. Kilic, J.-H. Lee and K.-R. Lee, J. Mater. Chem. A, 2021, 9, 13883–13889 RSC.
- L. Zhang, J. Meng, F. Yao, W. Zhang, X. Liu, J. Meng and H. Zhang, Inorg. Chem., 2018, 57, 12690–12696 CrossRef CAS.
- M. Katsuki, S. Wang, K. Yasumoto and M. Dokiya, Solid State Ionics, 2002, 154, 589–595 CrossRef.
- L. A. Eressa and P. B. Rao, Mater. Chem. Phys., 2020, 242, 121914 CrossRef CAS.
- L. Guan, S. Le, S. He, X. Zhu, T. Liu and K. Sun, Electrochim. Acta, 2015, 161, 129–136 CrossRef CAS.
- S. Lee, K. Lee, J. Lee, J. Lee, T. Kim and J. Bae, Int. J. Precis. Eng. Manuf.-Green Technol., 2024, 11, 1217–1228 CrossRef.
- Q. Lyu, N. Wang, Z. Li, M. Peng, H. Qu, Q. Zhong, Y. Sun and T. Zhu, J. Power Sources, 2022, 521, 230933 CrossRef CAS.
-
A. Larson and R. Von Dreele, General Structure Analysis System-GSAS/EXPGUI, LAUR, 2000, pp. 86–748 Search PubMed.
- B. H. Toby, J. Appl. Crystallogr., 2001, 34, 210–213 CrossRef CAS.
- B. H. Toby and R. B. Von Dreele, J. Appl. Crystallogr., 2013, 46, 544–549 CrossRef CAS.
- C. E. Jeyanthi, R. Siddheswaran, P. Kumar, V. S. Shankar and K. Rajarajan, Ceram. Int., 2014, 40, 8599–8605 CrossRef.
- Y. Liu, M. Xu, Y. Zhao and B. A. Horri, Mol. Syst. Des. Eng., 2023, 8, 992–1003 RSC.
- S. Acharya, V. Gaikwad, V. Sathe and S. Kulkarni, Appl. Phys. Lett., 2014, 104, 113508 CrossRef.
- Y. Wang, Y. Xie, C. Zhang, W. Chen, J. Wang, R. Zhang and H. Yang, J. Environ. Chem. Eng., 2021, 9, 105049 CrossRef CAS.
- S. Omar, E. D. Wachsman, J. L. Jones and J. C. Nino, J. Am. Ceram. Soc., 2009, 92, 2674–2681 CrossRef CAS.
- Z. Tianshu, P. Hing, H. Huang and J. Kilner, Solid State Ionics, 2002, 148, 567–573 CrossRef.
- V. V. Kharton, A. Viskup, F. Figueiredo, E. Naumovich, A. Shaulo and F. Marques, Mater. Lett., 2002, 53, 160–164 CrossRef CAS.
- S. Shirbhate, A. K. Yadav, S. Barman and S. Acharya, ECS J. Solid State Sci. Technol., 2021, 10, 101010 CrossRef CAS.
- S. W. Lee, J.-W. Park, Y.-W. Ju and T. H. Shin, Small Struct., 2024, 5, 2300292 CrossRef CAS.
- J. Zhang, C. Lenser, N. H. Menzler and O. Guillon, Solid State Ionics, 2020, 344, 115138 CrossRef CAS.
- I. Shajahan, H. P. Dasari and P. Govardhan, Mater. Chem. Phys., 2020, 240, 122211 CrossRef CAS.
- J. Shin, S. Yang, H.-I. Ji, S. Park, H. Kim, J.-W. Son, J.-H. Lee, B.-K. Kim, J. Hong and K. J. Yoon, J. Alloys Compd., 2021, 868, 159092 CrossRef CAS.
- V. Gil, J. Tartaj, C. Moure and P. Duran, Ceram. Int., 2007, 33, 471–475 CrossRef CAS.
- E. Sartoretti, C. Novara, F. Giorgis, M. Piumetti, S. Bensaid, N. Russo and D. Fino, Sci. Rep., 2019, 9, 3875 CrossRef.
- L. Li, F. Chen, J.-Q. Lu and M.-F. Luo, J. Phys. Chem. A, 2011, 115, 7972–7977 CrossRef CAS.
- J. McBride, K. Hass, B. Poindexter and W. Weber, J. Appl. Phys., 1994, 76, 2435–2441 CrossRef CAS.
- S. Agarwal, X. Zhu, E. Hensen, L. Lefferts and B. Mojet, J. Phys. Chem. C, 2014, 118, 4131–4142 CrossRef CAS.
- S. Aškrabić, Z. Dohčević-Mitrović, M. Radović, M. Šćepanović and Z. Popović, J. Raman Spectrosc., 2009, 40, 650–655 CrossRef.
- T. Vinodkumar, B. G. Rao and B. M. Reddy, Catal. Today, 2015, 253, 57–64 CrossRef CAS.
- S. Acharya, V. Gaikwad, S. D'Souza and S. Barman, Solid State Ionics, 2014, 260, 21–29 CrossRef CAS.
- S. Chen, L. Li, W. Hu, X. Huang, Q. Li, Y. Xu, Y. Zuo and G. Li, ACS Appl. Mater. Interfaces, 2015, 7, 22999–23007 CrossRef CAS PubMed.
- R. Schmitt, A. Nenning, O. Kraynis, R. Korobko, A. I. Frenkel, I. Lubomirsky, S. M. Haile and J. L. Rupp, Chem. Soc. Rev., 2020, 49, 554–592 RSC.
- J. Shi, H. Li, A. Genest, W. Zhao, P. Qi, T. Wang and G. Rupprechter, Appl. Catal., B, 2022, 301, 120789 CrossRef CAS.
- Z. Mohamed, V. D. Dasireddy, S. Singh and H. B. Friedrich, Renewable Energy, 2020, 148, 1041–1053 CrossRef CAS.
- J. Ye, B. Zhu, B. Cheng, C. Jiang, S. Wageh, A. A. Al-Ghamdi and J. Yu, Adv. Funct. Mater., 2022, 32, 2110423 CrossRef CAS.
- X. Wang, D. Liu, J. Li, J. Zhen and H. Zhang, NPG Asia Mater., 2015, 7, e158 CrossRef CAS.
- D. Ramasamy, A. L. Shaula, N. Nasani, A. V. Kovalevsky and D. P. Fagg, J. Mater. Sci., 2016, 51, 10293–10300 CrossRef CAS.
- X. D. Nguyen, S. W. Lee, S. J. Kim, J. Park, B. Koo, S. H. Lee, S. Lee, H. T. Lim, J. T. Irvine and T. H. Shin, Adv. Sci., 2024, 2402348 CrossRef.
- S. Koohfar, M. Ghasemi, T. Hafen, G. Dimitrakopoulos, D. Kim, J. Pike, S. Elangovan, E. D. Gomez and B. Yildiz, Nat. Commun., 2023, 14, 7203 CrossRef CAS PubMed.
- L. Bernadet, M. Morales, X. Capdevila, F. Ramos, M. Monterde, J. Calero, A. Morata, M. Torrell and A. Tarancón, J. Phys.: Energy, 2021, 3, 024002 Search PubMed.
- H. Schichlein, A. C. Müller, M. Voigts, A. Krügel and E. Ivers-Tiffée, J. Appl. Electrochem., 2002, 32, 875–882 CrossRef CAS.
- T. H. Wan, M. Saccoccio, C. Chen and F. Ciucci, Electrochim. Acta, 2015, 184, 483–499 CrossRef CAS.
- N. Shi, F. Su, D. Huan, Y. Xie, J. Lin, W. Tan, R. Peng, C. Xia, C. Chen and Y. Lu, J. Mater. Chem. A, 2017, 5, 19664–19671 RSC.
- D. Osinkin, J. Power Sources, 2022, 527, 231120 CrossRef CAS.
- Z. Zheng, J. Jing, Z. Lei, Z. Wang, Z. Yang, C. Jin and S. Peng, Int. J. Hydrogen Energy, 2022, 47, 18139–18147 Search PubMed.
- N. O. Laschuk, E. B. Easton and O. V. Zenkina, RSC Adv., 2021, 11, 27925–27936 Search PubMed.
- R. P. Janek, W. R. Fawcett and A. Ulman, Langmuir, 1998, 14, 3011–3018 Search PubMed.
- J. Ren, S. R. Gamble, A. Roscoe, J. T. Irvine and G. Burt, Fuel Cells, 2012, 12, 773–786 Search PubMed.
- K. Xu, K. Pei, B. Zhao, Y. Zhao, Q. Niu and Y. Chen, Int. J. Hydrogen Energy, 2021, 46, 32242–32249 CrossRef CAS.
- D. W. Joh, A. Cha, J. H. Park, K. J. Kim, K. T. Bae, D. Kim, Y. K. Choi, H. An, J. S. Shin and K. J. Yoon, ACS Appl. Nano Mater., 2018, 1, 2934–2942 CrossRef CAS.
- Z. Gao and S. A. Barnett, J. Electrochem. Soc., 2014, 161, F600 CrossRef CAS.
|
| This journal is © The Royal Society of Chemistry 2025 |
Click here to see how this site uses Cookies. View our privacy policy here. 
 Open Access Article
 This Open Access Article is licensed under a
  ac,
Seok Hee
Lee
a,
Younki
Lee
*b,
Ji Haeng
Yu
*d and
Tae Ho
Shin
ac,
Seok Hee
Lee
a,
Younki
Lee
*b,
Ji Haeng
Yu
*d and
Tae Ho
Shin


