
 Open Access Article
 This Open Access Article is licensed under a
 Creative Commons Attribution 3.0 Unported Licence
Techno-economic assessment of two-stage hydropyrolysis of lignin for BTX production using iron-based catalysts†
Giuseppe
Bagnato
a,
Jamie
Horgan
b and
Aimaro
Sanna
 *b
*b
aKORE Group, School of Engineering, Lancaster University, Lancaster, LA1 4BY, UK
bAdvanced Biofuels Lab, Institute of Mechanical, Process and Energy Engineering, School of Engineering and Physical Sciences, Heriot-Watt University, Edinburgh, EH14 4AS, UK. E-mail: a.sanna@hwu.ac.uk
First published on 27th January 2025
Abstract
The thermal degradation of the lignin contained in biomass, followed by catalytic upgrading of the resultant bio-oil, offers a promising renewable generation pathway for aromatic commodity chemicals, in particular benzene, toluene and xylene (collectively ‘BTX’). The primary barrier to widespread adoption of this technology is its economic unfavourability relative to petroleum-derived BTX production. Previous work has determined that iron-based zirconium oxide catalysts for the hydrodeoxygenation (HDO) upgrading step are able to selectively generate aromatic hydrocarbons (up to 12 wt%) and minimise catalyst coking. The techno-economic assessment (TEA) of a hypothetical industrial-scale biomass hydropyrolysis plant, converting 2000 tonnes per day of lignin waste into commodity chemicals using FeReOx/ZrO2 and Fe/ZrO2 catalysed HDO respectively in scenario 1 (S1) and scenario 2 (S2), was investigated. The TEA was carried out by constructing a robust model that integrates both technical and economic aspects of the process. A Monte Carlo-type sensitivity analysis was then used to examine the sensitivity of the predicted earnings. With the yearly Cost of Manufacturing (COM) estimated to be 88/158 M£ per year and revenues predicted to be 116/171 M£ per year, the base-case processes were predicted to make a yearly gain of approximately 27.6 and 12.7 M£ per year respectively in scenarios 1 and 2, with the sensitivity analysis yielding gross earnings of approximately 65% (S1) and 95% (S2) of simulations. The variable to which the profitability was most sensitive was found to be the bio-oil yield, and maximisation of this yield is recommended as a focus of further research.
Sustainability spotlightThe conversion of lignin waste to aromatics is recognized to be a viable pathway in helping realize the goal of a carbon-neutral society. Fast pyrolysis to transform waste biomass often leads to uncontrollable product distribution with little product value other than as a low-grade fuel. In this context, recently hydropyrolysis has emerged as a technology to overcome this issue by increasing the selectivity of the process to more desirable hydrocarbons (e.g. BTX, cycloalkanes) using hydrogen from renewable energy or produced on-site from the biomass waste itself. Although many TEAs are available for fast pyrolysis to bio-oil, there is a lack of knowledge on the economic feasibility of hydropyrolysis, which is the focus of this work. Our work emphasizes the importance of the following UN sustainable development goals: affordable and clean energy (SDG 7), industry, innovation, and infrastructure (SDG 9), and climate action (SDG 13). |
Introduction
As modern society seeks to reduce its dependence on petrochemicals, establishing renewable sources of energy and petroleum-derived chemicals has become essential. Aromatic hydrocarbons, such as benzene, toluene, and xylene (collectively known as BTX), are critical in the production of a wide range of products, including plastics and synthetic fibers. Traditionally derived from crude oil, these compounds are non-renewable, making the development of renewable alternatives a key challenge. While various renewable sources for aromatics exist, lignocellulosic biomass (LCB) has emerged as the most promising feedstock. Among the three primary polymers in LCB—cellulose, hemicellulose, and lignin—only lignin contains aromatic rings, making it the most relevant biomass component for BTX production.1–4 For example, significant quantities of waste lignin resulting from bioethanol and paper production could be converted to BTX.One effective method for this conversion is pyrolysis, a thermal degradation process where lignin is broken down in an inert atmosphere. To upgrade the resulting oil-phase product into higher-value aromatic compounds, the process is often followed by hydrodeoxygenation (HDO), which removes oxygen from the bio-oil using hydrogen and a catalyst. However, pyrolysis also generates byproducts, such as non-condensable gases (NC-gas) and char, which can be utilised for energy or hydrogen production within the process.5
Among the various pyrolysis methods, hydropyrolysis—pyrolysis conducted in a hydrogen atmosphere—has shown significant advantages compared to traditional nitrogen-atmosphere pyrolysis. Hydropyrolysis enables both pyrolysis and HDO to occur in a single reactor, reducing catalyst deactivation due to fouling and improving product quality. Additionally, bio-oil produced by hydropyrolysis is more suitable for the generation of commodity chemicals like BTX, as it reduces the variety and abundance of undesirable byproducts compared to nitrogen-atmosphere pyrolysis.5,6 Previous research has explored different configurations of hydropyrolysis and catalytic pyrolysis in the context of BTX production. Early studies, such as those by Steinberg et al. (1980s), investigated pyrolysis in neutral and reactive atmospheres (N2 and H2), finding that while carbon conversion improved with higher temperatures, BTX yield remained low.7 Zheng et al. demonstrated that non-catalytic hydropyrolysis followed by catalytic HDO could produce BTX with a yield of 5.1 wt% (dry biomass basis). They observed that a single-stage hydropyrolysis and HDO configuration yielded the highest bio-oil yield (approximately 33 wt% relative to the biomass input) and minimised char production due to hydrogen's suppression of free radical re-polymerisation.4
Other studies have further validated the potential of hydropyrolysis as a viable process for BTX production. Venkatakrishnan et al.8 investigated the production of liquid biofuel through the non-catalytic hydropyrolysis of biomass followed by catalytic hydrodeoxygenation of the bio-oil. The study concluded that the carbon recovery in C1–C8 hydrocarbons (i.e. the vapour and liquid phases) was around 54%. This work also explored on-site hydrogen generation from the gas phase, as well as char valorisation. Two synergistic arrangements were explored, both reforming a gas stream to produce hydrogen, with one using char gasification to generate syngas for hydrogen separation and recirculation, while the other combusted char for process heat, with the gasification option deemed more efficient in terms of carbon and energy.
Recognising the possibility for various valorisation routes for the non-liquid product streams, Nguyen et al.9 compared various process configurations in order to determine the optimum process arrangement. Technoeconomic and sensitivity analyses were conducted, leading to the conclusion that cogeneration of hydrogen and synthetic natural gas was the most profitable option, with a generation-cost-per-GW h for biofuel that was comparable to that of petroleum derived fuels. These results were generated by comparing processes using Aspen models. This builds on earlier work by Agrawal et al.,10 who suggested that a similar process design, which used a coal gasifier to generate hydrogen, could be an attractive intermediate step as progress is made towards a fully integrated process.
Resende's investigation into fast catalytic hydropyrolysis of biomass for fuels and chemicals highlights that pyrolysis in a hydrogen atmosphere yields higher hydrocarbon outputs and leads to slower catalyst deactivation compared to that in nitrogen atmospheres, with liquid product yield maximized by minimizing residence time to reduce secondary cracking.11 Meanwhile, Marker et al.12 developed the “Integrated Hydropyrolysis and Hydrodeoxygenation” (IH2) process, involving catalytic hydropyrolysis in a fluidized bed followed by char separation and fixed-bed hydrodeoxygenation, both conducted at pressures of at least 13 bar, with the 2-phase product stream being separated in a flash unit, with the resulting gas undergoing reformation for hydrogen production and char yields of 10% or less.
In a paper analysing the fast pyrolysis of forest residues, Carrasco et al.13 identified high capital and feedstock costs and catalyst deactivation as the primary economic barriers to the widespread adoption of biomass pyrolysis for fuels. The proposed process utilised char for hydrogen production through gasification, whilst using the gas product stream for energy generation. The module costing technique was used as the foundation for a TEA which found that HDO and product separation accounted for around 43% of the total CAPEX, whilst pyrolysis and H2 production were each estimated to account for around 25% of the CAPEX. The minimum selling price for the fuel was estimated to be $6.25 per gallon of product, with feedstock cost being the greatest contributor. The product from this process is competitive with fossil-derived fuels, with gasoline and diesel prices averaging 6.60 and 6.75 USD per gallon respectively as of 23rd March 2021.14,15 The TEA was based on a feedstock rate of 2000 metric tonnes per day, which has emerged from the literature as a common basis for biomass pyrolysis plants.
Bagnato et al.16 designed a process to produce commodity chemicals and biofuels from water-soluble and insoluble liquid phase pyrolysis products, recommending their separation before hydrodeoxygenation, and estimated that the process could process 10 million tonnes of biomass annually into fuels, achieving a mean fuel selling price 53.9% higher than that of fossil fuels, with a return on investment (ROI) of 69%. In a TEA investigation on bio-fuel generation from algae pyrolysis, Bagnato et al.17 estimated that a minimum selling price of $1.43 per litre was needed to break even, which is higher than the cost for lignocellulosic bio-fuels, concluding that further cost reductions are necessary for algae-based processes to compete, with feedstock price being the main economic barrier.
Various catalysts have been proposed to optimize BTX yield from lignocellulosic biomass, with Zheng et al. confirming the viability of non-catalytic hydropyrolysis, though a catalyst is still needed for HDO. While many processes use more complex catalytic pyrolysis to improve product selectivity, Elfadly et al.18 found that the MCM-48 mesoporous material catalyzed lignin pyrolysis to achieve a high BTX yield, with catalyst acidity being the most significant factor, and Jan et al.19 demonstrated that palladium-doped HZSM-5 was an effective catalyst for hydropyrolysis.
Sirous-Rezaei et al.20,21 investigated various iron-based catalysts for HDO using a two-stage microreactor, finding that Fe/ZrO2 provided a fair BTX yield, especially at lower HDO temperatures (350 °C), with a yield of 29% using m-cresol feedstock. The yield varied depending on the feedstock, with lower yields for guaiacol (5.9%) and anisole (18%). The addition of rhenium oxide improved catalytic activity, and Fe/ZrO2 was also highly effective at suppressing coke formation, outperforming other catalysts like Fe/Hbeta.
Ce, Na, Pd and Fe supported on zirconium oxide were recently tested for the ambient pressure hydropyrolysis/HDO of ETEK lignin.22 Fe/ZrO2 demonstrated the highest BTX selectivity (67%) for bio-oil from lignin hydropyrolysis, significantly outperforming other catalysts such as PdFeZrO2, which achieved just 16%.
The above suggests that hydropyrolysis of lignin followed by ex situ HDO of the resultant bio-oil is attracting attention due to the possibility of minimising coke formation and the possibility to operate under low/mild operating conditions. Among various catalysts investigated for the HDO through previous work, zirconium oxide doped materials (e.g. Fe/ZrO2) gave a bio-oil with the highest selectivity towards aromatics and were effective at suppressing coke formation, while FeReOx/ZrO2 resulted in larger BTX yield (4.8%) with a coke suppression effect comparable to that of Fe/ZrO2.21
Therefore, this work aims to conduct a techno-economic analysis (TEA) on a hypothetical industrial-scale version of the lignin hydropyrolysis/HDO process for integrated production of hydrogen and BTX from lignin-rich bio-waste. Following this, the overall cost of production of aromatic hydrocarbons and H2 using this process was estimated and the economics of large-scale production was investigated. A sensitivity analysis was conducted to determine the likelihood of profitable production and to investigate the effects of changing input variables on the predicted profitability.
Methods
Two main base scenarios were assumed in this work. The first assumed that the process was designed based on 4 wt% Fe–4 wt%-Re on a zirconium oxide support (FeReOx/ZrO2) to produce BTX/aromatics with an assumed total aromatic hydrocarbon yield of 12 wt% (4.8 wt% BTX),21 and in addition producing (on-site via reforming) the amount of H2 required for hydropyrolysis in the process, while the remnant C1–C3 alkanes were assumed to be sold. Gas composition was assumed from ref. 22. In the second scenario, the process produced 2.4 wt% BTX in the presence of 5 wt% iron on zirconium oxide (Fe/ZrO2) in the base case,22 and all the C1–C3 gases were shifted to hydrogen. Then the produced hydrogen, acetone and cycloalkanes are sold. Both catalysts were prepared by the incipient wetness method using the aqueous solutions of Fe(NO3)3·9H2O and NH4ReO4. The FeReOx/ZrO2 catalyst was then dried (60 and 110 °C) and calcined (3 °C min−1/550 °C/12 h) after impregnation,21 while the Fe/ZrO2 catalyst was aged for 20 h at 90 °C, dried in an oven at 110 °C for 15 h and subsequently calcined in flowing air (30 mL min−1) at 500 °C.22With the yield of BTX predicted, a hypothetical industrial-scale plant was then designed. A high-level process design was followed by an estimation of capital costs, manufacturing costs, and revenues, to evaluate whether the proposed process would be profitable. Assumptions were made about various inputs in order to build a model of the ‘base-case’ process. The model was constructed to be robust, allowing for a sensitivity analysis. The sensitivity analysis evaluated the ways in which the profitability is impacted by changing the values of input variables. In determining the inputs which most strongly impact the profitability, the areas for potential optimisation were identified.
The mass balance and composition of the bio-oil from the FeReOx/ZrO2 and Fe/ZrO2 catalysed HDO were established through previous work.21,22 The yield of the NC-gas stream, assumed in both scenarios from ref. 22, was used to accurately design the hydrogen generation section of the process, while the gas composition (wt%) was assumed to be equal to that determined by Zheng et al.5 for the hydropyrolysis of lignocellulosic biomass at 600 °C (26.2, 22.8, 30.2, 15.7, 0.3, 4.3 and 0.3 respectively for CO2, CO, CH4, C2H4, C3H8 and C3H6), since it is not available in the other considered studies. The potential variability of the gas yield and composition could have implications for the process. For example, it was shown that the use of Ru and Pt catalysts promotes C–C cleavage, which contributes to the formation of CO in the case of Pt, and CH4 in the case of Ru, decreasing the yields of the liquid product.23
Techno-economic evaluation
The techno-economic analysis comprised the modelling of the process and evaluating the results of the model when varying the inputs. Microsoft Excel was used to construct a model comprising interlinked mass/energy balances and economic analyses. The model was constructed such that each input variable was only entered once, in a single cell, to allow for a straightforward evaluation of the effects of changing these inputs. A diagram showing the major elements of the model is given in Fig. 1. | ||
| Fig. 1 Process model. | ||
Process design, plant configuration and mass and energy balances
The reactor was designed as a fixed bed with a catalyst comprising 95 wt% ZrO2 and 5% Fe, in which hydropyrolysis and HDO take place in segregated sections of the reactor at 600 °C/350 °C (scenario 1) and 600 °C/600 °C (scenario 2), both at atmospheric pressure.Given the generally high yields of NC-gases and char, the valorisation of these streams is critical to an economically viable process. Hydrogen is required for both the establishment of the atmosphere in which the hydropyrolysis takes place and as a reactant in the hydrodeoxygenation. It is desirable to eliminate the need for exogenous hydrogen by on-site generation through either gasification of the char stream, or steam reforming of the NC-gases followed by water–gas-shift (WGS) and pressure swing adsorption (PSA). Some combination of both hydrogen production methods can be employed if sufficient hydrogen cannot be generated from either of the streams individually. Both the NC-gas stream and char streams can be combusted for process heating or electricity generation; however the generation of hydrogen should take precedence. There is a consensus in the literature that hydrogen generation from the NC-gases is preferable to gasification of char,9,24,25 and as such the process design has proceeded with the assumption that this generation pathway is preferential.
The technical viability of the generation of hydrogen from NC-gases at the rate required for hydropyrolysis/HDO is determined by the mass balance. The hydropyrolysis/HDO mass balance was constructed using the yield data from previous work which determined the bio-oil composition.5,21,22 Mass balances for both hydrogen production pathways were constructed as well as energy balances for the combustion of both the gas and char streams. This allowed for the evaluation of the technical viability of fulfilling the hydrogen requirement entirely using on-site valorisation of by-products. The hydrogen requirement for HDO was estimated by determining the stoichiometric requirement for a representative sample of the bio-oil constituents – namely the species comprising a significant mole fraction of the oil – and extrapolating for the whole oil stream. Then, it was assumed to use four times the stoichiometric amount required. The quantity of hydrogen generated by reforming the gas stream was determined by constructing a mass balance over the reforming-WGS-PSA section of the proposed process, and this was compared with the stoichiometric requirement. The same comparison was repeated for the gasification of the char.
The hydropyrolysis/HDO energy requirements were determined by the summation of 4 separate energy exchanges, the heating of the biomass feed, the heating of the hydrogen, the reaction enthalpy, and the condenser duty. The duties of the heaters were determined using simple heat transfer calculations, with the heat capacity of lignin approximated from the literature26 and the enthalpy of the product stream calculated using the heat capacities of the individual components. A datum point of 0 °C and 1 atm was used. The energy recoverable from the combustion of the NC-gas stream was determined by using simple enthalpy of combustion calculations, and the energy released by the combustion of the char was estimated by approximating the higher heating value (HHV) of the char. These values were compared to the hydropyrolysis/HDO energy demands to determine the viability of providing all the necessary heating through by-product combustion. Mass and energy balances for a distillation train to separate and purify the BTX hydrocarbons were also constructed.
Capital cost evaluation
The capital costs of the base-case process were estimated using a combination of standard techniques presented in textbooks.27–29 Purchased equipment costs were estimated using one of two parametric methods. For the majority of equipment, the purchase cost (CPC) was estimated by first sourcing a reference cost for that type of equipment from the literature (CREF). For each piece of equipment some sizing parameter, S, and an equipment-specific scaling exponent, n, were then used to estimate the purchase cost for the correct size equipment as required. Eqn (1) was used; | (1) |
The purchase cost of items for which a baseline reference cost from the literature was inapplicable was estimated using parametric correlations of the form given in eqn (2). In this equation a, b and n are equipment-specific parameters taken from the literature27
| CPC = a + bSn | (2) |
The purchased equipment costs calculated from the above equations are accurate only for the year in which the reference cost was estimated. To adjust for increases in price, the actualised bare module cost (Ce) for each piece of equipment is estimated through escalation by the Chemical Engineering Plant Cost Index (CEPCI)30 by using eqn (3);
 | (3) |
To estimate the inside-battery-limits (ISBL) cost, ‘C’, for the base-case process, assumptions are made regarding the costs of various items corresponding to installation and on-site considerations. The ISBL cost is calculated by adjusting the actualised bare module costs according to eqn (4). Values for the adjustment factors (‘fx’) are given in Table 1S.†
| C = ∑Ce[(1 + fp)fm + (fer + fel + fi + fc + fs + fl)] | (4) |
The total fixed capital cost (FCI) is determined by factoring in outside-battery-limits (OSBL) adjustments. These adjustments account for offsites, design/engineering, and cost contingency, and are named in Table 1S.† The FCI is calculated by using eqn (5).
| FCI = C(1 + OS)(1 + DE + X) | (5) |
The accuracy of this FCI calculation is in line with an AACE class 4 estimate and is subject to appropriate uncertainty variations, which are accounted for in the sensitivity analysis.31 This is consistent with the level of detail that would be expected of a feasibility study, up to 15% of project definition relative to a complete project, and it is therefore the appropriate level for the techno-economic assessment. The ISBL and OSBL adjustment factors provided in Table 1S† have been taken from the literature and correspond to a plant processing both solids and fluids.
Working capital is estimated at 15% FCI; a typical value for a plant producing hydrocarbons.26
Estimation of the cost of manufacturing
The method used here for estimating the costs of manufacturing (COM) is taken largely from Turton et al.28 and splits COM into direct, fixed, and general manufacturing expenses.Direct manufacturing costs (DMC) are composed of the costs of raw material (CRM), utilities (CUT), supplies, and all other operating costs which vary according to the production rate. The method described by Turton et al. also includes part of the cost of labour (COL) as an aspect of the DMC. Some of the direct costs, for example, equipment maintenance, are estimated as some percentage of the FCI for the base case. This is further investigated in the sensitivity analysis. The direct manufacturing costs are given in eqn (6).
| DMC = CRM + CUT + 1.33COL + 0.069FCI + 0.03COM | (6) |
The feedstock costs comprise the biomass and catalyst costs. Hydropyrolysis has the benefit of minimal coking and as such the catalyst is assumed to require replacement after one year operation. The costs for the catalyst were estimated based on reactor volume for an assumed residence time of <2 s using average prices from suppliers in the last 12 years.32–34 Although Fe ($104 per t) and ZrO2 ($4300 per t) are cost-effective, rhenium is significantly more expensive, with its historical price over the past 12 years averaging around $2m per tonne. This drives up the catalyst cost in scenario 1 to approximately £ 590k per year, compared to only about £ 30k for scenario 2. This suggests that thermal regeneration of the catalyst by calcination would be a more economical option to increase the lifespan of the catalyst in scenario 1 (although it was not considered in this study), while earlier replacement (e.g. each 6 months) would be preferable for scenario 2 due to the catalyst’s low cost.
The ETEK lignin feedstock is a waste residue from a facility in Sweden which produces bioethanol through hydrolysis of coniferous wood.35 As this is a waste stream which the Swedish manufacturer would otherwise have to pay to discard, the cost of acquisition has been assumed to be negligible.
The fixed manufacturing costs (FMC) include depreciation, overheads, insurance, and all other operating expenses, which do not vary with a changing production rate. Straight-line depreciation was assumed, with a negligible salvage value expected. The FMC is calculated by using eqn (7).
| FMC = 0.708COL + 0.068FCI | (7) |
The general manufacturing expenses (GE) is the sum of all expenses required for the general function of the business, such as administration, sales and distribution, etc. The GE is estimated by using eqn (8).
| GE = 0.177COL + 0.009FCI + 0.16COM | (8) |
The cost of operating labour is estimated by approximating the number of operators required per shift, shifts per operator per year, etc. The costs for electricity were estimated from the energy balance, using a price of 0.11 £ per kW per h, as average in Great Britain between 2013 and 2024.36 The costs for steam, cooling water, air, and all other utilities are estimated using standard values from the literature27 and can be seen in Table 2S.†
Estimation of revenues
The revenues from product sales were estimated using market price data from ICIS Chemical Business, which were accessed through the ProQuest database.37–40 Revenues for the base-case were estimated in a conservative way by approximating 20 years average market price for each product (B = $700 per t; T & X = $500 per t), and scaling the per-tonne prices to the production rate predicted from the mass balance. The market for BTX is expected to increase steadily in the next 20 years with a CAGR of ∼3.5–4%, and their price is expected to increase as well, following the basic principle of supply and demand.41 Given the volatility of crude oil and therefore BTX prices, these estimated revenues were subject to investigation in the sensitivity analysis, where the highest value is close to the current ones (B = ∼$900 per t and T & X = ∼$1000 per t).Hydrogen and C1–C3 alkane price was estimated to be £ 5 per kg (6.4$ per kg)42 and £ 0.5 per kg,43 respectively in the base case scenarios. The hydrogen price was estimated from the historical hydrogen production cost from biomass gasification and reforming and based on 29 previous studies. The average and maximum costs were $3.118 per kg and $8.38 per kg, respectively, where the highest values were considered more reliable.42
The prices of hydrogen and C1–C3 alkanes in the base case scenarios were estimated to be £ 5 per kg ($6.40 per kg) and £ 0.5 per kg ($0.64 per kg), respectively.42,43 The hydrogen price was determined based on historical production costs (since the 1970s) from biomass gasification and reforming, drawing from 29 previous studies. The average hydrogen cost was $3.12 per kg, with a maximum of $8.38 per kg. The higher values were considered more reliable.41
Sensitivity analysis
The values selected for numerous input parameters to the base-case model were generalised assumptions or were based on current economic conditions. To predict how the profitability of the process would respond to changing the values of these inputs, a Monte Carlo-type sensitivity analysis was performed. Distributions of values were predicted for several key inputs, and for each 1000 trial runs a value for each of these variables was randomly selected based on the distribution applied to that variable. The output of the analysis is given as a distribution of the probabilities of values for gross earnings. The sensitivity analysis was performed using an Excel add-in called Oracle Crystal Ball. The confidence level was 95% and the std error of the mean was 0.83 and 1.18, respectively for scenarios 1 and 2. The sensitivity analysis included parameters such as the bio-oil yield, plant lifespan, equipment cost, manufacturing costs and prices of hydrogen and methane.Results and discussion
The yields of the product streams from hydropyrolysis/HDO are presented in Table 1 along with each product rate.21,22 The yield of bio-oil by weight relative to biomass was considered to be 12 wt% in scenario 1 and 3.6% in scenario 2, and the overall yield of BTX relative to biomass was just over 8 wt% and 2.4 wt%, respectively.| Compound | Product distribution, (wt%) – scenario 1 | Product distribution, (wt%) – scenario 2 | Product rate (kg h−1) – scenario 1 | Product rate (kg h−1) – scenario 2 |
|---|---|---|---|---|
| Bio-oil | 12.0 | 3.6 | ||
| Acetone | 0.00 | 0.55 | 0.0 | 459.0 |
| 1,3-Cyclopentadiene | 0.00 | 0.26 | 0.0 | 216.3 |
| 4-Cyclopentene-1,3-diol, trans-1,4-cyclohexadiene | 0.00 | 0.14 | 0.0 | 116.1 |
| 0.00 | 0.09 | 0.0 | 71.4 | |
| Benzene | 4.25 | 1.27 | 3541.7 | 1061.4 |
| Toluene | 3.07 | 0.92 | 2558.3 | 768.6 |
| ortho-Xylene | 0.70 | 0.21 | 583.3 | 174.6 |
| Naphthalene | 3.98 | 0.00 | 3316.7 | 0.00 |
| 1H-Indene, 1-methylene- | 0.00 | 0.11 | 0.00 | 88.2 |
| Tetradecane, 2,6,10-trimethyl-2-myristynoyl pantetheine | 0.00 | 0.03 | 0.0 | 21.3 |
| 0.00 | 0.02 | 0.0 | 13.2 | |
| Methyl glycocholate, 3TMS derivative | 0.00 | 0.01 | 0.0 | 10.5 |
| Biogas | 59.0 | 65.9 | ||
| Carbon dioxide | 15.48 | 17.29 | 12![[thin space (1/6-em)]](https://www.rsc.org/images/entities/char_2009.gif) 898.66 898.66 |
14407.15 |
| Carbon monoxide | 13.48 | 15.05 | 11229.42 |
12542.70 |
| Methane | 17.85 | 19.93 | 14871.40 |
16610.60 |
| Ethane | 9.29 | 10.37 | 7739.20 | 8644.29 |
| Ethylene | 0.18 | 0.20 | 151.75 | 169.50 |
| Propane | 2.55 | 2.85 | 2124.49 | 2372.94 |
| Propylene | 0.18 | 0.20 | 151.75 | 169.50 |
| Coke | 1.0 | 2.9 | ||
| Carbon | 0.87 | 2.52 | 724.67 | 2101.53 |
| Hydrogen | 0.06 | 0.17 | 48.17 | 139.68 |
| Oxygen | 0.02 | 0.05 | 13.67 | 39.63 |
| Nitrogen | 0.05 | 0.14 | 39.08 | 113.34 |
| Sulphur | 0.01 | 0.03 | 7.75 | 22.48 |
| Bio-char | 28.0 | 27.6 | ||
| Carbon | 22.59 | 22.27 | 18828.06 |
18559.08 |
| Hydrogen | 0.89 | 0.88 | 745.11 | 734.47 |
| Nitrogen | 0.17 | 0.17 | 142.33 | 140.30 |
| Sulphur | 0.01 | 0.01 | 8.17 | 8.05 |
| Chlorine | 0.02 | 0.02 | 14.39 | 14.18 |
| Oxygen | 4.31 | 4.25 | 3595.28 | 3543.92 |
| Total | 100 | 100 |
83333 |
83333 |
Significant quantities of acetone and cycloalkenes were also present in the bio-oil obtained in scenario 2. The composition of the NC-gas stream predicted from the literature5 is also presented in Table 1. The gas contains large quantities of COx, methane, and ethane. Unsaturated and longer-chain hydrocarbons are also present in small quantities. Methane, ethane and propane comprise over 50% of the gas stream, offering promise with respect to hydrogen production or energy generation from the gas stream.
Process design and mass/energy balances
An input rate of 2000 tonnes per day of ETEK lignin was chosen. This feed rate is common in the literature on the subject and has been chosen here due to the ease of comparison afforded by this. With this continuous feed rate and an assumed 90% plant availability,27 a BTX yield of just over 8% and 2.4% relative to biomass corresponds to a yearly production of 52680 and 15804 tonnes, respectively in scenarios 1 and 2. A plant availability rate of 88%, which is realistic in many industrial processes, particularly in chemical plants, would reduce the yearly production of scenarios 1 and 2 to approximately 51457 tonnes and 15457 tonnes, respectively. Acetone and cyclodienes generated at a rate of 3619 and 2268 tonnes per year were also considered in the revenue estimation in scenario 2. The product stream from the reactor is filtered to remove the char, the bio-oil is condensed, and the gas phase is separated in a 2-phase separator. The valuable constituents of the bio-oil are recovered in a distillation train.
About 151670 t per year of C1–C3 alkanes were generated in scenario 1. Methane, ethane and propane are generated at a rate of 242019 tonnes per year in scenario 2. A plant section was designed for the generation of hydrogen from these hydrocarbons by reforming, WGS and PSA. The conversion of methane, ethane and propane in the steam reformer, conversion in the WGS reactor, and hydrogen recovery by PSA were assumed to be 85%, 85% and 65%, respectively in both scenarios. The reforming and WGS were designed to take place at 15 bar and 400 °C. The utility requirements presented in Table 3S† were estimated using appropriately scaled values from the literature.
The stoichiometric hydrogen requirement for a hydropyrolysis/HDO reactor was calculated by considering the hydrogen consumption of a representative sample of the HDO reactions – namely the species comprising a significant mole fraction of the oil (BTX in S1; acetone, 1,3-cyclopentadiene and BTX in S2) – and extrapolating for the whole oil stream. In assessing the viability of fulfilling the hydrogen requirement by reforming the methane in the NC-gas stream, it was decided that an excess of 4 times the stoichiometric requirement should be used. With the assumed conversions and the measured yields of NC-gases and bio-oil, it was determined that hydrogen can be produced from the NC-gas stream at a rate which is around 14 times greater than the stoichiometric requirement for feed to the hydropyrolysis/HDO reactor. The technical viability of generating excess hydrogen on-site from the gas by-products is therefore confirmed.
With the hydrogen generation from NC-gases fully satisfying the H2 requirement and resulting in excess H2 for revenue, the char stream can be combusted for energy recovery. This involves some suitable combination of increasing steam, heating oil, and electricity generation. In both scenarios, with a yield of 27.6% relative to biomass, char is generated at a rate of 552 tonnes per day. A conservative estimate of 12 MJ kg−1 was taken for the HHV of the char. A combustion efficiency of 33% was assumed based on typical efficiencies of coal combustion plants, providing an estimated power generation of 20.7 MW.
A breakdown of the energy exchanges in the hydropyrolysis/HDO section is given in Table 2. The hydropyrolysis/HDO energy requirements were determined by using the summation of 4 separate energy exchanges; the heating of the biomass feed, the heating of the hydrogen, the reaction enthalpy, and the condenser duty. The duties of the heaters were determined using simple heat transfer calculations, with the heat capacity of lignin approximated from the literature26 and the enthalpy of the product stream calculated using heat capacities of the individual components. A datum point of 0 °C and 1 atm was used. The sum of these exchanges predicts an energy requirement of 13 MW (scenario 1) and 23.3 MW (scenario 2). The combustion of char fulfils this energy requirement (20.7 MW) with an 8 MW excess in scenario 1, which is used for heating elsewhere in the plant. The char combustion is not enough to provide all the required heat in scenario 2, with the additional 2.6 MW to be provided externally.
| Energy exchange | Energy input required (MW) | Energy input required (MW) |
|---|---|---|
| Scenario 1 | Scenario 2 | |
| Biomass heating | 16.4 | 16.4 |
| Hydrogen heating | 2.3 | 8.9 |
| Reaction enthalpy | 6.2 | 13.6 |
| Product cooler/condenser | −11.9 | −15.5 |
| Total | 13.0 | 23.3 |
A distillation train is used to separate the BTX hydrocarbons from the other bio-oil components and one another. The distillation train design and energy requirements are approximated using a standard separation system found in the literature.44 Specifically, a new BTX separation process utilising an extended divided-wall column was considered, since although the investment cost was ∼13% larger than that in conventional separation processes, it can reduce by ∼34% the utility cost (heating/cooling duties). Tripled cost to account for the distillation train and extra components to be separated was used.
A high-level PFD of the process is given in Fig. 2, where the biomass and hydrogen are pretreated and fed into the reactor where pyrolysis and HDO reactions take place. The stream in output (S-106) containing the reaction products is cooled down and subsequently the char is separated from the mainstream and burned. The heat produced reduces the cost and CO2 emission related to the energy demand of the process. The gas phase in the output from the char filter is fed to a flash drum separating the gas and liquid phase. The gas phase, containing CO, CO2, CH4 and others, is used for hydrogen production, by the conversion of the hydrocarbons to CO and H2 by a partial oxidation reaction. The CO produced reacts with steam in a water–gas shift reactor to improve the H2 productivity.
 | ||
| Fig. 2 Process PFD. | ||
The liquid phase (S-301) separated by the flash drum enters the liquid separation system where a series of columns are used to separate benzene, toluene and xylene. It is noted that the actual process of BTX separation is more complicated than that described in Fig. 2 due to the presence of several refinement units for increasing the product purity.44
Economic evaluation
Many assumptions or generalisations were made during the development of the process model, and these should be subjected to further scrutiny before any firm conclusions are drawn. The following points highlight specific areas of potential refinement in the techno-economic model.The raw material, labour and utility costs together made up just 10% of the total cost of manufacturing. The remaining 90% of the COM is incurred through items that are calculated as some percentage of the FCI. The largest single contributor to this is yearly maintenance cost, which was estimated at 5% of FCI per year for the base case but investigated between 2% and 10% of FCI in the sensitivity analysis. These percentage values were taken from Turton et al.28 and Bagnato et al.16 and are rough estimates intended to be broadly applicable to any process for a high-level cost estimate. There is scope for refining the estimate, and values used in comparable research papers may provide insight. Equipment costs as calculated by using eqn (1)–(3), as well as reference data and parameters, are given in Table 3. The total equipment cost for the base case was estimated to be 67.1 M£ (scenario 1) and 116.7 M£ (scenario 2), with the large difference ascribed mainly to the complete reforming of the gas stream for H2 recovery in scenario 2. A summary of the total capital costs is provided in Table 4. The ISBL and OSBL costs were estimated using eqn (4) and (5).
| Equipment | C ref (M£) | C ref unit | n | S ref | S | S unit | Scenario 1 cost (M£) | Scenario 2 cost (M£) | Ref. |
|---|---|---|---|---|---|---|---|---|---|
| Feed handling | 4.4 | 4.4 | |||||||
| Conveyors |
0.41 | €2002 | 0.8 | 33.5 | 83.3 | tonne per h | 0.84 | 0.84 | 41 |
| Storage |
1.16 | €2002 | 0.8 | 33.5 | 83.3 | tonne per h | 2.4 | 2.4 | 41 |
| Feeding |
0.48 | €2002 | 1 | 33.5 | 83.3 | tonne per h | 1.2 | 1.2 | 41 |
| Hydropyrolysis/HDO | 12.0 | 12.0 | |||||||
| Reactor |
14 | $2017 | 0.7 | 2000 | 2000 | tonne per day | 12.0 | 12.0 | 9 |
| Energy recovery | 1.4 | 1.4 | |||||||
| Char furnace |
$2007 | 20.7 | MW | 1.4 | 1.4 | 26 | |||
| Purification | 11.9 | 12.9 | |||||||
| Distillation |
7.3 | $2016 | 0.85 | 334 | kmol h−1 | 11.9 | 12.9 | 40 | |
| H2 production | 37.3 | 86.0 | |||||||
| PSA |
0.51 | $2017 | 0.66 | 0.06 | m3 s−1 | 1.0 | 2.3 | 41 | |
| Reforming |
121 | $2017 | 0.6 | 100 | m3 s−1 | 26.7 | 60.3 | 41 | |
| WGS |
37.4 | $2017 | 0.65 | 8819 | kmol h−1 | 9.7 | 23.4 | 41 |
| Item | Scenario 1 | Scenario 2 | ||
|---|---|---|---|---|
| Cost (M£) | % of FCI | Cost (M£) | % of FCI | |
| Equipment cost | 67.1 | 19.6 | 116.7 | 19.6 |
| ISBL costs | 124.7 | 37.3 | 221.6 | 37.3 |
| Erection | 26.8 | 7.9 | 46.7 | 7.9 |
| Piping | 26.8 | 7.9 | 46.7 | 7.9 |
| Instrumentation | 20.1 | 5.9 | 35.0 | 5.9 |
| Electrics | 13.4 | 3.9 | 23.3 | 3.9 |
| Civil engineering costs | 20.1 | 5.9 | 35.0 | 5.9 |
| Buildings/structures | 13.4 | 3.9 | 23.3 | 3.9 |
| Insulation and painting | 6.7 | 2.0 | 11.7 | 2.0 |
| OSBL costs | 146.9 | 43.0 | 255.4 | 43.0 |
| Offsites | 58.4 | 14.1 | 101.5 | 17.1 |
| Design and engineering | 63.2 | 18.5 | 109.9 | 18.5 |
| Contingency | 25.3 | 7.4 | 44.0 | 7.4 |
| Fixed capital investment | 341.4 | 100 | 593.7 | 100 |
| Working capital | 51.2 | — | 89.1 | — |
| Total capital | 392.6 | — | 682.8 | — |
The costs of manufacturing are given in Table 5. The estimated yearly manufacturing costs were 88 M£ per year for scenario 1 and 158 M£ per year for scenario 2. Total capital costs for S1 are in line with those of similar plants in previous work, estimated to be roughly $300–350 millions.45,46
| Item | Scenario 1 | Scenario 2 |
|---|---|---|
| Cost (M£ per year) | Cost (M£ per year) | |
| Raw materials | 0.01 | 0.01 |
| Utilities | 5.86 | 16.89 |
| Operating labour | 2.07 | 2.07 |
| Factors relating to FCI (maintenance, etc.) | 80.08 | 139.26 |
| Sum | 88.03 | 158.24 |
Using the sources described in the Methods section and assuming that naphthalene (and C1–C3 hydrocarbons for scenario 1) is separated from the oil stream and all the gas hydrocarbons are reformed to H2, CO2 and unreacted CO (in scenario 2), the following revenues were estimated (see Table 6). With the yearly COM estimated to be 88/158 M£ per year and revenues predicted to be 116/171 M£ per year, the base-case processes were predicted to make a yearly gain of approximately 27.9 and 12.7 M£ per year respectively in scenarios 1 and 2. Despite the Fe catalyst with the highest BTX yield (FeReOx/ZrO2) being used in scenario 1, the production of BTX and aromatics (in this case assumed to be naphthalene) is clearly not sufficient to break even by itself alone, since 60% of the revenue comes from selling the C1–C3 alkanes, whose price is highly variable and has considerably risen in the last few years. Therefore, a higher BTX yield would be needed. Despite having an initial BTX yield lower than that used in scenario 1, scenario 2 shows that if all the light hydrocarbons are reformed to hydrogen, the process can be profitable even if this requires a larger investment. With the bio-oil yield identified as the input variable to which the gross earnings value is most sensitive, the predicted yield which would allow the process to break even (based solely on BTX) can be estimated. By independently varying the bio-oil yield value in the process model by using the Goal seek function in MS Excel, the process was predicted to break even when bio-oil yield reached 15 wt% relative to biomass. The values of bio-oil yield found in the literature vary widely depending on reaction conditions and catalyst selection. The 12% bio-oil yield considered here is within the range of yields found in the literature for biomass (hydro)pyrolysis; however, some studies by other researchers have predicted lower/higher yields. Sirous-Rezaei et al. achieved a larger upgrade bio-oil yield (10.1 wt%) with a 5.4 wt% BTX content using PdReOxZrO2, which is still far from the indicated 15 wt%.21 Zheng et al.5 observed a 15% yield of bio-oil when conducting hydropyrolysis at 600 °C; however, this yield was observed with HDO at 50 bar. Whilst this yield is (marginally) above the 14.9% yield required to break even, additional manufacturing costs will be associated with the higher pressure for the HDO and the process may not be profitable.
| Chemical | Selling price (£ per tonne) | Scenario 1 | Scenario 2 | ||
|---|---|---|---|---|---|
| Production rate (tonnes per year) | Revenue (M£ per year) | Production rate (tonnes per year) | Revenue (M£ per year) | ||
| Benzene | 540 | 27922 |
15.08 | 8368 | 4.52 |
| Toluene | 360 | 20170 |
7.26 | 6.060 | 2.18 |
| Xylene | 360 | 4599 | 1.66 | 1376 | 0.49 |
| Acetone | 460 | 0 | 0 | 3619 | 1.66 |
| Cyclopentadiene | 1630 | 0 | 0 | 1705 | 2.78 |
| Aromatics (naphthalene) | 600 | 26149 |
15.69 | 0 | 0 |
| Light hydrocarbons (C1–C3) | 140 | 151671 |
75.83 | 0 | 0 |
| Hydrogen | 5000 | 0 | 0 | 31851 |
159.26 |
| Sum | 115.6 | 170.9 | |||
The above scenarios do not account for carbon emissions since (currently) in the UK and Europe biomass based energy plants (e.g. like the Drax power plant) do not pay for their carbon emissions since biomass is considered carbon neutral under the EU and UK Emissions Trading Systems (ETS). However, there would be a carbon tax of M£ 11 per year and ∼M£ 22 per year (scenarios 1 and 2, respectively) assuming that carbon emission will be included in the future (considering £ 18.5 per t CO2).47 This would make even scenario 2 unprofitable (−M£ 9.5) if the CO2 is not captured.
Sensitivity analysis
A summary of the distributions applied to the variables investigated in the sensitivity analysis for scenario 1 and 2 is given in Table 7. For normally distributed variables the base-case value was taken as the median, with parameters 1 and 2 giving the P5 and P95 probabilities respectively.| Variable | Distribution | Scenario 1 | Scenario 2 | ||
|---|---|---|---|---|---|
| Parameter 1 | Parameter 2 | Parameter 1 | Parameter 2 | ||
| Bio-oil yield (−) | Normal | 67% | 133% | 67% | 133% |
| FCI cost (M£) | Triangular | 194.7 | 417.3 | 415.6 | 890.55 |
| Hydrogen feed (mol H2 per mol bio-oil) | Uniform | 1 | 4 | 1 | 4 |
| Yearly maintenance cost (% FCI) | Triangular | 2 | 10 | 2 | 10 |
| Benzene sale cost (£ per kg) | Normal | 0.36 | 0.72 | 0.36 | 0.72 |
| Hydrogen sale cost (£ per kW per h) | Triangular | 0.1 | 0.32 | 0.1 | 0.32 |
| Manufacturing costs-CRM (M£ per year) | Normal | 0.9 | 1.1 | 0.02 | 0.04 |
| Methane sale cost (£ per kg) | Normal | 0.2 | 0.6 | — | — |
| Plant life (years) | Triangular | 15 | 25 | 15 | 25 |
Normal distributions were truncated at appropriate points to prevent unrealistic values from being trialled. For triangular distributions the base-case value was set as the most likely value and parameters 1 and 2 were the minimum and maximum values respectively.
The P5 and P95 values for bio-oil yield were selected as respectively 2/3 and 4/3 of the experimentally determined yield.
The minimum and maximum estimates for FCI correspond to the uncertainty of an AACE class 4 estimate.31 The lower value is 70% of the predicted FCI whilst the upper value is 150% of the predicted value. This is the standard range quoted for a project at the feasibility study stage.
The yearly maintenance cost maximum and minima were selected based on Turton et al.28 A base-case value of 6% had been estimated.
The parameter values for the sale price of benzene and methane were selected based on the highest and lowest market prices for these chemicals in the past 10 years.
For scenario 1, the results of the gross earnings are given in Fig. 3a, where it can be seen that the predicted gross earnings are approximately chi-square distributed about a mean in the region of 22 M£ per year. The process breaks even (gross earning of 0 or more) in approximately 80% of simulations, with the highest predicted earnings from the 1000 trials being approximately 129 M£ per year and the lowest predicted loss being around −66 M£ per year.
 | ||
| Fig. 3 Gross earnings in M£ per year for (a) scenario 1 and (b) scenario 2. | ||
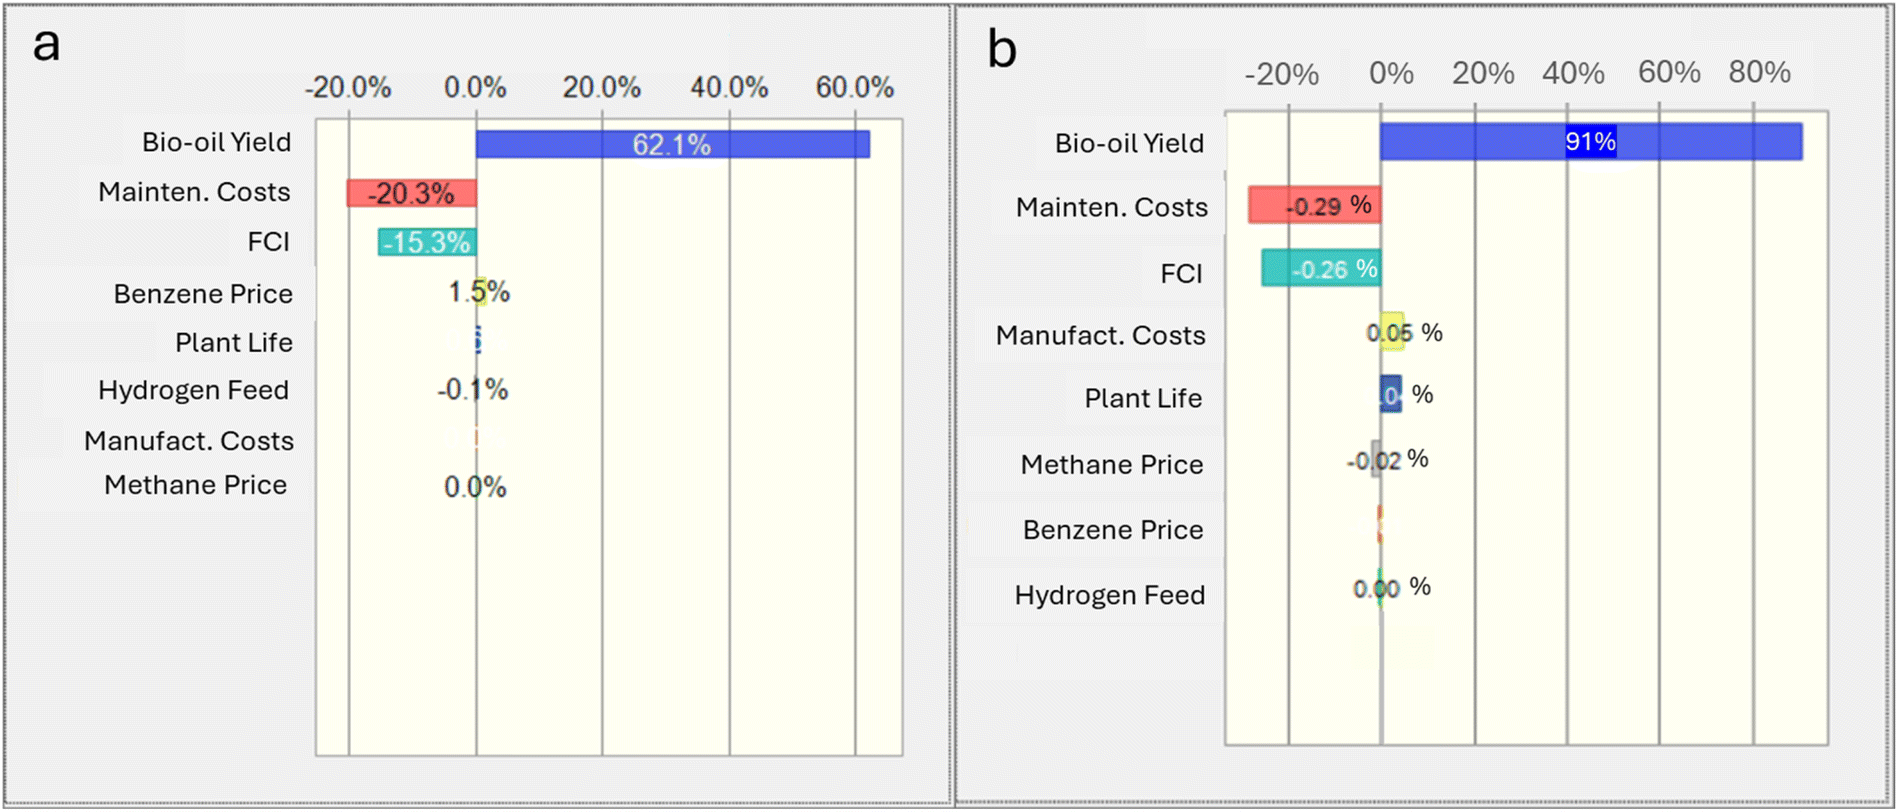
However, the gross earnings are virtually always positive, between 0 and 190 M£ per year for scenario 2 (Fig. 3b), mainly due to the production of hydrogen in situ. Fig. 4a and b provide a tornado diagram showing how sensitive the gross earning prediction is to changing each variable in the analysis, for scenarios 1 and 2. The sensitivities to each variable were analysed by running the model with each input at its P1 and P99 probabilities. The yield of bio-oil is the variable to which the gross earnings are most sensitive and should be the focus for optimisation/maximisation in further work. With yearly maintenance cost estimations ranging from 2% of FCI to 10%, the overall COM and therefore gross earnings are highly sensitive to the cost of any maintenance. The gross earning prediction is not highly sensitive to plant life or the hydrogen feed ratio so the optimisation of values for these variables should take a lower priority in directing the focus of future work.
 | ||
| Fig. 4 Sensitivity analysis results for (a) scenario 1 and (b) scenario 2. | ||
Similar refinements to the FCI estimate would give a more accurate prediction of project economics. Equipment costs were, where possible, estimated using reference costs specific to hydropyrolysis/HDO. The pieces of equipment with the highest estimated costs were the steam reforming reactor and the hydropyrolysis/HDO reactor, with estimated costs of 13.2 M£ and 12.0 M£ respectively.
The size, and thereby cost, of the steam reformer could be reduced by minimising the hydrogen feed ratio. The purchased costs of the WGS and PSA equipment would also decrease as the hydrogen production rate decreases. The base-case process model estimated the hydropyrolysis/HDO reactor purchase cost using a reference price, to which adjustments were made to account for size, CEPCI values, exchange rates, etc.
Conclusions
The feasibility of catalysed hydrodeoxygenation of bio-oil produced from lignin hydropyrolysis was evaluated under two different scenarios (S1 and S2). A process design and technoeconomic assessment were conducted for generating BTX hydrocarbons from bio-oil. The design and assessment were carried out using a model built in Microsoft Excel. The plant was designed for a capacity of 2000 tonnes per day of lignin input, with estimated capital investments of £ 393 million (S1) and £ 683 million (S2). The technical feasibility of producing BTX was confirmed, as was the ability to meet the hydrogen requirements through steam reforming of methane in the NC-gas product stream. The base-case process was projected to be profitable, with estimated manufacturing costs of £ 88 million (S1) and £ 158 million (S2) per year, and estimated revenues of £ 116 million (S1) and £ 161 million (S2) per year. A Monte Carlo sensitivity analysis was conducted to investigate how changes in input variables affect the model's outputs, specifically the predicted gross earnings. In 1000 trials, input variables were randomly selected based on defined distributions. The analysis predicted that the process would break even in approximately 65% of simulations for S1 and 95% for S2. The variable to which the profitability was most sensitive was the yield of bio-oil, and increasing it to more than 15% should be the priority of future research to achieve profitability solely from BTX production. Achieving this higher yield is crucial, as the environmental and long-term economic sustainability of BTX production depends on renewable solutions. Given that petroleum is a finite resource, it is a matter of “when”, not “if”, renewable sources of BTX will become more economically viable than current sources. In this context, the hydropyrolysis processes currently under development show promise as potential solutions for the transition to renewable BTX production.Nomenclature
| BTX | Benzene, toluene and xylene |
| HDO | Hydrodeoxygenation |
| M£ | Million pounds GPB |
| TEA | Technoeconomic assessment |
| LCB | Lignocellulosic biomass |
| NC-gas | Non-condensable gas |
| CAPEX | Capital expenditure |
| WGS | Water–gas-shift |
| PSA | Pressure swing adsorption |
| HHV | Higher heating value |
| CREF | Reference cost |
| CPC | Purchased equipment cost |
| C e | Actualised bare module cost |
| CEPCI | Chemical engineering plant cost index |
| ISBL | Inside battery limits |
| FCI | Fixed capital investment |
| OSBL | Outside battery limits |
| COM | Cost of manufacturing |
| DMC | Direct manufacturing costs |
| CRM | Cost of raw materials |
| CUT | Cost of utilities |
| COL | Cost of operating labour |
| FMC | Fixed manufacturing costs |
| GE | General manufacturing expenses |
Data availability
The data supporting this article have been included as part of the ESI.†Conflicts of interest
There are no conflicts to declare.References
- N. Obrzut, R. Hickmott and K. Gray, RSC Sustainability, 2024, 2, 988–994 RSC.
- Y. Lu, Y.-C. Lu, H.-Q. Hu, F.-J. Xie, X.-Y. Wei and X. Fan, J. Spectrosc., 2017, 8951658 Search PubMed.
- R. Shorey, A. Salaghi, P. Fatehi and T. H. Mekonnen, Valorization of lignin for advanced material applications: a review, RSC Sustainability, 2024, 2, 804–831 Search PubMed.
- L. Qu, X. Jiang, Z. Zhang, X.-g. Zhang, G.-y. Song, H.-l. Wang, Y.-p. Yuan and Y.-l. Chang, Green Chem., 2021, 23, 9348–9376 RSC.
- N. Zheng, J. Zhang and J. Wang, Bioresour. Technol., 2017, 244, 142–150 CrossRef CAS PubMed.
- B. Balagurumurthy and T. Bhaskar, Biomass Convers. Biorefin., 2014, 4, 67–75 CrossRef CAS.
- M. Steinberg, P. T. Fallon and M. S. Sundaram, Biomass, 1986, 9, 293–315 CrossRef CAS.
- V. K. Venkatakrishnan, W. N. Delgass, F. H. Ribeiro and R. Agrawal, Green Chem., 2015, 17, 178–183 RSC.
- T.-V. Nguyen and L. R. Clausen, Energy Convers. Manage., 2019, 184, 539–558 CrossRef CAS.
- N. R. Singh, W. N. Delgass, F. H. Ribeiro and R. Agrawal, Environ. Sci. Technol., 2010, 44, 5298–5305 Search PubMed.
- F. L. P. Resende, Catal. Today, 2016, 269, 148–155 CrossRef CAS.
- T. Marker, L. Felix and M. Linck, Integrated Hydropyrolysis and Hydroconversion Process for Production of Gasoline and Diesel Fuel from Biomass, 2009 Search PubMed.
- J. L. Carrasco, S. Gunukula, A. A. Boateng, C. A. Mullen, W. J. DeSisto and M. C. Wheeler, Fuel, 2017, 193, 477–484 CrossRef CAS.
- Global Petrol Prices, United Kingdom Gasoline Prices, 22-Mar-2021, https://www.globalpetrolprices.com/United-Kingdom/gasoline_prices/, accessed 26/03/2021, 2021 Search PubMed.
- Global Petrol Prices, United Kingdom Diesel Prices, 22-Mar-2021, https://www.globalpetrolprices.com/United-Kingdom/diesel_prices/, accessed 26/03/2021, 2021 Search PubMed.
- G. Bagnato and A. Sanna, Catalysts, 2019, 9, 1021 Search PubMed.
- G. Bagnato, F. Boulet and A. Sanna, Energy, 2019, 179, 199–213 CrossRef CAS.
- A. M. Elfadly, I. F. Zeid, F. Z. Yehia, A. M. Rabie, M. M. Aboualala and S.-E. Park, Int. J. Biol. Macromol., 2016, 91, 278–293 Search PubMed.
- O. Jan, R. Marchand, L. C. A. Anjos, G. V. S. Seufitelli, E. Nikolla and F. L. P. Resende, Energy Fuels, 2015, 29, 1793–1800 Search PubMed.
- P. Sirous-Rezaei, J. Jae, J.-M. Ha, C. H. Ko, J. M. Kim, J.-K. Jeon and Y.-K. Park, Green Chem., 2018, 20, 1472–1483 Search PubMed.
- P. Sirous-Rezaei and Y.-K. Park, Chem. Eng. J., 2020, 386, 121348 CrossRef CAS.
- W. Lonchay, G. Bagnato and A. Sanna, Bioresour. Technol., 2022, 361, 127727 CrossRef CAS PubMed.
- V. K. Venkatakrishnan, J. C. Degenstein, A. D. Smeltz, W. N. Delgass, R. Agrawal and F. H. Ribeiro, Green Chem., 2014, 16, 792 RSC.
- G. Nahar, D. Mote and V. Dupont, Renewable Sustainable Energy Rev., 2017, 76, 1032–1052 CrossRef CAS.
- S. A. Chattanathan, S. Adhikari and N. Abdoulmoumine, Renewable Sustainable Energy Rev., 2012, 16, 2366–2372 CrossRef.
- M. Zanotti, Z. Ruan, M. Bustamente, Y. Liu and W. Liao, Green Chem., 2016, 18, 5059–5068 RSC.
- R. Sinnott and G. Towler, Chemical Engineering Design, Elsevier, 2009 Search PubMed.
- R. Turton, R. C. Bailie, W. B. Whiting, J. A. Shaeiwitz and D. Bhattacharyya, Analysis, Synthesis, and Design of Chemical Processes, Prentice Hall, 4th edn, 2012 Search PubMed.
- M. S. Peters, K. D. Timmerhaus and R. E. West, Plant Design and Economics for Chemical Engineers, McGraw-Hill, New York, N.Y., 5th edn, 2004 Search PubMed.
- D. Lozowski, The Chemical Engineering Plant Cost Index, https://www.chemengonline.com/pci-home, accessed 01/04/2021, 2021 Search PubMed.
- AACE, AACE International Recommended Practice 18R-97 Cost Estimate Classification, 2020 Search PubMed.
- Historic Iron Ore Price, Trading Economics, https://tradingeconomics.com/commodity/iron-ore, accessed 19/12/ 2024 Search PubMed.
- I. A. Materials, Zirconia (ZrO2, Zirconium Oxide) Powder, Superfine Grade, https://www.advancedmaterials.us/40R-0801.htm, accessed 20/03/2021, 2021 Search PubMed.
- Rhenium Price, Strategic Metal Invest, https://strategicmetalsinvest.com/rhenium-prices/, accessed 20/12/ 2024 Search PubMed.
- D. J. Nowakowski, A. V. Bridgwater, D. C. Elliott, D. Meier and P. de Wild, J. Anal. Appl. Pyrolysis, 2010, 88, 53–72 CrossRef CAS.
- Statista Research Department, Average montly electricity proces in Great Britain 2013–2024, 2025, https://www.statista.com/statistics/589765/average-electricity-prices-uk/.
- Acetone, ICIS Chem. Bus., 2020, 298, 34 Search PubMed.
- C. Ong, ICIS Chem. Bus., 2020, 297, 34 Search PubMed.
- Z. Adam, ICIS Chem. Bus., 2020, 298, 32 Search PubMed.
- A. Yanelli, ICIS Chem. Bus., 2019, 296, 19 Search PubMed.
- Straits Research, Benzene-Toluene-Xylene (BTX) Market Report, Manufacturers and Forecast to 2031, https://straitsresearch.com/report/benzene-toluene-xylene-market, accessed 20/03/2021, 2021 Search PubMed.
- T. Miyagawa and M. Goto, Hydrogen Production Cost Forecasts since the 1970s and Implications for Technological Development, Energies, 2022, 15, 4375 CrossRef CAS.
- UK Natural Gas Cost, https://tradingeconomics.com/commodity/uk-natural-gas, accessed 10/10/ 2024 Search PubMed.
- Y. H. Kim, Chem. Eng. Technol., 2016, 39 Search PubMed.
- E. C. D. Tan, T. L. Marker and M. J. Roberts, Environ. Prog. Sustain. Energy, 2014, 33, 609–617 CrossRef CAS.
- S. Jones, S. B. Valkenburg, C. Walton, C. W. Elliott, D. C. Holladay, J. E. Stevens, D. J. Kinchin and C. Czernick, Production of Gasoline and Diesel from Biomass via Fast Pyrolysis, Hydrotreating and Hydrocracking: A Design Case, 2009 Search PubMed.
- Carbon Taxes in Europe, https://taxfoundation.org/data/all/eu/carbon-taxes-europe-2024/#:%7E:text=SeveralEuropeancountrieshaveintroduced,in2022and2023Crespectively, 2024 Search PubMed.
Footnote |
| † Electronic supplementary information (ESI) available. See DOI: https://doi.org/10.1039/d4su00652f |
| This journal is © The Royal Society of Chemistry 2025 |