
 Open Access Article
 This Open Access Article is licensed under a Creative Commons Attribution-Non Commercial 3.0 Unported Licence
Viscous dissipative energy density as a general adhesion characteristic of adhesive tape†
Kosuke
Takahashi
 *a,
Masako
Yamada
b,
Tatsuya
Sasaki
b and
Takashi
Nakamura
a
*a,
Masako
Yamada
b,
Tatsuya
Sasaki
b and
Takashi
Nakamura
a
aDivision of Mechanical and Aerospace Engineering, Faculty of Engineering, Hokkaido University, Kita 13, Nishi 8, Kita-ku, Sapporo, Hokkaido 060-8628, Japan. E-mail: ktakahashi@eng.hokudai.ac.jp
bDivision of Mechanical and Space Engineering, Graduate school of Engineering, Hokkaido University, Kita 13, Nishi 8, Kita-ku, Sapporo, Hokkaido 060-8628, Japan
First published on 4th July 2025
Abstract
The strength of adhesive tapes is generally evaluated using a peel or probe-tack test. However, these tests strongly depend on sample geometry considering the tape thickness of the backing film and pressure sensitive adhesive (PSA) layer. In this study, we propose the viscous dissipative energy density as a new parameter for evaluation, which is equivalent to the adhesion energy divided by the maximum elongation of the PSA layer during separation. Rubber-based adhesive tapes of different styrene contents were prepared, and their adhesion performance was evaluated based on the proposed parameter. Peel and probe-tack tests using tapes of various thicknesses were conducted with in situ observation using a high-speed camera. In the peel test, the adhesion energy can be obtained by converting the peel force using the tape width and peel angle; in the probe-tack test, it can be obtained by integrating the force divided by the contact area and elongation of the PSA layer. The adhesion energy divided by the maximum elongation from the probe-tack test showed an identical linear relationship with the strain rate of the PSA layer on a logarithmic scale, independent of the tape thickness. This relationship obtained from the peel test was slightly higher with more scattering. This is because the elongation of the PSA layer was distributed along the curved backing film, whereas it was almost uniform under the probe-tack test. Therefore, we confirmed that the viscous dissipative energy density can be used effectively as a material parameter, particularly when obtained from the probe-tack test.
Introduction
The strength of adhesive tapes is usually evaluated using a peel test owing to its simplicity. The term “strength” is generally defined as a material property, which is independent of the geometry of the material. However, the peel force strongly depends on the peel angle1–3 and thicknesses of the backing film and pressure sensitive adhesive (PSA) layer.3,4 The influence of testing conditions has been considered in stress analysis, although this is rather complicated because the elongated PSA layer is distributed along the shape of the backing film [Fig. 1(a)].5–8 The bending deformation of the backing film generates a compressive stress ahead of the peel zone and the tensile stress sharply increases, followed by a plateau stress in the large elongation of fibrillation, as described in Fig. 1(b).9 | ||
| Fig. 1 Schematics of the relationship between (a) peel tests and (c) probe-tack tests in terms of (b) their stress profiles. | ||
The probe-tack test is easier to interpret than the peel test as the elongation of the PSA layer is almost uniform owing to the small deformation of the backing film during the separation process. The maximum normal stress after several seconds of contact time is defined as the “tack,” which is obtained during the initial elongation of the PSA layer. Subsequently, the normal stress sharply decreases with the expansion of the cavities, and then increases gradually or plateaus with fibrillation toward detachment [Fig. 1(c)].10–14 Although “tack” also depends on the testing conditions considering the probe shape,15,16 contact time,17 and thickness of the PSA layer,18 it is characterized by the expansion of the cavity near the PSA layer–probe surface interface. The maximum stress increases for a large contact area with a thin PSA layer and can be predicted using the cavity growth criterion as a function of the contact radius divided by the PSA thickness.19–22
The above-described release process of the probe-tack test [Fig. 1(b) and (c)] corresponds to the stress distribution in the peel test [Fig. 1(a) and (b)]. Cavity growth is also observed during the peel test, and the maximum stress corresponds to the origin of cavity formation.3 This implies that integrating the normal stress over the entire peel zone provides the external work required for the separation of the PSA layer, which is equivalent to the measured peel force. In other words, the stress transition in the probe-tack test is measured simultaneously as the resultant force in the peel test. Pandey et al.23 compared the peel with probe-tack tests using tapes with various styrenic block copolymers and confirmed the same correlation between these tests. This indicates that the local debonding mechanisms under the peel and tack tests are equivalent, and the adhesion energy can be defined as a material property.
The strain rate dependence of the adhesion energy owing to the viscoelasticity of the PSA layer must also be considered. The adhesion energy predominantly originates from the viscous dissipative energy consumed during the elongation of the PSA layer and follows the power law of the strain rate.24 Based on these perspectives, we proposed a generalized characteristic of the adhesive tape—a ratio of the adhesion energy and the maximum elongation of the PSA layer.3 Adhesive tapes of various thicknesses were tested using a peel test with various peel angles and peel velocities, and the ratio of the adhesion energy and the maximum elongation was found to have an identical linear relationship with the strain rate on a logarithmic scale under identical confinement conditions. This relationship should also hold for the probe-tack test and may be uniquely determined if the debonding process is exactly the same as that in the peel test.
In this study, we investigated whether the same relationship between adhesion energy divided by the maximum elongation of the PSA layer and strain rate can be obtained from peel and probe-tack tests. Two types of adhesives with different viscoelastic properties were prepared and validated. Probe-tack and peel tests were conducted at three different velocities while observing the separation process using a high-speed camera to investigate their equivalence.
Characterization
Adhesion energy
The external work required for separating the probe from the PSA layer in a probe-tack test depends on the area affected by the probe displacement (x) and measured load (F). When the initial contact area of the probe on the PSA surface is A and the maximum elongation of the PSA layer is af, the external work per unit area (Wtack) can be expressed as | (1) |
The deformation of the backing film is typically suppressed within the elastic range by sandwiching the adhesive tape or using a rigid glass plate. However, the deflection of the backing is not negligible compared with the elongation of the PSA layer. This implies that the probe displacement x is the sum of the deflection of the backing and the elongation of the PSA layer. Therefore, the energy consumed by only the PSA layer (Gc_tack) can be extracted by subtracting the elastic strain energy of the PET backing (Ue) from the external work of the probe (Wtack).
| Gc_tack = Wtack − Ue | (2) |
In a peel test, when the width of the tape is b and the peel velocity is V, a peeled area bVt is generated in t seconds. To fix the peel angle (θ), sliding the substrate plate at the same velocity V is necessary. Therefore, the net displacement of the peel arm is Vt(1 − cos![[thin space (1/6-em)]](https://www.rsc.org/images/entities/char_2009.gif) θ). The external work per peeled area (Wpeel) provided at time t may be expressed using the peel force P.
θ). The external work per peeled area (Wpeel) provided at time t may be expressed using the peel force P.
 | (3) |
| Gc_peel = Wpeel − Up | (4) |
The plastic dissipative energy during the bending deformation of the backing film can be related to the bilinear approximation of the stress–strain curve and quantitatively estimated from the elastic modulus (E), yield strain (ey), and slope after yielding (αE).7 The strain energy of the peeling arm does not have to be considered because the geometry of the peeling arm is maintained during the stable peeling process.
Average strain rate of the PSA layer
Assuming a uniformly elongated entire PSA layer, the strain rate of the probe-tack test is calculated as follows, using the release velocity (V) and initial thickness of the PSA layer (a0): | (5) |
In the peel test, the elongation of the PSA layer varies with the bending of the backing; thus, the strain rate is not constant in the peel zone. Villey et al.25 calculated the average strain rate of the PSA layer using the time derivative of the logarithmic strain in the peel zone. By averaging the integration of the strain rate over the curved backing, the average strain rate in the peel (![[small epsi, Greek, dot above]](https://www.rsc.org/images/entities/i_char_e0a1.gif) peel) zone can be expressed as
peel) zone can be expressed as
 | (6) |
Strain rate dependence of the adhesion energy
The adhesion energy is considered to be generated by the viscous dissipative energy (Uv) through the elongation of the entire PSA layer.26 We next defined the viscous dissipative energy density uv, which is the viscous dissipative energy divided by the elongated volume of PSA.3 | (7) |
Experiments
Sample preparation and characterization
The PSAs used in this study were composed of a styrene-based triblock polymer Quintac®SL-188 and SL-189 (ZEON Corporation, Japan). SL-189-based PSA was used extensively in our previous study for the peel test;3 therefore, it was compared with SL-188-based PSA, which was designed to have a higher styrene content as a hard segment (Table 1). Differences in viscoelastic behavior were evaluated using dynamic mechanical analysis (DMA). An ARES G-2 rheometer (TA Instruments, USA) with two parallel plates (diameter = 8 mm) was used in the shear mode for each sample (thickness = 2 mm). The oscillation frequency and temperature ramp rate were 6.28 rad s−1 and 4 °C min−1, respectively.| PSA sample | SL-188-based | SL-189-based |
|---|---|---|
| Styrene content [wt%] | 30 | 18 |
| Total molecular weight [×103] | 120 | 170 |
| Hardness [Shore A] | 66 | 45 |
The adhesive tapes with SL-188 or SL-189-based PSA were prepared by coating their polymer compound dissolved in a solvent (toluene) onto a 50- or 25-μm thick PET backing. The thickness of the PSA layer was adjusted by passing it through an applicator with the gap set to 375 or 125 μm. Overall, PSA tapes with three different thicknesses were prepared and named as “Applicator gap/PET thickness” (Table 2). The thicknesses of the PSA layers were not simply the applicator gap minus the backing thickness owing to volatilization, but they were obtained based on their weight and density.
| Tape name | 375/50 | 375/25 | 125/50 | |
|---|---|---|---|---|
| Applicator gap [μm] | 375 | 375 | 125 | |
| PET backing [μm] | 50 | 25 | 50 | |
| PSA [μm] | SL-188 | 108 | 83.1 | 34.3 |
| SL-189 | 103 | 87.9 | 32.0 | |
The 50-μm thick PET film was trimmed into a dumbbell shape to conduct tensile tests using a Compact Tabletop Tester EZ-LX HS (Shimadzu Corporation). The crosshead speeds were set to 0.05, 0.5, and 5 mm s−1, identical to those in the peel test. The material properties of the PET backing required for the prediction of Up were obtained in our previous study, as listed in Table 3.3
| Material | Velocity [mm s−1] | E [MPa] | ε y [%] | α |
|---|---|---|---|---|
| PET backing | 0.05 | 3.58 × 10³ | 4.80 | 0.0111 |
| 0.5 | 3.61 × 10³ | 5.11 | 0.00994 | |
| 5 | 3.42 × 10³ | 5.22 | 0.0115 |
Probe-tack test
The probe-tack test using a polymethyl methacrylate (PMMA) spherical probe (diameter = 9.5 mm) was conducted using a Compact Tabletop Tester EZ-LX HS (Shimadzu Corporation, Japan) at room temperature (22 °C). The adhesive tape was sandwiched between aluminum plates with a 12 mm diameter hole at the center [Fig. 2(a)] to suppress the deflection of the PET backing. The contact time of a probe is generally a few seconds. However, in this experiment, the probe was held for 20 min at the position when it reached a compressive force of 0.1 N to realize the same contact time as the peel test. The probe approached the PSA surface at a velocity of 0.1 mm s−1, and then, it was pulled away from the PSA surface at release velocities of 0.03, 0.3, and 3 mm s−1 after 20 min of holding under a fixed displacement. The probe was cleaned with alcohol before each test, and static electricity was removed using a blower-type static eliminator BF-X2MB (SHISHIDO ELECTROSTATIC, Ltd, Japan). The contact area from the back of the tape was observed during the test using a high-speed camera HAS-L1 (DITECT, Co., Ltd, Japan) [Fig. 2(b)]. | ||
| Fig. 2 (a) Sample preparation and (b) experimental setup of the probe-tack test. | ||
Peel test
The peel forces of the three samples (Table 1) were measured at room temperature (22 °C) using a VPA-2 versatile peel analyzer (Kyowa Interface Science Co., Ltd, Japan). The tapes were carefully attached to a PMMA plate, whose surface was thoroughly cleaned with alcohol to minimize the influence of contamination, and left for 20 min before the test. The PMMA plate was renewed for each test to ensure that the surface conditions remained consistent. The surface conditions exhibited a similarity with the probe employed in the probe-tack test, as examined by the force curve obtained by AFM (atomic force microscopy), as presented in the ESI.† The peel angle was set to 90°, and the peel velocities were 0.05, 0.5, and 5 mm s−1. Each peel test was observed from the side and back of the PMMA plate using the same high-speed camera. Three images from the side were captured at arbitrary observation moments to measure ls and af using the image-processing software ImageJ. The average strain rate of the PSA layer under all peel test conditions was calculated by substituting these values in eqn (6).Results
Viscoelastic properties of PSA materials
The DMA results are shown in Fig. 3(a)–(c). Although a higher storage modulus was expected from the SL-188 sample because of the higher styrene content (Table 1), it showed the same plateau value as SL-189 (0.11 MPa) around room temperature. The storage modulus was higher below 10 °C and above 80 °C, and the loss modulus was higher below 40 °C, but lower above 40 °C. These differences correspond to a shift in the glass transition temperature [Fig. 3(c)]. Therefore, the increased styrene content does not significantly change the overall viscoelastic behavior but contributes to the shift of the glass transition temperature to higher values. | ||
| Fig. 3 (a) Storage modulus, (b) loss modulus, and (c) tanδ of the PSA sample measured by dynamic mechanical analysis (DMA). | ||
Influence of the tape thickness on the probe-tack test
The results of the probe-tack test obtained from the 375/50, 375/25, and 125/50 tapes are shown in Fig. 4(a)–(c), respectively, with SL-188 and SL-189 on the left and right, respectively. The vertical axis represents the nominal stress (equal to the load divided by the initial contact area), and the horizontal axis represents the elongation of the PSA layer (equal to the displacement of the probe subtracted by the displacement of the PET backing). The origin of the elongation of the PSA layer was set to a point at which the load shifted from negative to positive during the release process. | ||
| Fig. 4 Measured normal stress of the probe-tack test and the elongation of the PSA layer using all the prepared tapes at different separation velocities. SL-188-based: (a) 375/50, (b) 375/25, and (c) 125/50; SL-189-based: (d) 375/50, (e) 375/25, and (f) 125/50. | ||
In both the SL-188 and SL-189 PSAs, the maximum nominal stress and slope increased with increasing release velocity. The maximum nominal stress was the lowest in the 375/50 tape and the highest in the 125/50 tape. Conversely, the maximum elongation was the longest in the 375/50 tape and the shortest in the 125/50 tape. It follows that the thinner PSA layer resulted in a higher stress with a shorter elongation. The maximum nominal stress of SL-188-based tape was higher than that of SL-189-based tape for all thicknesses. Overall, the nominal stress through large deformation was not significantly affected by the elongation but was sensitive to the strain rate, which is a characteristic of typical extensional viscosity.26
The adhesion energies (Gc_tack) of the backing for the SL-188- and SL-189-based tapes were calculated via the area under the plots shown in Fig. 5(a) and (b), respectively. The release velocities of 0.03, 0.3, and 3 mm s−1 are shown in light gray, gray, and black, respectively. The external work (Wtack) was also calculated as the area under the nominal stress and probe displacement curves, and their difference represents the elastic strain energy (Ue) of the PET backing, which is shown in green. A higher adhesion energy was generated by the higher release velocity, regardless of the tape thickness and PSA materials. Compared to the 375/50 tape, the thinner backing and PSA layer of the 375/25 and 125/50 tapes, respectively, generated more elastic strain energy.
 | ||
| Fig. 5 Adhesion energy, which is the external work subtracted by the elastic strain energy (represented in green), calculated from the probe-tack test using (a) SL-188-based and (b) SL-189-based tapes. The colors represent the separation velocities of 0.03 mm s−1. | ||
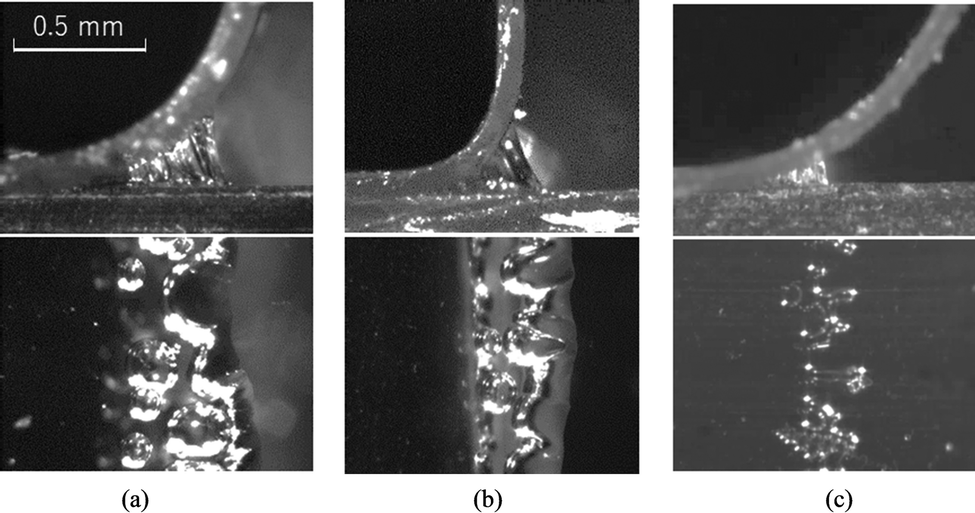
Fig. 6(a)–(c) show the observed images of the contact area through the backing PET under a digital microscope for the 375/50, 375/25, and 125/50 tapes of the SL-188-based PSA, respectively. The images were captured at the loads of the local maxima, local minima, and immediately before detachment, represented by points A, B, and C in Fig. 4(a), respectively. The cavities appeared near the local maxima, followed by a sharp decrease toward the local minima owing to the instant expansion of these cavities. A finger-like shape was also formed around the outer edge of the contact area. The load increased again toward complete separation with further expansion of the cavities to fill the gaps between them. These separation processes were clearer for the 375/25 [Fig. 6(b)] and 125/50 tapes [Fig. 6(c)]. The 375/50 tape produced smaller cavities with a more irregular contact area pattern [Fig. 6(a)].
 | ||
| Fig. 6 Images of the backside of SL-188-based tapes observed through a digital microscope: (a) 375/50, (b) 375/25, and (c) 125/50 at the local maxima (point A), local minima (point B), and just before detachment (point C). | ||
Fig. 7(a)–(c) show the observed images for the same set of tapes used in SL-189-based PSA. The 375/50 tape of the SL-189-based PSA exhibited only a few large cavities. The wavy outer edge of the contact area was also less clear than that of the 375/50 tape for the LS-188-based PSA. The images of the 375/25 and 125/50 tapes are similar to those shown in Fig. 6(b) and (c) for the SL-188-based PSA. Although the observed images of the 375/50 tape differ, cavity growth was observed from the local maxima to the minima of the nominal stress (indicated by points A and B, respectively) in all the tapes.
 | ||
| Fig. 7 Images of the backside of SL-189-based tapes observed through a digital microscope: (a) 375/50, (b) 375/25, and (c) 125/50 at the local maxima (point A), local minima (point B), and just before detachment (point C). | ||
It was ascertained for both tapes that the contact area did not decrease until detachment. The nominal stress increased sharply to the cavity generation indicated by point A, decreased upon cavity growth, and then plateaued or slightly increased until detachment through fibrillation. Therefore, most of the adhesion energy was generated during the fibrillation process.
Viscous dissipative energy density for tapes with different styrene contents
Fig. 8(a) and (b) show the relationship between the adhesion energy (Gc_tack) and the strain rate obtained from eqn (5) for LS-188-based and SL-189-based tapes, respectively: The circles, squares, and triangles represent the results for the 375/50, 375/25, and 125/50 tapes, respectively. For all tapes, a linear relationship was observed between the adhesion energy and strain rate on a logarithmic scale. Furthermore, the 375/50 and 375/25 tapes exhibited similar relationships, regardless of the backing thickness. Conversely, the 125/50 tape showed a lower adhesion energy. These results are similar to those for the SL-189-based tapes [Fig. 8(b)]. | ||
| Fig. 8 Relationship between the adhesion energy and strain rate of the PSA layer obtained from (a) SL-188-based tape and (b) SL-189-based tape with the marker shapes representing the thickness of the tapes; 375/50 tapes (circles), 375/25 tapes (squares), and 125/50 tapes (triangles). | ||
The adhesion energy divided by the initial PSA thickness (Gc/a0) and the maximum elongation of the PSA layer (Gc/af) are shown in Fig. 9(a) and (b), respectively. Although little difference was observed between the different tapes, there was considerable variation in Gc/a0 for the SL-188-based tape at a low strain rate of dε/dt = 0.3 [s−1]. In addition, there was almost no difference for Gc/a0 between the SL-188 and SL-189 tapes at a high strain rate of dε/dt = 100 [s−1]. By contrast, Gc/af was almost consistent at all strain rates. Furthermore, the trendline of the SL-188-based tapes was higher than that of the SL-189-based tapes, but the slope of the linear relationship on a logarithmic scale was almost similar to that of the power law (Gc/af ∼ (dε/dt)n with n = 0.23).
 | ||
| Fig. 9 The adhesion energy divided by (a) the initial PSA thickness and (b) the maximum elongation of the PSA layer, and their relationships with strain rate of the PSA layer obtained from SL-188-based tape (blue) and SL-189-based tape (black), with the marker shapes representing the thickness of the tapes; 375/50 tapes (circles), 375/25 tapes (squares), and 125/50 tapes (triangles). | ||
This trend is analogous to the DMA results showing a shift to a higher glass transition temperature and corresponds to the nominal stress shown in Fig. 4, in which the SL-188-based tape showed slightly higher values over all the strain rates. Therefore, the adhesion energy divided by the maximum elongation of the PSA layer represents the adhesion performance more appropriately than that divided by the initial PSA thickness. This result indicates that the elongation of the PSA layer is not proportional to the initial thickness because the deformation along the interface with the probe is constrained by maintaining the initial contact area until detachment.
Comparison with the peel test
Dependence of the tape thickness on the peel force
The external work obtained from the peel test for SL-188- and SL-189-based tapes is shown in Fig. 10(a) and (b), respectively. The peel forces were divided by the tape width to express the external work, using eqn (3) where θ = π/2. The light gray, gray, and black colors represent the peel velocity of 0.05, 0.5, and 5 mm s−1, respectively. The plastic dissipation energy of the backing PET caused by bending deformation, calculated using the values in Table 3, is expressed by the green portion of the bar graph. The remaining portion is the adhesion energy defined in eqn (4). A stable peel force could not be obtained from the 375/50 tape of the SL-188 sample at 5 mm s−1 owing to stick-slip oscillation. Regardless of the thickness of the backing and PSA layers, the adhesion energy was higher for the PSA layer and increased with its strain rate, and the viscous dissipative energy during elongation became more significant as the strain rate increased. The plastic dissipative energy (Up) of the backing also increased with increasing peel velocity. In both samples, the adhesion energy of the 375/50 tape was similar to that of the thinner backing of the 375/25 tape, but higher than that of the thinner PSA layer of the 125/50 tape. | ||
| Fig. 10 Adhesion energy, defined as the external work subtracted by the plastic dissipation energy (represented in green), calculated from the peel test using (a) SL-188-based and (b) SL-189-based tapes. The light gray, gray, and black colors represent the separation velocities of 0.03, 0.3, and 3 mm s−1, respectively. | ||
Fig. 11 shows the captured images of the peeled areas of the SL-188-based tapes at a peel velocity of 0.05 mm s−1. Images captured from the 375/50, 375/25, and 125/50 tapes are shown in Fig. 11(a)–(c), respectively. The upper and lower images were obtained from the side and back of the PMMA plate, respectively. Overall, the side view revealed that the curvature of the peeling shape strongly depends on the backing thickness; the 375/50 tape is similar to the 125/50 tape, but has a smaller bending deformation than the 375/25 tape. The peel zone, where the PSA layer was elongated, was more extensive for the thicker PSA layers of the 375/50 and 375/25 tapes. The back view revealed different debonding morphologies. The generation of cavities during peeling significantly depends on the thickness and viscoelastic properties of PSA; the thicker backing and thinner PSA layer of the 125/50 tape clearly showed cavities.
 | ||
| Fig. 11 Images of the SL-188-based tapes observed from the side (top) and through the backside (bottom) under a digital microscope: (a) 375/50, (b) 375/25, and (c) 125/50 tapes. | ||
Fig. 12 shows the captured images of the peeled area of the SL-189-based tapes in the same manner as in Fig. 11. The general trend was the same as that for the SL-188 samples; however, the cavities were less evident in the 125/50 tape than in the SL-188-based tape. The maximum elongation was slightly lower.
 | ||
| Fig. 12 Images of the SL-189-based tapes observed from the side (top) and through the backside (bottom) under a digital microscope: (a) 375/50 tape, (b) 375/25 tape, and (c) 125/50 tape. | ||
Viscous dissipative energy density in the peel and probe-tack tests
The viscous dissipative energy density, which is the adhesion energy divided by the maximum elongation of the PSA layer, is plotted in terms of the strain rate in Fig. 13(a) for the SL-188-based tapes and Fig. 13(b) for the SL-189-based tapes. The maximum elongation (af) and length of the peel region along the backing (ls) were measured from the captured images in Fig. 11 and 12 to calculate the strain rate using eqn (6). They are plotted as open markers, with those obtained from the probe-tack test as closed markers (Fig. 9). Circles, squares, and triangles represent the results for the 375/50, 375/25, and 125/50 tapes, respectively. | ||
| Fig. 13 Relationship between the generalized adhesion strength and strain rate of the PSA layer obtained from the (a) SL-188-based tape and (b) SL-189-based tape with open markers indicating the peel test and filled markers indicating the probe-tack test. The marker shapes represent the thickness of the tapes; 375/50 tapes (circles), 375/25 tapes (squares), and 125/50 tapes (triangles). | ||
Although the relationship between the viscous dissipative energy density and the strain rate of the PSA layer was almost identical regardless of the thickness, the values of the peel test were slightly higher compared to those of the probe-tack test because of the shorter maximum elongation during this test. This difference may result from the crack propagation rate during detachment. In the probe-tack test, the crack propagates unstably upon detachment,28 while the crack propagation is stable during the peel test. Our previous work clarified the “sticking effect” caused by the shearing deformation of the PSA layer along the interface with the adherend.29 The initial contact area is maintained during elongation by the high shearing strain rate that is locally generated along its outer edge. The stable and slower crack propagation at the end of the peel zone in the peel test has a lower shearing strain rate and thus results in a weaker sticking effect compared to the probe-tack test.
In addition, the results from the peel test were slightly more scattered than those of the probe-tack test. This is because the elongation of the PSA layer in the probe-tack test was almost uniform, while it varied in the peel region during the peel test. The elongation of the PSA layer in the peel test resulted from the nonuniform strain rate in the peel zone and the corresponding stress field. Therefore, the probe-tack test is more suitable for characterizing the adhesion strength of the tape as a material constant compared to the peel test. Moreover, the maximum elongation of the PSA layer in the probe-tack test can be easily obtained by subtracting the displacement of the backing at detachment from the probe position, while that of the peel test must be measured by in situ observation under a microscope.
Notably, the relationship between the viscous dissipative energy density and strain rate (Fig. 13) was obtained only from interfacial debonding. When the velocity was sufficiently low, the fracture mode shifted to a cohesive fracture inside the PSA layer.30 Furthermore, the stick-slip phenomenon, which was observed at a peel velocity of 5 mm s−1 on the 375/50 tape of the SL-188-based PSA, has been reported to occur in the transition region between interfacial debonding and glassy fracture owing to high-velocity peeling.31,32 The relationship between the viscous dissipative energy density and the strain rate obtained (Fig. 13) is valid only in the range of interfacial debonding with stable peeling.
Conclusions
In this study, adhesion tapes of SIS triblock copolymers with different styrene contents and various thicknesses were prepared. The probe-tack test was conducted at various release velocities. The adhesion energy, which is an integral of the stress–displacement relationships, was higher for adhesion tapes with higher styrene contents and thicker PSA layers. The adhesion energy was divided by the maximum elongation of the PSA layer, which is defined as the viscous dissipative energy density, and plotted in terms of the strain rate. A linear relationship on a logarithmic scale was obtained, independent of the tape thickness. These results suggest that the viscous dissipative energy density can be expressed solely by the power law of the strain rate. Adhesion tapes with higher styrene contents exhibited higher viscous dissipative energy density values, while keeping the same dependence on the strain rate.Peel tests were also conducted using the same adhesion tapes, and their viscous dissipative energy densities were obtained. The results were slightly higher and more scattered than those obtained from the probe-tack test. The discrepancy from the probe-tack test results was caused by the slower crack propagation rate and the variation in the elongation of the PSA layer during the bending deformation of the backing film. These phenomena affect the strain rate dependence of the locally high shearing stress along the outer edge of the initial contact area (sticking effect) and the extensional viscosity, respectively. By contrast, the probe-tack test generated an almost uniform elongation of the PSA layer. Obtaining the maximum elongation of the PSA layer from the probe-tack test is easily achieved because in situ observations are not necessary. Therefore, the proposed viscous dissipative energy density is an effective parameter independent of testing conditions, particularly when obtained from the probe-tack test. As the effectiveness of this parameter was confirmed only for interfacial failure, we intend to investigate the transition of the fracture mode at sufficiently low or high testing velocities in future studies.
Conflicts of interest
There are no conflicts of interest to declare.Data availability
Data used in this study will be made available upon request to the corresponding author.Acknowledgements
This research was funded by the Japan Society for the Promotion of Science, Japan (grant number: Scientific Research (21K03765)). The authors would like to thank the ZEON Corporation for providing the samples and Kyowa Interface Science Co., Ltd. for experimental support.References
- D. H. Kaelble, Trans. Soc. Rheol., 1959, 3, 161–180 Search PubMed.
- A. N. Gent and S. Y. Kaang, J. Adhes., 1987, 24, 173–181 CrossRef.
- M. Yamada, K. Takahashi, N. Fujimura and T. Nakamura, Eng. Fract. Mech., 2022, 271, 108653 CrossRef.
- K. Shitajima, N. Karyu, S. Fujii, Y. Nakamura and Y. Urahama, J. Appl. Polym. Sci., 2015, 132(27) DOI:10.1002/app.42210.
- D. H. Kaelble, Trans. Soc. Rheol., 1959, 3, 161–180 Search PubMed.
- D. H. Kaelble, Trans. Soc. Rheol., 1960, 4, 45–73 CAS.
- A. J. Kinloch, C. C. Lau and J. G. Williams, Int. J. Fract., 1994, 66, 45–70 CrossRef CAS.
- K.-S. Kim and N. Aravas, Int. J. Solids Struct., 1988, 24, 417–435 CrossRef.
- D. H. Kaelble, Trans. Soc. Rheol., 1965, 9, 135–163 CAS.
- H. Lakrout, P. Sergot and C. Creton, J. Adhes., 1999, 69, 307–359 CrossRef CAS.
- A. J. Crosby, K. R. Shull, H. Lakrout and C. Creton, J. Appl. Phys., 2000, 88, 2956–2966 CrossRef CAS.
- A. Zosel, Int. J. Adhes. Adhes., 1998, 18, 265–271 CrossRef CAS.
- K. Takahashi, R. Oda, K. Inaba and K. Kishimoto, Soft. Matter., 2020, 16, 6493–6500 RSC.
- T. Yamaguchi, C. Creton and M. Doi, Soft. Matter., 2018, 14, 6206–6213 RSC.
- Y. Y. Lin, C. Y. Hui and H. D. Conway, J. Polym. Sci., Part B: Polym. Phys., 2000, 38, 2769–2784 CrossRef CAS.
- K. Takahashi, F. Yanai, K. Inaba, K. Kishimoto, Y. Kozone and T. Sugizaki, Langmuir, 2021, 37, 11457–11464 CrossRef CAS.
- C. Creton and L. Leibler, J. Polym. Sci., Part B: Polym. Phys., 1996, 34, 545–554 CrossRef CAS.
- P. Tordjeman, E. Papon and J.-J. Villenave, J. Polym. Sci., Part B: Polym. Phys., 2000, 38, 1201–1208 CrossRef CAS.
- R. E. Webber, K. R. Shull, A. Roos and C. Creton, Phys. Rev. E: Stat., Nonlinear, Soft Matter Phys., 2003, 68, 021805 CrossRef PubMed.
- K. R. Shull and C. Creton, J. Polym. Sci., Part B: Polym. Phys., 2004, 42, 4023–4043 CrossRef CAS.
- T. Yamaguchi, K. Koike and M. Doi, Europhys. Lett., 2007, 77, 64002 CrossRef.
- K. Takahashi, Y. Yamagata, K. Inaba, K. Kishimoto, S. Tomioka and T. Sugizaki, Langmuir, 2016, 32, 3525–3531 CrossRef CAS PubMed.
- V. Pandey, A. Fleury, R. Villey, C. Creton and M. Ciccotti, Soft. Matter., 2020, 16, 3267–3275 RSC.
- J. Chopin, R. Villey, D. Yarusso, E. Barthel, C. Creton and M. Ciccotti, Macromolecules, 2018, 51, 8605–8610 CrossRef CAS.
- R. Villey, P.-P. Cortet, C. Creton and M. Ciccotti, Int. J. Fract., 2017, 204, 175–190 CrossRef.
- J. M. Piau, C. Verdier and L. Benyahia, Rheol. Acta, 1997, 36, 449–461 CrossRef CAS.
- A. N. Gent and S.-M. Lai, J. Polym. Sci., Part B: Polym. Phys., 1994, 32, 1543–1555 CrossRef CAS.
- A. J. Crosby and K. R. Shull, J. Polym. Sci., Part B: Polym. Phys., 1999, 37, 3455–3472 CrossRef CAS.
- K. Takahashi, F. Yanai, K. Inaba, K. Kishimoto, Y. Kozone and T. Sugizaki, Langmuir, 2021, 37(39), 11457–11464 CrossRef CAS.
- S. Sun, M. Li and A. Liu, Int. J. Adhes. Adhes., 2013, 41, 98–106 CrossRef CAS.
- P. P. Cortet, M. Ciccotti and L. Vanel, J. Stat. Mech., 2007, P03005 Search PubMed.
- Y. Sugizaki and A. Suzuki, Soft. Matter., 2019, 15, 7080–7088 RSC.
Footnote |
| † Electronic supplementary information (ESI) available. See DOI: https://doi.org/10.1039/d5sm00347d |
| This journal is © The Royal Society of Chemistry 2025 |