
 Open Access Article
 This Open Access Article is licensed under a
 Creative Commons Attribution 3.0 Unported Licence
Effect of pressure on the micellar structure and aggregation behavior of PMMA-b-PNIPAM diblock copolymers in a water/methanol mixture†
Pablo A.
Alvarez Herrera
 a,
Feifei
Zheng
a,
Peiran
Zhang
a,
Julija
Reitenbach
b,
Heinz
Amenitsch
c,
Cristiane
Henschel
d,
André
Laschewsky
de,
Peter
Müller-Buschbaum
b,
Alfons
Schulte
f and
Christine M.
Papadakis
*a
a,
Feifei
Zheng
a,
Peiran
Zhang
a,
Julija
Reitenbach
b,
Heinz
Amenitsch
c,
Cristiane
Henschel
d,
André
Laschewsky
de,
Peter
Müller-Buschbaum
b,
Alfons
Schulte
f and
Christine M.
Papadakis
*a
aTechnical University of Munich, TUM School of Natural Sciences, Physics Department, Soft Matter Physics Group, James-Franck-Str. 1, 85748 Garching, Germany. E-mail: papadakis@tum.de
bTechnical University of Munich, TUM School of Natural Sciences, Physics Department, Chair for Functional Materials, James-Franck-Str. 1, 85748 Garching, Germany
cInstitute of Inorganic Chemistry, NAWI Graz, Graz University of Technology, Stremayrgasse 9, 8010 Graz, Austria
dUniversität Potsdam, Institut für Chemie, Karl-Liebknecht-Straße 24-25, 14476 Potsdam-Golm, Germany
eFraunhofer Institute for Applied Polymer Research, Geiselbergstraße 69, 14476 Potsdam-Golm, Germany
fUniversity of Central Florida, Department of Physics and College of Optics and Photonics, 4111 Libra Drive, Orlando, Florida 32816, USA
First published on 20th May 2025
Abstract
The pressure-induced changes of the micellar structures and aggregation behavior of a thermoresponsive diblock copolymer, consisting of a short poly(methyl methacrylate) (PMMA) and a long poly(N-isopropylacrylamide) (PNIPAM) block, in a 90![[thin space (1/6-em)]](https://www.rsc.org/images/entities/char_2009.gif) :10 v/v water/methanol mixture, are characterized in the temperature–pressure frame. The phase diagram of the polymer solution is established by turbidimetry. The maximum of the coexistence line is found at 33.7 °C and 83.3 MPa. Synchrotron small-angle X-ray scattering is used to determine the micellar structure and correlation over a temperature and pressure range of 28 to 36 °C and 10 to 250 MPa, respectively. In the one-phase region, the core size steadily decreases with increasing pressure, while the micellar shell slightly shrinks after featuring an initial swelling up to ca. 75 MPa. The micellar swelling is attributed to the higher degree of hydration of the PNIPAM blocks due to the weakening of the preferential binding of methanol with PNIPAM. In the two-phase region, two pressure regimes are found: At pressures up to ca. 75 MPa (low-pressure regime), the core size and shell thickness increase while the correlation between micelles diminishes with increasing pressure. Conversely, at pressures between 75 and 250 MPa (high pressure regime), these parameters exhibit the opposite behavior. This behavior in the high-pressure regime of the two-phase region occurs regardless of whether the pressure is increased across the coexistence line or occurs entirely within the two-phase region.
:10 v/v water/methanol mixture, are characterized in the temperature–pressure frame. The phase diagram of the polymer solution is established by turbidimetry. The maximum of the coexistence line is found at 33.7 °C and 83.3 MPa. Synchrotron small-angle X-ray scattering is used to determine the micellar structure and correlation over a temperature and pressure range of 28 to 36 °C and 10 to 250 MPa, respectively. In the one-phase region, the core size steadily decreases with increasing pressure, while the micellar shell slightly shrinks after featuring an initial swelling up to ca. 75 MPa. The micellar swelling is attributed to the higher degree of hydration of the PNIPAM blocks due to the weakening of the preferential binding of methanol with PNIPAM. In the two-phase region, two pressure regimes are found: At pressures up to ca. 75 MPa (low-pressure regime), the core size and shell thickness increase while the correlation between micelles diminishes with increasing pressure. Conversely, at pressures between 75 and 250 MPa (high pressure regime), these parameters exhibit the opposite behavior. This behavior in the high-pressure regime of the two-phase region occurs regardless of whether the pressure is increased across the coexistence line or occurs entirely within the two-phase region.
Introduction
Cononsolvency is a well-known phenomenon that involves the phase separation of a thermoresponsive polymer in mixtures of water and a good solvent.1,2 While cononsolvency has been observed in several polymers and a number of cosolvents,3–10 the most thoroughly studied system is poly(N-isopropylacrylamide) (PNIPAM) in water/methanol mixtures.1,5,7,9,10 PNIPAM is a thermoresponsive polymer that exhibits a lower critical solution temperature in aqueous solution at ca. 32 °C at atmospheric pressure.11 The cloud point of PNIPAM, Tcp, diminishes initially as the volume fraction of methanol, ϕM, is increased and reaches a minimum value in the ϕM-range of 0.25–0.45 which varies between −5 and 20 °C depending on the molar mass of PNIPAM.5Tcp increases steeply as ϕM is increased further. At room temperature, the solvated polymer coil collapses and reswells again, as ϕM is increased from 0 to 1.12 Different mechanisms have been proposed to explain the cononsolvency effect of PNIPAM in water/methanol mixtures,1,2 such as (i) attractive solvent–cosolvent interactions,12,13 or (ii) competitive binding of water and methanol with PNIPAM, which both lead to a lower overall hydration of the chain,14,15 or (iii) preferential adsorption of methanol on the PNIPAM chain which causes the formation of a hydrophobic cosolvent shell along PNIPAM,16 and/or (iv) the bridging of distant repeating units of PNIPAM,17 resulting in the polymer collapse.Pressure has been shown to alter the hydration behavior and, thus, the solubility of PNIPAM in aqueous solution. The coexistence line in the temperature–pressure frame features an upward convex shape in both H2O and D2O.9,18–21 The presence of methanol strongly expands the one-phase region of aqueous solutions of PNIPAM.22 Thus, at high pressure, the solubility range of PNIPAM in a water/methanol mixture is enhanced compared to the one in neat water, i.e., the cononsolvency effect is reversed at high pressures. This was attributed to the preferential binding of water to PNIPAM instead of methanol, resulting in a higher overall solvation of the polymer.23–25 Our previous results from quasielastic neutron scattering (QENS) and Raman spectroscopy showed that, in water/methanol mixtures, methanol is preferentially adsorbed on PNIPAM at atmospheric pressure and below Tcp.25 The preferential adsorption of methanol diminishes, and a fraction of the hydration water is released abruptly from the alkyl groups, as the temperature is raised across Tcp. At 200 MPa, on the contrary, the preferential adsorption of methanol is suppressed over the entire temperature range investigated, also above Tcp. Moreover, the alkyl groups of the polymer chains remain hydrated throughout the entire temperature range, and the hydration water is released only gradually above Tcp.25 A similar behavior was observed in neat D2O.26
While these high-pressure studies on cononsolvency addressed linear PNIPAM homopolymers, studies on more complex systems are scarce.27 In the present study, we investigate the influence of pressure on the structures of a micelle-forming poly(methylmethacrylate)-b-poly(N-isopropylacrylamide) diblock copolymer PMMA21-b-PNIPAM283 in a water/methanol mixture. Previously, some of us investigated the temperature-induced changes of the micellar structure of a 3 wt% solution of the identical diblock copolymer in D2O at atmospheric pressure by dynamic light scattering and synchrotron small-angle X-ray scattering (SAXS).28 In line with other studies on block copolymers of PNIPAM with hydrophobic blocks,29–34 it was found that, below Tcp, spherical micelles are formed, which feature a PMMA core and a hydrated PNIPAM shell, leading to a homogeneous dispersion of micelles. We note that the PMMA block is very short. Above Tcp, this polymer solution exhibits a two-phase state, which has its origin in the reduced solubility of the PNIPAM blocks, which results in aggregation of the micelles.28 Below Tcp, the micellar core radius and shell thickness decrease slightly with increasing temperature. Moreover, the correlation between micelles vanishes as Tcp is approached. In the two-phase region, i.e., above Tcp, the micellar core shrinks slightly, and the dehydration and collapse of the PNIPAM blocks results in a contraction of the shell and aggregation of the micelles. However, the macroscopic phase separation into a micelle-poor and a micelle-rich phase takes extremely long time. The collapsed micelles form clusters that gradually grow and form compact aggregates at temperatures far above Tcp.28 Later, the effect of the composition of the solvent mixture water/methanol (D2O/CD3OD) on the micellar structure of PMMA21-b-PNIPAM283 was investigated at 20 °C.35 At this temperature, the coexistence line is crossed at ϕM = 0.22. The diblock copolymers form spherical core–shell micelles for ϕM-values up to 0.25, while they are molecularly dissolved for ϕM-values of 0.7 or higher. Furthermore, the shell thickness and core size of the micelles decrease, as ϕM is increased from zero towards the coexistence line. The former is caused by the cononsolvency effect on the PNIPAM blocks, while the latter was attributed to the softening of the PMMA micellar core by the uptake of methanol. In a third study of ours, the temperature-induced structural changes of PMMA21-b-PNIPAM283 in D2O/CD3OD mixtures was examined for different ϕM values, namely 0.1 and 0.2.36 At ϕM 0.1 (the composition used in the present study as well) and below Tcp, the overall micellar size is slightly smaller than in neat D2O. However, the temperature dependence of the structure and correlation of the micelles is similar to that in neat D2O. Above Tcp, on the contrary, the aggregation behavior of the collapsed micelles differs from that in neat D2O. Specifically, the aggregates formed by the collapsed micelles are larger and less densely packed. This was attributed to the combined effect of temperature and the cosolvent on the aggregation.36
Here, we address the effect of pressure on a micellar solution of PMMA21-b-PNIPAM283 in a D2O/CD3OD mixture with composition ϕM = 0.1. We determine the phase diagram by turbidimetry and investigate the pressure-induced micellar structures by synchrotron SAXS in pressure scans from 10 to 250 MPa at several temperatures between 28 and 36 °C. In the pressure scans at 28 and 30 °C, the coexistence line is crossed once, namely from the one-phase to the two-phase region. At 31 °C, re-entrant behavior from the two-phase to the one-phase and to the two-phase region is observed, i.e., the coexistence line is crossed twice. At 36 °C, the SAXS measurements are performed above the maximum of the coexistence line, i.e., entirely in the two-phase region. While pressure-resolved experiments on PNIPAM-based diblock copolymers in water/methanol mixtures have not yet been conducted, the effect of pressure on the structure of PNIPAM nanogels in water/methanol mixtures of 10 mol% of methanol (ϕM ≅ 0.2) was investigated using pressure-resolved SAXS combined with Fourier transform infrared (FT-IR) spectroscopy.27 Above the volume phase transition temperature (VPTT), the size of the nanogel particles exhibits a non-monotonous behavior in response to pressure: It increases up to 100 MPa before decreasing as the pressure is further raised. The initial swelling of the nanogel particles was attributed to the replacement of H-bonded methanol molecules by water molecules as pressure is increased.27
We have recently investigated the temperature- and pressure-induced changes of the micellar structures of PMMA21-b-PNIPAM283 in neat D2O using small-angle neutron scattering (SANS).21 We found that pressure significantly affects the degree of hydration of the micellar shell in the two-phase region. At atmospheric pressure, the PNIPAM shell dehydrates and shrinks, while it remains partially hydrated at high pressure. Conversely, the micellar core, consisting of PMMA and possibly also of dehydrated PNIPAM chains, is not affected by changes in temperature and pressure, even in the two-phase region.21 We expect that the presence of methanol affects the temperature and pressure dependence of the size and the degree of solvation of the micellar core and shell. On the one hand, the softening of the PMMA core by methanol may lead to a less stable core with respect to pressure changes. On the other hand, the reduction of the cononsolvency effect with pressure observed in PNIPAM homopolymers in water/methanol may cause a similar behavior of the micellar shell of PMMA-b-PNIPAM, enhancing the solubility of the micelles in the temperature–pressure frame. Accordingly, pressure may enhance the influence of the presence of 10% v/v of methanol on the structure of the micelles, even in the one-phase region, where it has a negligible effect at atmospheric pressure.36
The present study aims to extend the current knowledge on micellar solutions of PMMA-b-PNIPAM by addressing the following aspects: (i) the effect of the presence of methanol on the pressure-induced phase transition of PMMA-b-PNIPAM from the one-phase to the two-phase region, (ii) comparison of the pressure-induced transition with the temperature-induced phase transition in water/methanol, (iii) the pressure-induced re-entrant behavior into the two-phase region and the changes in the micellar structure in the two-phase region. Moreover, we analyze whether the observations made on PNIPAM homopolymers in a mixed solvent under pressure can explain the behavior of this more complex system.
Materials and methods
Materials
The PMMA21-b-PNIPAM283 diblock copolymer utilized in this study is the same as the one used in our previous research (Scheme S1 in the ESI†).21,28,35,36 It was synthesized using reversible addition–fragmentation chain transfer (RAFT) polymerization. Its apparent number-average molar mass Mn determined by size exclusion chromatography is 35000 g mol−1 with a dispersity Đ of 1.39.28 The polymer was dissolved at a concentration of 3 wt% in a 90:10 v/v mixture of D2O (purity 99.95%) and CD3OD (purity 99.50%, both from Deutero GmbH, Kastellaun, Germany). Afterwards, the solution was shaken for 48 h at room temperature. Deuterated solvents were used for consistency with our previous investigations.21,28,35,36 The same procedure and polymer concentration were used to prepare the solution in neat D2O.
Turbidimetry
Turbidimetry was carried out as described previously21 using a 10 mW HeNe laser (λ = 632.8 nm) and detector (a photodiode from Thorlabs GmbH, Germany), but a different high-pressure cell (model 740.2206, SITEC, Maur, Switzerland). The sample was located in a custom-made Al sample holder employing two sapphire windows with a diameter of 5 mm and a thickness of 1 mm. The windows are separated by a Viton O-ring of inner and outer diameters of 3 and 5 mm, respectively. The solution was pressurized by means of a hand-operated pressure generator (model 750.1700, SITEC, Maur, Switzerland), and the temperature of the sample was controlled by a thermostat (model F12, Julabo GmbH, Seelbach, Germany). The intensity of the light transmitted through the sample was measured during heating scans at a rate of 0.05 K min−1 at pressures between 10 and 200 MPa. In each temperature scan, the measured transmitted intensity was normalized to its maximum value. The cloud point was determined as the temperature at which the transmitted intensity starts to decrease. For reference, a solution of PMMA21-b-PNIPAM283 in neat D2O was measured as well in the same cell and in the same way.Small-angle X-ray scattering (SAXS)
Synchrotron SAXS measurements were conducted at the Austrian SAXS beamline at Elettra Sincrotrone, Trieste, Italy.37 The X-ray wavelength λ was 0.77 Å. A 2D pixel detector (Pilatus 3 1M, Dectris) was used to measure the scattered intensity at a sample-to-detector distance of 2216 mm, resulting in a q-range of 0.08–6.4 nm−1. The high-pressure instrument was able to generate pressures up to 350 MPa using a motor-driven, piston-type generator. The pressure was transferred to a sample cell through a tubing network containing the pressurizing liquid (water). The sample cell had an optical path length of 1.6 mm and two diamond windows. The sample was separated from the pressurizing medium by a Kapton capillary of length 3 mm and diameter 1.5 mm, placed inside the cell perpendicular to the beam direction.38 At every pressure, 3 SAXS measurements were taken with an exposition time of 10 s each after a pressure equilibration time of 10 s. Pressure scans were started at low temperature. After each scan, the pressure was reduced to 10 MPa, and the temperature was raised to the next value. After every temperature change, a waiting time of ca. 60 min was applied to ensure the thermal equilibration of the sample. The 2D scattering data of the polymer solution and the neat solvent mixture were azimuthally averaged by using the Python-based program SAXSDOG.39 Afterwards, the 1D scattering curves were corrected for background scattering from the empty cell and for transmission.Modeling of the SAXS data
In the one-phase region, the SAXS curves (in the range q = 0.09–2 nm−1) were fitted by the following model:| I(q) = IP(q) + I0ICS(q)SHS(q) + IOZ(q) + Ibkg | (1) |
In the two-phase region, the same model was used. However, it was not necessary to include a distribution for the core radius. Moreover, in some instances, the scattering contrast between the core and the shell vanishes, thus the second and third terms of eqn (1) were omitted. Furthermore, in these cases, it was possible to determine the radius of gyration of the aggregates formed by the collapsed micelles by using the Guinier–Porod form factor,45IGP(q), rather than the Porod term. Hence, the following expression was used:
| I(q) = IGP(q) + Ibkg | (2) |
For detailed information about the models presented above, see eqn (S1)–(S13) in the ESI.† The software MATLAB47 was used to implement the models described in eqn (1) and (2) and to carry out least-square fits of the SAXS curves (eqn (S14) in the ESI†).
Results and discussion
First, we present the phase diagram in the temperature–pressure frame of a 3 wt% solution of PMMA21-b-PNIPAM283 in a 90:10 v/v D2O/CD3OD mixture. The phase diagram was also measured in neat D2O at the same polymer concentration to unambiguously evaluate the effect of methanol on the coexistence line. Second, we present the pressure- and temperature-dependence of the micellar structure and aggregation behavior of PMMA21-b-PNIPAM283 in the D2O/CD3OD mixture obtained from synchrotron SAXS measurements.
Temperature–pressure phase diagram
Fig. 1(a) displays the temperature dependence of the normalized light transmission of the polymer solution in D2O/CD3OD at pressures between 10 and 200 MPa. The temperature Tcp, at which the transmission starts to drop, increases with pressure up to ca. 100 MPa, while the opposite trend is observed at higher pressures. For all pressures, the decay is abrupt, and the transmission decreases to zero. Only at 10 MPa, the decay of the transmission is more gradual, and the transmission does not vanish completely at high temperatures. This behavior is also observed in neat D2O at 10 MPa (Fig. S1a in the ESI†). It suggests that applying pressure promotes the formation of large aggregates that cause a stronger scattering of the light above Tcp, resulting in close to zero values of the light transmission. The light transmission above Tcp does not increase, indicating that the aggregates formed do not precipitate during the course of the experiment. The phase diagram in the temperature–pressure frame is obtained from these Tcp-values (Fig. 1(b)). The Tcp-values of both solutions, PMMA-b-PNIPAM in D2O/CD3OD and in neat D2O, seemingly lie on an ellipse, as observed previously for PNIPAM homopolymers in neat D2O and D2O/CD3OD mixtures.9,20,22 Considering the limited range of pressures used in the turbidimetry measurements and in consistency with our previous work,21 the data are fitted by parabolas (eqn (S15) in the ESI†). Furthermore, the maximum of the coexistence line of PMMA-b-PNIPAM in D2O/CD3OD is located at pmax = 83.3 ± 1.3 MPa and Tmax = 33.7 ± 0.4 °C, i.e., it is at higher pressure and temperature compared to the polymer solution in D2O (pmax = 31.4 ± 2.5 MPa and Tmax = 33.0 ± 0.6 °C). Such shift was previously reported for PNIPAM homopolymer solutions in the same solvent mixtures.9,22 We conclude that the expansion of the one-phase region, observed for PNIPAM homopolymer solutions, which is caused by the change in the type of solvation of the chains, also occurs in the shell of the micelles formed by PMMA-b-PNIPAM. | ||
| Fig. 1 (a) Normalized light transmission of the polymer solution as a function of the temperature measured during heating scans at the pressures indicated in the graph. (b) Resulting cloud points (symbols). The black solid line is the fit of the data by a parabola. The dashed red line is the coexistence line determined for a 3 wt% solution of PMMA-b-PNIPAM in neat D2O (Fig. S1 in the ESI†). | ||
Micellar structures and aggregate formation during pressure scans at different temperatures
Pressure-resolved SAXS experiments (pressure scans) were conducted between 10 and 250 MPa with pressure increasing in steps of 25 MPa at 28, 30, 31 and 36 °C, as depicted in Fig. 2(a). Based on the phase diagram from turbidimetry, we anticipate the following scenarios for these temperatures: At 28 and 30 °C, the coexistence line should be traversed from the one-phase region to the two-phase region at ca. 190 and 170 MPa, respectively. Re-entrant behavior is expected at 31 °C with transitions from the two-phase region at low pressures into the one-phase region at ca. 15 MPa and into the two-phase region at high pressures at 155 MPa. For 36 °C, the sample is expected to be in the two-phase region in the entire pressure range. | ||
| Fig. 2 (a) Phase diagram of the polymer solution from turbidimetry. The pressure scans at 28, 30, 31, and 36 °C are indicated with blue arrows. (b)–(e) Selected SAXS curves from the pressure scans at (b) 28 °C, (c) 30 °C, (d) 31 °C, and (e) 36 °C. The SAXS curves in the one- and two-phase regions are displayed in bluish and reddish colors, respectively. | ||
The SAXS curves from the pressure scan at 28 °C are shown in Fig. 2(b) (shifted curves are shown in Fig. S2 in the ESI†). For pressures up to 200 MPa, the curves feature a shoulder at q ≅ 0.2 nm−1, which shifts to higher q-values and becomes flatter with increasing pressure. Similar to our previous studies in neat D2O,21,28,35,36 we attribute these features to the combination of the form and structure factor of the core–shell micelles. Additionally, the slope of the forward scattering (q < 0.2 nm−1) slightly increases as pressure is increased up to 200 MPa. This contribution is presumably partially due to remaining parasitic scattering from defects in the thick windows of the high-pressure cell. Above 200 MPa, the curves change noticeably. At 225 MPa (Fig. S2 in the ESI†), for instance, the curve overall looks similar to the ones at lower pressures, but the shoulder is now located at q ≅ 0.3 nm−1, and the intensity of the forward scattering has increased. This finding suggests that distinct changes in the micellar structure and aggregation degree occur between 200 and 225 MPa. Accordingly, we localize the pressure at which the phase transition occurs, pcp, between 200 and 225 MPa. This value is slightly higher than the one detected by turbidimetry (pcp = 190 MPa). This may be due to a slight mismatch of temperatures between the two setups. At 250 MPa, the shoulder has transformed into a strong correlation peak. This indicates that the spatial correlation of the micelles becomes stronger, as pressure is increased in the two-phase region. The SAXS curves at 30 °C show similar features to those at 28 °C, both in the one-phase and two-phase regions (Fig. 2(c) and Fig. S3 in the ESI†). At this temperature, we identify pcp between 200 and 225 MPa, i.e., slightly higher than the value determined from turbidimetry (170 MPa). As discussed above, this may be due to a slight mismatch of temperatures between the two setups.
Fig. 2(d) and Fig. S4 in the ESI† show the SAXS curves at 31 °C. As suggested by the results from turbidimetry, the curves can be grouped into three pressure ranges: First, at 10 MPa, we observe a monotonous decay in most of the q-range, which indicates the presence of large-scale inhomogeneities. Second, we do not observe the shoulder at q ≅ 0.2 nm−1, which is characteristic of the scattering of spherical core–shell micelles and is observed in the curves in the one-phase region at 28 and 30 °C. This type of featureless curve was previously observed for PMMA-b-PNIPAM in neat D2O above Tcp at atmospheric pressure by SANS.21 Conversely, at pressures between 25 and 175 MPa, the curves display the shape characteristics of core–shell micelles, similar to the curves observed in the one-phase region at 28 and 30 °C. We ascribe this to the re-solvation of the micellar shell and the dispersion of the micelles in the solvent mixture. At pressures of 200 MPa and above, the curves look similar to the ones in the high-pressure regime of the two-phase region at 28 and 30 °C, indicating the enhanced correlation between the micelles as well as their aggregation. Thus, the coexistence line is crossed at a pressure between 175 and 200 MPa, again at a slightly higher pressure than expected from turbidimetry (pcp = 155 MPa).
At 36 °C, all the SAXS curves feature a strong correlation peak and significant forward scattering (Fig. 2(e) and Fig. S5 in the ESI†), indicating the presence of large aggregates made of highly correlated micelles. As pressure is increased from 10 to 50 MPa, the position of the correlation peak shifts gradually to slightly smaller q-values, while the intensity of the peak increases. Above 50 MPa, the correlation peak shifts gradually to higher q-values and becomes sharper as pressure is increased up to 250 MPa.
We fitted structural models (eqn (1), (2) and eqn S1–S13 in the ESI†) to the SAXS data to obtain information about the pressure- and temperature-dependence of the micellar dimensions, the solvent volume fraction in the micellar shell, and the aggregation behavior of the micelles. Two different models were used depending on the position in the temperature–pressure frame. Fig. 3 shows examples of the overall fitting function and its deconvolutions for three SAXS curves from the 3 regimes encountered in the pressure scan at 31 °C. The SAXS data with their model fits are presented in Fig. S2–S5 in the ESI† for the four pressure scans.
 | ||
| Fig. 3 Representative SAXS curves of the polymer solution from the pressure scan at 31 °C with model fits at (a) 10 MPa, (b) 150 MPa, and (c) 250 MPa. Solid black line: overall model fit; dashed lines: individual contributions to the model fits, as given in the legends. | ||
At 10 MPa (Fig. 3(a)), the data are modelled with eqn (2), that only considers the contribution from large homogeneous aggregates. This contribution is described by the Guinier–Porod form factor, IGP(q), that gives information about the overall size of the aggregates and the roughness of their surface. However, there is no clear contribution in the high-q region, which would originate from a micellar form and structure factor or from concentration fluctuations inside the shell of the micelles. This situation is similar to the ones observed by us previously above Tcp at atmospheric pressure in neat D2O (by SANS)21 and in neat D2O and D2O/CD3OD mixtures with ϕM of 0.1 and 0.2 (SAXS).28,36 While the contrast conditions in SAXS and SANS differ from each other, in both cases, the scattering contrast between the core and shell of the micelles is lost. This is due to the substantial expulsion of the solvents from the micellar shells and the formation of compact, nearly solvent-free aggregates.
At 150 MPa (Fig. 3(b)), i.e., inside the one-phase region, we use eqn (1) to fit the curve. The form factor of polydisperse spherical core–shell micelles with a constant PNIPAM concentration in the shell, Ics(q) (eqn (S5) in the ESI†), is suitable to fit the data. This is different from our previous results from PMMA-b-PNIPAM solutions in neat D2O28 and D2O/CD3OD mixtures35,36 in the one-phase region, which featured an exponential concentration decay along the radial direction, even under pressure.21 The constant polymer concentration in the shell is reminiscent of the observations at temperatures above Tcp, where the shell is collapsed.28,36,48 Thus, the PNIPAM blocks in the micellar shell are contracted to a certain degree, presumably because of the combined effect of pressure and the presence of methanol. The other contributions to the model are the hard-sphere structure factor, which is utilized to describe the correlation between the micelles. The Porod term, IP(q), describes the forward scattering, which dominates at low q-values, while the Ornstein–Zernike structure factor, IOZ(q), models the decay at high q-values. Additionally, a constant background is included in the model.
At 250 MPa, i.e., in the high-pressure regime of the two-phase region, we use eqn (1). However, the form factor of polydisperse core–shell spheres (eqn (S5) in the ESI†) does not fit the data well. Therefore, we use the form factor of monodisperse core–shell spheres, Pcs(q) (eqn (S2) in the ESI†).
Structural parameters from model fits of the SAXS pressure scans
In this section, the parameters from model fits of the SAXS data at the four temperatures are analyzed. These are the micellar core radius Rc, the shell thickness ΔR, the micellar radius Rm, the hard-sphere radius RHS, the volume fraction of correlated micelles, fs, and the volume fraction of the solvent inside the micellar shell, ϕ, which are presented and discussed here. The remaining parameters are given in Tables S1–S4 in the ESI.† This way, we aim to obtain insights into the temperature and pressure dependence of the micellar structure and the aggregation behavior of the micelles in the polymer solution in D2O/CD3OD.Pressure-induced phase transition from the one-phase to the two-phase region
Fig. 4(a) depicts the structural parameters related to the micelles obtained from fits to the SAXS curves for the pressure scan at 28 °C, namely, Rc, ΔR, Rm, and RHS. At this temperature, the transition from the one-phase to the two-phase region occurs between 200 and 225 MPa, see above. Within the one-phase region, the core radius Rc decreases slightly from 4.2 to 3.6 nm, as pressure is increased from 10 to 200 MPa. The shell thickness ΔR shows non-monotonous behavior: It increases from 5.4 to 7.0 nm up to 75 MPa and then decreases to 6.0 nm, as pressure is increased further to 200 MPa. The behavior of the micellar radius Rm is determined by the combined effect of Rc and ΔR and reflects the non-monotonous behavior of ΔR, which results in a maximum value of Rm of ∼11 nm at 75 MPa. The average half-distance between the correlated micelles, RHS, remains at ∼16 nm up to 75 MPa and decreases to 13 nm as pressure is increased further to 175 MPa. (At 200 MPa, value of RHS cannot be determined.) Since RHS > Rm in this region, the correlated micelles do not overlap with each other. The volume fraction of the correlated micelles, fs, is displayed in Fig. 4(b). fs is in the range 0.10–0.13 up to 75 MPa and decreases to zero as pressure is increased further to 200 MPa; i.e., the correlation between the micelles vanishes near the coexistence line. Overall, the behavior of fs coincides with the one of RHS: the average distance between the correlated micelles decreases as they dissociate into uncorrelated single micelles. Fig. 4(c) shows the solvent volume fraction in the micellar shell, ϕ. In the one-phase region, ϕ increases slightly from 0.92 to 0.94 as pressure is increased up to 75 MPa and remains constant up to 200 MPa. The initial rise of ϕ coincides with the increase of ΔR, i.e., the swelling of the shell is related to the increase of the solvent content.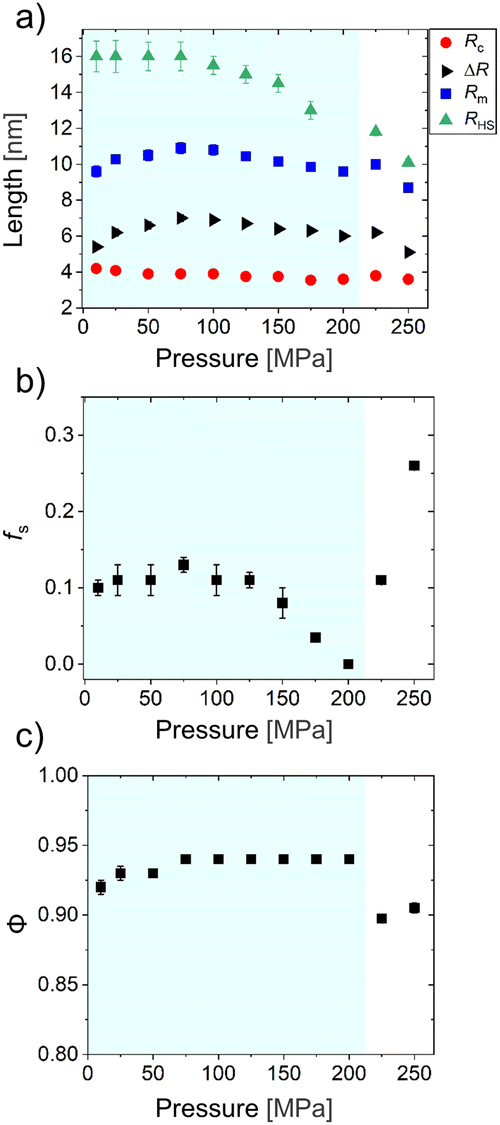 | ||
| Fig. 4 Structural parameters from model fits of the SAXS data of the polymer solution for the pressure scan at 28 °C. (a) The core radius Rc, the shell thickness ΔR, the micellar radius Rm, and the hard-sphere radius RHS are given. (b) Volume fraction of the correlated micelles, fs. (c) Volume fraction of the solvent mixture in the micellar shell, ϕ. The light-blue region indicates the one-phase region determined from SAXS. | ||
In the one-phase region, the slight decrease of Rc in D2O/CD3OD with pressure differs from the behavior in neat D2O, where Rc was not found to be affected by pressure.21 The slight decrease observed here is reminiscent of the decrease of Rc that we observed previously upon a temperature increase towards Tcp at atmospheric pressure in the same D2O/CD3OD mixture.36 Thus, the core size decreases near the coexistence line, regardless of whether it is approached by increasing the temperature or the pressure. The reduction of Rc was attributed to the possibility for chain exchange between different micellar cores in the presence of methanol, which is facilitated by the low degree of polymerization of the PMMA block, allowing for an adjustment of the aggregation number.35 However, the change in Rc may also result from changes in the thickness of the dense inner PNIPAM layer of the shell, which may contribute to Rc because strongly dehydrated PNIPAM blocks cannot be distinguished from PMMA blocks since their SLDs are very similar. As a result, dense layers of dehydrated PNIPAM around the PMMA core may contribute to the value of Rc, as observed previously for aqueous solutions of PMMA-b-PNIPAM21,28 and PS-b-PNIPAM.48 Moreover, during fitting, we assume that the SLD in the micellar core is equal to the SLD of dry PMMA. This implies that the micellar core remains solvent-free. Therefore, the observed decrease in the micellar core size may be caused by a reduction of the aggregation number of the micelles and/or by a decrease of the thickness of the inner layer of dehydrated PNIPAM blocks around the PMMA core.
In the one-phase region, the presence of methanol alters the pressure dependence of ΔR. In neat D2O, ΔR does not depend on pressure.21 On the contrary, in the D2O/CD3OD mixture, ΔR features a non-monotonous behavior with increasing pressure (cf.Fig. 4(a)). One may ascribe the initial increase of ΔR with pressure to an enhanced hydration of the PNIPAM blocks forming the micellar shell, resulting from a reduction of the preferential adsorption of methanol on PNIPAM.26 Hence, the subsequent ΔR reduction occurs when the PNIPAM blocks bind preferentially to water. We notice the significant difference between the shell thickness below Tcp at atmospheric pressure (∼20 nm)36 and the values determined here within the one-phase region at 28 °C (∼7 nm). This difference mainly arises from the different models utilized to fit the data: In the former case, the SLD in the shell featured an exponential decay along the radial direction.36 Here, we use a constant SLD along the micellar shell (eqn (S2) in the ESI†). Indeed, eqn (S2) (ESI†) was used to fit the data at the same solvent composition at atmospheric pressure just above Tcp, resulting in similar values for ΔR (∼10 nm). The difference may be attributed to the shrinkage of the shell caused by pressure or by an overestimation of Rc due to the dehydrated PNIPAM chains around the micellar core that contribute to the value of Rc, as explained above. Also, in the one-phase region, the pressure dependence of fs differs between neat D2O and the D2O/CD3OD mixture: In neat D2O, fs initially remains constant with increasing pressure and increases strongly near the coexistence line.21 In the D2O/CD3OD mixture, conversely, fs vanishes near the coexistence line (cf.Fig. 4(b)).
In the two-phase region, Rc remains approximately constant. On the contrary, ΔR and RHS exhibit a slight increase at pcp, but they both decrease as the pressure is increased further (Fig. 4(a)). Accordingly, Rm behaves similarly to ΔR in this region. After crossing the coexistence line, fs increases steeply to 0.26 at 250 MPa (Fig. 4(b)). Thus, aggregates of highly correlated micelles form in the two-phase region. In line with the last observation, strong forward scattering is observed at 250 MPa due to the presence of large aggregates (Fig. 2(b)). Also, ϕ decreases to ca. 0.90 after crossing the coexistence line and remains roughly constant up to 250 MPa (Fig. 4(c)). In this region, the presence of methanol does not alter the pressure dependence of Rc when compared to neat D2O.21 However, in neat D2O, the micellar shell noticeably rehydrates and slightly swells as pressure is increased in the two-phase region.21 On the contrary, in the D2O/CD3OD mixture, the micellar shell shrinks and the degree of solvation remains roughly constant (cf.Fig. 4(a) and (c)).
The fit parameters of the pressure scan at 30 °C are described in detail in the ESI† (Fig. S6). The structural parameters Rc, ΔR, Rm, and ϕ exhibit a similar behavior at 28 and 30 °C, both in the one-phase and the two-phase region. However, at 30 °C, the decrease in Rc is more pronounced in the one-phase region. Also, the initial increase of ΔR is more pronounced, and the change of behavior, i.e., the shell shrinking after an initial swelling, occurs at a slightly higher pressure. We attribute these differences to the higher proximity to the coexistence line (mainly at 10 MPa), leading to a substantial change in the solvent quality with increasing pressure within the one-phase region. Moreover, at 30 °C, the micelles do not feature any spatial correlation up to 200 MPa. This differs from the behavior at 28 °C, where fs > 0 in most of the one-phase region.
Re-entrant behavior: crossing the coexistence line twice
We now discuss the pressure scan at 31 °C, where the coexistence line is crossed twice (cf.Fig. 2(a) and (d)). Fig. 5(a) shows the evolution of the structural parameters of the single micelles. At 10 MPa, i.e., in the low-pressure regime of the two-phase region, the data were fitted with eqn (2). This gives insight into the overall size and surface roughness of the aggregates, which are provided by the radius of gyration Rg and the Porod exponent m, respectively. We find that, at this pressure, Rg = 108 nm (cf. Table S3 in the ESI†). Rg falls within the size range of the aggregates formed at atmospheric pressure above Tcp in neat D2O21 and in the D2O/CD3OD mixture,36 whose sizes vary between ca. 50 and 150 nm. | ||
| Fig. 5 Structural parameters from model fits of the SAXS data of the polymer solution for the pressure scan at 31 °C. (a) The core radius Rc, the shell thickness ΔR, the micellar radius Rm, and the hard-sphere radius RHS are given. (b) Volume fraction of the correlated micelles, fs. (c) Volume fraction of the solvent mixture in the micellar shell, ϕ. The light-blue region indicates the one-phase region determined from SAXS. | ||
In the one-phase region, we utilized again eqn (1) to fit the data. We find that Rc decreases steadily with pressure from 4.5 to 3.4 nm, whereas ΔR rises from 4.7 to 6.0 nm up to 75 MPa and remains rather constant up to 200 MPa. Hence, Rm increases from 9.1 nm to 10.1 nm up to 75 MPa and slightly decreases to 9.6 nm as pressure is increased to 200 MPa. While the swelling of the micellar shell is caused by the initial increase of Rm, the decrease of Rm between 75 and 200 MPa is due to the diminishing of Rc since ΔR remains roughly constant in this pressure range. In the one-phase region, RHS can only be determined at 25 MPa because there is no correlation between the micelles at higher pressures (cf.Fig. 5(b), fs = 0 up to 200 MPa). At 25 MPa, RHS ≅ 17 nm, which is similar to the value found at 28 °C at the same pressure (cf.Fig. 4(a)). Thus, the aggregates formed by the collapsed micelles at 10 MPa, i.e., in the two-phase region at low pressures, completely dissociate after crossing the coexistence line, resulting in uncorrelated single micelles. The weak correlation at 25 MPa (Fig. 5(b)) may result from the persistence of non-equilibrium aggregates of micelles formed at 10 MPa that have not yet dissociated. In the one-phase region, the solvent volume fraction in the shell increases gradually with pressure from 0.91 to 0.94 (Fig. 5(c)). The lack of micellar correlation (fs = 0) is also observed at 30 °C in the entire one-phase region (Fig. S6b in the ESI†).
In the two-phase region, the micellar structural parameters behave similarly to the previously described pressure scans: Rc remains roughly unchanged while ΔR diminishes from 5.9 to 4.0 nm with increasing pressure. Furthermore, the difference between RHS and Rm increases with pressure. fs increases substantially to 0.31. Hence, in the high-pressure regime of the two-phase region, the micelles aggregate, forming aggregates with a similar degree of correlation to those observed at 28 and 30 °C. ϕ decreases to 0.88 as pressure is increased up to 250 MPa. Thus, the shell contains significantly more solvent than in the two-phase region at 10 MPa at the same temperature.
Pressure dependence of the micellar structure in the two-phase region
Fig. 6(a) shows the structural micellar parameters obtained from fits of the SAXS curves for the pressure scan at 36 °C, where the polymer solution is located throughout in the two-phase region (cf.Fig. 2(a) and (e)). At 10 MPa, it is possible to analyze the SAXS data using eqn (1), indicating sufficient scattering contrast between the micellar core and shell. This behavior differs from that observed at 31 °C at the same pressure where the collapsed micelles are densely packed, thus hampering their characterization. Hence, the micellar shell of PMMA-b-PNIPAM presents an enhanced degree of solvation at higher temperatures in the low-pressure regime of the two-phase region. Further, all parameters exhibit a non-monotonous behavior with increasing pressure: Rc initially increases from 3.1 to 3.7 nm as pressure is raised to 75 MPa and then gradually decreases to 3.1 nm as pressure is increased further to 250 MPa. Similarly, ΔR rises significantly from 1.5 nm at 10 MPa to 5.1 nm at 75 MPa. At higher pressures, ΔR decreases monotonically until it reaches 3.1 nm at 250 MPa. For both parameters, an abrupt increase between 25 and 50 MPa is observed. Rm follows the same behavior as Rc and ΔR. RHS increases from 6.8 nm at 10 MPa to 9.7 nm at 100 MPa and then gradually decreases to 8.6 nm as pressure is raised further to 250 MPa. The volume fraction of correlated micelles, fs, initially decreases from 0.23 to 0.20 at 50 MPa before it increases gradually up to 0.31 when further increasing the pressure (Fig. 6(b)). The solvent volume fraction is presented in Fig. 6(c). ϕ increases markedly from 0.81 at 10 MPa to 0.91 at 50 MPa. At higher pressures, ϕ decreases to values that range between 0.85 and 0.87. The initial increase in ϕ coincides with the intense swelling of the micellar shell (cf.Fig. 6(a) and (c)). Therefore, two distinct pressure regimes are identified in the two-phase region: First a low-pressure regime up to ca. 75 MPa, where Rc, ΔR, and ϕ increase while fs diminishes. Second, a high-pressure regime at pressures higher than 75 MPa, where these parameters behave oppositely and steadily change. | ||
| Fig. 6 Structural parameters from model fits of the SAXS data of the polymer solution for the pressure scan at 36 °C. (a) The core radius Rc, the shell thickness ΔR, the micellar radius Rm, and the hard-sphere radius RHS are given. (b) Volume fraction of the correlated micelles, fs. (c) Volume fraction of the solvent mixture in the micellar shell, ϕ. | ||
At atmospheric pressure and above Tcp, the micelles do not have any discernible core–shell contrast, neither in neat D2O21 nor in D2O/CD3OD mixtures.36 This indicates that even a slight rise in pressure (10 MPa) strongly enhances the degree of solvation of the micellar shell. In the case of PNIPAM nanogels, they swell from a collapsed state as pressure is increased up to 100 MPa above VPTT.27 This was attributed to the replacement of H-bonded methanol molecules by water molecules as pressure is increased.27 Consequently, we assign the initial swelling of the shell of the micelles to a reduction of the number of methanol molecules bonded to the PNIPAM blocks, which leads to a stronger hydration of these blocks. Therefore, the pressure-induced shell swelling, caused by the replacement of methanol by water, occurs in both, the one-phase region (as described in the pressure scan at 28 °C) and the two-phase region. This also indicates that the increase in pressure causes the replacement of methanol by water in the two-phase region even if the preferential adsorption of methanol diminishes above Tcp at atmospheric pressure, as demonstrated previously for PNIPAM homopolymers in D2O/CD3OD.25
Temperature and pressure dependence of the micellar size, solvation and aggregation degree: summary of observations
We analyzed the pressure dependence of the micellar structure and aggregation behavior at four different temperatures. Three different scenarios are encountered: (i) The coexistence line is crossed once from the one-phase region to the high-pressure regime of the two-phase region, (ii) it is crossed from the low-pressure regime of the two-phase region to the one-phase region and to the high-pressure regime of the two-phase region, or (iii) the solution remains in the two-phase region throughout the entire pressure range, and the low- and high-pressure regimes are covered by the scan. The main findings are summarized schematically in Fig. 7.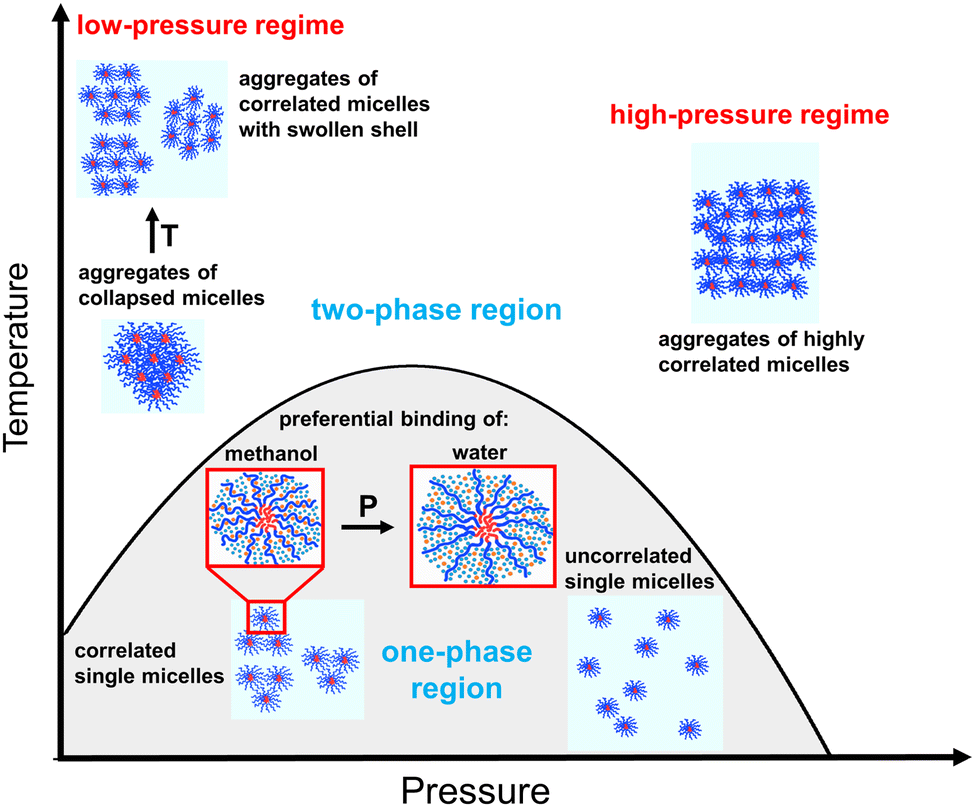 | ||
| Fig. 7 Schematic representation of the pressure and temperature dependence of the micellar structure and aggregation behavior of the polymer solution. The PMMA and the PNIPAM block are indicated in red and blue color, respectively; light blue dots: water molecules; orange dots: methanol molecules. | ||
We address the one-phase region first. Here, spherical micelles with sufficient scattering contrast between the core and shell are formed. The core size decreases steadily with increasing pressure. The swelling and the increase of the solvation degree of the micellar shell with increasing pressure from 10 to ca. 75 MPa is attributed to the change of the solvation of the PNIPAM blocks: methanol preferentially binds to PNIPAM at low pressure, while water primarily binds to PNIPAM at high pressure. At pressures higher than 75 MPa, where the PNIPAM blocks preferentially bind to water, the thickness of the micellar shell slightly decreases with increasing pressure. The correlation between the micelles vanishes as the coexistence line is approached by increasing the pressure (bottom right side of Fig. 7). However, at 30 °C, where the micelles are not correlated at the initial pressure, an isothermal pressure increase does not alter the spatial correlation between the micelles.
Now, we present the main findings regarding the two-phase region. At 10 MPa, virtually all solvent is repelled from the micellar shell, and compact aggregates of collapsed micelles are formed (upper left side of Fig. 7). At higher temperatures at this pressure, the micellar shell features an enhanced degree of solvation, resulting in the re-swelling of the shell. At pressures between 10 and 75 MPa, i.e., in the low-pressure regime of the two-phase region, the core radius and the shell thickness increase while the correlation between micelles decreases with increasing pressure. Moreover, the degree of solvation of the micellar shell exhibits a strong increase.
At pressures higher than 75 MPa, i.e., in the high-pressure regime of the two-phase region, the core radius and the shell thickness decrease with increasing pressure. Also, pressure enhances the correlation between micelles, resulting in the formation of rather well-ordered aggregates of micelles (upper right side of Fig. 7).
Conclusions
The effect of pressure on the cononsolvency effect of PNIPAM homopolymers in water/methanol mixtures has been extensively investigated before. Pressure was found to favor the hydration of PNIPAM homopolymers at the expense of the solvation with methanol, resulting in a higher solubility and expansion of the one-phase region in the temperature–pressure frame. Here, we investigate the effect of pressure on the cononsolvency effect on a more complex system, i.e., a diblock copolymer consisting of a permanently hydrophobic PMMA block and a thermoresponsive PNIPAM block. As for PNIPAM homopolymers, the solubility of the micellar shell of PMMA-b-PNIPAM is enhanced in a 90:10 v/v water/methanol mixture when pressure is applied. The presence of methanol softens the micellar core under isothermal pressure changes, resulting in a change of its size with increasing pressure. This differs from the behavior of the micellar core in neat water, where the core size remains roughly unchanged under isothermal pressure changes.21 Up to ca. 75 MPa, the thickness and solvation degree of the micellar shell increase with pressure in both the one-phase and the two-phase region. This finding is attributed to the weakening of the preferential binding of methanol, resulting in a stronger hydration of the PNIPAM blocks. The pressure and temperature dependence of the degree of correlation between micelles exhibits a complex behavior, which depends on the initial degree of correlation of the micelles. Specifically, in the one-phase region, the correlation degree of initially disordered micelles does not change under an isothermal pressure increase. All the above indicates that the pressure dependence of the structure and correlation of micelles formed by PMMA-b-PNIPAM in a water/methanol mixture with a methanol content of 10 vol% differs significantly from the one in neat water. At this, pressure changes have a different effect from the one of temperature changes, where the presence of methanol only leads to the formation of larger and less compact aggregates in the two-phase region.36 Overall, our observations show that the pressure- and cosolvent-induced changes observed in solutions of PNIPAM homopolymers have strong implications for this self-assembled micelle-forming block copolymer system.
Data availability
The data for our manuscript is found at https://doi.org/10.14459/2025mp1780488. These comprise experimental data from turbidimetry and small-angle X-ray scattering as well as scripts and functions for model fits of the SAXS data.Conflicts of interest
There are no conflicts to declare.Acknowledgements
The financial support by Deutsche Forschungsgemeinschaft (DFG) via PA 771/22-1, LA 611/19-1, MU 1487/42-1, and PA 771/31-1, the TUM August-Wilhelm Scheer Guest Professor Program and the Faculty Graduate Center Physics of the TUM Physics Department is acknowledged. The authors acknowledge the CERIC-ERIC Consortium for the access to experimental facilities and financial support.Notes and references
- C. Scherzinger, A. Schwarz, A. Bardow, K. Leonhard and W. Richtering, Curr. Opin. Colloid Interface Sci., 2014, 19, 84–94 CrossRef CAS.
- S. Bharadwaj, B.-J. Niebuur, K. Nothdurft, W. Richtering, N. F. A. van der Vegt and C. M. Papadakis, Soft Matter, 2022, 18, 2884–2909 RSC.
- M. Panayiotou, F. Garret-Flaudy and R. Freitag, Polymer, 2004, 45, 3055–3061 CrossRef CAS.
- H. M. Lambermont-Thijs, H. P. Van Kuringen, J. P. van der Put, U. S. Schubert and R. Hoogenboom, Polymers, 2010, 2, 188–199 CrossRef CAS.
- F. Tanaka, T. Koga, H. Kojima, N. Xue and F. M. Winnik, Macromolecules, 2011, 44, 2978–2989 CrossRef CAS.
- C. E. Mills, E. Ding and B. D. Olsen, Biomacromolecules, 2019, 20, 2167–2173 CrossRef CAS PubMed.
- K. N. Raftopoulos, K. Kyriakos, M. Nuber, B.-J. Niebuur, O. Holderer, M. Ohl, O. Ivanova, S. Pasini and C. M. Papadakis, Soft Matter, 2020, 16, 8462–8472 RSC.
- C. Geiger, J. Reitenbach, L. P. Kreuzer, T. Widmann, P. Wang, R. Cubitt, C. Henschel, A. Laschewsky, C. M. Papadakis and P. Müller-Buschbaum, Macromolecules, 2021, 54, 3517–3530 CrossRef CAS.
- B.-J. Niebuur, A. Deyerling, N. Höfer, A. Schulte and C. M. Papadakis, Colloid Polym. Sci., 2022, 300, 1269–1279 CrossRef CAS.
- C.-H. Ko, P. Wastian, D. Schanzenbach, P. Müller-Buschbaum, A. Laschewsky and C. M. Papadakis, Langmuir, 2024, 40, 15150–15160 CrossRef CAS.
- A. Halperin, M. Kröger and F. M. Winnik, Angew. Chem., Int. Ed., 2015, 54, 15342–15367 CrossRef CAS PubMed.
- G. Zhang and C. Wu, J. Am. Chem. Soc., 2001, 123, 1376–1380 CrossRef CAS.
- T. Amiya, Y. Hirokawa, Y. Hirose, Y. Li and T. Tanaka, J. Chem. Phys., 1987, 86, 2375–2379 CrossRef CAS.
- A. Pica and G. Graziano, Phys. Chem. Chem. Phys., 2016, 18, 25601–25608 RSC.
- C. Dalgicdir, F. Rodríguez-Ropero and N. F. A. van der Vegt, J. Phys. Chem. B, 2017, 121, 7741–7748 CrossRef CAS PubMed.
- J. Walter, J. Sehrt, J. Vrabec and H. Hasse, J. Phys. Chem. B, 2012, 116, 5251–5259 CrossRef CAS.
- D. Mukherji, C. M. Marques and K. Kremer, Nat. Commun., 2014, 5, 4882 CrossRef.
- M. Shibayama, K. Isono, S. Okabe, T. Karino and M. Nagao, Macromolecules, 2004, 37, 2909–2918 CrossRef CAS.
- B. Ebeling, S. Eggers, M. Hendrich, A. Nitschke and P. Vana, Macromolecules, 2014, 47, 1462–1469 CrossRef CAS.
- B.-J. Niebuur, L. Chiappisi, X. Zhang, F. Jung, A. Schulte and C. M. Papadakis, ACS Macro Lett., 2018, 7, 1155–1160 CrossRef CAS.
- P. A. Alvarez Herrera, G. P. Meledam, B.-J. Niebuur, Y. Taji, L. Chiappisi, C. Henschel, A. Laschewsky, A. Schulte and C. M. Papadakis, Macromolecules, 2024, 57, 10263–10274 CrossRef CAS.
- B.-J. Niebuur, C.-H. Ko, X. Zhang, K.-L. Claude, L. Chiappisi, A. Schulte and C. M. Papadakis, Macromolecules, 2020, 53, 3946–3955 CrossRef CAS.
- T. E. de Oliveira, P. A. Netz, D. Mukherji and K. Kremer, Soft Matter, 2015, 11, 8599–8604 RSC.
- A. Pica and G. Graziano, Biophys. Chem., 2017, 231, 34–38 CrossRef CAS PubMed.
- B.-J. Niebuur, W. Lohstroh, C.-H. Ko, M.-S. Appavou, A. Schulte and C. M. Papadakis, Macromolecules, 2021, 54, 4387–4400 CrossRef CAS.
- B.-J. Niebuur, W. Lohstroh, M.-S. Appavou, A. Schulte and C. M. Papadakis, Macromolecules, 2019, 52, 1942–1954 CrossRef CAS.
- C. H. Hofmann, S. Grobelny, M. Erlkamp, R. Winter and W. Richtering, Polymer, 2014, 55, 2000–2007 CrossRef CAS.
- C.-H. Ko, C. Henschel, G. P. Meledam, M. A. Schroer, P. Müller-Buschbaum, A. Laschewsky and C. M. Papadakis, Macromolecules, 2021, 54, 384–397 CrossRef CAS.
- M. Nuopponen, J. Ojala and H. Tenhu, Polymer, 2004, 45, 3643–3650 CrossRef CAS.
- H. Wei, X.-Z. Zhang, Y. Zhou, S.-X. Cheng and R.-X. Zhuo, Biomaterials, 2006, 27, 2028–2034 CrossRef CAS.
- K. Troll, A. Kulkarni, W. Wang, C. Darko, A. M. Bivigou Koumba, A. Laschewsky, P. Müller-Buschbaum and C. M. Papadakis, Colloid Polym. Sci., 2008, 286, 1079–1092 CrossRef CAS.
- S. Sistach, M. Beija, V. Rahal, A. Brûlet, J.-D. Marty, M. Destarac and C. Mingotaud, Chem. Mater., 2010, 22, 3712–3724 CrossRef CAS.
- G.-F. Luo, W.-H. Chen and X.-Z. Zhang, ACS Macro Lett., 2020, 9, 872–881 CrossRef CAS PubMed.
- G. Shao, Y. Liu, R. Cao, G. Han, B. Yuan and W. Zhang, Polym. Chem., 2023, 14, 1863–1880 RSC.
- C.-H. Ko, C. Henschel, G. P. Meledam, M. A. Schroer, R. Guo, L. Gaetani, P. Müller-Buschbaum, A. Laschewsky and C. M. Papadakis, Macromolecules, 2021, 54, 5825–5837 CrossRef CAS.
- C.-H. Ko, C. Henschel, G. P. Meledam, M. A. Schroer, R. Guo, P. Müller-Buschbaum, A. Laschewsky and C. M. Papadakis, Macromolecules, 2023, 56, 8980–8992 CrossRef CAS.
- H. Amenitsch, M. Rappolt, M. Kriechbaum, H. Mio, P. Laggner and S. Bernstorff, J. Synchrotron Radiat., 1998, 5, 506–508 CrossRef CAS.
- M. Steinhart, M. Kriechbaum, K. Pressl, H. Amenitsch, P. Laggner and S. Bernstorff, Rev. Sci. Instrum., 1999, 70, 1540–1545 CrossRef CAS.
- M. Burian, C. Meisenbichler, D. Naumenko and H. Amenitsch, J. Appl. Crystallogr., 2022, 55, 677–685 CrossRef CAS PubMed.
- G. Porod, Kolloid-Z., 1951, 124, 83–114 CrossRef CAS.
- P. Bartlett and R. H. Ottewill, J. Chem. Phys., 1992, 96, 3306–3318 CrossRef CAS.
- J. K. Percus and G. J. Yevick, Phys. Rev., 1958, 110, 1–13 CrossRef CAS.
- M. Shibayama, T. Tanaka and C. C. Han, J. Chem. Phys., 1992, 97, 6829–6841 CrossRef CAS.
- J. T. Koberstein, B. Morra and R. S. Stein, J. Appl. Crystallogr., 1980, 13, 34–45 CrossRef CAS.
- B. Hammouda, J. Appl. Crystallogr., 2010, 43, 716–719 CrossRef CAS.
- G. V. Schulz, Z. Phys. Chem., 1939, 43B, 25–46 CrossRef.
- MATLAB version: 9.13.0 (R2022b), The MathWorks Inc., Natick, Massachusetts, 2022, https://www.mathworks.com, (accessed 2024-01-07) Search PubMed.
- J. Adelsberger, A. Meier-Koll, A. M. Bivigou-Koumba, P. Busch, O. Holderer, T. Hellweg, A. Laschewsky, P. Müller-Buschbaum and C. M. Papadakis, Colloid Polym. Sci., 2011, 289, 711–720 CrossRef CAS.
Footnote |
| † Electronic supplementary information (ESI) available. See DOI: https://doi.org/10.1039/d5sm00160a |
| This journal is © The Royal Society of Chemistry 2025 |