
 Open Access Article
 This Open Access Article is licensed under a
 Creative Commons Attribution 3.0 Unported Licence
Shear thickening inside elastic open-cell foams under dynamic compression†
Samantha M.
Livermore
 *a,
Alice
Pelosse
a,
Michael
van der Naald
a,
Hojin
Kim
ab,
Severine
Atis
ac and
Heinrich M.
Jaeger
a
*a,
Alice
Pelosse
a,
Michael
van der Naald
a,
Hojin
Kim
ab,
Severine
Atis
ac and
Heinrich M.
Jaeger
a
aJames Franck Institute and Department of Physics, The University of Chicago, Chicago, Illinois 60637, USA. E-mail: slivermore@uchicago.edu
bPritzker School of Molecular Engineering, The University of Chicago, Chicago, Illinois 60637, USA
cInstitut Prime, CNRS-Université de Poitiers-ISAE ENSMA, Poitiers, France
First published on 14th January 2025
Abstract
We measure the response of open-cell polyurethane foams filled with a dense suspension of fumed silica particles in polyethylene glycol at compression speeds spanning several orders of magnitude. The gradual compressive stress increase of the composite material indicates the existence of shear rate gradients in the interstitial suspension caused by wide distributions in pore sizes in the disordered foam network. The energy dissipated during compression scales with an effective internal shear rate, allowing for the collapse of three data sets for different pore-size foams. When scaled by this effective shear rate, the most pronounced energy increase coincides with the effective shear rate corresponding to the onset of shear thickening in our bulk suspension. Optical measurements of the radial deformation of the foam network and of the suspension flow under compression provide additional insight into the interaction between shear thickening fluid and foam. This optical data, combined with a simple model of a spring submerged in viscous flow, illustrates the dynamic interaction of viscous drag with foam elasticity as a function of compression rate, and identifies the foam pore size distribution as a critically important model parameter. Taken together, the stress measurements, dissipated energy, and relative motion of the fluid and the foam can be rationalized by knowing the pore size distribution and the average pore size of the foam.
1 Introduction
Concentrated suspensions of rigid particles exhibiting discontinuous shear thickening (DST) can transform from fluid-like to solid-like under shear.1–4 The highly dissipative nature of this transition can be harnessed in a variety of applications.5–7 In particular, DST has led to a variety of composite materials, designed for low-velocity impact mitigation.8 Specifically, this includes fabrics9–12 and foams13–20 saturated with shear thickening fluid, and foams made of a shear thickening gel.21,22 These materials are flexible at low applied stress but become rigid under sudden impact, making them suitable for impact protection as well as damping applications.23–25Of the aforementioned composite materials, some of the most remarkable behavior arises in open-cell foams saturated with shear thickening fluid (STF). An STF-foam composite can generate a dramatically enhanced stress response under conditions where the bulk suspension alone would not exhibit significant thickening and an open-cell foam offers only weak resistance to compression. Prior work has associated this enhancement with an increased effective shear rate ![[small gamma, Greek, dot above]](https://www.rsc.org/images/entities/i_char_e0a2.gif) eff experienced by the STF as it is forced to flow through narrow channels and constrictions inside the foam16,17
eff experienced by the STF as it is forced to flow through narrow channels and constrictions inside the foam16,17
 | (1) |
eff reaches the critical shear rate for the onset of shear thickening in the neat STF, the STF-foam composite's resistance to compression increases strongly. While this captures the qualitative behavior of the material, it remains difficult to link this effective shear rate to the foam geometry. Furthermore, this description only considers how the foam affects the STF and neglects the opposite interaction, namely how the STF changes the behavior of the foam. This feedback becomes important during shear thickening, where the rapidly increasing viscosity of the STF can generate significantly enhanced drag on the foam.
Here we investigate both directions of this dynamic interaction in open-cell foams submerged in a bath of STF and then compressed. For this purpose, we choose a suspension comprised of fumed silica nanoparticles dispersed at 30% solid volume fraction ϕV in polyethylene glycol (PEG). Up to a critical shear rate DST ≈ 30 s−1, this suspension is Newtonian with nearly constant viscosity η, at which point the viscosity jumps up discontinuously by over an order of magnitude (Fig. 1a); this is known as discontinuous shear thickening (DST).26,27 At vertical loading speeds of vc = 150 mm s−1, neither the neat suspension nor the dry foam produces significant stress on the load cell, while the STF-foam composites generate stresses σ that exceed 100 kPa as a function of axial compressive strain ε (Fig. 1b). Fig. 1c shows the experimental setup used for compression tests of the composite STF-foam material. We perform compression tests with the same suspension on three open-cell polyurethane foams with different average cell sizes (Fig. 1d, e and Table 1). Each individual foam network contains a wide distribution of cell sizes about the mean 〈dcell〉 (Fig. 1f). The smooth increase of the data in Fig. 1b and the fact that the stress curves for vc = 150 mm s−1 display similar behavior (despite their average cell sizes differing by almost an order of magnitude) highlight the difficulty of associating a single length scale dfoam in eqn (1) with the stress–strain response of the composite material. Nevertheless, we find that a scaling with characteristic eff emerges if instead we consider the energy dissipated during compression, i.e., the area under stress–strain curves as in Fig. 1b. We then show that this energy scales with vc/dfoam for different foam types, and undergoes a pronounced increase centered around vc/dfoam = DST, if we take the foam length scale to be the average pore diameter of the foam pore size distribution.
 | ||
| Fig. 1 (a) Steady-state rheology for the neat shear thickening fluid (STF), a fumed silica and PEG suspension at volume fraction ϕV = 30%. Inset: Transmission electron microscope image of a fumed silica particle. (b) Stress–strain responses of the neat STF, neat (dry) foam, and the three composite STF-foam materials with different pore sizes, compressed at speed vc = 150 mm s−1. Note that the compression plate must accelerate at the beginning and end of a given compression, so the domain of constant speed is approximately 0.05 < ε < 0.65. The stress drop at the very end of each compression corresponds to the sudden deceleration of the compression plate and the relaxation of the suspension to its unthickened state. (c) Schematic of the experimental apparatus. A cylinder of foam is submerged in a volume of STF and centered underneath a compression plate connected to a load cell, which moves downward at speed vc during testing. The compression plate is 25.4 mm in diameter and 13.4 mm tall. (d) Images of the three different foam types with small, medium, and large pores (left to right). (e) Schematic of an idealized foam cell. (f) Normalized distributions of the cell diameters for the three foam varieties. Cell sizes are normalized by their mean value 〈dcell〉. | ||
| Foam label | Cell size (mm) | Strut thickness (μm) | Avg. strut length (mm) |
|---|---|---|---|
| Large pore | 6.1 ± 0.4 | 490 ± 83 | 2.7 ± 0.9 |
| Medium pore | 1.2 ± 0.1 | 110 ± 16 | 0.50 ± 0.1 |
| Small pore | 0.85 ± 0.06 | 56 ± 9.0 | 0.28 ± 0.07 |
The optical transparency of our suspension enables us to study the effect of the STF on the foam by tracking the deformation of the foam network under the influence of viscous flow. A dry open-cell foam compresses by successively collapsing layers of cells perpendicular to the direction of compression, causing the foam to maintain a near-constant radius under compression. However, when the foam is instead filled with a viscous fluid that is forced to flow out radially during compression, the foam struts experience viscous drag forces that can cause the foam to bulge out radially. Comparing the speed of radial foam expansion to the radial fluid speed just outside the foam reveals how viscous drag affects the foam along with signs of viscosity changes in the STF. Finally, analyzing these data with a simple model makes it possible to relate the measured speed of radial foam expansion to both the average pore size during compression and the width of the pore size distribution.
2 Materials and methods
2.1 Dense suspension preparation and rheology
We use a suspension of fumed silica (Aerosil OX-50, Evonik/Palmer Holland, average particle size ∼500 nm, dry density 2.2 g cm−3, see Fig. 1a inset) and polyethylene glycol (PEG, Sigma-Aldrich, MW = 200 g mol−1, density 1.1 g cm−3, η = 50 mPa s). The PEG and fumed silica are combined using a Heidolph high-torque mechanical mixer (ramping from 500 to 3000 rpm), starting with the full volume of PEG and gradually adding the fumed silica. Adding the particles first results in a gel-like material that is difficult to mix. The mixture is sonicated and mechanically mixed in cycles until a steady rheological state is reached. Due to the strong shearing forces from the initially inhomogeneous suspension, active supervision is necessary to prevent the sample container from spinning out or the mixing attachment from grinding against the chuck jaws.The shear rheology is sensitive to temperature increase during mixing, so suspensions are allowed to rest for several hours before any measurements are taken. The entire preparation protocol (mechanical mixing, sonication, resting, testing) typically takes over a week to produce ∼300 mL of suspension. The suspension is stored under house vacuum to prevent the hydrophilic PEG from absorbing moisture from the air.28 To minimize rheological disparities during STF-foam testing, the same large STF batch is used for all compression tests on all three foam types. Periodic rheological measurements ensure there are no aging effects over time.
All shear thickening suspensions discussed in the following refer to Aerosil OX-50 in PEG-200 with a volume fraction of ϕV = 0.30. The density of these suspensions is 1.43 g cm−3. The suspension rheology is measured using a stress-controlled rheometer (Anton Paar MCR301) with a 25 mm parallel-plate geometry and a gap size of 0.5–1 mm. Dynamic viscosity is recorded with an initial ascending ramp from 7–1000 Pa, followed by a descending ramp back to 7 Pa, where the upper limit is chosen to prevent sample ejection. Fig. 1a is the measured viscosity of the STF as a function of shear rate, showing pronounced DST at a shear rate DST ≈ 30 s−1.
2.2 Foam preparation and characterization
We test three grades of ester-based polyurethane (PU) open-cell foam (U.S. Plastics Corp.), with small, medium, and large pores, shown in Fig. 1d. For average cell size, strut length, and strut thickness see Table 1. The data in this table are from optical measurements (DSX-1000 digital microscope, Olympus), assuming all in-focus foam elements are “in-plane” when extracting lengths using image analysis software. Although the foam cells often are taken as Kelvin cells (Fig. 1e), they are in fact largely disordered cells with varying numbers of 3, 4, and 5-sided faces.29 Distributions of the cell diameters dcell for all three foams are shown in Fig. 1f; the slight left skew of the distribution has been discussed previously in the literature.30,31 Analysis of PU open-cell foams of different dcell has shown31,32 that the average pore size, i.e., the average size of the various openings in the cell facets, scales with average cell size according to 〈d0〉 = β〈dcell〉, with a factor β between and
and  . This factor depends on the details of the manufacturing protocol and the relative size of the network struts. In the following we take
  , which should be appropriate for our medium and small pore foams.
Foam specimens are cut into cylinders (21.1 mm diameter, 25.4 mm height) using a laser cutter (ULTRA X6000, Universal Laser Systems). The diameter of the cylinder face closest to the laser typically is ∼1 mm smaller than the face furthest from the laser due to heating.
2.3 STF-filled foam sample preparation
Individual foam cores are submerged into ∼150 mL of well-mixed suspension; this leaves ∼2 cm of fluid clearance above the foam, ensuring that the impactor plate is always submerged in fluid before axial strain is applied (see sketch in Fig. 1c). To remove trapped air bubbles, samples are placed under 2 Torr vacuum for 10 minutes prior to compression.2.4 Compression testing protocol
The stress–strain response of each foam-STF sample under compression is measured using a universal testing instrument (Zwick-Roell Z1.0, equipped with a 1 kN load cell). Stress is calculated as the raw force reading divided by the surface area of the foam's top face, the area of which is assumed to remain constant. The strain ε is the global axial strain, given by , where h(t) is the height at time t, and h0 is the original height of the foam. The impactor plate and the surface below the foam are coated with sandpaper to prevent the foam from slipping laterally.
The compression protocol includes several steps. First, the plate's starting height is adjusted so it is submerged in the suspension to minimize bubble formation and other possible suspension-air interfacial effects. The plate then moves downward onto the foam until it reaches a pre-stress of 0.2 N. Next the STF-foam sample undergoes two conditioning cycles at 3 mm s−1 to a strain of 70% (corresponding to a height change of 17.5 mm) in order to standardize the shear history of the sample.‡ This depth was chosen because PU foams are resilient against repeated compression up to a strain of 75%.33
After conditioning, the plate pauses above the sample for 3 s before commencing the measurement phase at a preset impact speed, which we vary from 0.1 mm s−1 to 150 mm s−1, corresponding to strain rates from 0.004 s−1 to 5.91 s−1 as defined by = vc/h0. Although the compression tests are speed-controlled, there are brief acceleration transients at the beginning and the end of the pre-set travel distance (17.5 mm) while the system is ramping up to the targeted speed and during stopping; this effect is exacerbated for high compression rates. We therefore limit our analysis to the strain range 0.05 < ε < 0.65.
2.5 Particle image velocimetry protocol
Compressions are filmed with a Phantom high-speed camera (V12 and VEO models, 1200 × 708 px image size). For particle image velocimetry (PIV), filming rates of 50–4000 fps are used to accurately correlate particle motion between frames.To map the flow of the STF at the boundaries of the foam, fluorescent red polyethylene microspheres (Cospheric, density 1.2 g cm−3) with a diameter of 75–90 μm are added to the suspension as tracers. The comparable densities of the tracer particles and the suspension allow the tracers to remain evenly suspended for several hours at a time. A vertical slice of the suspension is illuminated with a laser sheet of 505–550 nm wavelength (Motovera self-leveling green laser); this plane is perpendicular to the axis of compression and to the camera. The laser sheet is about 2 mm thick at close range.
Examples of high-speed videos are included as ESI.† Videos are analyzed using the openPIV Python package. The output of the PIV analysis is a 2D vector field (vr, vz) for every frame, describing the flow field outside of the foam at that time step. We use an interrogation window size of 32 px in the leading frame, a search area size of 36 px in the following frame, with an overlap of 17 px. We select these parameters to include several tracer particles in each interrogation window. In addition to tracking the fluid flow, we also track the radial deformation of the foam edge. For each video frame, we fit a spline to the foam edge in order to distinguish it from the surrounding fluid. We subdivide the spline into 20 equal length pieces and track these individual segments over time. This allows us to compare the foam and fluid motions locally. In the case of the oil-foam control experiments, the foam solid is very likely to slip relative to the compression plate at late strains; for this reason, we consider only the motion tracking data for ε < 0.4. For large vc and low strain, the Python curve-fitting protocol has larger uncertainties. Thus, to maintain consistency throughout our datasets, we focus on the motion tracking data for ε > 0.2 for all speeds.
3 Results and discussion
3.1 Stress–strain response of STF-foam composites
For a given foam type, the compressive stress response of the STF-foam composite increases with increasing compression speed vc, as shown in Fig. 2a–c. Across various pore sizes, larger pores require faster compression to achieve a given stress. This trend is best illustrated by the 10 mm s−1 curve in all panels of Fig. 2, where the onset of non-zero stress occurs at larger strains as the foam pore size increases. A key feature of Fig. 2 is the smooth shape of the stress–strain response, which is in stark contrast to the highly discontinuous rheology of the neat STF at the onset of DST (Fig. 1a). Furthermore, we observe a saturation of the stress response: as previously shown in Fig. 1b, at 100 mm s−1 and 150 mm s−1, the curves become effectively independent of foam type and thus pore size. These observations are consistent with the literature.16,17 In particular, Dawson et al.17 find that while the stress response of their STF-foam is highly dependent on pore size at low strain rates, it becomes pore-size independent at shear rates exceeding the shear thickening threshold. | ||
| Fig. 2 Average compressive stress–strain response of the (a) small, (b) medium, and (c) large pore foams for a range of impact speeds. Each curve is the average of at least two compression tests at a given compression speed. The full set of impact speeds is presented in the ESI.† | ||
However, these data are clearly incompatible with a single length scale dfoam characterizing the internal foam geometry in eqn (1), even if this length scale is strain dependent. The measurements indicate that any such length scale must have an inherently wide distribution, which in turn generates a wide range of effective, local shear rates within the foam. We can rationalize the smooth stress response and its saturation behavior using the distribution in pore sizes in the foam. As the foam network is compressed, pores of varying size shrink as a function of strain. This means that, over the course of a compression, more and more of the STF inside the foam becomes shear thickened as the fraction of pores small enough to trigger DST increases. Once vc is sufficiently large that DST is met for even the largest pores from the very beginning of the compression, everything shear thickens at once. Increasing vc further will not change the stress response, leading to the stress saturation we observe in Fig. 2 for a given foam type. For vc = 100 and 150 mm s−1, the compression speed is then large enough to have triggered DST across even the foam with the largest pores.
While linking the rheology of the neat STF to the detailed compression response of the composite material via the distribution of pore sizes is not straightforward for the stress–strain data (Fig. 1b and 2), such a link emerges naturally when considering the energy dissipated Ediss during compression. Ediss is given by the integral of the stress σ over a strain range ε ∈ (εi, εf),
 | (2) |
 | ||
| Fig. 3 (a) Energy dissipated as a function of compression speed vc for three pore sizes. (b) Same data as in A but plotted as a function of effective shear rate vc/dfoam, where the average pore size 〈d0〉 was taken as the characteristic length scale dfoam, showing collapse of the three curves. The vertical dashed line denotes DST = 30 s−1. | ||
If the same Ediss data are instead plotted as a function of an effective shear rate vc/dfoam they can be collapsed by making dfoam proportional to 〈dcell〉. Most interestingly, if we equate the characteristic length scale dfoam with the mean of the pore size distribution, 〈d0〉, and use that  in polyurethane open-cell foams,31,32 we find the data collapse such that the steepest rise in Ediss occurs right around eff = DST = 30 s−1 for the neat STF; this is shown in Fig. 3b. For effective shear rates eff < 10 s−1, there is only gentle growth of Ediss in the composite material. This aligns with the idea that at low vc, only a small fraction of pores in the foam lead to DST in the suspension, so the overall effective viscosity of the sample remains low. At intermediate rates 10 < eff < 50 s−1, the viscosity of the STF inside the composite is highly sensitive to the pore size distribution, leading to the strong increase in Ediss. This coincides with a greater fraction of foam pores initiating DST in the suspension, such that the overall effective viscosity of the suspension increases strongly. Finally, for eff ≥ 50 s−1, the reduced slope in Ediss shows that the majority of pore sizes has now become involved in generating DST.
Therefore, the shape of the transition between these regimes in Ediss reflects the shape of the (cumulative) distribution of the pore sizes. The collapse of the three datasets across the whole transition region thus indicates that despite having different means, their pore size distributions must have nearly the same shape.
3.2 Velocimetry measurements of foam and suspension
We leverage the optical transparency of our suspension to monitor the expansion of the compressed foam and the flow of the STF local to the foam boundary as described in Section 2.5. We make these measurements for a small pore foam submerged in STF, and also for a foam submerged in a high-viscosity, Newtonian silicone oil (η = 10 Pa s) as a control to distinguish non-Newtonian effects from Newtonian ones. We determine the relative magnitudes of spring forces from the elastic foam network and the viscous drag forces of the filler fluid using the relative radial motion of the foam boundary and the local fluid.We present exemplary fluid PIV and foam tracking results in Fig. 4 for an STF-foam sample at low and high compression rates. In the low-speed case shown in Fig. 4a, the foam collapses locally and buckles inward as the STF flows outward radially. We observe this behavior in low-speed compressions of both foams filled with oil and with STF. In contrast, the foam bulges out significantly when compressed quickly. For vc = 100 mm s−1, this radial expansion begins at very low strain and continues throughout the compression. Once the impactor stops moving, the foam relaxes back to its original shape. This general behavior is observed in both the STF-foam and the oil-foam composites. In Fig. 4, the magnitudes of the local flow field vectors are normalized by the compression speed vc. Comparison of panels A and B shows that, for a given strain ε, the normalized high- and low-speed flow fields appear similar. The area of strongest flow is concentrated near pronounced curvature in the foam boundary, due to either inward buckling or radial expansion as a consequence of fluid drag on the foam network.
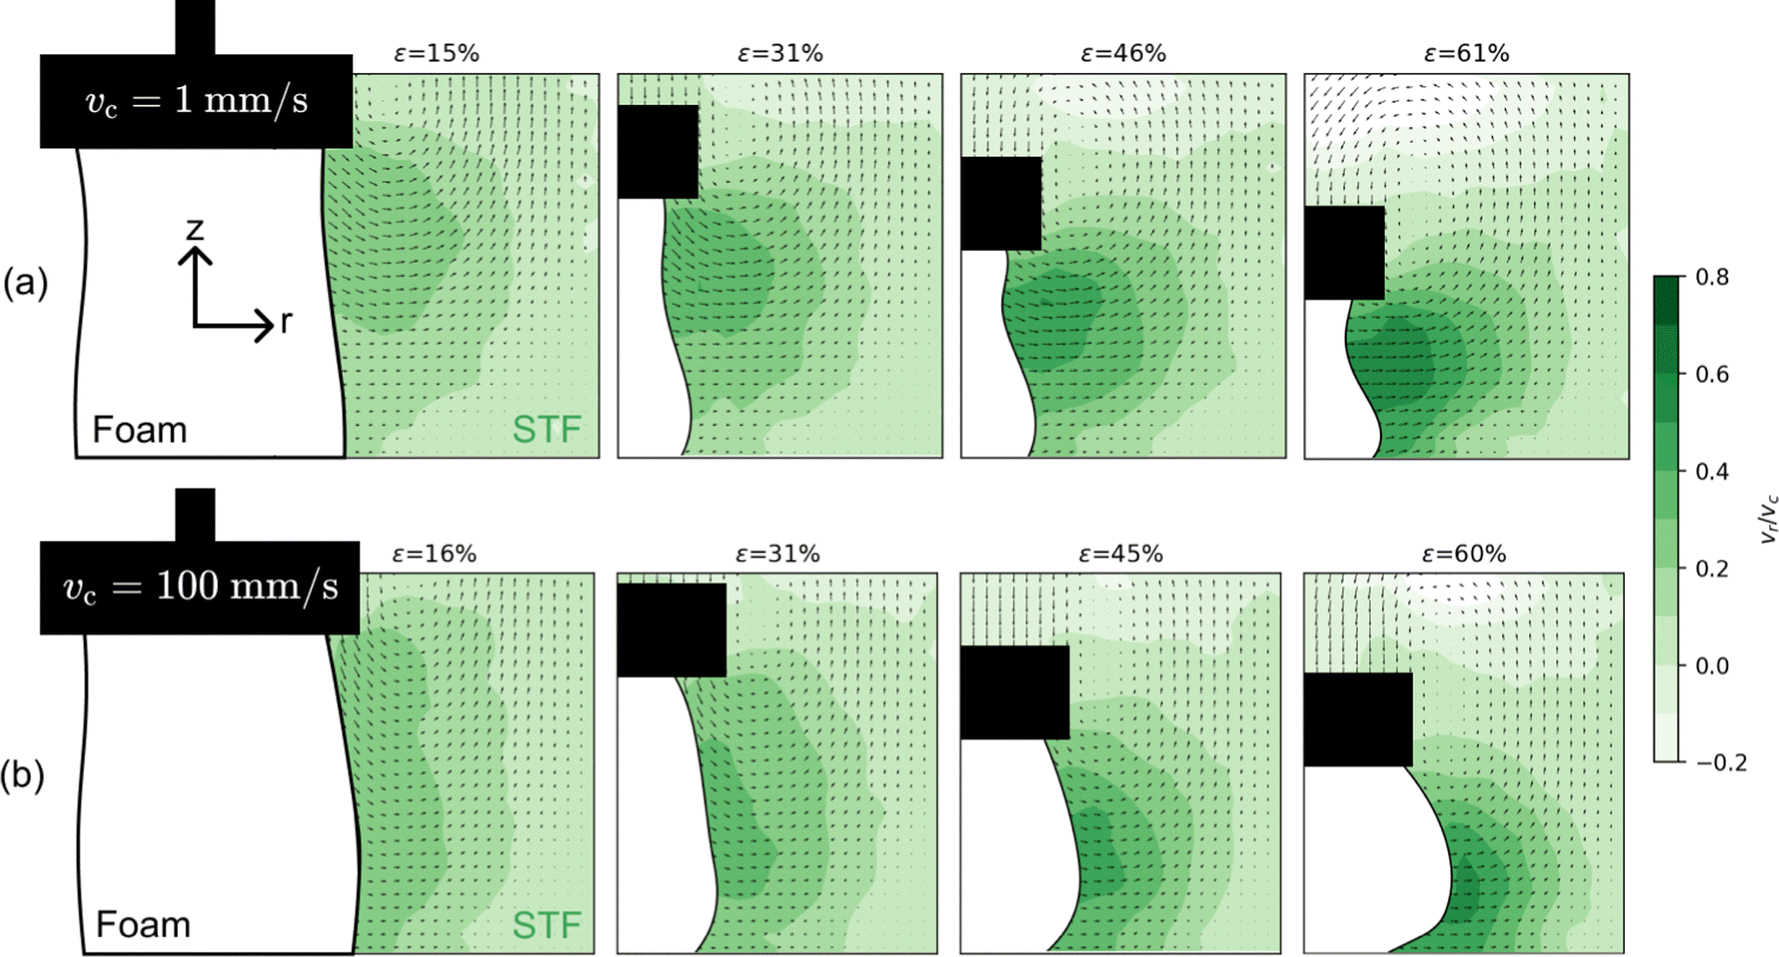 | ||
| Fig. 4 Particle image velocimetry (PIV) analysis of the fluid outside the foam for different strains ε. The 2D vector field includes both radial and axial velocity components; the contour shading in green denotes the magnitude of the radial component normalized by the compression speed. The white form is the foam, and the black rectangle is the impactor plate. (a) Slow compression, vc = 1 mm s−1 and (b) high speed compression, vc = 100 mm s−1. | ||
In order to quantify the effect of drag from the suspension on the foam struts, we calculate the ratio of radial speed of the foam boundary to radial speed of the fluid directly outside the foam, λ = vr,foam/vr,fluid. To this end, the foam boundary in Fig. 4 is subdivided along the vertical z-direction into 20 equal length segments at every strain step. We then extract vr,foam and vr,fluid for each segment and calculate the λ ratio as a function of compressive strain. Fig. 5a and b show λ averaged over a central subset of ten segments, chosen to include the regions of strongest flow along the foam boundary. The error bars indicate one standard deviation.
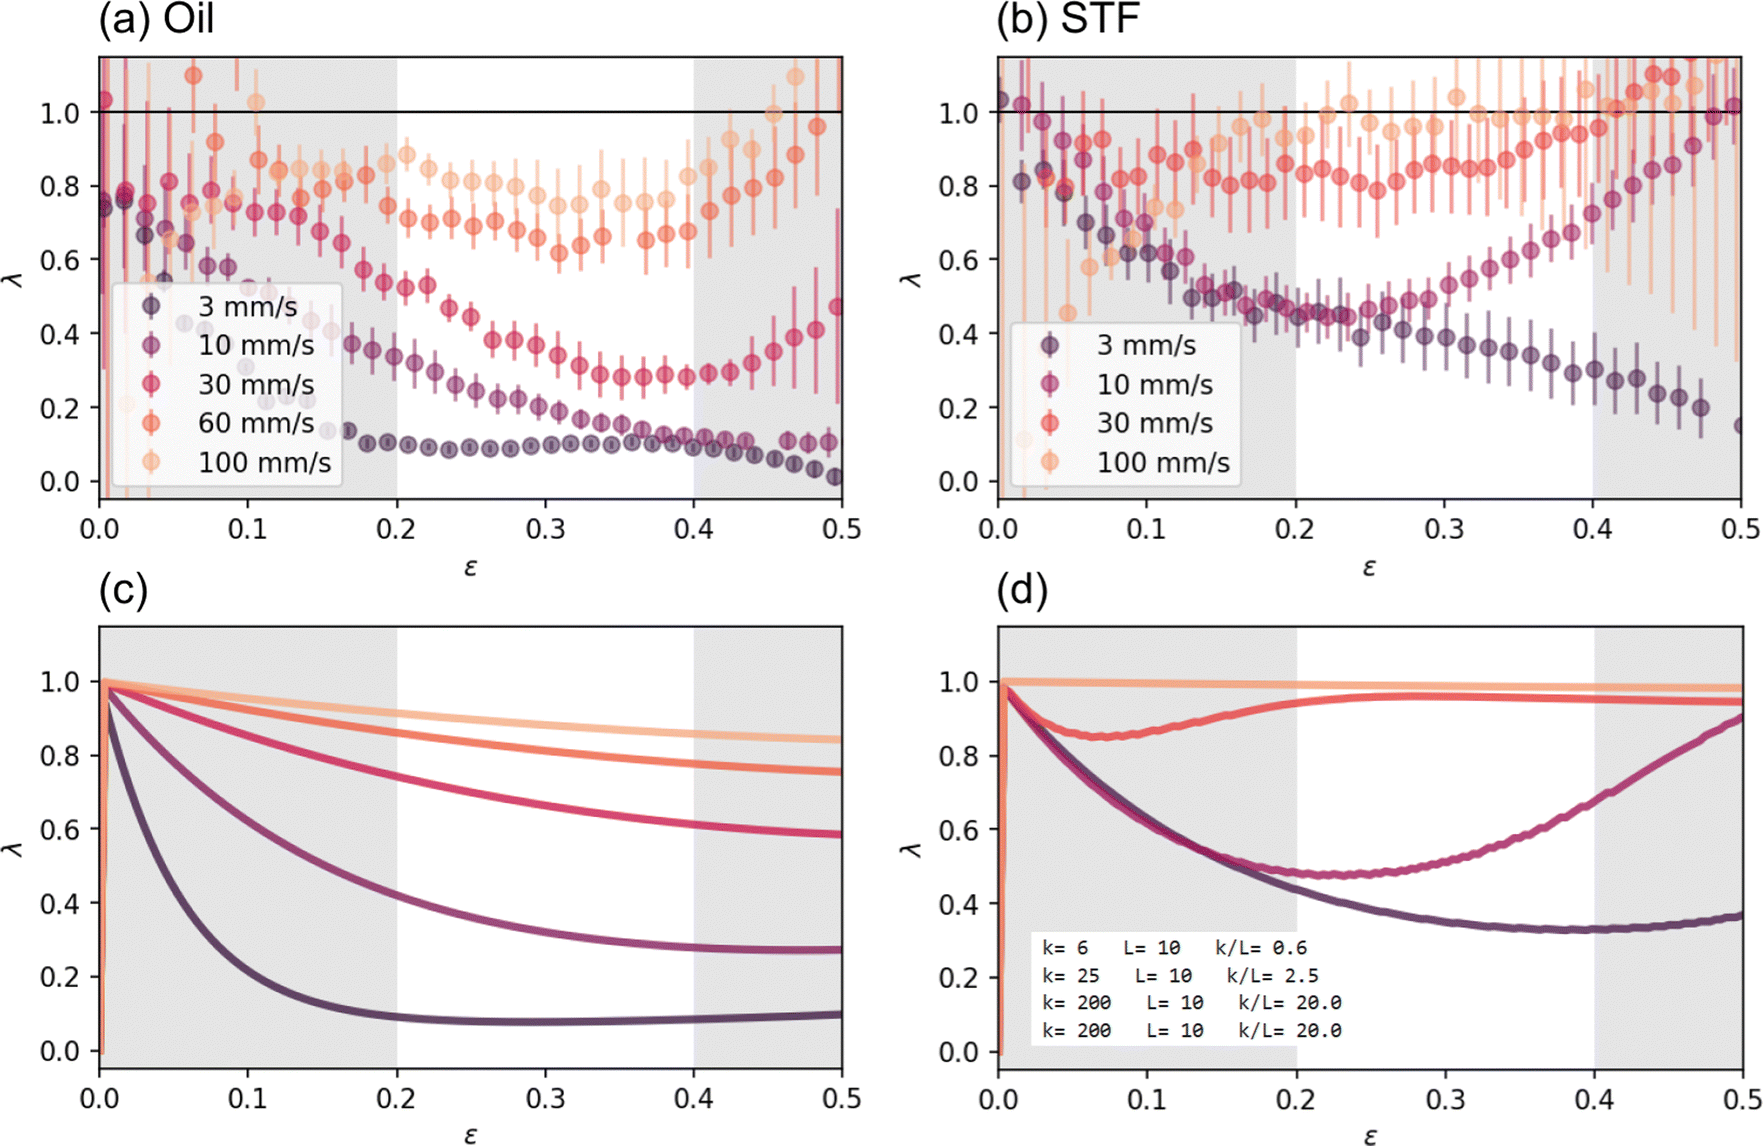 | ||
| Fig. 5 Ratio of foam and fluid radial speeds, λ = vr,foam/vr,fluid, as a function of strain ε for the small pore foam submerged in Newtonian (left) and STF (right) fluids. Experimental measurements are shown in the first row (see Section 3.2), and model curves (see Section 3.3) in the second row. (a) Experimental measurements of λ(ε) for an oil-filled foam (η = 10 Pa s). (b) Experimental measurements of λ(ε) for an STF-filled foam. (c) λ predictions from the model for the oil-filled foam, using k/L = 20 Pa. (d) λ predictions from the model for the STF-foam, using k/L = 0.6, 2.5, 20, 20 Pa for vc = 3, 10, 30, 100 mm s−1, respectively. Additional parameters describing the STF-foam interaction are w = 0.5〈d0〉 and 〈d0〉 = 0.19 mm. We include examples of model outputs for different input parameters in the ESI,† namely variations in k, w, 〈d0〉, and η( ≥ DST). In all panels, the gray shaded regions indicate parts of the compression cycle that, in the experiments, may be affected by the acceleration of the impact plate; this also is where the experimental uncertainties are largest. In panels (a) and (b), the data are averages of two independent measurements and the error bars correspond to one standard deviation. In panels (c) and (d), the model parameter characterizing the inertial response is taken as L/m = 100 m kg−1 for all vc. | ||
In the following analysis of λ(ε), we exclude strains where the impactor was either accelerating to reach the preset speed or the foam was becoming too compressed to allow for a straightforward extraction of λ (note the large deformations of the foam boundary at ε ≈ 60% in Fig. 4 and the large error bars in Fig. 5a and b at large strains and high compression speeds, where λ also increases because the impactor must come to a stop). These excluded regions are shaded gray in Fig. 5, leaving the strain interval 0.2 ≤ ε ≤ 0.4 for more detailed comparison with a simple model in the next section. Nevertheless, even cursory inspection of the curves in Fig. 5a and b indicates that in all cases, except for the slowest compression of the oil-filled foam, a steady-state of the radial foam expansion is not reached. Under steady-state conditions, the balance of foam elasticity and viscous drag from the fluid implies vr,foam ≈ 0 and we thus expect λ → 0. Values of λ closer to unity at a given strain therefore signal that the fluid drag is (still) causing significant radial foam expansion. In particular, when the filler material is highly viscous, it cannot escape the foam without pulling the network structure along with it, such that λ → 1.
For the slowest oil-foam compression shown in Fig. 5a, λoil decays quickly and is near zero in the region of interest ε ∈ (0.2, 0.4), indicating that the foam is not expanding radially. When vc is increased, λoil starts at a non-zero value and decreases with increasing strain. For the two highest speeds, 60 and 100 mm s−1, λoil ≈ 0.8 and stays relatively constant as a function of strain in the region of interest. These data are shown to demonstrate the relationship between elasticity and viscous drag in foam filled with a high viscosity Newtonian fluid, resulting in a monotonically evolving λoil as a function of strain and compression rate.
Performing the same measurements on the STF-foam system reveals key differences compared to the oil-foam. First, at the slowest compression speed shown, vc = 3 mm s−1, where we do not expect significant shear thickening, the ratio λSTF decreases with strain in a manner similar to the 10 mm s−1 Newtonian oil case. This is surprising at first glance, as the oil viscosity is 10 times greater than that of the unthickened STF; one might therefore have expected the STF to relax faster than the oil to λ values around zero (but see below for further discussion). Second, at a compression speed of 10 mm s−1, the STF-foam begins to bulge radially around ε = 0.25, leading to a pronounced increase in λSTF.
Such a change in slope of λ(ε) is unique to the STF-foam system; we never observed this in the oil-foam case. The smooth, continuous increase in λSTF beyond ε = 0.25 mimics what we observe for the stress response in Fig. 1b and 2, which we related to the broad distribution of pore sizes in the foam network: if the foam were completely uniform in its porosity, we would expect an abrupt spike in λ upon the onset of DST as the bulk of STF throughout the foam shear thickens at once. The fact that this upturn in λSTF occurs at vc = 10 mm s−1 agrees well with the transition from low to high dissipated energy from Fig. 3 for the same small-pore foam filled with STF. The change of slope in λ for vc = 10 mm s−1 can therefore be attributed to the onset of DST inside the foam once the strained pores are small enough for the effective internal shear rate to exceed DST, as opposed to the 30 and 100 mm s−1 cases, where DST appears to take place from the very beginning of the compression. Indeed, at speeds vc > 10 mm s−1, λSTF increases further and throughout the whole strain interval of interest maintains a large value, which eventually saturates at λSTF ≃ 1 for vc = 100 mm s−1.
3.3 Modeling the radial foam expansion
Elastic foams saturated with fluid can be categorized as poroelastic materials.34–37 The deformation of the elastic foam is coupled with the fluid flow through an internal pore pressure, whose variations are related to fluid volume flux by Darcy's law, where q is the fluid flow rate, κ is the permeability of the foam, η is the fluid dynamic viscosity, and ∇p is the gradient of the fluid pressure in the foam pores. The full set of equations ruling the behavior of the poroelastic material also depends on various elastic moduli of the system. Several authors have applied poroelastic theory to foam-like structures saturated with fluid38–42 in order to model 3D material stresses and pore pressure. When this analysis has been extended to explicitly describe the time-dependent deformations of a poroelastic composite, either volume flow rate or external pressure have to be fixed to predict the radial expansion.43 In the present experiments, neither of these quantities are fixed. In the following, rather than dealing with the complexities of a full 3D model, we propose a simpler approach to describe the foam expansion as the system is being compressed. The 1D model developed here is designed to capture the radial deformation of the foam given the radial fluid flow as a function of time.
In order to link the radial expansion during the compression of an STF-filled open-cell foam to the distribution in pore sizes, we approximate the foam as a uniform cylinder of elastic material that is expanded radially from within by radial viscous drag. This effectively reduces to a one-dimensional model of a mass m connected to a spring of stiffness k, driven by a fluid of radial speed vfluid and viscosity η(ε). In the case of the STF, η(ε) depends on the strain-dependent effective shear rate. We assume the viscous drag to be directly proportional to the relative speed between foam and fluid, as we expect the flow inside the foam to be laminar (for a cell size of 0.85 mm, a minimum viscosity of ∼1 Pa s, and a maximum speed of 150 mm s−1, the Reynolds number in this regime is less than 0.2). The equation of motion governing the radial expansion dynamics is then given by
| mẍ − α(vfluid − ẋ) + kx = 0. | (3) |
As the foam is compressed by the impactor moving axially at constant speed, the speed of the outflowing incompressible fluid increases. Equating the volume flux Q = 2πr0h(t)vfluid, escaping through the foam lateral surface, and the volume variation below the plate Q = πr02|dh/dt|, leads to  , where h(t) = h0 − vct. Comparison with PIV data (as in Fig. 4) validates this approximation over the strain interval ε ∈ (0.2, 0.4).
We numerically solve eqn (3) to find the best value of k/L to mimic the experimental data presented in Fig. 5a and b in the region ε ∈ (0.2, 0.4). Inertial effects represented by the first term only affect the curvature of λ for extremely small strain values and are negligible in the strain region of interest. For a given fluid speed and prescribed viscosity, the solution of eqn (3) is thus parameterized by the ratio k/α = k/Lη which compares the relative strengths of foam stiffness and hydrodynamic drag, and expresses a characteristic relaxation rate of the composite material. In eqn (3), the elastic restoring force of the spring dominates over fluid drag when kx ≳ αvfluid, which is equivalent to  when rewritten in terms of vc, r0 and h0. When this condition is met at some x, further foam expansion is hindered and λ ≃ 0. Conversely, as long as kx ≪ αvfluid, the viscous drag force dominates over foam elasticity and causes the foam to keep expanding radially such that λ maintains a non-zero value.
In the simplest, Newtonian case, i.e. the foam filled with silicone oil shown in Fig. 5c, the viscosity is η = η0 = 10 Pa s. In Fig. 5c, a fixed ratio k/α = 2 s−1 captures the behavior of the λ curves from experiments for all speeds shown in Fig. 5a. For k/α = 2 s−1, the model predicts that the foam expansion behavior transitions from elasticity-dominated to drag-dominated at a foam expansion x/r0 = 0.1 for compression speeds vc ≳ 5 mm s−1. This transition is indeed seen in the experimental data in Fig. 5a, where λ ≃ 0 for vc ≲ 5 mm s−1, while λ is non-zero for larger compression speeds and approaches unity for vc ≫ 5 mm s−1.
In the STF case, we take the viscosity to be:
 | (4) |
DST = 30 s−1 according to the rheology shown in Fig. 1a. Note that this form of η assumes the existence of a secondary Newtonian plateau (not shown in Fig. 1a). As we show below, this captures the experimentally observed behavior well even though our model does not consider the possibility of shear jamming, i.e., the transition of the fluid to a solid-like state.
The effective local shear rate eff is calculated by considering the pore size distribution of the foam network. At each step of the integration of eqn (3), we take eff = vc/[(1 − ε)d0] to account for these effects using a pore size d0 picked from the distribution of initially unstrained pores, which is scaled by the instantaneous strain ε. We then solve eqn (3) throughout the range of pore sizes, and take the global response to be the Gaussian-weighted sum of these “local” solutions. We approximate the unstrained pore size distribution by a Gaussian of width w = 〈d0〉/2 centered around an average pore size 〈d0〉, such that d ∈ (〈d0〉 − w, 〈d0〉 + w). As we did for the collapse of the Ediss data in Fig. 3b, we again use  , i.e., 〈d0〉 ≈ 0.2 μm for our small pore foam.
In comparing the oil-filled and STF-filled foam data, it is important to consider how each liquid interacts with the PU foam material. In particular, plasticization of the PU by the PEG leads to chemically induced swelling and softening of the foam material.44 As a consequence, we find that the spring constants in the linear compression/extension regime for foams soaked in PEG are ∼10 times softer than when soaked in silicone oil (see ESI†). In addition, the ester-based PU comprising our foams is hydrophilic. Therefore, we can expect greater slip between the foam struts and oil than for the case of PEG-based STF.45,46 In our model, plasticization decreases the spring constant k while the reduced slip increases the drag coefficient L. Taken together, this decreases the ratio k/L more than tenfold compared to the oil-filled case. Despite the fact that the STF viscosity η0 is 10 times smaller at the slowest compression speeds, the even larger decrease in k/L therefore indicates that the relaxation of the STF-filled foam, given by the rate k/α, should be slower than for oil. This slower relaxation is borne out by the data for 3 mm s−1 in Fig. 5b, and captured by the model when we set k/α = 0.6 s−1.
As the compression speed vc is increased, DST is triggered according to eqn (1) in the region of the pore size distribution where sufficiently small pores lead to eff ≳ DST. For vc = 10, 30, and 100 mm s−1, reasonable fits to the data are obtained only if we increase k/L. In particular, the model requires k/L = 2.5 Pa to closely reproduce the slope change in λ around ε = 0.25 for vc = 10 mm s−1. A value of 2.5 Pa is roughly a factor 4 larger than what we used to fit the behavior at lower speeds, before the occurrence of DST, where k/L = 0.6 Pa. We interpret this increase in k/L as a stiffening of the elastic response of the foam material, and thus as an increase in effective spring constant k, induced as shear-thickened fluid surrounds the plasticized foam struts. The behavior of λ(ε) for vc = 30 and 100 mm s−1 can be reproduced if k/L is enlarged further to 20 Pa. This is in line with the idea that with increasing vc, a larger range of pore sizes has become involved in triggering DST, which then also leads to an enhanced stiffening of the foam network.
These results show how tracking the radial dynamics during compression, when analyzed through the lens of the model given by eqn (3), can provide information about the fluid-foam interaction. Changes in this interaction are reflected with remarkable sensitivity through changes in the ratio k/L required for matching the experimental data, despite the model's simplicity. In particular, while a single value for k/L can capture the behavior of λ(ε) for the oil-filled foam irrespective of vc, this is not possible for the STF-filled foam. Therefore, the speed-dependent increase of k/L from 0.6 Pa to 2.5 Pa can be taken as a proxy for how the emergence of strong shear thickening inside the foam network feeds back onto that same network by strengthening its mechanical response. The other two parameters relevant for modeling the STF-filled foam, the width w of the pore size distribution and its mean 〈d0〉, can be obtained from the measured distribution of cell sizes (Fig. 1f), scaled by the factor β = 0.25. Reasonable adjustments to w do not change the model output significantly, whereas it is sensitive to the value of 〈d0〉. To illustrate the sensitivity of the model to parameter variation, we compare model output for a range values of k/L, w, and 〈d0〉 in the ESI.† Finally, comparison of the top and bottom rows in Fig. 5 shows that the model captures much of the behavior of λ(ε) also during the early and late stages of the compression, i.e., in the areas shaded gray. However, especially for the faster impact speeds and ε > 0.4 the experimental uncertainties become too large for quantitative analysis.
During sufficiently rapid foam compression, the STF will be driven into the DST regime and potentially even further into a shear jammed state. In either case, the suspension locally will undergo a dramatic jump in viscosity wherever the shear rate for DST onset is exceeded. In transitioning from DST to a shear-jammed state, the viscosity continues to increase until the suspension locks up and becomes solid-like. This process is driven by propagating shear fronts.47,48 Our experiments cannot provide information about whether cells within the foam are shear jammed. In our simplified model, we approximate this by introducing a sufficiently large viscosity jump at a critical local shear rate. We find good agreement as long as the viscosity jump is large enough (see ESI†). Therefore, the model is agnostic to the exact mechanism (DST or shear jamming) while capturing the experimentally observed behavior of the STF-filled foam.
4 Conclusions
We investigated the compressive response of an elastic foam network filled with a discontinuously shear-thickening fluid experimentally through stress measurements and PIV analysis to gain insights into the interaction between foam elasticity and non-Newtonian viscous drag. Under compression, the foam network submerged in the STF amplifies shear fields in localized regions, leading to a gradual yet pronounced global thickening at compression rates significantly lower than those expected out of the bulk rheology of the fluid. For three foams of differing pore sizes, the data shows that the rise in the total energy dissipated is set by the compression speed scaled by the average pore size of the foam,eff = vc/〈d0〉. This choice of 〈d0〉 as the characteristic length scale in eqn (1) links the DST rheology to the foam geometry.
We also demonstrate that the STF greatly influences the deformation of the foam, just as the presence of the foam affects the behavior of the interstitial STF. We show that the STF can exert drag forces on the solid network through which it travels by comparing the relative speeds of the expanding foam boundary and the local fluid through the speed ratio λ. This quantity directly reflects the force balance between viscous drag and solid elasticity, and clearly distinguishes between unthickened (low speed, low viscosity) and thickened (high speed, high viscosity) states. For compression rates that correspond to local shear rates approaching DST, the behavior of λ is more complex, reflecting the gradual spread of shear thickened regions throughout the material. A simple 1D model of a spring driven by viscous drag successfully reproduces the behavior of λ for Newtonian and strongly non-Newtonian rheologies using eqn (1) to estimate local internal shear rates. By integrating a Gaussian distribution of pore sizes (and therefore of shear rates) into the model, the model is able to capture even the non-monotonic behavior of λ at the onset of shear thickening. The agreement between model and experiment λ allows us to connect a small number of model parameters to physical foam features (the center and width of the pore size distribution) which are essential to explaining the smooth stress increase with strain, despite the abrupt thickening of the neat STF. Thus, knowing only the foam elasticity, STF rheology, and the pore size distribution of the foam, we can model the balance between viscous drag and foam elasticity in STF-filled foams as a function of strain and compression rate. This could aid in the design of advanced impact mitigation technologies with customizable mechanical properties by tailoring the fluid rheology together with the foam network architecture.
Author contributions
S. L., M. N., and H. J. performed the project conceptualization, S. L. and A. P. conducted the formal data analysis, S. L. performed all experimental investigation, S. L., A. P., and H. J. developed the methodology, and all authors contributed to the writing of the paper.Safety and hazards
Dry fumed silica is easily aerosolized and extremely hazardous to the respiratory system, so it must be handled inside of a fume hood. See OSHA guidelines for detailed regulations.Data availability
The data supporting this article are published at https://doi.org/10.18126/thb6-td42.Conflicts of interest
There are no conflicts to declare.Acknowledgements
The authors thank Lucy Nathwani and Philip Andrango for performing preliminary measurements. S. L. is grateful to Tanvi Gandhi for her mentorship, and to Malcolm Slutzky, Ted Esposito, Qinghao Mao, and Andrés Cook for helpful discussions. Support is acknowledged from the University of Chicago Materials Research Science and Engineering Center (MRSEC), which is funded by the National Science Foundation under award number DMR-2011854. Additional support was provided by the Army Research Laboratory under Cooperative Agreement Number W911NF-20-2-0044. S. L. acknowledges support from a MRSEC Graduate Student Fellowship and A. P. from a MRSEC Kadanoff-Rice Postdoctoral Fellowship. S. A. acknowledges support from the French government program “Investissements dAvenir” (LABEX INTERACTIFS, reference ANR-11-LABX-0017-01, and EUR INTREE, reference ANR-18-EURE-0010).Notes and references
- H. A. Barnes, J. Rheol., 1989, 33, 329–366 Search PubMed.
- J. F. Morris, Annu. Rev. Fluid Mech., 2020, 52, 121–144 CrossRef.
- R. Mari, R. Seto, J. F. Morris and M. M. Denn, Proc. Natl. Acad. Sci. U. S. A., 2015, 112, 15326–15330 CrossRef CAS.
- E. Brown and H. M. Jaeger, Rep. Prog. Phys., 2014, 77, 046602 CrossRef PubMed.
- N. Y. Lin, C. Ness, M. E. Cates, J. Sun and I. Cohen, Proc. Natl. Acad. Sci. U. S. A., 2016, 113, 10774–10778 CrossRef CAS.
- R. Niu, M. Ramaswamy, C. Ness, A. Shetty and I. Cohen, Sci. Adv., 2020, 6, eaay6661 CrossRef CAS PubMed.
- J. A. Richards, D. J. M. Hodgson, R. E. ONeill, M. E. DeRosa and W. C. K. Poon, Proc. Natl. Acad. Sci. U. S. A., 2024, 121, e2317832121 Search PubMed.
- S. Wang, W. Zhang, J. Gao, D. Gao and C. He, Int. J. Adv. Des. Manuf. Technol., 2024, 133, 1973–2000 Search PubMed.
- M. Decker, C. Halbach, C. Nam, N. Wagner and E. Wetzel, Compos. Sci. Technol., 2007, 67, 565–578 CrossRef CAS.
- Y. S. Lee, E. D. Wetzel and N. J. Wagner, J. Mater. Sci., 2003, 38, 2825 CrossRef CAS.
- J. Fehrenbach, E. Hall, L. Gibbon, T. Smith, A. Amiri and C. Ulven, J. Compos. Sci., 2023, 7, 31 Search PubMed.
- M. Liu, S. Zhang, S. Liu, S. Cao, S. Wang, L. Bai, M. Sang, S. Xuan, W. Jiang and X. Gong, Composites, Part A, 2019, 126, 105612 CrossRef CAS.
- M. Parisi, T. Allen, M. Colonna, N. M. Pugno and O. Duncan, Smart Mater. Struct., 2023, 32, 074004 CrossRef CAS.
- C. Caglayan, I. Osken, A. Ataalp, H. S. Turkmen and H. Cebeci, Compos. Struct., 2020, 243, 112171 Search PubMed.
- C. Fischer, S. A. Braun, P.-E. Bourban, V. Michaud, C. J. G. Plummer and J.-A. E. MÅnson, Smart Mater. Struct., 2006, 15, 1467–1475 Search PubMed.
- M. Soutrenon and V. Michaud, Smart Mater. Struct., 2014, 23, 035022 CrossRef CAS.
- M. A. Dawson, G. H. McKinley and L. J. Gibson, J. Appl. Mech., 2009, 76, 061011 CrossRef.
- M. R. Sheikhi and S. Gürgen, Compos. Struct., 2022, 279, 114797 Search PubMed.
- F. Zhao, L. Wu, Z. Lu, J.-H. Lin and Q. Jiang, Mater. Des., 2022, 213, 110375 CrossRef CAS.
- A. Haris, B. W. Y. Goh, T. E. Tay, H. P. Lee, A. V. Rammohan and V. B. C. Tan, Smart Mater. Struct., 2018, 27, 015021 CrossRef.
- T. Fan, S.-S. Xue, W.-B. Zhu, Y.-Y. Zhang, Y.-Q. Li, Z.-K. Chen, P. Huang and S.-Y. Fu, ACS Appl. Mater. Interfaces, 2022, 14, 13778–13789 CrossRef CAS PubMed.
- L. Xiaoke, Y. Kejing, F. Qianqian and Q. Kun, Smart Mater. Struct., 2019, 28, 055017 CrossRef.
- A. Srivastava, A. Majumdar and B. S. Butola, Crit. Rev. Solid State Mater. Sci., 2012, 37, 115–129 Search PubMed.
- C. Fischer, A. Bennani, V. Michaud, E. Jacquelin and J.-A. E. MÅnson, Smart Mater. Struct., 2010, 19, 035017 Search PubMed.
- S. S. Iyer, R. Vedad-Ghavami, H. Lee, M. Liger, H. P. Kavehpour and R. N. Candler, Appl. Phys. Lett., 2013, 102, 251902 CrossRef.
- E. Brown and H. M. Jaeger, Phys. Rev. Lett., 2009, 103, 086001 Search PubMed.
- P. Bourrianne, V. Niggel, G. Polly, T. Divoux and G. H. McKinley, Phys. Rev. Res., 2022, 4, 033062 CrossRef CAS.
- J. F. B. Pereira, L. P. N. Rebelo, R. D. Rogers, J. A. P. Coutinho and M. G. Freire, Phys. Chem. Chem. Phys., 2013, 15, 19580 RSC.
- H. Zhu, N. Mills and J. Knott, J. Mech. Phys. Solids, 1997, 45, 1875–1904 CrossRef CAS.
- J. A. Elliott, A. H. Windle, J. R. Hobdell, G. Eeckhaut, R. J. Oldman, W. Ludwig, E. Boller, P. Cloetens and J. Baruchel, J. Mater. Sci., 2002, 37, 1547–1555 CrossRef CAS.
- W.-Y. Jang, A. M. Kraynik and S. Kyriakides, Int. J. Solids Struct., 2008, 45, 1845–1875 CrossRef.
- N. J. Mills, J. Mater. Sci., 2005, 40, 5845–5851 CrossRef CAS.
- S. Hager and T. Craig, J. Cell. Plast., 1992, 28, 284–303 CrossRef CAS.
- M. A. Biot, J. Appl. Phys., 1941, 12, 155–164 CrossRef.
- M. Seth and K. Gray, Soc. Pet. Eng. J., 1968, 8, 79–86 CrossRef.
- S. C. Cowin, Dynamic Poroelasticity, Springer New York, New York, NY, 2013, pp. 237–262 Search PubMed.
- A. H.-D. Cheng, Poroelasticity, Springer International Publishing, Cham, 2016, vol. 27 Search PubMed.
- M. A. Dawson, G. H. McKinley and L. J. Gibson, J. Appl. Mech., 2008, 75, 041015 CrossRef.
- H.-S. Tsay and F.-H. Yeh, Finite Elements in Analysis and Design, 2006, vol. 42, pp. 314–339 Search PubMed.
- S. S. Deshmukh and G. H. McKinley, Smart Mater. Struct., 2007, 16, 106–113 CrossRef.
- B. Nedjar, J. Mech. Phys. Solids, 2013, 61, 537–556 CrossRef.
- C. Langlois, R. Panneton and N. Atalla, J. Acoust. Soc. Am., 2001, 110, 3032–3040 CrossRef.
- L. C. Auton and C. W. MacMinn, Proc. R. Soc. A, 2017, 473, 20160753 CrossRef CAS PubMed.
- C. Renard, D. Wang, Y. Yang, S. Xiong, C. Shi and Z. Dang, J. Appl. Polym. Sci., 2017, 134, 45123 CrossRef.
- Y. Li, Z. Liu, X. Liu, F. Gao, J. Cheng and J. Zhang, Eur. Polym. J., 2023, 201, 112574 CrossRef CAS.
- T. Sochi, Polym. Rev., 2011, 51, 309–340 CrossRef CAS.
- I. R. Peters, S. Majumdar and H. M. Jaeger, Nature, 2016, 532, 214–217 CrossRef CAS PubMed.
- E. Han, I. R. Peters and H. M. Jaeger, Nat. Commun., 2016, 7, 12243 CrossRef CAS.
Footnotes |
| † Electronic supplementary information (ESI) available. See DOI: https://doi.org/10.1039/d4sm01144a |
| ‡ Foam samples submerged in silicone oil, used for comparison with foam-STF samples, do not undergo conditioning due to the risk of slipping. |
| This journal is © The Royal Society of Chemistry 2025 |