Evaluating the industrial potential of emerging biomass pretreatment technologies in bioethanol production and lipid recovery from transgenic sugarcane†
Received
13th April 2025
, Accepted 9th July 2025
First published on 23rd July 2025
Abstract
The selection of pretreatment methods is critical to achieving high product yields during bioconversion of lignocellulosic biomass. Hydrothermal, soaking-in-aqueous ammonia, and ionic liquid pretreatment methods are viable candidates for minimizing sugar decomposition, permitting the effective hydrolysis of structural carbohydrates, and producing a fermentable substrate suitable for achieving industrial ethanol titers and yields. In this study, the effect of these three pretreatment methods on non-modified sugarcane cultivar CP88-1762 and two transgenic lipid-accumulating sugarcane lines, oilcane 1565 and oilcane 1566, were investigated and compared in terms of lipid recovery, sugar yield, and ethanol yields within the lignocellulosic biomass conversion pipeline. Fed-batch enzymatic hydrolysis at high solid loading yielded hydrolysates capable of supporting industrial bioethanol titers across all conditions. The highest sugar yields were obtained on ammonia-pretreated biomass hydrolysate (253.73 g L−1), followed by hydrothermally pretreated hydrolysate (213.10 g L−1) and ionic liquid-pretreated hydrolysate (154.20 g L−1). Commercially viable ethanol titers of 100.62 g L−1, 64.47 g L−1, and 52.95 g L−1 were achieved from ammonia, hydrothermal, and ionic liquid pretreated hydrolysate with the corresponding ethanol productivities of 2.08 g L−1 h−1, 0.53 g L−1 h−1, and 0.36 g L−1 h−1. The lower acetic acid concentration in ammonia-pretreated hydrolysate may have enhanced its fermentability relative to the hydrothermal pretreatment condition, as indicated by the differences in ethanol titer and productivity. Lower sugar yields and ethanol productivities under the ionic liquid conditions likely resulted from the inhibitory effect of cholinium lysinate. Oilcane 1565 and oilcane 1566 bagasse accumulated over 16- and 3 times higher lipids than the non-modified sugarcane CP88-1762. The total fatty acid content in the oilcane samples was reduced in ammonia and ionic liquid-pretreated bagasse relative to the hydrothermal pretreatment condition. While all pretreatment techniques tested are industrially viable, the observed differences in titer, productivity, and lipid content indicate that careful selection and validation of upstream processing methods can contribute to improved economic and environmental outcomes.
1. Introduction
Renewable fuels from lignocellulosic biomass sources can play a key role in alleviating the negative environmental and climate impacts of crude oil extraction and processing, particularly in the transportation sector.1 Lignocellulose does not compete with food and feed and is suitable for sustainable large-scale production of biofuels and bioproducts, as it is widely available in the form of agricultural crop residues such as wheat straw, rice straw, corn stover, sorghum stalks, sugarcane bagasse, and energy cane bagasse.2,3 The structural carbohydrates, which constitute 50% to 65% of a typical lignocellulosic feedstock, can be converted into monomeric sugars for bioethanol production, although this process has yet to be commercialized in the US.4,5
Thermo-chemical pretreatment is necessary to deconstruct the conglomerate structure of lignocellulosic biomass and permit enzymatic hydrolysis of structural carbohydrates. However, the use of standard chemical pretreatment techniques at high temperatures can decompose these molecules into fermentation inhibitors that interfere with downstream bioethanol production.6 Pretreatment generally occurs between 70 °C and 200 °C, with methods such as dilute-acid-based pretreatment requiring higher temperatures than alkali-based pretreatments.7 Acid pretreatments such as dilute sulfuric acid, hydrochloric acid, and phosphoric acid can corrode reactors, reduce the downstream fermentability of hydrolysates, and necessitate specialized wastewater treatment processes for hazardous effluent streams.7–11 Alkali-based pretreatments, on the other hand, including aqueous ammonia, sodium hydroxide, potassium hydroxide, and lime, can more effectively solubilize the lignin fraction of lignocellulose compared to other methods; however additional pre- and post-washing steps, as well as downstream wastewater treatment steps, are required.8,12 Alkali-based pretreatment can also result in major losses of xylan in the hemicellulose fraction and reduce downstream ethanol yields.13
In contrast to these chemical-based methods, hydrothermal pretreatment does not require the addition of external acid or alkali reagents, reducing the operational costs and safety hazards associated with operating these processes at a commercial scale.14 Hydrothermal pretreatment methods, along with dilute ammonia and ionic liquid (IL) pretreatment methods, are leading candidates for alternative techniques that can minimize fermentation inhibitor formation and reduce costs associated with additional separation or wash steps.15 In hydrothermal pretreatment, hot water or saturated steam is used to deconstruct lignocellulose with negligible sugar decomposition.14 In ammonia pretreatment or in pretreatment with ionic liquids such as cholinium lysinate, the lignin and hemicellulose fractions of lignocellulose are effectively solubilized and enzyme accessibility during downstream hydrolysis is enhanced.2,16 These pretreatment agents may also be recovered prior to enzymatic hydrolysis and reused in subsequent pretreatment, reducing material cost and the amount of waste generated.17,18
Few studies have compared the viability of these pretreatment techniques as part of the lignocellulosic bioethanol production pipeline,15,19–23 and none have been performed using lipid-accumulating transgenic sugarcane lines termed oilcane.24–27 Previous research on oilcane has focused on hydrothermal pretreatment (180 °C to 190 °C for 10 min) followed by high-solid enzymatic hydrolysis (50% w/v solid loading) and fermentation, which showed 55% lipid recovery28 and 59.23 g L−1 bioethanol production;14 however, ammonia and ionic liquid-based pretreatment methods have not been tested on this feedstock. In this study, the effects of hydrothermal, soaking in aqueous ammonia, and ionic liquid pretreatments on bagasse from two transgenic sugarcane lines, oilcane 1565 and oilcane 1566, and their parental genotype sugarcane CP88-1762 (wildtype), were compared in the context of second-generation bioethanol production and lipid recovery.
2. Materials and methods
2.1. Feedstock and compositional analysis
The stems of non-modified sugarcane CP88-1762 (wildtype) and two transgenic sugarcane lines, oilcane 1565 and oilcane 1566,26 were collected from the experimental field of the University of Florida, Plant Science and Education Unit (PSREU, Citra, FL) and squeezed in a laboratory juicer to extract the juice. The long strands of wet bagasse were hammer-milled to reduce the particle size, washed, and dried at 49 °C overnight, followed by an additional hammer-milling step to attain a particle size of 1–2 cm. According to NREL protocols, bagasse samples from sugarcane CP88, oilcane 1565, and oilcane 1566 were prepared for compositional analysis.29,30 Lipid extraction of raw and pretreated bagasse samples was carried out as previously described.31 Bagasse generated from the sugarcane cultivar CP88-1762 was used as a control to determine the disparities in bioprocessing efficiency of oilcane 1565 and oilcane 1566 bagasse samples, in terms of deconstruction of the lignocellulosic matrix in the pretreatment, sugar yield in enzymatic hydrolysis, and ethanol titer, yield, and productivity during fermentation.
2.2. Pretreatment of bagasse samples
Wildtype sugarcane, oilcane 1565, and oilcane 1566 bagasse samples were subjected to three pretreatment methods. Hydrothermal (HT) pretreatment was performed in a fluidized sand bath (IFB-51 Industrial Fluidized Bath, Techne Inc., Burlington, NJ) using a 70 mL stainless steel tubular reactor at 180 °C for 10 min with a solid loading of 10% (w/v). The reactor specifications and experimental setup were as previously described.32 After the pretreatment, the reaction was quenched by immersing the hydrothermal reactors in ambient water. The mixture was poured onto a stainless-steel tray without separating the solids from the liquid and dried at 48 °C overnight. Dried samples were stored at 4 °C until enzymatic hydrolysis was performed. The soaking in aqueous ammonia (SAA) pretreatment method was performed as described in Barten et al., 2025.33 In brief, 15 g of milled wildtype sugarcane, oilcane 1565 or oilcane 1566 bagasse samples were transferred into four glass pressure tubes with 60 mL of 18% diluted ammonium hydroxide added slowly with agitation and sealed tightly. Tubes were mixed by inversion and rotated in an oven set to 75 °C. Tubes were mixed manually after 1.5 h and returned to the oven for an additional 2 h. After incubation, the samples were unscrewed in a fume hood and dried with compressed air for 48 h. After pressurized drying, SAA-pretreated biomass was transferred to weigh boats and dried for an additional 5 days in a fume hood. The four batches of SAA-pretreated bagasse samples were pooled together. Ionic liquid (IL) pretreatment was performed at the Joint Bioenergy Institute (JBEI) in a 10 L Parr reactor with 15% (w/w) biomass loading and 10% (w/w) cholinium lysinate at 140 °C for 3 h. The pH of the pretreated biomass paste was adjusted to 4.8 using 72% (w/w) sulfuric acid, mixed, and measured at multiple locations to ensure uniformity of pH. Without a post-pretreatment wash, samples were dried at 40 °C to reach a moisture content below 5%.
2.3. High solid loading enzymatic hydrolysis
Fed-batch enzymatic hydrolysis of HT, AM, and IL pretreated wildtype sugarcane, oilcane 1565, and oilcane 1566 bagasse was conducted in 250 mL screw cap conical flasks containing 20 g of dry solids per 40 mL of liquid media, accounting for 50% (w/v). Initially, 10% (w/v) of solids and 1.6 mL of 25% PEG 4000 were loaded into the flask. The pH of the hydrolysis medium was adjusted to 4.8 using 5 M NaOH/10 N H2SO4. A single dose of cellulase NS22257 (60 mg of cellulase protein per g of cellulose) and hemicellulase NS22244 (20 mg of hemicellulase protein per g of xylan) was added at 10% solid loading to hydrolyze the glucan and xylan content in 20 g of pretreated biomass. The enzymatic hydrolysis was performed in a shaking incubator with an agitation of 185 rpm at 50 °C. Additional solids were added to increase the loading to 20%, 30%, 40%, and 50% at 12 h intervals. The pH of the hydrolysis medium was monitored after each addition of solids to maintain the pH of 4.8 via addition of 5 M NaOH or 10 N H2SO4 as needed. The enzymatic hydrolysis reactions were run for a total of 72 h.14 Aliquots were collected from the enzymatic slurry before each addition of 10% solids to quantify sugars. The enzymatic hydrolysate samples were taken at 30% (w/v) solid loading from AM, and HT pretreated samples were analyzed via GC/MS for quantification of phenolics, as previously described.14 Because of the high solubility of lignin in cholinium lysinate, hydrolysate samples taken at 10% (w/v) solid loading were used for phenolics analysis of IL pretreated biomass.
The percentages of cellulose and xylan hydrolysis were calculated using the following equation:
| |  | (1) |
where Hyd
eff. refers to the hydrolysis efficiency of cellulose and xylan;
Esug. (g L
−1) represents the sugar concentration in the enzyme blank;
Csug. (g L
−1) denotes cellobiose and glucose or xylose concentrations in the hydrolysis medium;
VL is the liquid volume of the enzymatic hydrolysis medium; CF is the conversion factor (1.10) to account for the relative change in the hydrolysis volume caused by water consumed by hydrolysis of cellulose and xylan, and expansion of the hydrolysis reaction volume by sugar release;
31SC (g/g) is the structural carbohydrate (cellulose or xylan) content in the pretreated biomass, and
SL is the percentage of solid loading during enzymatic hydrolysis.
2.4. Fermentation
2.4.1. Microorganism and seed culture preparation.
A commercial genetically engineered xylose-fermenting Saccharomyces cerevisiae strain was used to consume glucose and xylose in the biomass hydrolysates for bioethanol production,34 hereafter referred to as engineered S. cerevisiae. An actively growing culture from YPDX agar medium (containing 10 g L−1 yeast extract, 20 g L−1 peptone, 12 g L−1 glucose, and 8 g L−1 xylose) was inoculated into 20 mL of YPDX broth and incubated at 30 °C for 18 h at 140 rpm. The pH of the media was adjusted to 5.6 using 5 M NaOH. 0.4 mL of an 18 h grown seed culture was used as the inoculum for 20 mL of fermentation medium to provide an initial OD600 ∼ 0.1 with a cell concentration of 0.68 mg/20 mL.
2.4.2. Hydrolysate fermentation.
The enzymatic slurry was centrifuged at 8600 rpm for 15 min to separate the liquid hydrolysate from the solids and was supplemented with 0.8 mL of 25× YP solution as an additional nitrogen source. The pH of the hydrolysate media was adjusted to 5.8 using 5 M NaOH, and the media was filter-sterilized through a 0.2 μm membrane. Hydrolysate fermentation began by inoculating a seed culture of engineered S. cerevisiae, and the cultures were incubated at 30 °C and 160 rpm. All the fermentation experiments were conducted in 50 mL screw cap conical flasks containing 20 mL of media. Samples were collected periodically to quantify sugar and ethanol concentrations, and the following equation was used to calculate the ethanol yield:| |  | (2) |
2.5. Analytical methods
2.5.1. High-performance liquid chromatography (HPLC).
Quantification of sugars, furans, and ethanol was performed using a Waters HPLC system (Waters e2695 Separation Module, Waters Corporation, Milford, MA, USA) equipped with a 2414 refractive index (RI) detector and an Aminex HPX-87H column (300 × 7.8 mm, 9 μm particle size, Bio-Rad Laboratories, Hercules, CA, USA). The RI detector and column temperatures were maintained at 30 °C and 65 °C, respectively, and 5 mM H2SO4 was used as the eluent with a 0.6 mL min−1 flow rate.
2.5.2. Lipid extraction and quantification.
Lipid analysis was performed before and after the pretreatment of bagasse samples. 1 g (on an oven dry weight (ODW) basis at 105 ± 3 °C) of bagasse sample was mixed with 10 mL of isopropanol and 15 mL of hexane in a 50 mL screw cap centrifuge tube. This mixture was homogenized (LabGen 700, Cole Parmer, Vernon Hills, IL) for 2 min at 5000 rpm. The slurry was then rotated with a wrist action shaker (HB-1000 Hybridizer, UVP LLC, Upland, CA) for 10 min at ambient temperature. 16 mL of sodium sulfate solution (6.7% w/v) was added, and the solution was rotated for an additional 10 min in a hybridizer. This mixture was centrifuged at 200 rpm for 20 min, and the top non-polar organic phase (hexane) was transferred into a pre-weighed centrifuge tube. The organic solvent was evaporated in an oven at 45 °C overnight.35 The dried, extracted lipid samples were reconstituted in 3 mL of a hexane and isopropyl alcohol solution (3![[thin space (1/6-em)]](https://www.rsc.org/images/entities/char_2009.gif) :2, v/v) and analyzed via gas chromatography-mass spectrometry (GC/MS) to quantify triglyceride (TAG), free fatty acid (FFA), and total fatty acid (TFA) content. For TAG and FFA analysis, the lipid fraction was separated by thin-layer chromatography (TLC) on silica gel 60 plates (Merck, USA; Cat. No. 1057210001) using a solvent system composed of hexane, diethyl ether, and acetic acid (70:30:1, v/v/v). The plates were visualized by spraying with 0.05% primuline (in 80% acetone), and TAG and FFA fractions were identified under UV light. These fractions were excised from the plate and transmethylated into fatty acid methyl esters (FAMEs) by incubation in 1 mL of boron trichloride-methanol at 80–85 °C for 60 minutes. Quantification of TAG and FFA was performed using internal standards. Triheptadecanoin was used for TAG samples containing internal standards at the extraction stage, while heptadecanoic acid (C17) was used for TAG and FFA samples without internal standards at the extraction stage. For TFA analysis, an aliquot of the total lipid fraction was transmethylated into FAMEs by incubation in 1 mL of boron trichloride-methanol. Pentadecanoic acid (C15) was used as the internal standard for quantification. The FAMEs were recovered using 2 mL of hexane: water (1:1, v/v) solution, evaporated to complete dryness under a nitrogen stream, and dissolved in 100 μL of hexane for analysis. The analysis was conducted using gas chromatography (Agilent Technologies 7890A) equipped with a DB-23 column (Supelco; 60 m × 0.25 mm) and a 5975C mass-selective detector.
:2, v/v) and analyzed via gas chromatography-mass spectrometry (GC/MS) to quantify triglyceride (TAG), free fatty acid (FFA), and total fatty acid (TFA) content. For TAG and FFA analysis, the lipid fraction was separated by thin-layer chromatography (TLC) on silica gel 60 plates (Merck, USA; Cat. No. 1057210001) using a solvent system composed of hexane, diethyl ether, and acetic acid (70:30:1, v/v/v). The plates were visualized by spraying with 0.05% primuline (in 80% acetone), and TAG and FFA fractions were identified under UV light. These fractions were excised from the plate and transmethylated into fatty acid methyl esters (FAMEs) by incubation in 1 mL of boron trichloride-methanol at 80–85 °C for 60 minutes. Quantification of TAG and FFA was performed using internal standards. Triheptadecanoin was used for TAG samples containing internal standards at the extraction stage, while heptadecanoic acid (C17) was used for TAG and FFA samples without internal standards at the extraction stage. For TFA analysis, an aliquot of the total lipid fraction was transmethylated into FAMEs by incubation in 1 mL of boron trichloride-methanol. Pentadecanoic acid (C15) was used as the internal standard for quantification. The FAMEs were recovered using 2 mL of hexane: water (1:1, v/v) solution, evaporated to complete dryness under a nitrogen stream, and dissolved in 100 μL of hexane for analysis. The analysis was conducted using gas chromatography (Agilent Technologies 7890A) equipped with a DB-23 column (Supelco; 60 m × 0.25 mm) and a 5975C mass-selective detector.
2.5.3. Statistical analysis.
Analysis of structural carbohydrates, lignin, and lipids was conducted in triplicate before and after the pretreatment of bagasse samples. Enzymatic hydrolysis and fermentation experiments were performed in duplicate. Mean and standard deviations were reported. The effect of a particular pretreatment technique on structural carbohydrates and lignin between feedstocks (wildtype sugarcane, oilcane 1565, and oilcane 1566) and sugar yields in enzymatic hydrolysis was statistically analyzed via one-way ANOVA using Origin Pro Software (OriginPro, Version 2023. OriginLab Corporation, Northampton, MA, USA).
3. Results and discussion
3.1. Transgenic sugarcane (oilcane) bagasse contains higher levels of fatty acids
Compositional analyses of wild-type sugarcane, oilcane 1565, and oilcane 1566 bagasse are presented in Table 1. The transgenic sugarcane bagasse (oilcane 1565 and oilcane 1566) was observed to have higher extractive and lower cellulose content than the wild-type sugarcane bagasse as a result of their additional lipid accumulation. However, no significant (p < 0.05) difference in xylan and acid-insoluble lignin contents was observed between the selected feedstocks. Through lipid analysis, the highest TFA titers were observed in oilcane 1565, over 16 times higher than that in the wild-type sugarcane, while the titer in oilcane 1566 was 3 times higher (Fig. 1).
Table 1 Compositional analysis of raw sugarcane (CP88 wild type) and transgenic sugarcane (oilcane 1566 and oilcane 1565) bagasse samplesa
| Composition (%) |
CP88 wild type |
Oilcane 1566 |
Oilcane 1565 |
|
Average ± standard deviation (n = 3).
|
| Extractive |
16.56 |
20.38 |
21.99 |
| Water |
15.57 |
17.88 |
18.71 |
| Ethanol |
0.98 |
2.5 |
3.28 |
| Cellulose |
37.88 ± 0.21 |
32.86 ± 0.33 |
31.90 ± 0.21 |
| Hemicellulose |
25.13 ± 0.97 |
25.66 ± 1.01 |
23.49 ± 1.01 |
| Xylan |
18.96 ± 0.91 |
19.15 ± 0.93 |
17.44 ± 0.89 |
| Arabinose |
1.57 ± 0.07 |
1.72 ± 0.07 |
1.53 ± 0.18 |
| Acetic acid |
4.59 ± 0.11 |
4.8 ± 0.01 |
4.51 ± 0.11 |
| Acid insoluble lignin |
14.88 ± 0.43 |
14.61 ± 0.21 |
14.88 ± 0.58 |
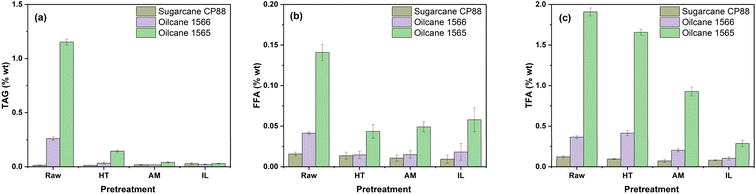 |
| | Fig. 1 Levels of (a) triacylglycerol (TAG), (b) free fatty acids (FFA), and (c) total fatty acids (TFA) in sugarcane and oilcane bagasse after hydrothermal (HT), ammonia (AM), and ionic liquid (IL) pretreatment. Values are reported as average ± standard deviation (n = 3). GC-MS analysis of lipids, extracted through hexane and IPA methods, described in section 2.5.2. | |
The lipid profiles of selected feedstocks are shown in Fig. 1. The highest TAG (1.153 ± 0.027%), FFA (0.14 ± 0.01%), and TFA (1.98 ± 0.04%) contents were observed in oilcane 1565. This TFA content would yield 0.594 tons per ha, assuming a biomass recovery of 200 MT stems per ha and generating 30 MT of bagasse per ha after processing.32,36 This represents a 2-fold increase in TFA in oilcane 1565 compared to previous studies.28 The production cost of biodiesel from transgenic sugarcane containing 2% lipid has been calculated as $0.89 L−1, which is lower than the cost of biodiesel production from soybeans ($1.08 L−1).36 First-generation bioethanol production cost from 2% oilcane can reduce production costs to $0.46 L−1.36 As such, second-generation bioethanol production from oilcane 1565 may lead to a further reduction in the minimum selling price of biofuels and an advancement towards the successful commercialization of lignocellulosic biorefineries.
3.2. Effect of different pretreatment techniques on bagasse composition
Compositional analysis of pretreated bagasse indicated that cellulose and xylan contents were enriched after HT, AM, and IL pretreatment regardless of the feedstock variety (Tables 2–4). No significant increase in acid-insoluble lignin (AIL) was observed in wildtype sugarcane and oilcane 1566 after HT pretreatment, while the AIL content of oilcane 1565 was increased to 18.08% as compared to 14.61% in raw biomass (Tables 1 and 2). Evaporation of volatiles after pretreatment and drying causes mass loss and may lead to the enrichment of structural carbohydrates and AIL in the HT pretreated biomass.14 A reduction in the acetic acid component of hemicellulose was observed after IL pretreatment (Table 4), and no acetic acid remained after AM pretreatment (Table 3). Ammonia reacts with the acetate in hemicellulose to form ammonium acetate, which is highly volatile and evaporates during the drying process.37 It was observed that AM and IL pretreatment greatly improved lignin solubility, decreasing the acid-insoluble lignin (AIL) fraction in AM pretreated biomass (35% to 50.47%) and IL pretreated (23.8% to 39.44%) biomass (Tables 3 and 4). During the compositional analysis of pretreated biomass samples, the acid-soluble fraction (ASL) was observed to have the greatest color intensity (darker) in IL pretreated biomass, followed by AM pretreated and then HT pretreated biomass. Thus, the acid-soluble lignin of these samples was not reported due to interference in the required UV-vis spectroscopy measurements.14 Among all three pretreatment techniques, AM pretreatment most effectively solubilized the lignin fraction and enriched the cellulose and xylan content of the bagasse samples.
Table 2 Compositional analysis of hydrothermally pretreated bagasse samplesa
| Composition (%) |
CP88 wild type |
Oilcane 1565 |
Oilcane 1566 |
|
Average ± standard deviation (n = 3).
|
| Cellulose |
43.59 ± 0.32 |
41.16 ± 1.11 |
42.39 ± 0.83 |
| Hemicellulose |
30.31 ± 0.76 |
30.38 ± 0.10 |
32.06 ± 0.78 |
| Xylan |
22.65 ± 0.31 |
21.54 ± 0.35 |
24.09 ± 0.64 |
| Arabinose |
1.59 ± 0.34 |
2.36 ± 0.50 |
0.79 ± 0.33 |
| Acetic acid |
6.06 ± 0.16 |
6.47 ± 0.27 |
7.18 ± 0.39 |
| Acid insoluble lignin |
14.9 ± 0.19 |
18.08 ± 0.76 |
15.33 ± 0.91 |
Table 3 Compositional analysis of ammonia pretreated bagasse samplesa,b
| Composition (%) |
CP88 wild type |
Oilcane 1565 |
Oilcane 1566 |
|
NF, not found.
Average ± standard deviation (n = 3).
|
| Cellulose |
41.60 ± 0.46 |
38.58 ± 0.73 |
38.99 ± 0.77 |
| Hemicellulose |
24.06 ± 0.17 |
22.97 ± 0.67 |
23.29 ± 0.30 |
| Xylan |
24.06 ± 0.17 |
22.97 ± 0.67 |
23.29 ± 0.30 |
| Arabinose |
NF |
NF |
NF |
| Acetic acid |
NF |
NF |
NF |
| Acid insoluble lignin |
7.37 ± 0.37 |
9.36 ± 0.40 |
7.69 ± 0.71 |
Table 4 Compositional analysis of ionic liquid pretreated bagasse samplesa
| Composition (%) |
CP88 wild type |
Oilcane 1565 |
Oilcane 1566 |
|
Average ± standard deviation (n = 3).
|
| Cellulose |
37.44 ± 0.28 |
33.44 ± 0.92 |
34.56 ± 1.07 |
| Hemicellulose |
24.21 ± 0.2.71 |
26.56 ± 0.73 |
26.45 ± 2.06 |
| Xylan |
22.80 ± 0.28 |
20.96 ± 0.0.29 |
21.47 ± 2.36 |
| Arabinose |
4.75 ± 0.74 |
3.97 ± 0.15 |
4.44 ± 0.19 |
| Acetic acid |
3.4 ± 0.0.74 |
2.82 ± 0.59 |
2.81 ± 0.11 |
| Acid insoluble lignin |
9.01 ± 0.14 |
10.24 ± 0.06 |
11.33 ± 0.012 |
A reduction in measured lipid contents was observed in the pretreated biomass across all methods and feedstocks. Reduction in measured TAGs was more significant than that of TFA or FFA, with the TAG content of oilcane 1565 being reduced from 1.153 ± 0.027% to 0.144 ± 0.007%, 0.041 ± 0.005%, and 0.029 ± 0.003% following HT, AM, and IL pretreatments, respectively (Fig. 1). A slight decrease in TFA was observed from 1.98 ± 0.04% to 1.65 ± 0.03% after HT pretreatment of oilcane 1565, while a more significant reduction was observed with the AM (0.92 ± 0.05%) and IL (0.28 ± 0.04%) pretreated oilcane 1565, of 53.13% and 85.45% respectively. Hydrolysis of TAGs can occur at high temperatures, such as those found during biomass pretreatment, and is facilitated by the release of organic acids from the breakdown of lignocellulose.38 In the case of HT pretreatment, glycerol and fatty acids are formed by the breakdown of ester bonds in the TAG, known as a hydrolysis reaction. The released fatty acids bind with salts and amino acids in the lignocellulosic biomass to form fatty acid salts and fatty acid amines.39 These salts will preferentially dissolve in the aqueous layer during the lipid extraction process, reducing the measured lipid content of the biomass after pretreatment. The reduction in lipids seen in the AM (soaking in aqueous ammonia) and IL (cholinium lysinate) pretreatment conditions was likely the result of saponification of lipids under alkaline conditions, where free hydroxides disrupt the ester bonds between glycerol and fatty acids to form glycerol and free fatty acid salts. These salts are formed due to the substitution of a hydrogen atom in the carboxylic group of the fatty acid with an ammonium ion and are water-soluble.40 Similar to the aqueous ammonia pretreatment method, aqueous cholinium lysinate pretreatment occurs at an alkaline pH.41 As a result, the hydroxyl group of cholinium lysinate is able to break down the ester bonds between glycerol and fatty acids. Fatty acid amine conjugates are then able to form through the condensation reaction between the fatty acid carboxyl groups and the amine groups of cholinium lysinate.42,43 These condensates are soluble in the aqueous phase of lipid extraction and will be partitioned accordingly. During the pretreatment, TAGs are preferentially partitioned into glycerol, fatty acid salts, and fatty acid amine conjugates, which are soluble in the aqueous layer during lipid extraction, thus reducing the measured lipid content of pretreated biomass. However, the actual mechanism of lipid reduction still needs further investigation. Of all the tested methods, however, HT pretreatment had the least impact on the measured lipid fraction of pretreated biomass.
3.3. Effect of pretreatment on high solid loading enzymatic hydrolysis
The results of enzymatic hydrolysis under high solid loading of pretreated biomass across all conditions and feedstocks are shown in Fig. 2. Following hydrolysis at 50% (w/v) solid loading, AM pretreated biomass yielded between 222.8 g L−1 and 253.73 g L−1 of sugars, compared to HT pretreated biomass, which yielded between 205.72 g L−1 and 213.1 g L−1 of sugars. AM pretreatment may increase sugar yields due to the increased porosity of the biomass substrate following the solubilization of lignin, allowing more access to enzymes during hydrolysis.2 From one-way ANOVA, no significant differences in sugar yields (p < 0.05) were observed across feedstocks for HT pretreated bagasse samples, with 205.72 ± 1.49 g L−1, 210.30 ± 4.19 g L−1, and 213.1 ± 7.12 g L−1 of sugars obtained at 50% solid loading of wildtype sugarcane, oilcane 1565, and oilcane 1566 bagasse, respectively.
 |
| | Fig. 2 Effect of fed-batch high solid loading enzymatic hydrolysis on sugar yields of soaking in aqueous ammonia pretreated [(a) sugarcane CP88, (b) oilcane 1565, and (c) oilcane 1566], hydrothermally pretreated [(d) sugarcane CP88, (e) oilcane 1565 and (f) oilcane 1566] and ionic liquid pretreated [(g) sugarcane CP88, (h) oilcane 1565 and (i) oilcane 1566] biomass samples. Values are reported as average ± standard deviation (n = 2). | |
The lowest sugar yields (115 g L−1 to 154 g L−1) were observed following enzymatic hydrolysis of IL pretreated biomass at 50% (w/v) solid loading. The presence of ionic liquids in the enzymatic hydrolysis medium inhibits the catalytic activity and stability of the enzymes over time, including denaturation at high concentrations.44–46 Sugar concentrations were more similar between the pretreatment conditions at lower solid loadings, with IL pretreated biomass yielding 68 g L−1 to 76 g L−1 of sugar at 10% solid loading, compared to 79.61 g L−1 to 82.3 g L−1 for AM pretreatment and 61.78 g L−1 to 66.4 g L−1 for HT pretreatment (Fig. 2). Following the addition of each increment of 10% (w/v) solids, hydrolysis of HT and AM pretreated biomass yielded an additional 40 g L−1 to 70 g L−1 of sugars. However, during the hydrolysis of IL pretreated biomass, as solid loading was increased from 10% to 50% (w/v), only an additional 10 g L−1 to 15 g L−1 of sugars were obtained from the addition of each increment of 10% (w/v) solids. To account for sugars released by the IL pretreatment alone, a portion of IL pretreated biomass at 10% (w/v) solid loading was agitated at 50 °C without enzymes for 12 h, which yielded 5 g L−1 of sugars (3 g L−1 glucose and 2 g L−1 xylose). Excluding this amount, only 5 g L−1 to 10 g L−1 of additional sugars were obtained from each addition of solids. This is likely the result of enzyme inactivation caused by the increase in the IL concentration at higher solid loadings, since the IL was not removed prior to enzymatic hydrolysis, combined with a prolonged exposure to the IL. It has been reported that enzyme inactivation is predominantly caused by anions with high H-bond basicity, as nucleophilic anions can coordinate with the positively charged surface residue and cause conformational changes in enzymes, leading to denaturation.44 Instead of a single enzyme dose, adding enzymes along with fed-batch solid loading or lowering the IL concentration in the pretreated biomass may improve the sugar yield. Acetic acid concentrations, which are a proxy for the extent of hydrolysis of the acetylated xylan backbone of amorphous hemicellulose, increased from 2.69 ± 0.03 g L−1 to 11.03 ± 0.04 g L−1 as the solid loading was increased from 10% to 50% (w/v) in fed-batch enzymatic hydrolysis of HT pretreated biomass. In IL pretreated biomass, the corresponding change was from 1.16 ± 0.08 g L−1 to 3.11 ± 0.05 g L−1 between 10% (w/v) and 50% (w/v) solid loading. This difference reflects the inactivation of the enzymes by the ionic liquid. Even lower concentrations of acetic acid (0.31 ± 0.01 to 0.89 ± 0.01 g L−1) were observed in AM pretreated biomass, which may indicate mass loss during the drying and ammonia recovery processes.
The highest cellulose conversion efficiency was observed in the AM and IL pretreated biomass at 10% (w/v) solid loading: 94.73 ± 6.01% to 98.86 ± 0.58% for IL pretreated and 92.31 ± 0.59% to 99.63 ± 0.019% for AM pretreated biomass. The extent of cellulose hydrolysis was gradually reduced as the solid loading was increased (Fig. S1†). For example, 98.32 ± 1.99% cellulose hydrolysis was observed at 10% (w/v) solid loading of AM pretreated oilcane 1565, while 66.64 ± 5.64% was observed at 50% (w/v) solid loading. Similarly, for the IL pretreated oilcane 1565, cellulose hydrolysis was reduced from 98.65 ± 0.58% to 41.79 ± 0.25% as the solid loading was increased from 10% (w/v) to 50% (w/v). The lowest cellulose conversion efficiencies were observed for HT pretreated sugarcane CP88 (46.54 ± 0.26%), oilcane 1565 (51.67 ± 0.96%), and oilcane 1566 (51.13 ± 0.53%) at 10% (w/v) solid loading. In contrast to the AM and IL pretreated biomass, cellulose hydrolysis did not continuously increase during enzymatic hydrolysis of HT pretreated biomass but decreased after a certain point. For example, cellulose hydrolysis was increased to 59.04 ± 0.80% at 20% (w/v) solid loading of HT pretreated oilcane 1565 and was gradually reduced to 54.43 ± 0.49%, 54.68 ± 0.66, and 46.96 ± 0.98% at 30% 40% and 50% solid loadings, respectively. Ultimately, cellulose and xylan hydrolysis efficiencies at 50% solid loading were lower than at 10% solid loading. The observed trend may be due to the effects of pretreatment on cellulosic crystallinity. AM and IL pretreatment methods can effectively solubilize lignin and reduce the crystallinity of cellulose by breaking intermolecular hydrogen bonds between cellulose chains within the microfibril structure.2 Hydrothermal pretreatment, on the other hand, solubilizes a smaller fraction of lignin than the other methods, restricting the enzyme accessibility of cellulose by leaving it in crystalline form.47 The hydrolysis of crystalline cellulose proceeds more slowly than that of amorphous cellulose, requiring stepwise adsorption to break down the crystalline network of cellulose to expose the individual cellulose chains. Fragmentation of these chains yields oligomers, which are hydrolyzed into cellobiose and finally glucose.48
Overall, the fraction of cellulose embedded within the lignin matrix restricts cellulase accessibility in HT pretreated biomass, reducing overall cellulose hydrolysis across all solid loadings compared to AM pretreatment. IL pretreatment, on the other hand, achieves a lower fraction of cellulose hydrolysis than expected due to enzyme inactivation. Across all pretreatment methods, the highest fraction of xylan hydrolysis was observed in the HT pretreated biomass for all solid loadings, while the lowest was observed in IL pretreated biomass (Fig. S1†). Xylan hydrolysis was higher in HT pretreated biomass across nearly all solid loadings and feedstock varieties (Fig. S1†). Overall, cellulose hydrolysis and xylan hydrolysis were reduced by increasing the solid loading due to mass transfer limitations and the competitive inhibition of enzymes by phenolic lignin derivatives.6,49,50
3.4. Effect of pretreatment on the fermentability of bagasse hydrolysates
Industrial ethanol titers (>40 g L−1) were achieved during fermentation of all hydrolysates, regardless of feedstock variety and pretreatment methods used. The highest titers were observed during the fermentation of hydrolysates derived from AM pretreated biomass, followed by hydrolysates of HT and then IL pretreated biomass (Fig. 3). Ethanol titers of 94.74 ± 0.10 g L−1 to 100.62 ± 0.52 g L−1 were observed after 72 h of fermentation on AM pretreated hydrolysates, with 95.36 ± 1.93 g L−1, 92.09 ± 0.26 g L−1 and 100.13 ± 0.50 g L−1 observed after 48 h of fermentation from hydrolysates of oilcane 1566, sugarcane CP88 and oilcane 1565, respectively (Fig. 3a). The additional fermentation time was insignificant, given the slight difference between 48 h and 72 h. Overall, ethanol productivities were calculated to be 1.91 ± 0.01 g L−1 h−1 to 2.08 ± 0.01 g L−1 h−1. The higher ethanol yield, titer, and productivity on AM pretreated biomass may be explained by the lower concentrations of inhibitors such as acetic acid (0.63 ± 0.02 g L−1 to 1.01 ± 0.07 g L−1) and furfural (0.13 ± 0.01 g L−1 to 0.15 ± 0.08 g L−1), and absence of 5-HMF, formic acid, and levulinic acid in these hydrolysates. These values exceed the theoretical ethanol yields on the three feedstock varieties (0.54 ± 0.002 gp/gs for oilcane 1565, 0.51 ± 0.003 gp/gs for oilcane 1566, and 0.51 ± 0.003 gp/gs for wildtype sugarcane) as a result of continued action of enzyme activity and hydrolysis of cello and xylo-oligomers during hydrolysate fermentation, as hydrolysate was not heat sterilized to prevent xylose decomposition, which has been observed in previous studies.14 Cellobiose hydrolysis during the fermentation is a proxy for the continued action of enzymes (Fig. S2†). However, quantifying the cello- and xylo-oligomers is impractical as they are rapidly hydrolyzed in a sequential process following the initial fragmentation of the cellulose chains.32,48 A conversion factor of 1.05 accounted for cellobiose hydrolysis to glucose. As hydrolysis activity is product-inhibited at high sugar concentrations, overall cellulose and xylan hydrolysis is reduced at higher solid loadings (Fig. S1†); however, during fermentation, the consumption of sugars relieves this inhibition and permits additional hydrolysis of cello- and xylo-oligomers.50 For example, the cellobiose concentration decreased from 21.37 ± 0.31 g L−1 to 2.39 ± 0.31 g L−1 in oilcane 1566 at 50% (w/v) solid loading over the course of fermentation, while the yeast strain used in this study is not capable of directly fermenting cellobiose. Previous studies have implemented a simultaneous saccharification and fermentation protocol to avoid this inhibitory effect, where yeast was inoculated at a glucose concentration of 76.7 g L−1 and 77.3 g L−1 to avoid glucose inhibition on the Accellerase 1000 enzyme, which produced 51 and 43.9 g L−1 ethanol titers.50 The theoretical ethanol yield is calculated based on the amount of product produced (gp) and the amount of sugar consumed (gs) by microbes, excluding the residual sugars. Product inhibition was observed between 94.74 ± 0.10 g L−1 and 100.62 ± 0.52 g L−1 of ethanol, with 26 to 54 g L−1 xylose remaining in the fermentation medium. Based on the highest ethanol titers attained from AM pretreated hydrolysates, sugar concentrations can be adjusted to 190 to 200 g L−1 by diluting the hydrolysates before fermentation in future experiments, which will allow for complete consumption of sugars and a greater ethanol yield per ton of biomass.14 Ethanol titers of 37.9 g L−1 to 46.1 g L−1 were obtained from ammonia-based pretreatment technologies, with a minimum ethanol selling price (MESP) between $1.15 and $1.49 gal−1.51 Production of 92 to 100 g L−1 ethanol titer within 48 h through soaking in an aqueous ammonia process would significantly reduce the 2 G ethanol production cost. Additionally, extracting the lipids from oilcane before SAA pretreatment would make the process more economical.
 |
| | Fig. 3 Sugar consumption and ethanol production profiles during fermentation of soaking in aqueous ammonia pretreated [(a) sugarcane CP88, (b) oilcane 1565, and (c) oilcane 1566], hydrothermally pretreated [(d) sugarcane CP88, (e) oilcane 1565 and (f) oilcane 1566] and ionic liquid pretreated [(g) sugarcane CP88, (h) oilcane 1565 and (i) oilcane 1566] biomass samples. Values are reported as average ± standard deviation (n = 2). | |
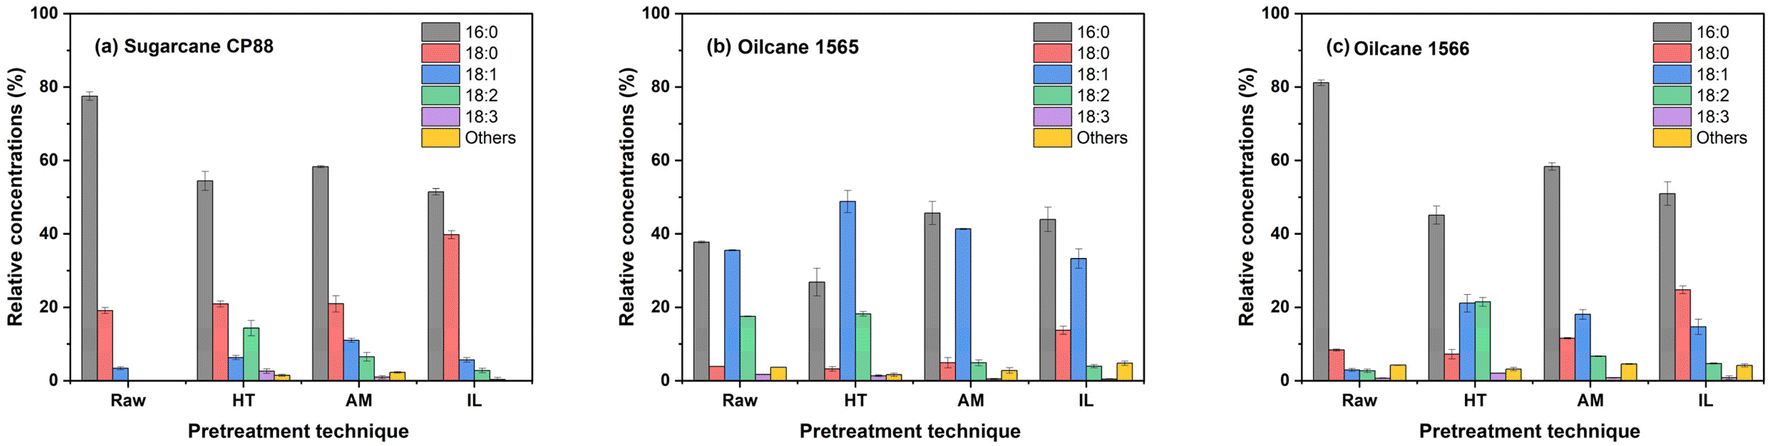
Fermentation of HT pretreated hydrolysates produced ethanol titers of 58.8 g L−1 to 64.4 g L−1 with a yield of 0.39 to 0.42 gp/gs. Higher concentrations of acetic acid (9.89 ± 0.14 g L−1 to 10.91 ± 0.09 g L−1) may have reduced the fermentability of this hydrolysate, resulting in these lower yields and productivities.14 The presence of formic acid (0.39 ± 0.02 to 0.67 ± 0.01 g L−1) and furfural (0.07 ± 0.01 to 0.19 ± 0.01 g L−1) may have also inhibited fermentation in combination with the high acetic acid concentration. During fermentation of HT pretreated hydrolysates of sugarcane CP88, oilcane 1566, and oilcane 1565, titers of 8 g L−1 to 10 g L−1 of ethanol were reached after 24 h, 36 h and 48 h, respectively (Fig. 3b). Higher concentrations of mono- and di-unsaturated fatty acids in oilcane 1565 (48.82 ± 3.02% and 18.19 ± 0.64%, respectively) and 1566 (21.10 ± 2.39% and 21.44 ± 1.18%, respectively) may have further reduced the fermentability of these hydrolysates (Fig. 4). However, the ethanol titers reached by 60 h of fermentation (50.38 g L−1 for oilcane 1565 and 51.84 g L−1 for oilcane 1566) were still above the threshold for industrial bioethanol production. Production of 8.44% and 7.20% (v/v) ethanol titer through hydrothermal pretreatment (190 °C) based lignocellulosic biomass conversion processes results in a MESP between $1.78 L−1 and $1.90 L−1.52 Similar ethanol titers of 58.8 g L−1 (7.45% v/v) to 64.4 g L−1 (8.16% v/v) were attained from this study, while accounting for lipid production will further reduce the cost of the overall conversion process. The engineered S. cerevisiae produces ethanol titers of 40.86 g L−1 to 52.95 g L−1 from the IL pretreated enzymatic hydrolysate. Furfural and 5-HMF were not observed in the fermentation medium, and acetic acid concentration (3.5 g L−1) was below the inhibitory limits of yeast.53,54 However, a long lag phase was observed during the fermentation, reducing the ethanol productivity. This may have been due to the presence of the ionic liquid and phenolic lignin derivatives such as syringaresinol, propanoic acid, 1,2-benzenediol, 2-(4-hydroxyphenyl)-2-oxoacetic acid, 3-vanilpropanol, 4-(1-methylbutyl) phenol, 4-ethyl-2,6-dimethoxyphenol, p-hydroxyacetophenone, sinapyl alcohol and vanillin,14 which were not found in the hydrolysates of AM and HT pretreated biomass (Fig. 5, and Table S1†). The alkaline conditions produced by cholinium lysinate may have altered the lignin solubility and increased the concentrations of phenolic compounds in the resulting hydrolysate relative to the other pretreatment conditions. Individual phenolic compounds become inhibitory at concentrations ranging from 0.5 to 1.5 g L−1 for vanillin and hydroxybenzoic acid, 1.5 g L−1 for ferulic acid, syringaldehyde, and coumaric acid, although fewer studies have explored combinatorial inhibitory effects of these compounds in S. cerevisiae.55–57 Ionic liquids impede yeast fermentation by disrupting the cell wall and damaging the cellular organelles. Additionally, the permeability of IL into the cell can facilitate the blocking of essential metabolic pathways in yeast.58 Although cholinium-based ionic liquids are biocompatible,59 the yeast required a long lag phase to acclimate to cholinium lysinate and phenolic derivatives. In addition, even lower concentrations of acetic acid inhibited the growth of yeast in the presence of IL and phenolic compounds. Among all IL-pretreated hydrolysates, CP88 (3.02 ± 0.07 g L−1) had the highest acetic acid concentration, followed by oilcane 1566 (1.16 ± 0.04 g L−1) and oilcane 1565 (0.36 ± 0.01 g L−1), therefore, yeast started to produce ethanol at 48 h, 66 h, and 72 h from oilcane 1565, oilcane 1566, and CP88 hydrolysates, respectively. Also, 2-(4-hydroxyphenyl)-2-oxoacetic acid and p-hydroxybenzaldehyde concentrations were approximately doubled in CP88 relative to oilcane 1566 and oilcane 1565. The acetic acid concentration in IL-hydrolysates was a critical factor in the prolonged lag phase of the yeast, as the IL (10 wt%) load was the same for all the feedstock pretreatments. Despite higher concentrations of acetic acid, the fermentability of HT pretreated hydrolysates was higher than that of IL-hydrolysates, indicating that the presence of IL, even with lower concentrations of acetic acid, is inhibitory to fermenting yeast. Despite the lower ethanol titers and productivities, ethanol yields (0.46 ± 0.001 to 0.48 ± 0.002 gp/gs) were higher than those observed on HT pretreated hydrolysates. Previous studies have demonstrated that recovery of IL before enzymatic hydrolysis using water/ethanol solutions can also lead to solubilization and loss of up to 46.7% of biomass material in the IL recovery stream.2 However, in this study, industrial bioethanol titers were achieved from IL pretreated biomass without such a step and were higher than those reported in other one-pot pretreatment and fermentation processes involving cholinium lysinate treatment of poplar and switchgrass.60 Membrane-based pervaporation technologies have been demonstrated as an effective way to recover and recycle the ionic liquid (>99.9 wt%) after ethanol distillation,61 which minimizes the environmental burden during wastewater treatment. Scale-up demonstration of one pot processing of corn stover using cholinium lysinate as a pretreatment agent achieved a maximum of 27.7 g L−1 ethanol titer with an MESP of $8.8/gge (gasoline gallon equivalent) and reducing the enzyme load can reduce the MESP to $3/gge.62 Attaining 41.1 g L−1 ethanol through a one-pot process has further reduced the MESP to $2.8 gal−1.18 These one-pot processes include pervaporation unit operation downstream of IL recovery after ethanol distillation. Recovery of lipids before the IL pretreatment, and the 52.9 g L−1 ethanol titer obtained in this work, could potentially reduce the overall cost of ethanol compared to previously reported IL-based processes.
 |
| | Fig. 4 Total fatty acid composition of raw bagasse (Raw), hydrothermal (HT), ammonia (AM), and ionic liquid (IL) pretreated biomass samples. Feedstocks: (a) sugarcane CP88, (b) oilcane 1565, and (c) oilcane 1566. Values are reported as average ± standard deviation (n = 3). | |
 |
| | Fig. 5 Relative concentrations of lignin-derived phenolic compounds in hydrothermal (a–c), ammonia (d–f), and ionic liquid (g–i) pretreated enzymatic hydrolysates. | |
3.5. Mass balance
A mass balance was determined per kg of pretreated biomass based on the enzymatic hydrolysis efficiencies of cellulose and xylan at 50% (w/v) solid loading and ethanol yields (gp/gs) attained from the hydrolysate fermentation. For example, hydrolysis of 70.67% cellulose and 62.04% xylan from AM pretreated oilcane 1566 resulted in 275.5 g of glucose and 145.6 g of xylose per kg of pretreated biomass. 80% of hydrolysate was recovered by centrifuging the enzymatic slurry, containing 220.43 g of glucose and 115.5 g of xylose. Accounting for 0.51 gp/gs ethanol yield and excluding the 50.41 g of residual xylose in the fermentation, 144.09 g or 184.6 mL of ethanol was produced per kg of AM pretreated oilcane 1566. Correspondingly, 182.6 mL and 180.1 mL of ethanol were obtained from AM pretreated CP88 and oilcane 1565, respectively (Fig. S3a and S4a†). In general, separate hydrolysis and fermentation resulted in lower ethanol yields per kg of biomass. While separating these processes allowed for a more thorough evaluation of the effect of different pretreatments on hydrolysis efficiency and the fermentability of hydrolysates, using a semi-integrated process incorporating enzymatic hydrolysis and fermentation in a single step will result in improved bioethanol yields.14 Similarly, ethanol yields were calculated for HT and IL pretreated biomass (Fig. 6b, c, S3b, S3c, S4b and S4c†). With 44.78% cellulose and 67.48% xylan hydrolysis, 70% hydrolysate recovery, and 0.39 gp/gs ethanol yield, 110.4 mL of ethanol was produced per kg of HT pretreated oilcane 1566 (Fig. 6b). IL pretreated oilcane 1566 produced 115.8 mL of ethanol per kg, with 49.94% cellulose and 40.61% xylan hydrolysis, 88% hydrolysate recovery, and 0.47 gp/gs ethanol yield (Fig. 6c). Despite lower cellulose and xylan hydrolysis efficiencies in the IL-pretreated biomass, similar ethanol yields to HT-pretreated biomass were obtained due to higher hydrolysate recovery (Fig. S3b, S3c, S4b and S4c†). However, HT pretreatment permits greater lipid recovery compared to IL and AM pretreatments, where losses occur due to saponification. Ultimately, the highest ethanol titers (g L−1), productivities (g L−1), and yields (gp/gs and per kg) were achieved from AM pretreated biomass.
 |
| | Fig. 6 Mass balance for bioethanol yields from (a) ammonia, (b) hydrothermal, and (c) ionic liquid pretreated oilcane 1566 biomass. | |
4. Conclusion
Hydrothermal and soaking in aqueous ammonia pretreatments of sugarcane and oilcane biomass yielded high sugar concentrations during fed-batch enzymatic hydrolysis at high solid loadings. Lower sugar yields were obtained from ionic liquid pretreated biomass due to anions of cholinium lysinate coordinating with the positively charged surface residues of enzymes and causing conformational changes, leading to denaturation. This may be overcome by replenishing the enzyme cocktail during hydrolysis as additional solids are added and reducing the IL concentration in the pretreated biomass. Despite reducing the TFA content, SAA and ionic liquid pretreatment methods were capable of producing hydrolysates that supported the fermentation of industrial bioethanol titers from lignocellulosic biomass with comparable or higher yields than hydrothermally pretreated hydrolysates. Recovery of lipids before ammonia and ionic liquid pretreatments improves the process economics. In particular, the lower concentrations of fermentative inhibitors in ammonia-pretreated hydrolysates supported the production of 100 g L−1 of ethanol within 48 h of fermentation. Ethanol titers of 52.94 g L−1 were achieved without separation and recovery of cholinium lysinate from the fermentation media, allowing for cost savings by reducing the number of unit operations and preventing the loss of structural carbohydrates post-pretreatment wash, although additional study is needed to evaluate the long-term effects of ionic liquid accumulation over multiple batches on fermentation stability, as well as combinatorial inhibitory effects of ionic liquid in the presence of lignin and acetic acid. The highest ethanol titers were achieved at 72 h, 120 h, and 144 h on ammonia-pretreated, hydrothermally pretreated, and ionic liquid-pretreated hydrolysates, respectively. Ethanol productivities were lower in the hydrothermally pretreated and IL pretreated hydrolysates due to the higher acetic acid, ionic liquid, and lignin-derived phenolic concentrations. This study is the first to report ethanol titers greater than 100 g L−1 with high yield and productivity from lignocellulosic biomass.
Data availability
The data generated for this article are provided in the manuscript and ESI.† Raw data for figures and tables will be available at CABBI at https://cabbi.bio/datasets/.
Author contributions
Narendra Naik Deshavath: conceptualization, methodology, investigation, data curation, and writing – original draft. Mounika Durga Nenavath: investigation. William Woodruff: writing – review & editing of the original draft. Baskaran Kannan & Fredy Altpeter: production and evaluation of wildtype sugarcane and oilcane feedstocks under USDA-APHIS permit, data validation. Hui Liu & John Shanklin: lipid analysis, data interpretation and validation. Venkataramana R. Pidatala & Paul Wolski: ionic liquid pretreatment. Dan Xie, Kallysa Taylor, and Yaoping Zhang: ammonia pretreatment. Trey K. Sato, Alberto Rodriguez & Vijay Singh: funding acquisition, data validation, supervision, writing – review & editing.
Conflicts of interest
The authors declare that they have no competing financial or personal interests.
Acknowledgements
This work was funded by the DOE Center for Advanced Bioenergy and Bioproducts Innovation, the Great Lakes Bioenergy Research Center, and the Joint BioEnergy Institute, U.S. Department of Energy, Office of Science, Biological and Environmental Research Program under Award Numbers DE-SC0018420, DE-SC0018409 and DE-AC02-05CH11231, respectively. Any opinions, findings, and conclusions or recommendations expressed in this publication are those of the author(s) and do not necessarily reflect the views of the U.S. Department of Energy. The authors thank CABBI for providing the bioenergy feedstocks for this research. The authors also thank Kristen K. Eilts for assisting with HPLC analysis and Roy J Carver Biotechnology Center at UIUC for GC-MS analysis for phenolic compound detection.
References
-
N. N. Deshavath, N. V. Mogili, M. Dutta, L. Goswami, A. Kushwaha, V. D. Veeranki and V. V. Goud, in Waste-to-Energy Approaches Towards Zero Waste, Elsevier, 2022, pp. 57–85 Search PubMed.
- C. Li, G. Cheng, V. Balan, M. S. Kent, M. Ong, S. P. S. Chundawat, L. d. C. Sousa, Y. B. Melnichenko, B. E. Dale, B. A. Simmons and S. Singh, Bioresour. Technol., 2011, 102, 6928–6936 CrossRef CAS PubMed.
-
N. N. Deshavath, V. D. Veeranki and V. V. Goud, in Sustainable Bioenergy, 2019, pp. 1–19 Search PubMed.
- N. N. Deshavath, V. V. Goud and V. D. Veeranki, Biomass Convers. Biorefin., 2024, 14, 3551–3563 CrossRef CAS.
- J. Baeyens, Q. Kang, L. Appels, R. Dewil, Y. Lv and T. Tan, Prog. Energy Combust. Sci., 2015, 47, 60–88 CrossRef.
- M. Jin, C. Gunawan, N. Uppugundla, V. Balan and B. E. Dale, Energy Environ. Sci., 2012, 5, 7168–7175 RSC.
- P. Kumar, D. M. Barrett, M. J. Delwiche and P. Stroeve, Ind. Eng. Chem. Res., 2009, 48, 3713–3729 CrossRef CAS.
-
L. Tao, D. Schell, R. Davis, E. Tan, R. Elander and A. Bratis, NREL 2012 Achievement of Ethanol Cost Targets: Biochemical Ethanol Fermentation via Dilute-Acid Pretreatment and Enzymatic Hydrolysis of Corn Stover, 2014 Search PubMed.
- A. Arora and D. J. Carrier, ACS Sustain. Chem. Eng., 2015, 3, 2423–2428 CrossRef CAS.
- N. N. Deshavath, M. Mohan, V. D. Veeranki, V. V. Goud, S. R. Pinnamaneni and T. Benarjee, 3 Biotech, 2017, 7, 1–12 CrossRef.
- K. Pandiyan, A. Singh, S. Singh, A. K. Saxena and L. Nain, Renewable Energy, 2019, 132, 723–741 CrossRef.
- N. N. Deshavath, V. V. Goud and V. D. Veeranki, Fuel, 2021, 287, 119545 CrossRef CAS.
- J. S. Kim, Y. Y. Lee and T. H. Kim, Bioresour. Technol., 2016, 199, 42–48 CrossRef CAS PubMed.
- N. N. Deshavath, W. Woodruff and V. Singh, Sustainable Energy Fuels, 2024, 8, 3386–3398 RSC.
- J. A. Perez-Pimienta, C. A. Flores-Gómez, H. A. Ruiz, N. Sathitsuksanoh, V. Balan, L. da Costa Sousa, B. E. Dale, S. Singh and B. A. Simmons, Bioresour. Technol., 2016, 211, 216–223 CrossRef CAS PubMed.
- H. D. Magurudeniya, N. R. Baral, A. Rodriguez, C. D. Scown, J. Dahlberg, D. Putnam, A. George, B. A. Simmons and J. M. Gladden, Green Chem., 2021, 23, 3127–3140 RSC.
- J. Zhang, M. Mohammadi, H. Gong, D. B. Hodge, J. Tumuluru, L. da Costa Sousa, B. Dale and V. Balan, Chem. Eng. J., 2025, 505, 159731 CrossRef CAS.
- F. Xu, J. Sun, N. V. S. N. M. Konda, J. Shi, T. Dutta, C. D. Scown, B. A. Simmons and S. Singh, Energy Environ. Sci., 2016, 9, 1042–1049 RSC.
-
J. B. Dunn, S. Mueller, H. Y. Kwon and M. Q. Wang, in Fuel Production from Non-ood Biomass: Corn Stover, 2015, pp. 281–307 Search PubMed.
- N. Uppugundla, L. Da Costa Sousa, S. P. S. Chundawat, X. Yu, B. Simmons, S. Singh, X. Gao, R. Kumar, C. E. Wyman, B. E. Dale and V. Balan, Biotechnol. Biofuels, 2014, 7, 1–14 Search PubMed.
-
C. E. Wyman, B. E. Dale, V. Balan, R. T. Elander, M. T. Holtzapple, R. S. Ramirez, M. R. Ladisch, N. S. Mosier, Y. Y. Lee, R. Gupta, S. R. Thomas, B. R. Hames, R. Warner and R. Kumar, in Aqueous Pretreatment of Plant Biomass for Biological and Chemical Conversion to Fuels and Chemicals, 2013, pp. 239–259 Search PubMed.
- Y. Kim, N. S. Mosier, M. R. Ladisch, V. Ramesh Pallapolu, Y. Y. Lee, R. Garlock, V. Balan, B. E. Dale, B. S. Donohoe, T. B. Vinzant, R. T. Elander, M. Falls, R. Sierra, M. T. Holtzapple, J. Shi, M. A. Ebrik, T. Redmond, B. Yang, C. E. Wyman and R. E. Warner, Bioresour. Technol., 2011, 102, 11089–11096 CrossRef CAS PubMed.
- L. Tao, A. Aden, R. T. Elander, V. R. Pallapolu, Y. Y. Lee, R. J. Garlock, V. Balan, B. E. Dale, Y. Kim, N. S. Mosier, M. R. Ladisch, M. Falls, M. T. Holtzapple, R. Sierra, J. Shi, M. A. Ebrik, T. Redmond, B. Yang, C. E. Wyman, B. Hames, S. Thomas and R. E. Warner, Bioresour. Technol., 2011, 102, 11105–11114 CrossRef CAS PubMed.
- G. Luo, V. D. Cao, B. Kannan, H. Liu, J. Shanklin and F. Altpeter, BMC Biotechnol., 2022, 22, 1–10 CrossRef PubMed.
- B. Kannan, H. Liu, J. Shanklin and F. Altpeter, Mol. Breed., 2022, 42, 1–10 CrossRef PubMed.
- S. Parajuli, B. Kannan, R. Karan, G. Sanahuja, H. Liu, E. Garcia-Ruiz, D. Kumar, V. Singh, H. Zhao, S. Long, J. Shanklin and F. Altpeter, GCB Bioenergy, 2020, 12, 476–490 CrossRef CAS.
- J. Zale, J. H. Jung, J. Y. Kim, B. Pathak, R. Karan, H. Liu, X. Chen, H. Wu, J. Candreva, Z. Zhai, J. Shanklin and F. Altpeter, Plant Biotechnol. J., 2016, 14, 661–669 CrossRef CAS PubMed.
- S. Maitra, M. B. Viswanathan, K. Park, B. Kannan, S. C. Alfanar, S. M. McCoy, E. B. Cahoon, F. Altpeter, A. D. B. Leakey and V. Singh, ACS Sustain. Chem. Eng., 2022, 10, 16833–16844 CrossRef CAS.
-
A. Sluiter, B. Hames, R. Ruiz, C. Scarlata, J. Sluiter, D. Templeton and D. C. Nrel, Determination of Structural Carbohydrates and Lignin in Biomass Laboratory Analytical Procedure (LAP), 2012, vol. 2011 Search PubMed.
-
B. Hames, R. Ruiz, C. Scarlata, A. Sluiter, J. Sluiter and D. Templeton, Preparation of Samples for Compositional Analysis Laboratory Analytical Procedure
(LAP), 2008 Search PubMed.
- N. N. Deshavath, B. S. Dien, P. J. Slininger, Y. Jin and V. Singh, Fermentation, 2023, 9, 1–19 Search PubMed.
- N. N. Deshavath, B. Kannan, H. Liu, W. Woodruff, J. Shanklin, F. Altpeter and V. Singh, Fuel, 2025, 386, 134254 CrossRef CAS.
- L. M. Barten, J. G. Crandall, D. Xie, J. Serate, E. Handowski, A. Jen, K. A. Overmyer, J. J. Coon, C. T. Hittinger, R. Landick, Y. Zhang and T. K. Sato, Bioresour. Technol., 2025, 432, 132651 CrossRef CAS PubMed.
- A. Juneja, B. Noordam, H. Pel, R. Basu, M. Appeldoorn and V. Singh, Bioresour. Technol., 2021, 320, 124380 CrossRef CAS PubMed.
- H. Huang, R. A. Moreau, M. J. Powell, Z. Wang, B. Kannan, F. Altpeter, A. K. Grennan, S. P. Long and V. Singh, Biocatal. Agric. Biotechnol., 2017, 10, 148–155 CrossRef CAS.
- H. Huang, S. Long and V. Singh, Biofuels, Bioprod. Biorefin., 2016, 10, 299–315 CrossRef CAS.
- W. H. Park, C. Park, J. Lee, I. J. Choi, D. H. Kim and J. W. Kim, Sep. Purif. Technol., 2025, 354, 128938 CrossRef CAS.
- M. Z. Hossain, M. B. I. Chowdhury, A. K. Jhawar, W. Z. Xu, M. C. Biesinger and P. A. Charpentier, ACS Omega, 2018, 3, 7046–7060 CrossRef CAS PubMed.
- A. Vinod, H. Pulikkalparambil, P. Jagadeesh, S. M. Rangappa and S. Siengchin, Heliyon, 2023, 9, e13614 CrossRef CAS PubMed.
-
J. W. Gooch, Ammonium Soaps, in Encyclopedic Dictionary of Polymers, ed. J. W. Gooch, Springer, 2011, p. 36 Search PubMed.
- C. F. Martins, L. A. Neves, R. Chagas, L. M. Ferreira, C. A. M. Afonso, I. M. Coelhoso, J. G. Crespo and J. P. Mota, Chem. Eng. J., 2021, 421, 127875 CrossRef CAS.
- B. Hazra, A. Mondal, M. Prasad, S. Gayen, R. Mandal, A. Sardar and P. K. Tarafdar, Langmuir, 2022, 38, 15422–15432 CrossRef CAS PubMed.
- L. Liu, Y. Hu, P. Wen, N. Li, M. Zong, B. Ou-Yang and H. Wu, Biotechnol. Biofuels, 2015, 8, 1–9 CrossRef.
- J. N. Pedersen, B. Pérez and Z. Guo, Sci. Rep., 2019, 9, 1–11 CrossRef.
- N. M. Konda, J. Shi, S. Singh, H. W. Blanch, B. A. Simmons and D. Klein-Marcuschamer, Biotechnol. Biofuels, 2014, 7, 1–11 CrossRef.
- P. Wolski, B. W. Blankenship, A. Umar, M. Cabrera, B. A. Simmons, K. L. Sale and E. C. Achinivu, Front. Energy Res., 2023, 11, 1–28 Search PubMed.
- M. H. Cheng, S. Maitra, A. N. C. Clennon, M. Appell, B. S. Dien and V. Singh, Biomass Convers. Biorefin., 2022, 14, 27149–27158 CrossRef.
- V. Arantes and J. N. Saddler, Biotechnol. Biofuels, 2010, 3, 1–11 CrossRef.
- L. Qin, W. C. Li, L. Liu, J. Q. Zhu, X. Li, B. Z. Li and Y. J. Yuan, Biotechnol. Biofuels, 2016, 9, 1–10 CrossRef PubMed.
- J. Zhang, D. Chu, J. Huang, Z. Yu, G. Dai and J. Bao, Biotechnol. Bioeng., 2010, 105, 718–728 CrossRef CAS.
- A. R. C. Morais, J. Zhang, H. Dong, W. G. Otto, T. Mokomele, D. Hodge, V. Balan, B. E. Dale, R. M. Lukasik and L. da Costa Sousa, Green Chem., 2022, 24, 4443–4462 RSC.
- A. R. G. da Silva, C. E. Torres Ortega and B. G. Rong, Bioresour. Technol., 2016, 218, 561–570 CrossRef PubMed.
- E. Palmqvist and B. Hahn-Hägerdal, Bioresour. Technol., 2000, 74, 25–33 CrossRef CAS.
- E. Palmqvist and B. Hahn-Hägerdal, Bioresour. Technol., 2000, 74, 17–24 CrossRef CAS.
- J. P. Delgenes, R. Moletta and J. M. Navarro, Enzyme Microb. Technol., 1996, 19, 220–225 CrossRef CAS.
- E. Palmqvist, H. Grage, N. Q. Meinander and B. Hahn-Hägerdal, Biotechnol. Bioeng., 1999, 63, 46–55 CrossRef CAS PubMed.
- C. E. V. F. Soares, J. C. Bergmann and J. R. M. de Almeida, Braz. J. Microbiol., 2021, 52, 575–586 CrossRef CAS PubMed.
- P. Kumari, V. V. S. Pillai and A. Benedetto, Biophys. Rev., 2020, 12, 1187–1215 CrossRef CAS PubMed.
- J. Sun, N. V. S. N. Murthy Konda, J. Shi, R. Parthasarathi, T. Dutta, F. Xu, C. D. Scown, B. A. Simmons and S. Singh, Energy Environ. Sci., 2016, 9, 2822–2834 RSC.
- C. F. Carrozza, G. Papa, A. Citterio, R. Sebastiano, B. A. Simmons and S. Singh, Bioresour. Technol., 2019, 294, 122214 CrossRef CAS PubMed.
- J. Sun, J. Shi, N. V. S. N. Murthy Konda, D. Campos, D. Liu, S. Nemser, J. Shamshina, T. Dutta, P. Berton, G. Gurau, R. D. Rogers, B. A. Simmons and S. Singh, Biotechnol. Biofuels, 2017, 1, 1–14 CrossRef.
- C. A. Barcelos, A. M. Oka, J. Yan, L. Das, E. C. Achinivu, H. Magurudeniya, J. Dong, S. Akdemir, N. R. Baral, C. Yan, C. D. Scown, D. Tanjore, N. Sun, B. A. Simmons, J. Gladden and E. Sundstrom, ACS Sustain. Chem. Eng., 2021, 9, 4042–4053 CrossRef CAS.
|
| This journal is © The Royal Society of Chemistry 2025 |
Click here to see how this site uses Cookies. View our privacy policy here. 
 Open Access Article
 This Open Access Article is licensed under a Creative Commons Attribution-Non Commercial 3.0 Unported Licence
 ab,
Mounika Durga
Nenavath
ab,
William
Woodruff
ab,
Mounika Durga
Nenavath
ab,
William
Woodruff