
 Open Access Article
 This Open Access Article is licensed under a
 Creative Commons Attribution 3.0 Unported Licence
Atom-by-atom assembly reveals structure–performance control in PdCu catalysts for CO2 hydrogenation to methanol
Louise R.
Smith
 a,
Emerson C.
Kohlrausch
b,
Kieran J.
Aggett
a,
Mario
Samperi
c,
Sadegh
Ghaderzadeh
b,
Andreas
Weilhard
b,
Luke T.
Norman
b,
Isla E.
Gow
a,
Yifan
Chen
b,
Giuseppe
Bonura
c,
Catia
Cannilla
c,
Elena
Besley
b,
David J.
Morgan
a,
Thomas J. A.
Slater
a,
Andrei N.
Khlobystov
b,
Jesum
Alves Fernandes
*b and
Graham J.
Hutchings
*a
a,
Emerson C.
Kohlrausch
b,
Kieran J.
Aggett
a,
Mario
Samperi
c,
Sadegh
Ghaderzadeh
b,
Andreas
Weilhard
b,
Luke T.
Norman
b,
Isla E.
Gow
a,
Yifan
Chen
b,
Giuseppe
Bonura
c,
Catia
Cannilla
c,
Elena
Besley
b,
David J.
Morgan
a,
Thomas J. A.
Slater
a,
Andrei N.
Khlobystov
b,
Jesum
Alves Fernandes
*b and
Graham J.
Hutchings
*a
aMax Planck-Cardiff Centre on the Fundamentals of Heterogeneous Catalysis FUNCAT, Translational Research Hub, Cardiff University, Maindy Road, Cardiff CF24 4HQ, UK. E-mail: hutch@cardiff.ac.uk
bSchool of Chemistry, University of Nottingham, University Park, Nottingham NG7 2RD, UK. E-mail: jesum.alvesfernandes@nottingham.ac.uk
cCNR-ITAE Istituto di Tecnologie Avanzate per l’Energia Nicola Giordano, Via Comunale S. Lucia 5, Messina, 98126, Italy
First published on 20th October 2025
Abstract
The catalytic conversion of CO2 to methanol using bimetallic materials presents a promising pathway for sustainable chemical production. A major challenge is the lack of atomic-level control over the catalyst structure and composition, which hinders the understanding of each metal's role in activity and selectivity. Here, we present a solvent-free on-surface assembly of PdCu bimetallic particles, directly from atoms, on ZnO with precise control of the order and quantity of metal atoms added. This atomic-defined interface reveals when atoms are added simultaneously, the metal with stronger ZnO binding governs particle size, but when introduced sequentially the first metal determines particle size. The simultaneously deposited PdCu exhibits the highest reported methanol productivity for PdCu-systems, achieving 8.2 mol h−1 molmetal−1 at 270 °C and 20 bar. In this catalyst, Cu enhances CO2 adsorption, suppresses Zn incorporation into the PdCu structure and modulates Pd binding strength to reaction intermediates. This enhances methanol selectivity while maintaining high Pd-driven CO2 conversion.
Introduction
Industrial methanol synthesis from syngas (CO + 2H2 ⇄ CH3OH) is well established using copper based catalysts, mainly focusing on Cu/ZnO/Al2O3 (CZA) catalysts.1–3 Whilst CZA has also been widely explored for methanol synthesis from CO2, these catalysts typically exhibit high activity for the reverse water gas shift reaction (RWGS; CO2 + H2 ⇄ CO + H2O), lowering methanol yields.4,5 Extensive research has been carried out in the literature to understand the catalytic activity of CZA for CO2 to methanol, including the cause of catalyst deactivation.6 Malte Behrens et al. highlighted a significant understanding of the relationship between Cu and ZnO in the industrial CZA catalyst, whereby the increased catalytic activity is a result of the higher proportion of defective Cu sites and partial coverage of the Cu particles surface with ZnO. These factors strengthen the binding of intermediates and therefore lower the energy barriers for methanol production.7 Although copper-based catalysts are widely studied, their catalytic performance still limited due to deactivation.8 As water is produced alongside methanol from CO2 feeds, steam causes significant sintering of both Cu and ZnO in CZA catalysts, resulting in catalyst deactivation.9 Consequently, a range of catalytic materials have been investigated for the conversion of CO2 to methanol, including ZnZrOx materials,10–13 supported Pd catalysts,14–17 and In2O3-based materials,18–21 among others.22–25Alloying Pd and Cu has been shown to be particularly effective for the hydrogenation of CO2 to methanol, as demonstrated by Jiang et al.26–29 for silica-supported bimetallic PdCu catalysts. The ratio of metals plays a crucial role, as the methanol space time yield (STY) was found to be highest with a Pd/(Pd + Cu) atomic ratio of 0.34; at lower Pd ratios, high selectivity to CO resulted in lower methanol yields, whilst lower CO2 conversions were observed at higher Pd ratios.26,27 DFT calculations showed that the activation barrier for the formation of the formate intermediate for a range of Pd/(Pd + Cu) ratios correlated well with methanol STY.28 The effect of support on the performance of PdCu catalysts has been investigated, with methanol production following the trend: ZrO2 ≈ TiO2 > Al2O3 > CeO2 > SiO2.30 The superior activity of the ZrO2 and TiO2 supported catalysts was attributed to the moderate strength of metal-support interaction, with the higher degree of metal-support interaction present in the Pd–Cu/CeO2 resulting in restructuring of the Pd–Cu alloy and reducing catalytic performance. Importantly, Dorado and co-workers reported the use of trimetallic Pd–Cu–Zn/SiC catalysts for ambient pressure CO2 hydrogenation.31 A higher methanol formation rate was obtained over the trimetallic Pd–Cu–Zn catalyst compared with the bimetallic Pd–Cu, Pd–Zn, and Cu–Zn analogues, while the precise origins of the synergistic effect in the trimetallic catalyst are not well understood.
The examples above clearly demonstrate that CO2-to-methanol conversion depends critically on the interplay between nanoparticle composition, structure, and support interactions. However, achieving precise atomic-level control over these factors remains a significant challenge. Overcoming this requires constructing nanoparticles atom by atom, in a defined sequence and ratio, to systematically tailor the active sites and metal-support interfaces that govern both methanol selectivity and CO2 conversion efficiency.
In this study, we construct bimetallic PdCu on zinc oxide support by depositing metal atoms in different sequences and ratios by magnetron sputtering for CO2-to-methanol conversion. The metal atom deposition mode, whether sequentially depositing Cu then Pd (s-CuPd), Pd then Cu (s-PdCu), co-depositing Pd and Cu (c-PdCu) or physically mixing Pd/ZnO and Cu/ZnO, was found to be crucial for catalytic activity. The c-PdCu mode demonstrated enhanced synergy between the metals, which significantly improved CO2 hydrogenation. Further exploration of the activity enhancement was achieved by varying the Pd/Cu ratio of the c-PdCu, resulting in a catalyst that outperforms all other PdCu catalysts systems in productivity for methanol synthesis. Comparative data with similar CO2 hydrogenation systems (Table S3) confirm its superior performance.
Results
PdCu/ZnO catalysts
Cu and Pd possess distinct physico-chemical properties that can significantly influence the self-assembly of bimetallic clusters, thereby determining their final morphology and composition, and consequently, their catalytic performance. To systematically investigate these effects on CO2 hydrogenation to methanol, we fabricated PdCu catalysts supported on ZnO by varying the deposition sequence of Cu and Pd atoms, without using chemical surfactants or ligands using a magnetron sputtering approach (Fig. 1).32–35 Although this technique has been widely employed in thin-film applications,36 its use in the preparation of supported metal nanoparticles, particularly CO2 hydrogenation, remains relatively rare.37–39 For example, Romeggio et al. prepared low-surface-area NiGa thin films with limited relevance to nanoparticles catalysts,39 while Rossi et al. employed monometallic catalysts selective for CO production.40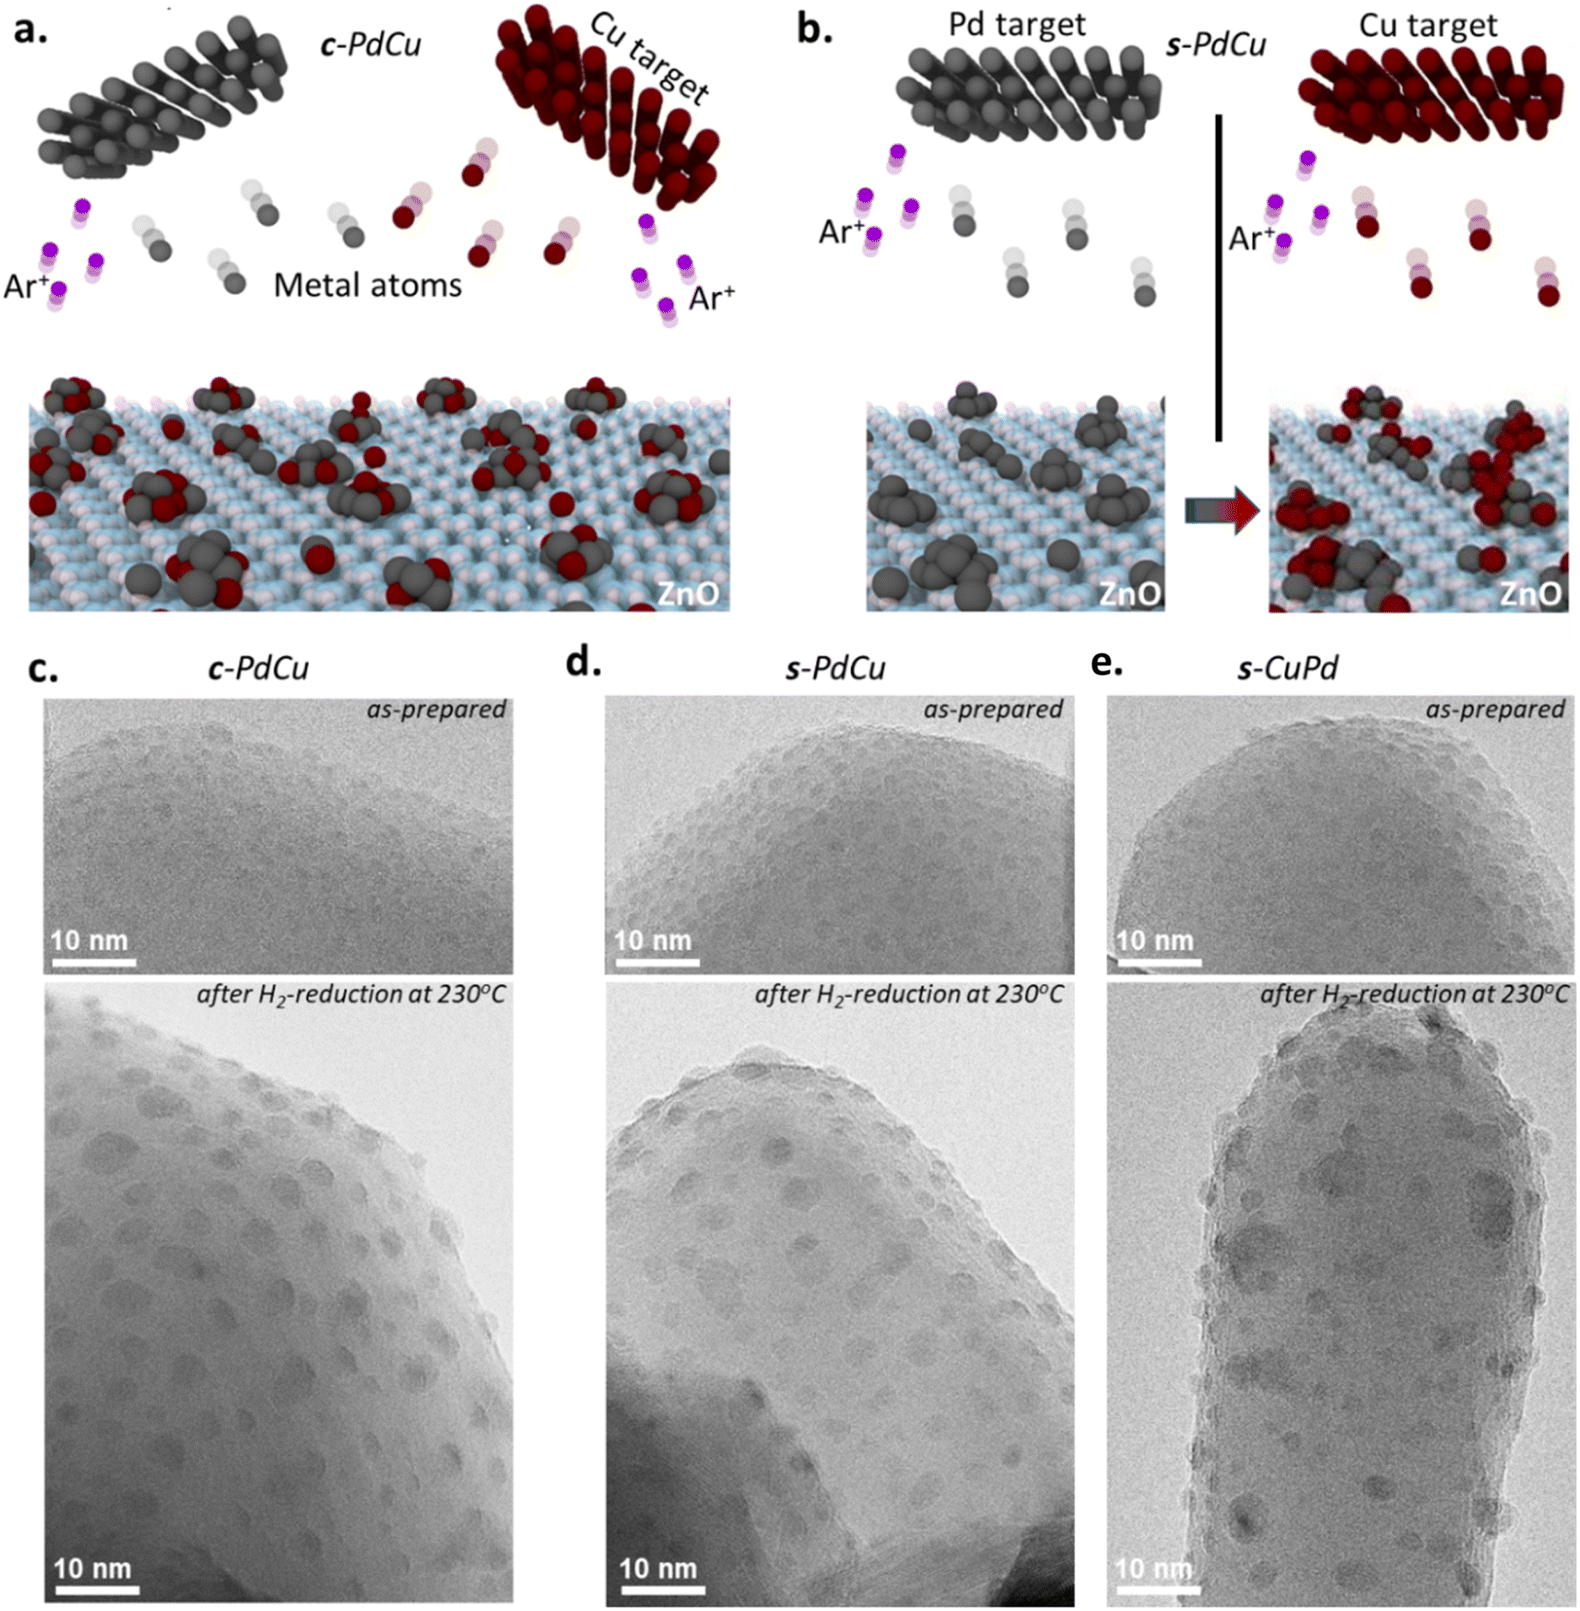 | ||
| Fig. 1 Bimetallic catalyst assembly by two modes of deposition of Pd and Cu atoms onto ZnO support: (a) illustration of simultaneous Pd and Cu deposition metal deposition used to prepare c-PdCu; (b) illustration of sequential Pd and Cu deposition metal deposition used to prepare s-PdCu or s-CuPd, depending on the order; (c–e) TEM images illustrating the distribution of metal particle dispersion on ZnO support for (c) c-PdCu, (d) s-PdCu and (e) s-CuPd. | ||
In the magnetron sputtering approach used here, a flow of metal atoms is directed onto the ZnO support, where the individual atoms self-assemble into particles, guided exclusively by their surface properties such as diffusion barriers and the density of surface defects (Fig. 1).35,41,42 Since the same support (ZnO) was used throughout this work, this approach enabled a direct correlation between the intrinsic properties of the metals and their resulting catalytic performance. Two deposition modes were employed (co-deposition and sequential deposition), to make three different catalysts: c-PdCu, in which Pd and Cu atoms were co-deposited at the same time; s-PdCu, in which Pd atoms were deposited first, followed by Cu; and then s-CuPd, where the sequence was reversed, leading to three different bimetallic structures (Fig. 1). All catalysts were assembled with similar Pd![[thin space (1/6-em)]](https://www.rsc.org/images/entities/char_2009.gif) :Cu atomic ratios, as verified by inductively coupled plasma optical emission spectroscopy (ICP-OES). The catalysts were characterised both in their as-prepared state and after reduction at 230 °C under hydrogen, which represents the state of the catalyst immediately before the reaction.43–46
:Cu atomic ratios, as verified by inductively coupled plasma optical emission spectroscopy (ICP-OES). The catalysts were characterised both in their as-prepared state and after reduction at 230 °C under hydrogen, which represents the state of the catalyst immediately before the reaction.43–46
High resolution transmission electron microscopy (HRTEM) analysis of c-PdCu, s-PdCu, and s-CuPd before and after reduction revealed nanoparticles with flattened pyramidal shapes, well distributed across the (0001) and (010-1) facets of ZnO (Fig. 1). The c-PdCu and s-PdCu particles both exhibited average diameters of 2.0 ± 0.5 nm, while the average diameter of the s-CuPd particles was slightly larger at 2.3 ± 0.5 nm. This trend persisted after the reduction step at 230 °C, conducted immediately prior to the reaction, with particle sizes increasing slightly to 3.0 ± 0.8 nm for both c-PdCu and s-PdCu, and more substantially to 4.1 ± 1.5 nm for s-CuPd (Fig. 1c and d). Notably, the average particle size and distribution were significantly larger for s-CuPd compared to s-PdCu. This observation suggests that, in sequential deposition, the metal deposited first dictates the size of the resulting bimetallic clusters, as it preferentially occupies the primary binding sites and initiates nucleation before the second metal is deposited. To further investigate this phenomenon, we performed density functional theory (DFT) calculations of Pd and Cu binding energies on the ZnO (0001) facet (Fig. S1). The results indicate that Pd binds more strongly to ZnO than Cu, with binding energies of −4.25 eV and −2.96 eV, respectively. Interestingly, both Pd and Cu atoms preferentially bind to zinc atoms rather than to oxygen atoms within the ZnO structure. To emulate the initial stages of cluster formation, a second Pd or Cu atom was deposited on ZnO surface. The calculated Pd–Pd/ZnO and Cu–Cu/ZnO binding energies were −3.13 eV and −3.31 eV, respectively. These results show that Cu–Cu/ZnO bonding is 0.4 eV more favourable than Cu binding to the ZnO support, whereas Pd binding to ZnO support is 0.12 eV more favourable than Pd–Pd/ZnO bonding. These findings confirm that Pd consistently exhibits a stronger interaction with the ZnO support than Cu. This stronger Pd–ZnO binding limits Pd atom migration on the ZnO surface, leading to the formation of smaller Pd particles compared to Cu. This trend is reflected in the observed morphology of the corresponding bimetallic clusters (Fig. 1d and e). Hence, our findings support the conclusion that in sequential deposition, the particle size largely reflects that of the metal deposited first. In contrast, in co-deposition, the final particle size is primarily governed by the metal with the stronger binding affinity to the support, Pd in this case. Importantly, these behaviours can only manifest under conditions where metal-support interactions are not masked or altered by ligands or surfactants, underscoring the intrinsic nature of the observed effects.
X-ray photoelectron spectroscopy (XPS) of the Pd, Cu and PdCu catalysts on ZnO was conducted both before (Fig. S2–S3a and Table S1) and after reduction (Fig. 2a, S3b, Table S1, and Fig. S4, S5). The Pd 3d XPS spectra show a PdO peak at 337.0 eV prior to reduction, which disappears after reduction, resulting in the presence of only peaks at 335.0 eV and 336.2 eV corresponding to Pd0 and a Pd-alloy, respectively, regardless of the deposition mode. Notably, s-PdCu exhibits a higher ratio of metallic Pd after reduction compared to the other bimetallic catalysts (Fig. 2a). The Pd0 peak for monometallic Pd/ZnO appears at a lower binding energy of 335.0 eV than that of Pd0 for c-PdCu, s-CuPd and s-PdCu, which all appear at a similar binding energy of 335.5 eV. This indicates charge transfer from Pd to Cu caused by the flow of electrons from the fully filled Pd 4d orbital to the partially-filled Cu 4s orbital, confirming the interaction between Pd and Cu alloy.47–53 The Cu 2p XPS spectra show the presence of both metallic Cu at 932.0 eV and CuO at 933.5 eV before and after reduction (Fig. S3). After reduction, a 0.4–0.5 eV downward shift in energy is observed, along with a substantial increase in the proportion of Cu0. The valence band spectra (Fig. 2b) are dominated by ZnO, but nevertheless, there appears to be a shift away from the Fermi level for PdCu vs. Pd, indicative of charge transfer from Pd to Cu,47,53 and further highlighting the interaction between Pd and Cu in the bimetallic catalysts.
 | ||
| Fig. 2 PdCu/ZnO catalysts prepared by different metal deposition modes. (a) XPS Pd 3d spectra for PdCu/ZnO catalysts post-reduction with Pd/ZnO also shown for reference; (b) valence band spectra for PdCu/ZnO catalysts post-reduction with the ZnO support shown for reference; (c) CO-DRIFTS spectra for PdCu/ZnO catalysts obtained under flowing N2; (d) MeOH selectivity vs. CO2 conversion for c-PdCu, s-PdCu and s-CuPd and a physical mixture of Pd/ZnO and Cu/ZnO; (e) MeOH productivity as a function of reaction temperature for c-PdCu, s-PdCu and s-CuPd and a physical mixture of Pd/ZnO and Cu/ZnO. Catalysts were reduced at 230 °C (1 hour, 5 °C min−1) prior to characterisation and testing; (f) DRIFT spectra of PdCu/ZnO catalysts under reaction conditions (20 bar, 270 °C, GHSV = 6400 NL kgcat−1 h−1), showing the CO2 intermediates and methanol regions. An inset of the CO region highlights the CO at gas phase, M+ – CO, Cu0–CO and Pd0–CO vibrations (M = Pd or Cu). | ||
To further investigate the final structure of PdCu/ZnO, we calculated the relative surface concentrations of Pd and Cu for all catalysts (Table S1). s-CuPd and s-PdCu exhibited similar surface concentrations of Pd and Cu (ca. 2.2%), whereas a significantly higher surface concentration (ca. 4.3%) was observed for c-PdCu, despite all catalysts having comparable total metal loadings. These findings indicate that Pd and Cu are more randomly distributed for c-PdCu compared to the sequentially deposited samples, supporting the self-assembly mechanism proposed in Fig. 1.
Diffuse Reflectance Infrared Fourier Transform Spectroscopy (CO-DRIFTS) revealed a difference in bonding CO with bimetallic centres, depending on whether Pd and Cu were simultaneously or sequentially deposited (Fig. 2c). In the presence of flowing CO (Fig. S6), all spectra were dominated by Pd–CO adsorption with bands at ca. 2094 cm−1 and 1978 cm−1, representing linearly bound and bridge-bound CO on Pd0, respectively.54,55 Following CO adsorption, spectra were taken under flowing N2 to remove gas phase CO molecules (Fig. 2c). Bands at 2085 and 1972 cm−1 corresponding to bonded CO, remained for both s-CuPd and s-PdCu, with a minor adsorption band visible at 2126 cm−1 representing CO bound to Cu.56 However, under the same conditions, no CO bands were visible for c-PdCu, suggesting significantly weaker interactions between CO and any Pd atoms in c-PdCu (Fig. 2c). This corroborates with a stronger charge transfer from Pd to Cu observed in the XPS of c-PdCu, which may weaken the binding strength of adsorbed CO to Pd,49,57 once again suggesting a greater degree of interaction between Pd and Cu on ZnO surfaces when the atoms are simultaneously deposited.
Temperature-programmed desorption (CO2-TPD) was carried out to assess the CO2 adsorption behaviour of the catalysts (Fig. S7). All samples exhibit broadly similar desorption profiles; however, quantitative analysis reveals notable differences in CO2 uptake. The integrated CO2-TPD signals correspond to10 mL g−1 for c-PdCu, 13 mL g−1 for s-PdCu, and 4 mL g−1 for s-CuPd. These results demonstrate that Cu plays a critical role in enhancing CO2 adsorption. When Pd is deposited last (s-CuPd), thus covering the Cu particles, the CO2 adsorption capacity decreases significantly.
The catalytic performance of PdCu/ZnO catalysts prepared via different metal deposition modes is shown in Fig. 2d and e. A physical mixture of Pd/ZnO (1 wt%) and Cu/ZnO (1 wt%) was included for comparison. A detailed investigation of the effect of the reduction temperature at 230 vs. 400 °C and loading at 0.5 and 1 wt% of Pd/ZnO and Cu/ZnO are shown in Fig. S8–S11. To ensure comparable metal loadings to the bimetallic catalysts, the individual components were pelleted, and 0.25 g of each was combined and loaded into the reactor. Across the tested temperature range, the s-PdCu and the physical mixture exhibited similar CO2 conversions and methanol selectivities, leading to comparable methanol productivities. The reverse sequence catalyst, s-CuPd, showed comparable CO2 conversion to the other samples at 230 °C, but with higher methanol selectivity, resulting in increased methanol productivity at this temperature. However, at 250 °C and 270 °C, s-CuPd displayed lower CO2 conversion with higher selectivity, leading to the comparable methanol productivity at 250 °C and 270 °C with s-PdCu and the physical mixture. In contrast, the c-PdCu catalyst achieved CO2 conversions similar to s-PdCu and the physical mixture but consistently higher methanol selectivity. As a result, c-PdCu delivered methanol productivities comparable to s-CuPd at 230 °C, and significantly higher than all other catalysts at 250 °C and 270 °C with values of 794 and 1031 mmol h−1 kgcat−1, respectively, corresponding to 6.3 and 8.2 mol h−1 molmetal−1. Importantly, HR-TEM images of c-PdCu, s-PdCu, and s-CuPd catalysts show no significant changes in mean particle diameter or size distribution after catalysis (Fig. S12).
In situ DRIFT experiments were performed on c-PdCu, s-PdCu, and s-CuPd catalysts under reaction conditions (20 bar, 270 °C) to elucidate the superior performance of c-PdCu over the other bimetallic systems (Fig. 2f and S13, S14). Prior to introducing the reaction mixture (CO2/H2/N2 = 23/69/8 mol mol−1) into the reactor, all bimetallic catalysts were reduced under a 5% H2/Ar flow at 230 °C for 1 hour. Across all catalysts, bands at 1003 cm−1, 1032 cm−1, and 1060 cm−1 were detected, corresponding to gas-phase methanol. In the 1300–1700 cm−1 region, features ascribed to surface-bound carbonate and bicarbonate intermediates were observed for all catalysts.25,58 The broad and poorly resolved nature of these signals is likely due to overlapping contributions from water vapour. The pronounced bands in s-PdCu may indicate strong stabilisation of formate- and carbonate-like intermediates on its surface.
The 1950–2200 cm−1 region, characteristic of CO stretching vibrations, provides insight into the oxidation state and CO adsorption modes of Cu and Pd. A peak at 2077 cm−1, assigned to linearly adsorbed CO on metallic Cu, was observed for all three catalysts. Additionally, a small peak at 2094 cm−1 was present in all bimetallic systems, which can be attributed to CO adsorbed on Pdδ+ or Cuδ+. Similar peak has been reported for CuZn-based catalysts, where charge transfer from Cu to Zn leads to Cuδ+ species.59–61 Based on our spectroscopy results in Fig. 2a–c, which indicated charge transfer from Pd to Cu, this feature was assigned to CO bounded to Pdδ+ sites.
Interestingly, a distinct peak at 2057 cm−1 corresponding to CO adsorbed on metallic Pd was observed, with a significantly highest intensity for s-PdCu. This observation is consistent with XPS results (Fig. 2a), which revealed a higher proportion of metallic Pd in s-PdCu compared to s-CuPd and c-PdCu. These findings demonstrate that s-PdCu exhibits stronger binding to reaction intermediates, such as CO and formate-like species, relative to s-CuPd and c-PdCu. Notably, s-PdCu displayed the lowest methanol selectivity among the tested catalysts, whereas s-CuPd and c-PdCu demonstrated comparable selectivity at 270 °C (Fig. 2d). In contrast, s-CuPd exhibited the lowest CO2 conversion, while s-PdCu and c-PdCu achieved similar, significantly higher conversions than s-CuPd under identical conditions (Fig. 2d). These findings clearly highlight that Cu plays a dominant role in tuning methanol selectivity, whereas Pd is the primary contributor to CO2 conversion. Therefore, the order of metal deposition strongly influences the catalytic performance. When Cu is deposited first, as in s-CuPd, the resulting catalyst exhibits enhanced selectivity towards methanol, albeit at the expense of CO2 conversion. Conversely, when Pd is deposited first, as in s-PdCu, the catalyst displays high activity but lower methanol selectivity due to insufficient electronic modulation of Pd by Cu. In the case of c-PdCu, where Pd and Cu are intimately mixed at the atomic level, both favourable Cu-induced modulation of intermediate binding strength and high Pd-driven activity are simultaneously achieved (Fig. 2d and e). These synergistic properties are central to the superior catalytic performance of c-PdCu for CO2-to-methanol conversion.
To further investigate the c-PdCu catalyst, we prepared a series of PdCu/ZnO catalysts with varying Pd:Cu ratios. The total metal loading was fixed at 1 wt%, with compositions ranging from Pd0.01Cu0.99 to Pd0.75Cu0.25. Chemical and electronic properties were examined by XPS (Fig. S15–S18), which revealed no significant differences compared to c-Pd0.50Cu0.50, with peaks assigned to Pd0 and Pd alloy. In contrast, no peak attributed to alloyed Pd was observed for Pd0.12Cu0.88, Pd0.05Cu0.95 and Pd0.01Cu0.99, although this may be due to the low amounts of Pd present in these samples (<0.12 wt% Pd). The Cu 2p spectra showed the presence of Cu0 and CuO for all samples. The catalytic performance of the c-PdCu catalysts with varying compositions is presented in Fig. 3.
 | ||
| Fig. 3 Performance of PdCu/ZnO catalysts with a variety of Pd:Cu molar ratios and fixed total loadings of 1 wt%. (a) MeOH productivity; (b) enhancement in MeOH productivity for PdxCuy catalysts vs. monometallic Cu; (c) MeOH selectivity vs. CO2 conversion. | ||
Methanol productivity as a function of Pd concentration is shown in Fig. 3a, with the data normalised to moles of metal. A volcano plot was observed with a maximum methanol productivity achieved over Pd0.50Cu0.50 at all reaction temperatures, with values of 4.0, 6.3 and 8.2 mol h−1 molmetal−1 at 230, 250 and 270 °C, respectively. Fig. 3b shows the enhancement in methanol productivity for all c-PdxCuy catalysts, compared with Cu/ZnO, where all catalysts have a fixed loading of 1 wt%. Consistent with Fig. 3a, a clear maximum was again observed at a Pd0.5Cu0.5.
In terms of methanol selectivity, catalysts with higher Pd content, Pd0.75Cu0.25, Pd0.50Cu0.50, Pd0.25Cu0.75, exhibited enhanced selectivity across the full temperature range (Fig. 3c). Interestingly, negligible CH4 formation was detected over Pd0.50Cu0.50, Pd0.25Cu0.75, and even Pd0.12Cu0.88 (<0.1%). Although Pd0.12Cu0.88 showed similar methanol selectivity to Pd0.50Cu0.50 and Pd0.25Cu0.75 at 250 °C, its selectivity dropped at higher temperatures. In contrast, Pd-rich (Pd0.75Cu0.25) and Cu-rich (Pd0.05Cu0.95 and Pd0.01Cu0.99) catalysts exhibited significantly higher CH4 formation, with selectivities from 0.8 to 0.5% for Pd0.75Cu0.25, 0.5 to 0.2% for Pd0.05Cu0.95, and 0.3 to 0.1% for Pd0.01Cu0.99 (Table S2). These are critical results for catalyst application at large scales, as even at low levels methane formation is detrimental to methanol synthesis. Unlike CO, which can be recycled through subsequent hydrogenation, CH4 must be purged from the system, leading to increased operational costs.62 Methane has been reported as a by-product in methanol synthesis from CO2 over Cu/ZnO catalysts with a range of Cu oxidation states,43 as well as monometallic Pd catalysts.63
Previous studies have shown that PdZn can suppress CH4 formation, thereby enhancing methanol selectivity.38 To further determine whether methane suppression in our system arises from PdCu or PdZn alloy formation, we performed scanning transmission electron microscopy (STEM) combined with energy dispersive X-ray (EDX) spectroscopy for c-Pd0.50Cu0.50 (Fig. 4).
 | ||
| Fig. 4 Representative HAADF-STEM imaging and EDX characterisation. (a) HAADF-STEM image of one nanoparticle in Pd0.50Cu0.50 with two areas indicated with red and blue squares; (b) EDX spectra (red and blue) for the areas indicated by the red and blue squares respectively in (a); (c) EDX elemental maps of the nanoparticle shown in (a), mapping (i) Cu-Kα, (ii) Pd-Lα and (iii) Zn-Kα peaks. | ||
Fig. 4c shows a homogeneous distribution of Pd and Cu within the bimetallic particles, indicating a high degree of alloying, consistent with XPS and DRIFTS results (Fig. 2) and the bimetallic assembly mechanism proposed (Fig. 1a). Importantly, Zn was confined to the support, with no evidence of incorporation into the catalyst particles except in the interface between Pd and ZnO support as confirmed by our DFT calculations as well (Fig. 4b, c and S1). EDX spectra of the catalyst region (blue area) and the underlying support (red area) confirmed the absence of intermixing between the Zn and the PdCu bimetallic particles.
The presence of Cu appears to effectively inhibit the inclusion of Zn in the PdCu structure, which has previously been identified as the main factor responsible for CH4 suppression in monometallic Pd systems. These results demonstrate that with an appropriate Pd-to-Cu ratio, PdCu bimetallics can also suppress methane formation. This is evident in c-Pd0.50Cu0.50, c-Pd0.25Cu0.75, and c-Pd0.12Cu0.88, all of which show negligible CH4 production. Critically, for all PdCu catalysts, no loss of activity or signs of deactivation were observed over the testing period (ca. 100 hours), highlighting the stability of the catalysts. Furthermore, c-Pd0.25Cu0.75 and c-Pd0.75Cu0.25 were tested for three catalytic cycles (Fig. S19), with no loss of methanol productivity observed upon retesting. Among all catalysts tested, c-Pd0.50Cu0.50 exhibited the highest methanol productivity, likely due to the synergistic effect between the intrinsically high hydrogenation activity of Pd and the high methanol selectivity characteristic of Cu-based catalysts.
The role of Cu in the PdCu system can be rationalised considering previous findings for the Pd/ZnO system, where the formation of the PdZn alloy enhanced methanol production by facilitating the formation of formate intermediates and their subsequent hydrogenation to methanol.38,62–64 A similar mechanistic pathway appears to operate for the PdCu alloys reported here, where the exclusion of Zn from the alloy is clearly observed (Fig. 4). Thus, the modulation of Pd through alloying with either Zn or Cu significantly influences the methanol formation rate. In situ DRIFTs experiment further support this mechanistic interpretation (Fig. 2f), showing that changes in the PdCu alloy composition, achieved by varying the deposition order to expose either Pd or Cu at the surface, affect methanol selectivity. Moreover, previous DFT studies have shown that PdCu alloys facilitate the facile formation of formate intermediates, further promoting methanol production during CO2 hydrogenation.28
Table S3 shows values of methanol productivity for previously reported PdCu catalysts in the literature, along with the c-Pd0.50Cu0.50 prepared in this work. It can be seen that the methanol productivity of 8.2 molMeOH h−1 molmetal achieved by the c-PdCu catalyst assembled directly from metal atoms is considerably higher than previously reported values, despite the majority of previous studies being conducted at higher pressures, which allows for higher equilibrium yields of methanol. This demonstrates that assembling particles directly on the surface in a solvent- and reagent-free environment is not only an effective technique for improving atom economy during catalyst production (Table S4 shows that this approach significantly enhances metal utilisation efficiency) but also leads to superior productivity in the synthesis of methanol from CO2. This further highlights the magnetron sputtering technique as a sustainable method for the efficient production of complex bimetallic particles systems, where strict control over composition and atomic mixing plays a significant role in determining catalyst activity.
Conclusions
This study has demonstrated that directly depositing metals in atomic form onto a support is a highly efficient, versatile and sustainable method for fabricating bimetallic catalysts. This approach enabled the formation of PdCu/ZnO catalysts that exhibit increased activity for CO2 hydrogenation. Importantly, it was shown that different metals can be effectively mixed at the atomic scale in desired ratios to produce bimetallic PdCu/ZnO catalysts. Interestingly, the order in which metal atoms are added significantly impacted catalytic activity. When Pd and Cu were co-deposited onto ZnO, the resulting catalyst exhibited the highest productivity for methanol as compared to catalysts produced by sequential deposition and to any previously reported PdCu catalysts. This demonstrates the considerable tunability of catalyst composition and corresponding performance, which can be achieved simply by varying how metal atoms are mixed on the surface. The presence of Cu enhances CO2 adsorption, inhibits the inclusion of Zn in PdCu particles and modulates the binding strength of Pd to reaction intermediates leading to negligible CH4 formation and, resulting in high selectivity for methanol production while maintaining the high CO2 conversion characteristic of Pd. Under the given reaction conditions, we observed no loss of performance or signs of catalyst deactivation. The catalyst preparation method using magnetron sputtering demonstrates, for the first time, that not only the Pd:Cu ratio but also the sequence of metal deposition plays a critical role in producing a superior bimetallic catalyst for the thermal conversion of CO2 to methanol.
Methods
Catalyst preparation
All depositions were conducted using a custom-built AJA magnetron sputtering system. Samples were mounted on a specially designed rotating holder to ensure continuous agitation during the deposition process. This assembly was loaded into the pre-chamber of the sputtering system, which reached a base pressure of 3 × 10⁻⁷ torr within 30 minutes. The sample holder was then transferred to the main chamber, where a background pressure of 3 × 10⁻⁸ torr was maintained. Upon closing the gate valve to isolate the main chamber from the pre-chamber, the system required approximately 5 minutes to re-establish the base pressure of 3 × 10⁻⁸ torr. Metal deposition was performed at room temperature using high-purity argon (10 mTorr) as the working gas. Depending on the experimental design, either Pd (99.99%) or Cu (99.99%), or both, were used in monometallic or bimetallic configurations. Two deposition modes were employed: (1) co-deposition, in which both metals were deposited simultaneously onto the support. Samples prepared by this method were labelled with the prefix “c-”, e.g., c-PdCu; and (2) sequential deposition, where one metal was deposited prior to the other. These samples were labelled with the prefix “s-”, and the order of the elements in the label reflects the deposition sequence. For example, in s-CuPd, Cu was deposited before Pd. Additionally, the Cu/Pd atomic ratio was calibrated in advance by adjusting the sputtering power applied to each target. The metal loading of the catalysts was quantified using inductively coupled plasma–optical emission spectroscopy (ICP-OES) on a PerkinElmer Optima 2000 spectrometer. For sample preparation, approximately 10 mg of catalyst powder was subjected to microwave-assisted acid digestion in 2 mL of freshly prepared aqua regia (a 3:1 mixture of hydrochloric and nitric acids). The digestion was carried out at 150 °C for 1 hour to ensure complete dissolution of both metals and zinc oxide components. After cooling, the digested samples were diluted to a final volume of 10 mL using a 5% (v/v) hydrochloric acid solution to stabilise the metal ions before analysis.
DFT calculations
Spin-polarised Density Functional Theory (DFT) calculations of binding energies of metal atoms to zinc oxide were performed with the Vienna Ab initio Simulation Package (VASP), within the plane-wave projector augmented-wave (PAW) method. The structures were relaxed using the Perdew–Burke–Ernzerhof (PBE) exchange–correlation functional with a force tolerance of 0.01 eV A−1 and an electronic convergence criteria of 10−6 eV. The energy cut-off was set to 500 eV, and a Monkhorst–Pack k-point grid of 4 × 4 × 1 was used to sample the Brillouin zone. van der Waals interactions were taken into account using the DFT-D3 method with Becke–Jonson damping function.DRIFTS under reaction conditions
CO2 hydrogenation to methanol reaction was investigated by operando Diffuse Reflectance Infrared Fourire Transform Spectroscopy (DRIFTS). Measurements were performed with a IS50 ThermoFisher Scientific Spectrometer equipped with a MCT detector, a KBr beam splitter, and a flow-through high temperature environmental cell—the TPR Praying Mantis™ Diffuse Reflection Accessory (HR-DRP-BR3) with ZnSe windows—capable of operating at high temperatures and pressure (up to 800 °C and 34 bar). Spectra were acquired by collecting 256 scans at a resolution of 4 cm−1 over a scan range from 4000 to 650 cm−1. The cell sample holder (i.d.: 5 mm; height: 4 mm) was located within a chamber with ZnSe windows.Prior to each catalytic tests, the sample was reduced in situ at 230 °C and atmospheric pressure for 1 h in flux (20 mL min−1) of 5% H2/Ar (heating rate β = 5 °C min−1). Then the catalyst was purged with Ar at 270 °C and a background spectrum was acquired. The temperature was reduced to 125 °C and the reaction mixture of CO2/H2/N2 (23/69/8 mol mol−1) was introduced to the cell and the pressure increased to 20 bar. Then the reaction temperature was increased to 270 °C and the evolution of intermediates was monitored until the stabilization of the IR signals (1 h).
Catalyst testing
The catalyst testing was undertaken using a fixed bed, continuous flow, 16-bed high throughput catalytic reactor which was designed, manufactured and serviced by Integrated Lab Solutions GmbH (ILS). The reactor was automated using Integrated Workflow Manager software, based on the LabVIEW package, and operated by the Siemens Win CC program. The reactor was divided into 4 heating blocks each containing 4 catalyst beds. In every reaction, one bed in each block was kept as a blank to ensure comparability. A capillary distribution system coupled with Equilibar back pressure regulators were used to control the gas feed and reactor pressure. A thermocouple was installed in each heating block to control the temperature.The catalyst pellets (0.5 g unless otherwise specified, 425–600 μm pellet size) were mixed with silicon carbide (F80, 190 μm mean particle size) and centred in the isothermal zone of the stainless steel reactor tubes, which had an internal diameter of 4.0 mm. A bed of silicon carbide (F24, 750 μm mean particle size) was used at each end to limit mass transfer, and the reactor tube was plugged with quartz wool. Prior to testing, the catalysts were reduced in situ at 230 °C or 400 °C for 1 hour, with a ramp rate of 5 °C min−1, under a flow of 5% H2/N2 (40 mL min−1 flow rate). The reactor temperature was then cooled to 125 °C and the catalysts were held under N2. The system was then pressurised to 20 bar and switched to the reactant gas feed of 20% CO2, 60% H2, 5% Ar, 15% N2 (30 mL min−1 flow rate). After a stabilisation period of 4 hours, the CO2 hydrogenation reaction was conducted using the previously reported temperatures of 230–270 °C. A downstream purge of N2 (30 mL min−1) was used to prevent product build up and the downstream oven was held at 120 °C to avoid the condensation of the products.
The reaction products were analysed by online gas chromatography, utilising an Agilent 7890B system with two flame ionisation detectors (FIDs) and one thermal conductivity detector (TCD). The internal standard used was argon. The GC analysed 4 injections per temperature point per bed via a Vici stream selection valve. CO2 conversion was calculated by comparing the moles of CO2 in each bed to the moles of CO2 in the calibration run at 125 °C. The carbon balance was calculated as the sum of the carbon containing products (methanol and CO were the only products produced, with small amounts of CH4 over certain catalysts) and reactants in the feed divided by the sum of carbon containing reactants in the calibration runs.
Author contributions
L. R. S.: conceptualization, data curation, investigation, methodology, writing – original draft preparation, writing – review & editing; E. C. K.: data curation, investigation, methodology, writing – review & editing; K. J. A.: data curation, formal analysis, investigation, writing – review & editing; M. S.: data curation, investigation, methodology; S. G.: data curation, investigation, methodology; A. W.: data curation, investigation, methodology; L. T. N.: data curation, investigation, methodology; I. E. G.: data curation, investigation; Y. C.: data curation, formal analysis; G. B.: data curation, investigation, methodology; C. C.: data curation, investigation, methodology; E. B.: data curation, investigation, methodology; D. J. M.: data curation, formal analysis, investigation; T. J. A. S.: data curation, investigation; A. N. K.: funding acquisition, supervision, writing – original draft preparation, writing – review & editing; J. A. F.: conceptualization, funding acquisition, methodology, supervision, writing – review & editing; G. J. H.: conceptualization, funding acquisition, methodology, supervision, writing – original draft preparation, writing – review & editing.Conflicts of interest
There are no conflicts to declare.Data availability
All data is available in the manuscript and the supplementary information (SI). Supplementary information is available. See DOI: https://doi.org/10.1039/d5sc06681f.Acknowledgements
The authors would like to acknowledge the financial support from the EPSRC programme grant “Metal Atoms on Surfaces & Interfaces (MASI) for Sustainable Future” (EP/V000055/1) along with the EPRSC grant “Parallel-screening equipment for advanced catalyst testing and process intensification” (EP/P001467/1). The authors would like to thank the Max Planck Society and Cardiff University for the financial support to create the Max Planck-Cardiff FUNCAT Centre. We would also like to acknowledge Integrated Lab Solutions (ILS) for the design and manufacture of the high throughput reactor used for catalyst testing, alongside their continued support and technical expertise. We would like to acknowledge the CCI Electron Microscopy Facility which has been part-funded by the European Regional Development Fund through the Welsh European Funding Office, and The Wolfson Foundation. The financial support from the European Union – NextGeneration EU PNRR IR0000020 ECCSELLENT through NRRP – M4C2, Inv. 3.1 “Development of ECCSEL-R.I. Italian facilities: user access, services and long-term sustainability” is also gratefully acknowledged.References
- G. A. Olah, Beyond Oil and Gas: The Methanol Economy, Angew. Chem., Int. Ed., 2005, 44, 2636–2639 CrossRef CAS PubMed.
- G. C. Chinchen, K. C. Waugh and D. A. Whan, The activity and state of the copper surface in methanol synthesis catalysts, Appl. Catal., 1986, 25, 101–107 CrossRef.
- M. Behrens, F. Studt, I. Kasatkin, S. Kühl, M. Hävecker, F. Abild-Pedersen, S. Zander, F. Girgsdies, P. Kurr, B.-L. Kniep, M. Tovar, R. W. Fischer, J. K. Nørskov and R. Schlögl, The Active Site of Methanol Synthesis over Cu/ZnO/Al2O3 Industrial Catalysts, Science, 2012, 336, 893–897 CrossRef.
- Z. Chen, J. Wen, Y. Zeng, M. Li, Y. Tian, F. Yang, M. M.-J. Li, P. Chen, H. Huang, D. Ye and L. Chen, The origin of the mediocre methanol selectivity of Cu/ZnO-based catalysts for methanol synthesis from CO2 hydrogenation, Appl. Catal., B, 2024, 340, 123192 CrossRef.
- H. Liang, G. Zhang, Z. Li, Y. Zhang and P. Fu, Catalytic hydrogenation of CO2 to methanol over Cu-based catalysts: Active sites profiling and regulation strategy as well as reaction pathway exploration, Fuel Process. Technol., 2023, 252, 107995 CrossRef.
- A. Beck, M. A. Newton, L. G. A. van de Water and J. A. van Bokhoven, The Enigma of Methanol Synthesis by Cu/ZnO/Al2O3-Based Catalysts, Chem. Rev., 2024, 124, 4543–4678 CrossRef PubMed.
- M. Behrens, F. Studt, I. Kasatkin, S. Kühl, M. Hävecker, F. Abild-Pedersen, S. Zander, F. Girgsdies, P. Kurr, B.-L. Kniep, M. Tovar, R. W. Fischer, J. K. Nørskov and R. Schlögl, The Active Site of Methanol Synthesis over Cu/ZnO/Al2O3 Industrial Catalysts, Science, 2012, 336, 893–897 CrossRef PubMed.
- J. Ye, N. Dimitratos, L. M. Rossi, N. Thonemann, A. M. Beale and R. Wojcieszak, Hydrogenation of CO2 for sustainable fuel and chemical production, Science, 2025, 387, eadn9388 CrossRef PubMed.
- J. Wu, M. Saito, M. Takeuchi and T. Watanabe, The stability of Cu/ZnO-based catalysts in methanol synthesis from a CO2-rich feed and from a CO-rich feed, Appl. Catal., A, 2001, 218, 235–240 Search PubMed.
- J. Wang, G. Li, Z. Li, C. Tang, Z. Feng, H. An, H. Liu, T. Liu and C. Li, A highly selective and stable ZnO-ZrO2 solid solution catalyst for CO2 hydrogenation to methanol, Sci. Adv., 2017, 3, e1701290 Search PubMed.
- T. Pinheiro Araújo, G. Giannakakis, J. Morales-Vidal, M. Agrachev, Z. Ruiz-Bernal, P. Preikschas, T. Zou, F. Krumeich, P. O. Willi, W. J. Stark, R. N. Grass, G. Jeschke, S. Mitchell, N. López and J. Pérez-Ramírez, Low-nuclearity CuZn ensembles on ZnZrOx catalyze methanol synthesis from CO2, Nat. Commun., 2024, 15, 3101 Search PubMed.
- K. Lee, M. P. Dickieson, M. Jung, Y. Yang and N. Yan, Structure Sensitivity of ZnZrOx Catalysts in CO2 Hydrogenation to Methanol: Significance of Surface Oxygen Content and Synthesis Strategy, ACS Catal., 2024, 14, 3074–3089 CrossRef.
- T. Pinheiro Araújo, J. Morales-Vidal, T. Zou, M. Agrachev, S. Verstraeten, P. O. Willi, R. N. Grass, G. Jeschke, S. Mitchell, N. López and J. Pérez-Ramírez, Design of Flame-Made ZnZrO Catalysts for Sustainable Methanol Synthesis from CO2, Adv. Energy Mater., 2023, 13, 2204122 CrossRef.
- F. Jiang, S. Wang, B. Liu, J. Liu, L. Wang, Y. Xiao, Y. Xu and X. Liu, Insights into the Influence of CeO2 Crystal Facet on CO2 Hydrogenation to Methanol over Pd/CeO2 Catalysts, ACS Catal., 2020, 10, 11493–11509 CrossRef.
- H. Bahruji, M. Bowker, G. Hutchings, N. Dimitratos, P. Wells, E. Gibson, W. Jones, C. Brookes, D. Morgan and G. Lalev, Pd/ZnO catalysts for direct CO2 hydrogenation to methanol, J. Catal., 2016, 343, 133–146 CrossRef.
- J. Xu, X. Su, X. Liu, X. Pan, G. Pei, Y. Huang, X. Wang, T. Zhang and H. Geng, Methanol synthesis from CO2 and H2 over Pd/ZnO/Al2O3: Catalyst structure dependence of methanol selectivity, Appl. Catal., A, 2016, 514, 51–59 CrossRef.
- S. E. Collins, J. J. Delgado, C. Mira, J. J. Calvino, S. Bernal, D. L. Chiavassa, M. A. Baltanás and A. L. Bonivardi, The role of Pd–Ga bimetallic particles in the bifunctional mechanism of selective methanol synthesis via CO2 hydrogenation on a Pd/Ga2O3 catalyst, J. Catal., 2012, 292, 90–98 CrossRef.
- T. P. Araújo, J. Morales-Vidal, G. Giannakakis, C. Mondelli, H. Eliasson, R. Erni, J. A. Stewart, S. Mitchell, N. López and J. Pérez-Ramírez, Reaction-Induced Metal-Metal Oxide Interactions in Pd-In2O3/ZrO2 Catalysts Drive Selective and Stable CO2 Hydrogenation to Methanol, Angew. Chem., Int. Ed., 2023, 62, e202306563 CrossRef.
- T. P. Araújo, A. Shah, C. Mondelli, J. A. Stewart, D. Curulla Ferré and J. Pérez-Ramírez, Impact of hybrid CO2-CO feeds on methanol synthesis over In2O3-based catalysts, Appl. Catal., B, 2021, 285, 119878 CrossRef.
- T. Pinheiro Araújo, C. Mondelli, M. Agrachev, T. Zou, P. O. Willi, K. M. Engel, R. N. Grass, W. J. Stark, O. V. Safonova, G. Jeschke, S. Mitchell and J. Pérez-Ramírez, Flame-made ternary Pd-In2O3-ZrO2 catalyst with enhanced oxygen vacancy generation for CO2 hydrogenation to methanol, Nat. Commun., 2022, 13, 5610 CrossRef.
- K. Sun, C. Shen, R. Zou and C.-j. Liu, Highly active Pt/In2O3-ZrO2 catalyst for CO2 hydrogenation to methanol with enhanced CO tolerance: The effects of ZrO2, Appl. Catal., B, 2023, 320, 122018 CrossRef.
- A. Parastaev, V. Muravev, E. H. Osta, T. F. Kimpel, J. F. M. Simons, A. J. F. van Hoof, E. Uslamin, L. Zhang, J. J. C. Struijs, D. B. Burueva, E. V. Pokochueva, K. V. Kovtunov, I. V. Koptyug, I. J. Villar-Garcia, C. Escudero, T. Altantzis, P. Liu, A. Béché, S. Bals, N. Kosinov and E. J. M. Hensen, Breaking structure sensitivity in CO2 hydrogenation by tuning metal–oxide interfaces in supported cobalt nanoparticles, Nat. Catal., 2022, 5, 1051–1060 CrossRef.
- H. Zhou, Z. Chen, A. V. López, E. D. López, E. Lam, A. Tsoukalou, E. Willinger, D. A. Kuznetsov, D. Mance, A. Kierzkowska, F. Donat, P. M. Abdala, A. Comas-Vives, C. Copéret, A. Fedorov and C. R. Müller, Engineering the Cu/Mo2CTx (MXene) interface to drive CO2 hydrogenation to methanol, Nat. Catal., 2021, 4, 860–871 CrossRef.
- J. Hu, L. Yu, J. Deng, Y. Wang, K. Cheng, C. Ma, Q. Zhang, W. Wen, S. Yu, Y. Pan, J. Yang, H. Ma, F. Qi, Y. Wang, Y. Zheng, M. Chen, R. Huang, S. Zhang, Z. Zhao, J. Mao, X. Meng, Q. Ji, G. Hou, X. Han, X. Bao, Y. Wang and D. Deng, Sulfur vacancy-rich MoS2 as a catalyst for the hydrogenation of CO2 to methanol, Nat. Catal., 2021, 4, 242–250 CrossRef.
- G. Bonura, M. Cordaro, C. Cannilla, F. Arena and F. Frusteri, The changing nature of the active site of Cu-Zn-Zr catalysts for the CO2 hydrogenation reaction to methanol, Appl. Catal., B, 2014, 152–153, 152–161 CrossRef.
- X. Jiang, N. Koizumi, X. Guo and C. Song, Bimetallic Pd–Cu catalysts for selective CO2 hydrogenation to methanol, Appl. Catal., B, 2015, 170–171, 173–185 CrossRef.
- X. Jiang, X. Wang, X. Nie, N. Koizumi, X. Guo and C. Song, CO2 hydrogenation to methanol on Pd-Cu bimetallic catalysts: H2/CO2 ratio dependence and surface species, Catal. Today, 2018, 316, 62–70 CrossRef.
- X. Jiang, X. Nie, X. Wang, H. Wang, N. Koizumi, Y. Chen, X. Guo and C. Song, Origin of Pd-Cu bimetallic effect for synergetic promotion of methanol formation from CO2 hydrogenation, J. Catal., 2019, 369, 21–32 CrossRef.
- X. Jiang, Y. Jiao, C. Moran, X. Nie, Y. Gong, X. Guo, K. S. Walton and C. Song, CO2 hydrogenation to methanol on PdCu bimetallic catalysts with lower metal loadings, Catal. Commun., 2019, 118, 10–14 CrossRef.
- F. Lin, X. Jiang, N. Boreriboon, Z. Wang, C. Song and K. Cen, Effects of supports on bimetallic Pd-Cu catalysts for CO2 hydrogenation to methanol, Appl. Catal., A, 2019, 585, 117210 CrossRef.
- J. Díez-Ramírez, J. A. Díaz, P. Sánchez and F. Dorado, Optimization of the Pd/Cu ratio in Pd-Cu-Zn/SiC catalysts for the CO2 hydrogenation to methanol at atmospheric pressure, J. CO2 Util., 2017, 22, 71–80 CrossRef.
- E. C. Kohlrausch, H. A. Centurion, R. W. Lodge, X. Luo, T. Slater, M. J. L. Santos, S. Ling, V. R. Mastelaro, M. J. Cliffe, R. V. Goncalves and J. Alves Fernandes, A high-throughput, solvent free method for dispersing metal atoms directly onto supports, J. Mater. Chem. A, 2021, 9, 26676–26679 RSC.
- J. Pinto, A. Weilhard, L. T. Norman, R. W. Lodge, D. M. Rogers, A. Gual, I. Cano, A. N. Khlobystov, P. Licence and J. Alves Fernandes, Unravelling synergistic effects in bi-metallic catalysts: deceleration of palladium–gold nanoparticle coarsening in the hydrogenation of cinnamaldehyde, Catal. Sci. Technol., 2023, 13, 4082–4091 RSC.
- I. Cano, A. Weilhard, C. Martin, J. Pinto, R. W. Lodge, A. R. Santos, G. A. Rance, E. H. Åhlgren, E. Jónsson, J. Yuan, Z. Y. Li, P. Licence, A. N. Khlobystov and J. Alves Fernandes, Blurring the boundary between homogenous and heterogeneous catalysis using palladium nanoclusters with dynamic surfaces, Nat. Commun., 2021, 12, 4965 CrossRef.
- E. C. Kohlrausch, S. Ghaderzadeh, G. N. Aliev, I. Popov, F. Saad, E. Alharbi, Q. M. Ramasse, G. A. Rance, M. Danaie, M. Thangamuthu, M. Young, R. Plummer, D. J. Morgan, W. Theis, E. Besley, A. N. Khlobystov and J. Alves Fernandes, One-Size-Fits-All: A Universal Binding Site for Single-Layer Metal Cluster Self-Assembly, Adv. Sci., 2025, e08034 CrossRef.
- Y. Pan, J. Wang, Z. Lu, R. Wang and Z. Xu, A review on the application of magnetron sputtering technologies for solid oxide fuel cell in reduction of the operating temperature, Int. J. Hydrogen Energy, 2024, 50, 1179–1193 CrossRef.
- E. Naughton, E. C. Kohlrausch, J. Alves Fernandes and J. A. Sullivan, BiVO4-Based Systems Magnetron Sputtered with Silver Nanoparticles for the Artificial Photosynthesis Reaction, Sustainable Chem., 2025, 6, 1–16 Search PubMed.
- L. R. Smith, E. C. Kohlrausch, K. J. Aggett, Y. Chen, I. E. Gow, A. Weilhard, L. T. Norman, W. Theis, D. J. Morgan, L. Bailey, A. N. Khlobystov, J. Alves Fernandes and G. J. Hutchings, Direct Formation of the Atomic Pd-ZnO Interface by Magnetron Sputtering Primed for Methanol Production from CO2, ACS Catal., 2025, 15, 15502–15508 CrossRef CAS.
- F. Romeggio, J. F. Schouenborg, P. C. K. Vesborg, O. Hansen, J. Kibsgaard, I. Chorkendorff and C. D. Damsgaard, Magnetron Sputtering of Pure δ-Ni5Ga3 Thin Films for CO2 Hydrogenation, ACS Catal., 2024, 14, 12592–12601 CrossRef CAS.
- T. S. Galhardo, A. H. Braga, B. H. Arpini, J. Szanyi, R. V. Goncalves, B. F. Zornio, C. R. Miranda and L. M. Rossi, Optimizing Active Sites for High CO Selectivity during CO2 Hydrogenation over Supported Nickel Catalysts, J. Am. Chem. Soc., 2021, 143, 4268–4280 CrossRef CAS PubMed.
- I. Popov, S. Ghaderzadeh, E. C. Kohlrausch, L. T. Norman, T. J. A. Slater, G. N. Aliev, H. Alhabeadi, A. Kaplan, W. Theis, A. N. Khlobystov, J. A. Fernandes and E. Besley, Chemical Kinetics of Metal Single Atom and Nanocluster Formation on Surfaces: An Example of Pt on Hexagonal Boron Nitride, Nano Lett., 2023, 23, 8006–8012 CrossRef CAS.
- A. Weilhard, I. Popov, E. C. Kohlrausch, G. N. Aliev, L. S. Blankenship, L. T. Norman, S. Ghaderzadeh, L. Smith, M. Isaacs, J. O'Shea, A. E. Lanterna, W. Theis, D. Morgan, G. J. Hutchings, E. Besley, A. N. Khlobystov and J. Alves Fernandes, A descriptor guiding the selection of catalyst supports for ammonia synthesis, Chem. Sci., 2025, 16, 4851–4859 RSC.
- J. Díez-Ramírez, F. Dorado, A. R. de la Osa, J. L. Valverde and P. Sánchez, Hydrogenation of CO2 to Methanol at Atmospheric Pressure over Cu/ZnO Catalysts: Influence of the Calcination, Reduction, and Metal Loading, Ind. Eng. Chem. Res., 2017, 56, 1979–1987 CrossRef.
- X. Dong, F. Li, N. Zhao, F. Xiao, J. Wang and Y. Tan, CO2 hydrogenation to methanol over Cu/ZnO/ZrO2 catalysts prepared by precipitation-reduction method, Appl. Catal., B, 2016, 191, 8–17 CrossRef CAS.
- S. A. Kondrat, P. J. Smith, P. P. Wells, P. A. Chater, J. H. Carter, D. J. Morgan, E. M. Fiordaliso, J. B. Wagner, T. E. Davies, L. Lu, J. K. Bartley, S. H. Taylor, M. S. Spencer, C. J. Kiely, G. J. Kelly, C. W. Park, M. J. Rosseinsky and G. J. Hutchings, Stable amorphous georgeite as a precursor to a high-activity catalyst, Nature, 2016, 531, 83–87 CrossRef CAS.
- P. J. Smith, S. A. Kondrat, P. A. Chater, B. R. Yeo, G. M. Shaw, L. Lu, J. K. Bartley, S. H. Taylor, M. S. Spencer, C. J. Kiely, G. J. Kelly, C. W. Park and G. J. Hutchings, A new class of Cu/ZnO catalysts derived from zincian georgeite precursors prepared by co-precipitation, Chem. Sci., 2017, 8, 2436–2447 RSC.
- P. Steiner and S. Hüfner, Impurity d-bands and core level binding energy shifts in dilute Cu, Ag, Au and Pd alloys, Solid State Commun., 1982, 41, 619–622 CrossRef CAS.
- S. Liu, Y. Li, N. Ta, Y. Zhou, Y. Wu, M. Li, S. Miao and W. Shen, Fabrication of palladium-copper nanoparticles with controllable size and chemical composition, J. Colloid Interface Sci., 2018, 526, 201–206 CrossRef CAS PubMed.
- S. Hu, L. Scudiero and S. Ha, Electronic effect on oxidation of formic acid on supported Pd–Cu bimetallic surface, Electrochim. Acta, 2012, 83, 354–358 CrossRef CAS.
- C. Q. Sun, Y. Wang, Y. G. Nie, B. R. Mehta, M. Khanuja, S. M. Shivaprasad, Y. Sun, J. S. Pan, L. K. Pan and Z. Sun, Interface quantum trap depression and charge polarization in the CuPd and AgPd bimetallic alloy catalysts, Phys. Chem. Chem. Phys., 2010, 12, 3131–3135 RSC.
- L. Wang, J.-J. Zhai, K. Jiang, J.-Q. Wang and W.-B. Cai, Pd–Cu/C electrocatalysts synthesized by one-pot polyol reduction toward formic acid oxidation: Structural characterization and electrocatalytic performance, Int. J. Hydrogen Energy, 2015, 40, 1726–1734 CrossRef CAS.
- L. Pielsticker, I. Zegkinoglou, Z.-K. Han, J. J. Navarro, S. Kunze, O. Karslıoğlu, S. V. Levchenko and B. Roldan Cuenya, Crystallographic Orientation Dependence of Surface Segregation and Alloying on PdCu Catalysts for CO2 Hydrogenation, J. Phys. Chem. Lett., 2021, 12, 2570–2575 CrossRef CAS PubMed.
- J. Noborikawa, J. Lau, J. Ta, S. Hu, L. Scudiero, S. Derakhshan, S. Ha and J. L. Haan, Palladium-Copper Electrocatalyst for Promotion of Oxidation of Formate and Ethanol in Alkaline Media, Electrochim. Acta, 2014, 137, 654–660 CrossRef CAS.
- M. Yang, M. Shen, J. Wang, J. Wen, M. Zhao, J. Wang and W. Wang, Pd-Supported Interaction-Defined Selective Redox Activities in Pd−Ce0.7Zr0.3O2−Al2O3 Model Three-Way Catalysts, J. Phys. Chem. C, 2009, 113, 12778–12789 CrossRef CAS.
- Y. Zhang, Y. Cai, Y. Guo, H. Wang, L. Wang, Y. Lou, Y. Guo, G. Lu and Y. Wang, The effects of the Pd chemical state on the activity of Pd/Al2O3 catalysts in CO oxidation, Catal. Sci. Technol., 2014, 4, 3973–3980 RSC.
- J. Shan, G. Giannakakis, J. Liu, S. Cao, M. Ouyang, M. Li, S. Lee and M. Flytzani-Stephanopoulos, PdCu Single Atom Alloys for the Selective Oxidation of Methanol to Methyl Formate at Low Temperatures, Top. Catal., 2020, 63, 618–627 CrossRef CAS.
- P. J. Berlowitz and D. W. Goodman, Chemisorption of ultrathin palladium layers on tungsten(110) and tungsten(100): adsorption of hydrogen and carbon monoxide, Langmuir, 1988, 4, 1091–1095 CrossRef CAS.
- J. Wang, H. Liu, T. Wang, Y. Xi, P. Sun and F. Li, Boosting CO2 hydrogenation to methanol via Cu-Zn synergy over highly dispersed Cu,Zn-codoped ZrO2 catalysts, Catal. Today, 2023, 410, 205–214 CrossRef.
- N. D. Nielsen, T. E. L. Smitshuysen, C. D. Damsgaard, A. D. Jensen and J. M. Christensen, Characterization of oxide-supported Cu by infrared measurements on adsorbed CO, Surf. Sci., 2021, 703, 121725 CrossRef.
- N.-Y. Topsøe and H. Topsøe, FTIR studies of dynamic surface structural changes in Cu-based methanol synthesis catalysts, J. Mol. Catal. A: Chem., 1999, 141, 95–105 CrossRef.
- B. Xie, R. J. Wong, T. H. Tan, M. Higham, E. K. Gibson, D. Decarolis, J. Callison, K.-F. Aguey-Zinsou, M. Bowker, C. R. A. Catlow, J. Scott and R. Amal, Synergistic ultraviolet and visible light photo-activation enables intensified low-temperature methanol synthesis over copper/zinc oxide/alumina, Nat. Commun., 2020, 11, 1615 CrossRef PubMed.
- J. Ruiz Esquius, H. Bahruji, S. H. Taylor, M. Bowker and G. J. Hutchings, CO2 Hydrogenation to CH3OH over PdZn Catalysts, with Reduced CH4 Production, ChemCatChem, 2020, 12, 6024–6032 CrossRef.
- N. Lawes, K. J. Aggett, L. R. Smith, T. J. A. Slater, M. Dearg, D. J. Morgan, N. F. Dummer, S. H. Taylor, G. J. Hutchings and M. Bowker, Zn Loading Effects on the Selectivity of PdZn Catalysts for CO2 Hydrogenation to Methanol, Catal. Lett., 2024, 154, 1603–1610 CrossRef.
- F. Brix, V. Desbuis, L. Piccolo and É. Gaudry, Tuning Adsorption Energies and Reaction Pathways by Alloying: PdZn versus Pd for CO2 Hydrogenation to Methanol, J. Phys. Chem. Lett., 2020, 11, 7672–7678 CrossRef PubMed.
| This journal is © The Royal Society of Chemistry 2025 |