
 Open Access Article
 This Open Access Article is licensed under a Creative Commons Attribution-Non Commercial 3.0 Unported Licence
Mass spectrometric imaging of organic and metallic metabolites by plasmon-induced interfacial charge-transfer transition (PICTT) on Au sputtered ITO slides†
Shao
Chang§
a,
Xin
Zhou§
a,
Anji
Gao‡§
bc,
Yixiang
Luo
a,
Yujia
Shan
d,
Lin
Zhang
e,
Zhengwei
Gui
e,
Xingchen
Huang
a,
Xiaoyuan
Hu
a,
Tianci
Huo
a,
Linhui
Liu
d and
Hongying
Zhong
 *a
*a
aState Key Laboratory of Featured Metal Materials and Life-cycle Safety for Composite Structures, College of Life Science and Technology, Medical College of Guangxi University, Center for Instrumental Analysis, Guangxi University, Nanning, Guangxi 530004, P. R. China. E-mail: hyzhong@gxu.edu.cn
bInnovation Academy for Precision Measurement Science and Technology, Chinese Academy of Science, Wuhan 430071, P. R. China
cUniversity of Chinese Academy of Science, Beijing 100049, P. R. China
dSchool of Computer Science, National Key Laboratory of Green Pesticide, International Joint Research Center for Intelligent Biosensor Technology and Health, College of Chemistry, Central China Normal University, Wuhan, Hubei 430079, P. R. China
eTongji Medical College, Huazhong University of Science and Technology, Wuhan, Hubei 430030, P. R. China
First published on 2nd June 2025
Abstract
Protonation/deprotonation is the major ionization mechanism of organic molecules in current electrospray ionization (ESI) and matrix assisted laser desorption ionization mass spectrometric (MALDI MS) imaging. But cellular complexities are far beyond protonated or deprotonated organic molecules. There are tremendous endogenous organic and metallic metabolites regulating oxidation–reduction homeostasis that cannot be protonated or deprotonated. We describe an electron-driven ionization paradigm for mass spectrometric imaging of organic and metallic metabolites based on the charge and energy flow at the plasmonic metal–molecule interface. Enhanced plasmonic electron transfer was observed on Au sputtered ITO glass slides that were made with a physical vapor deposition approach. Plasmon-induced interfacial charge-transfer transition (PICTT) enables the decay of plasmons by direct excitation of electrons from Au atoms to strongly coupled electron receptors in tissue sections that are blotted on Au sputtered ITO slides. The highly reactive plasmonic hot electrons facilitate not only the mass spectrometric imaging of endogenous organic metabolites but also the in situ surface plasmon-driven chemical reactions that can generate coordinative species for the visualization of endogenous metal ions. Beyond the biological application, the PICTT MS technique provides a way to tackle with the nature of electronic excitations at the plasmon–molecule interface that has been challenging because of the lack of a suitable experimental tool to directly monitor the outcomes of the interaction of the electron with an adsorbate.
Introduction
Bright-field imaging of a regular optical microscope with a field of view of a few millimeters is a morphology-based technique that has been widely used in histopathological assessment and clinical diagnosis.1–3 In this technique, nucleic acids or cytoplasm and the extracellular matrix are stained with haematoxylin and eosin (H&E), respectively, to unravel different types of cells and their morphological changes.4–6 The high morphological similarities of different cells are challenging for the identification of abnormal cells and may lead to discordant conclusions among different pathologists.7–9 These difficulties have driven the development of alternative staining-free techniques in histopathology, including photoacoustic microscopy (PAM),10–12 phase detection microscopy (PDM)13–15 and stimulated Raman scattering microscopy (SRSM),16–18 as a result of advancement of modern laser technologies. PAM and PDM are ensemble-averaged techniques that represent the overall optical, thermal, elastic, morphological and mechanical properties of objects.19–21 In contrast, SRSM has molecular specificities dependent on vibrational motions of chemical bonds of molecules.22–24 However, the small field of view makes it still difficult to localize the boundary between normal and diseased regions by using these microscopic techniques.Mass spectrometric (MS) imaging has emerged as a new approach that can provide not only molecular identities (including accurate molecular weights, elemental compositions and isotopic features) but also spatial distributions of various molecules, which can clearly classify precancerous, cancerous and normal regions in tissue slices.25–27 It generates a color-contrast image with a wide field of view up to several centimeters in which different colors and intensities represent different species and quantities, to aid digitalized histopathological analysis.28–30 DESI (desorptive electrospray ionization)31–33 and MALDI (matrix-assisted laser desorption ionization)34–36 are two representative mass spectrometric techniques that utilize either a liquid solvent beam or a laser beam to scan across tissue slices. In nature, both DESI and MALDI are based on the non-specific protonation/deprotonation mechanism by which neutral molecules are converted into positive or negative ions. Non-protonated and non-deprotonated organic molecules and inorganic metal ions with various redox activities that are crucial for spatiotemporal regulation of oxidation–reduction homeostasis cannot be identified. The broad diversity of composition of biological systems requires a different technique.
We herein describe a photoelectron-driven ionization paradigm for reactive mass spectrometric imaging of organic and metallic metabolites. Images are acquired from Au nano-structural ultrathin films that are prepared by atomic sputtering deposition on simple ITO glass slides. It takes advantage of plasmonic hot electron transfer for specific ionization and localization with high spatial resolution. Nanocrystalline Au thin films have presented enormous scientific interest because of the attractive novel surface features and quantum size properties.37,38 By blotting tissue slices on Au sputtered ITO glass slides, we aimed to achieve enhanced hot electron transfer by plasmon-induced interfacial charge-transfer transition (PICTT) that directly excites electrons from Au atoms to strongly coupled electron receptors. Transfer of photoelectrons to those molecules with a specific reduction potential is independent of the heating of the laser beam. Then, heating-induced co-evaporation and co-ionization of nearby co-existing molecules in regular MALDI MS are eliminated, which enables high spatial resolution. The highly reactive plasmonic electrons facilitate the mass spectrometric imaging of not only organic metabolites but also metal ions through in situ surface chemical reactions that can generate coordinative species for the evaporation of metal ions. The PICTT MS technique has been applied to the imaging of brain slices of a 4T1 breast tumor-bearing mouse.
It should be noted that the charge and energy flow at the plasmonic metal–molecule interface is central to the energy conversion from light illumination to chemical reactions. Understanding the plasmonic excitations of adsorbed molecules has been challenging. Although numerous electronic and surface effects occurring at the plasmonic metal–molecule interface have been observed, including chemical interface damping (CID), Landau damping, or plasmonic vibrational pumping, as well as adsorbate-induced surface resistivity and desorption induced by electronic transitions (DIET),39 direct experimental evidence is needed to delineate the roles of all these effects in charge and energy flow at the plasmonic metal–molecule interface. Mass spectrometry is a mass and charge (m/z)-dependent technique in which positive or negative ions can be detected. With the set-in equipped Nd3+:YAG pulsed laser (355 nm and 3 ns pulse width), it is convenient to detect the products of charge transfer and plasmon-driven chemical reactions upon laser illumination. It is a robust tool to monitor various outcomes that stem from interactions of electrons and adsorbates, such as plasmonic chemical reactions, electronic and vibrational excitation of adsorbed molecules or desorption from plasmonic metal surfaces.
Experimental
Sample preparation for mass spectrometric imaging
Reagents and apparatuses are described in Notes S1.† All animal procedures were performed in accordance with the Guidelines for Care and Use of Laboratory Animals of Guangxi University and approved by the Animal Ethics Committee of Guangxi University prior to the research. The code of the related animal experimental ethical inspection form of Guangxi University is GXU-2022-303. Preparation of the mouse brain is described in Notes S2.† ITO glass slides were sputtered with Au nanoparticles. Briefly, the ITO glass slide was put in the Cressington Sputter Coater 108auto (Watford, UK), in which a cool, fine-grain, auto-sputtering was achieved with a very efficient DC magnetron head. The sputtering current, time, and pressure of Ar gas and the distance between the sample plate and the Au target were set as 10 mA, 40 s, 0.08 mbar and 4 cm, respectively. According to the operation manual provided by the manufacturer, the deposition rate was 1.2 nm s−1 under these conditions. When the current, the distance between the Au target and the ITO sample plate as well as the gas pressure are fixed, the sputtering time determines the thickness of the Au film. Considering the size distribution, plasmonic efficiency of resultant nanoparticles and consumption of Au, the deposition time was eventually decided as 40 s that offers a uniform coating with a thickness around 50 nm. Sputtering is a physical vapor deposition process at the atomic level, in which collisions cause atoms near the surface to expel. The expelled atoms were then deposited on the ITO glass slides. Electron microscopic images were acquired on a Hitachi SU8200 (Tokyo, Japan) scanning electron microscope. They show the gold layer growth to be running over the ITO glass slides uniformly.Mass spectrometric imaging
Mass spectrometric analysis and bio-imaging were performed on a Bruker Daltonics timsTOF fleX MALDI 2 (Billerica, USA) mass spectrometer. It was calibrated with an ESI-L low concentration tuning mix in negative ion mode ranging from m/z 50 to 1300 (Notes S3†). Fig. S1† shows a representative calibration result. The mass error is usually less than 0.3 ppm. The mass spectrometer is equipped with two Nd3+:YAG high repetition laser heads (355 nm and 266 nm), and the laser beam size was set at ∼5 μm. When only the laser at 355 nm was turned on, the laser influx, pulse width and fire rate were set as 70%, 3 ns and 10![[thin space (1/6-em)]](https://www.rsc.org/images/entities/char_2009.gif) 000 Hz, respectively. When the second ultraviolet laser at 266 nm was also turned on along with the first laser at 355 nm, the fire rate was switched from 10000 Hz to 1000 Hz. For simple mass spectrometric analysis of standard free fatty acids, lipids or homogenized brain tissues (Notes S4†), the samples were mixed with equal volumes of 9-AA solution before spotting on the Au sputtered ITO glass slide. For bio-imaging of tissue slices, tissue slices were blotted on the thin film of Au nanoparticles that were sputtered on the ITO glass slides. Then tissue slices were sprayed with the solution of 9-AA. All mass spectrometric images were acquired from brain tissue slices of a 4T1 tumor-bearing BALB/c adult female nude mouse weighing 15–17 g. The spraying of auxiliary matrix materials is described in Notes S5.† The pixel size was set as 20 μm × 20 μm, and laser shots for each pixel were set as 200. Mass spectrometric data sets were processed with SCiLS Lab software (Bruker Daltonics, USA) for the reconstruction of images. Different colors represent different intensities of ions in which the highest and lowest intensities are shown as white and black colors, respectively.
000 Hz, respectively. When the second ultraviolet laser at 266 nm was also turned on along with the first laser at 355 nm, the fire rate was switched from 10000 Hz to 1000 Hz. For simple mass spectrometric analysis of standard free fatty acids, lipids or homogenized brain tissues (Notes S4†), the samples were mixed with equal volumes of 9-AA solution before spotting on the Au sputtered ITO glass slide. For bio-imaging of tissue slices, tissue slices were blotted on the thin film of Au nanoparticles that were sputtered on the ITO glass slides. Then tissue slices were sprayed with the solution of 9-AA. All mass spectrometric images were acquired from brain tissue slices of a 4T1 tumor-bearing BALB/c adult female nude mouse weighing 15–17 g. The spraying of auxiliary matrix materials is described in Notes S5.† The pixel size was set as 20 μm × 20 μm, and laser shots for each pixel were set as 200. Mass spectrometric data sets were processed with SCiLS Lab software (Bruker Daltonics, USA) for the reconstruction of images. Different colors represent different intensities of ions in which the highest and lowest intensities are shown as white and black colors, respectively.
A computational tool for the comparison of organic metabolites and metal ions in cancerous and normal tissue regions
Mass spectrometric data were uploaded to search against the human metabolite database (HMDB). All m/z values were either directly subjected to searching databases or processed for the losses of H+/H atoms (1.0078) before database searching. A computer program called Comparedoxome v1.0 was developed to analyze the output results of HMDB searching. Comparedoxome aims to compare the normal and cancerous redoxomic metabolites. It can list the species that only exist in normal or cancerous samples. Comparedoxome is written with Python 3.11. It can be freely run or downloaded from ESI Notes S6.†Results and discussion
Hot electron transfer-directed ionization and decay of gold plasmons
Mass spectrometry is based on the detection of gaseous ions with either positive or negative charges. The surface plasmon resonance (SPR) of metallic nanostructures has been applied to photocatalysis,40 photovoltaics,41 and photodetectors42 by increasing light absorption43 or plasmon induced charge transfer from the excited metal to adsorbed molecules.44,45 It suggests the possible utilization of plasmonic metal nanostructures as light absorbers that can generate hot electrons for in situ soft ionization of redox active species in mass spectrometry. By using 9-AA as an example, Fig. 1 illustrates the three ways for photoelectron transfer, and the computational method is described in Notes S7.†Fig. 1(A) presents the conventional plasmon induced hot-electron transfer (PHET) mechanism, by which plasmons decay into hot electron–hole pairs with a broad distribution of initial electron and hole energies within the metal via Landau damping in a time scale of a few to tens of femtoseconds.46 Rapid electron–electron scattering in a time scale of hundreds of femtoseconds is the major problem that limits the efficiency of PHET.47 The alternative approach is the direct metal-to-molecule interfacial charge transfer transition (DICTT) shown in Fig. 1(B), in which light illumination directly excites an electron from the metal to the lowest unoccupied molecular orbital (LUMO) of adsorbate molecules.48 Such interfacial transitions are usually very weak due to inefficient light-harvest. Enhanced hot electron transfer is expected to be achieved by the combination of strong light absorbing power of plasmonic transitions with the superior charge-separation properties of the DICTT mechanism.49 It has been reported that decreasing plasmonic particle size can increase the rate of hot electron transfer and reduce the barrier of hot electron transfer.50 In this work, Au nano-structural ultrathin films are developed by atomic sputtering deposition on ITO glass slides. Fig. 1(C) illustrates the plasmon-induced metal-to-molecule interfacial charge transfer transition (PICTT) pathway on such ultrathin Au sputtered films for mass spectrometric imaging. PICTT enables the decay of plasmons by direct excitation of electrons from metal atoms to the lowest unoccupied molecular orbital (LUMO) of strongly coupled electron receptors in tissue sections that are blotted on the Au sputtered ITO thin film. Fig. S2(A) and (B)† present the scanning electron microscopy (SEM) images of Au sputtered ITO glass slides. They show that Au nanoparticles deposited within 40 s have been uniformly distributed on the ITO glass slide, and the coefficient of variation is about 8%, as shown in Fig. S2(C).† Sizes of nanoparticles are mainly between 10 nm and 100 nm, and 5% nanoparticles are more than 100 nm, as shown in Fig. S2(D).† Plasmonic chemistry is closely related to the sizes of nanoparticles. It has been reported that metal nanoparticles with diameters between 5 nm and 100 nm are most favored for plasmon-driven chemistry, with which the sputtered Au nanoparticles are in accordance.39 Au sputtered ITO slides of about 50 nm size that are deposited within 40 s generate strong signal intensities with the lowest signal-to-noise (S/N) ratio compared with that deposited within 20 s and 60 s, as shown in Fig. S2(E).† Eventually, the deposition time of 40 s was chosen for the downstream experiments. Fig. S3† illustrates the elemental composition of ITO glass slides by energy dispersive X-ray spectroscopy (EDS). | ||
| Fig. 1 Hot electron transfer-driven ionization and the decay of gold plasmon. (A) Plasmon induced hot-electron transfer (PHET). (B) Direct metal-to-molecule interfacial charge transfer transition (DICTT). (C) Plasmon-induced metal-to-molecule interfacial charge transfer transition (PICTT). | ||
Notably, the electron configuration of Au is [Xe] 4f14 5d10 6s1. It is implicated that adding or removing a single electron to or from the Au adatoms should lead to the generation of stable Au− or Au+ ions with fully occupied or empty 6s-derived states. This unique character makes the Au atom a robust internal reference that points to the direction of electron flow. On surfaces, electron transfer and the charge state of adatoms are determined by substrates and co-adsorbates.51 Upon irradiation of a pulsed ultraviolet laser on sputtered Au nanoparticles, plasmonic hot electrons can either transfer to Au atoms and switch neutral Au adatoms to negatively charged Au− ions at m/z 196.9645 (expected at m/z 196.9665; error, 0.0020) in Fig. 2(A) and (B), or transfer to adsorbed organic molecules, depending on reduction potential differences and bias voltages between the sample plate and the aperture. Fig. 2 shows the first mass spectrometric evidence for the transfer of plasmonic hot electrons generated by plasmon decay to gold (Au) atoms themselves. When samples are directly spotted on surfaces of the Au sputtered ITO thin film, neutral molecules are ionized through a PICTT route and converted into radical anions that undergo subsequent electron-driven bond cleavages. In such cases, excited hot electrons transfer to charge deficient atoms of adsorbed molecules with specific reduction potentials. Fig. 2(A) shows the mass spectrum of the negative ion of a standard compound free fatty acid C20:1 resulting from the capture of a hot electron at the C atom of the carboxyl group. The resultant radical anions are highly reactive, and the radical center can initiate the homolytic cleavage of the α-positioned O–H bond, which generates the ion at m/z 309.2784 (error: 0.0002). As for the standard compound phosphatidylglycerol, ions at m/z 773.5339 (error: 0.0006) and m/z 281.2484 (error: 0.0012) are produced from two pathways, respectively, in which hot electrons are captured by either P atom of the phosphate group or C atom of the carboxyl group followed by homolytic cleavage of the C–O bond, as shown in Fig. 2(B). MS spectra of other compounds are listed in Fig. S4.† Clearly, detected acidic metabolites are produced through electron transfer ionization that causes the loss of a H atom instead of a proton. In this case, both the products of electron transfer to plasmonic Au nanoparticles themselves and adsorbed lipids are observed in Fig. 2. The efficiency of hot electron transfer is ascribed to sputtered plasmonic Au nanoparticles. In comparison with general MALDI, C20:1 was used as an example to demonstrate enhanced ionization via plasmonic hot electron transfer, as shown in Fig. S5.† The absolute intensity of C20:1 generated with PICTT MS is about 8 times more than that of general MALDI MS. It is shown that the detection limit of PICTT MS can be down to 10 fmol, and the signal-to-noise ratio (S/N) is about 56.
 | ||
| Fig. 2 PICTT ionization and mass spectra of standard lipids on Au sputtered ITO glass slides. (A) Free fatty acids. (B) Phosphatidylglycerol. | ||
PICTT MS imaging and proton coupled electron transfer
In order to avoid direct laser ablation, an auxiliary material is uniformly sprayed on the tissue slices and co-crystallized with endogenous metabolites for downstream mass spectrometric analysis. When a brain tissue slice is blotted on the Au sputtered ITO glass slides and coated with the auxiliary matrix material, the detection of Au− is determined by differences in reduction potentials and abundances between plasmonic Au nanoparticles and compounds present in local tissue regions. Fig. 3(A) shows the mass spectrometric image of a non-auxiliary matrix coated brain slice “O” of the 4T1 breast tumor-bearing BALB/c adult female nude mouse on a Au sputtered ITO glass slide, which is usually used as a model of brain metastasis of breast cancer. It is noted that Au− ions were detected in the regions of cortex and corpus callosum, meaning that electrons can transfer to Au nanoparticles in the local regions of this brain tissue slice, or the concentration of redox active endogenous metabolites is low in this region. The non-continuous intensities of Au− ions implicate the heterogenous composition that can compete with Au− nanoparticles for electron capture. In contrast, the absence of Au− ions in other regions indicates highly redox active regions that can easily capture hot electrons. The redox signaling regulates various neurological processes such as neurotransmission and homeostasis through specific oxidation/reduction reactions.52 These dissected redox active and inactive regions provide new pieces of experimental evidence for elucidation of redox balance in the brain. | ||
| Fig. 3 PICTT ionization and mass spectrometric imaging on Au sputtered ITO slides. (A) Mass spectrometric imaging of Au− ions alone. (B) Mass spectrometric imaging of Au− ions with a 9-AA auxiliary matrix. (C) Proton-coupled electron transfer to 9-AA and enhanced deprotonation of free fatty acids. (D) Comparison of PICTT MS and MALDI MS imaging of two tissue slices of a 4T1 tumor-bearing BALB/c nude mouse brain. O, X and Y are three adjacent brain slices from the mouse. Theoretical and experimental m/z values are labeled in the top or displayed in the bottom of pictures. | ||
Fig. 3(B) shows the mass spectrometric image of an auxiliary matrix coated brain slice “X” of the 4T1 breast tumor-bearing BALB/c adult female nude mouse on a Au sputtered ITO glass slide. Au− ions were not detected because of the redox activity of abundant 9AA. As shown in Fig. 3(C), the electron acquired by 9-AA is delocalized, which stabilizes the resultant 9-AA radical anions. In the presence of such auxiliary matrix material, there is a proton coupled electron transfer (PCET) that facilitates the deprotonation and detection of organic acids in negative ion mode in addition to hot electron transfer ionization depicted in Fig. 2. The ionization efficiency of acidic metabolites is increased in the PICTT route, which provides stronger signals than regular MALDI MS imaging. Additionally, compared with the non-specific regular protonation/deprotonation-based ionization approach, electron transfer ionization is specific. Chemical and environmental properties of redox active metabolites present in tissue sections may cause differential hot electron transfer, which is associated with redox activities. PICTT MS generates different images than regular MALDI MS because only those metabolites with specific reduction potential can be ionized and detected. This maybe the reason why PICTT MS provides higher spatial resolution than that of regular MALDI, which uses non-specific protonation/deprotonation ionization. Without selectivity, all compounds may be overlapped and the spatial resolution may be destroyed. Notably, in PICTT MS, the reduction of compounds can be affected when the bias voltage between the sample plate and the aperture located in the ion source chamber of the mass spectrometer is adjusted. Electron transfer is also determined by differences in reduction potentials of co-existing compounds. Although redox inactive compounds cannot be ionized through the electron transfer pathway, those compounds can still be detected through the deprotonation pathway if basic auxiliary matrix materials are used. Fig. 3(D) shows the comparison of PICTT MS and MALDI MS images of two adjacent slices of a 4T1 mouse brain. Long chain fatty acids C20:1 and C16:0, phospholipids PG (C36:2) and citrate were used as examples. Because of the dissociation equilibrium, both deprotonated and non-deprotonated species of these acidic metabolites are present. MALDI MS can only detect deprotonated species but PICTT MS can provide additional electron transfer ionization route to those non-deprotonated species. PICTT MS enhances the detection of those acidic metabolites, in particular for those weak acids such as citric acid. PICTT MS imaging of other metabolites is shown in Fig. S6.† It should be noted that the coordination of functional groups of metabolites with nanoparticle surfaces may change plasmonic properties and quench plasmonic electrons. Such features provide a way to sense the presence of such compounds in specific pixels.
PICTT MS imaging of zwitterions
As we know, it is impossible for MALDI MS to detect zwitterions because those species do not have net charges. In contrast, PICTT MS can ionize those species by plasmonic hot electron transfer. Fig. 4(A) illustrates the ionization mechanisms of ions at m/z 300.0386, 213.0062, 225.0064 and 256.9968, which were identified as cinnabarinic acid (expected m/z 300.0382; error: 0.0004 Da), indoxyl sulfate (expected m/z 213.0096; error: 0.0034), quinolin-2-yl hydrogen sulfate (expected m/z 225.0096; error: 0.0034 Da) and hydroxylated quinolin-2-yl hydrogen sulfate (expected m/z 256.9994; error: 0.0026 Da), respectively. As shown in Fig. 4(B), the excitation of electrons from plasmonic Au atoms to the LUMO of adsorbed molecules leads to the generation of negative ions that can be detected with mass spectrometry in negative ion mode. Instead, deprotonated species of those zwitterions were not detected or the detected signals were very low (data not shown). Although electron transfer (ET) can also occur on ITO without sputtered Au atoms upon laser irradiation, the low ionization efficiency causes weaker signals than Au sputtered ITO. Overall, detected ions (n = 806) with intensity counts more than 30000 have been subjected to statistical analysis. Significantly higher intensity ratios of ions were detected on Au-sputtered ITO than on non-sputtered ITO slides at 95% confidence level (P-value: 6 × 10⁻²⁴ < 0.05). Intensity ratios of these ions at m/z 300.0382, 213.0096, 225.0096 and 256.9994 acquired with PICTT on plasmonic Au nanoparticles compared to that of ET on ITO are 1.2, 1.3, 1.3 and 1.2, respectively. Notably, in current MALDI MS, even if those ions resulting from electron transfer are detected, those ions cannot be identified due to the lack of recognition of such an electron transfer ionization mechanism. Cinnabarinic acid is the endogenous metabolite of the tryptophan–kynurenine pathway associated with brain function and neurotransmission. It activates metabotropic glutamate (mGlu) receptors53 as well as the NF-kappaB pathway by binding with the aryl hydrocarbon receptor (AhR).54 Reduced cinnabarinic acid levels in the prefrontal cortex (PFC) were reported in pathophysiology of schizophrenia.55Fig. 4(B) reveals the spatial distribution of indoxyl sulfate that was also reported as the agonist of the aryl hydrocarbon receptor (AhR) by using PICTT MS imaging. It has been found that PICTT MS imaging has the resolution that can clearly distinguish the spatial distribution of cinnabarinic acid and indoxyl sulfate as well as the slight locational changes of quinolin-2-yl hydrogen sulfate caused by hydroxylation. Although the function of quinolin-2-yl hydrogen sulfate and its hydroxylation remains unknown, their co-localization facilitates the understanding of a concerted redoxome. In contrast, regular MALDI MS is not able to identify zwitterions with no net charges, and images acquired with ET on ITO without plasmonic Au nanoparticles showed lower signals.
 | ||
| Fig. 4 Mass spectrometric imaging of zwitterions in brain sections of the 4T1 tumor-bearing BALB/c nude mouse with a 9-AA auxiliary matrix. (A) Structures of representative zwitterions. (B) PICTT MS imaging of a Au sputtered ITO slide or non-Au sputtered ITO slide. X and Y are adjacent tissue slices. | ||
Two-electron transfer ionization of positive ions in PICTT MS imaging
In regular MALDI MS, positive ions can only be detected in positive ion mode. PICTT MS can detect both negative and positive ions in the negative ion mode through multiple electron transfer. There are some positive ions such as phosphatidylcholine (PC or GPCho), as shown in Fig. 5(A), that cannot be detected by protonation/deprotonation-based MALDI MS in negative ion mode. We demonstrate that this proposed technique provides a way to transform those compounds through two-electron transfer. The capture of one hot electron neutralizes positively charged PC and the second hot electron converts the resultant zwitterion into a negative ion at m/z 908.6386 (expected m/z 908.6381; error: 0.0005) that can be detected in the negative ion mode of mass spectrometry. It has been noted that those glycerophosphocholines have various isomers with different combinations of fatty acids with varying lengths and saturation at C1/C2 positions of the glycerol backbone or α-positions of the two furan rings. | ||
| Fig. 5 PICTT two-electron transfer ionization and mass spectrometric imaging of positive PC ions in brain sections of a 4T1 tumor-bearing BALB/c nude mouse in negative ion mode with a 9-AA auxiliary matrix. (A) Two-electron transfer. (B) PICTT MS imaging on Au sputtered ITO slides or MS imaging by electron transfer on ITO slides without plasmonic Au nanoparticles. X and Y are adjacent tissue slices. | ||
The fragment ion at m/z 907.6351 (expected m/z 907.6308; error: 0.0043) resulting from electron-driven homolytic cleavage of the O–H bond verifies the presence of the O–H bond. PICTT MS imaging shows that both the parent ion at m/z 908.6386 and the fragment ion at m/z 907.6351 have exactly the same spatial distribution, as shown in Fig. 5(B). Desaturation causes changes in the locations of ions at m/z 905.6152 and 903.5996. It is shown that PICTT MS imaging can clearly locate the spatial changes caused by sequential desaturations in Fig. 5(B). PICTT MS imaging of other PCs are shown in Fig. S7.† Without plasmonic Au nanoparticles, ET on ITO generates images that are not only weaker but also overlapped. Through simple ET on ITO, images of the ion at m/z 907.6308 and the ion at m/z 905.6152 are almost the same. It can only detect locational changes of the ion at m/z 903.5996 generated by two desaturations.
PICCT MS imaging of negative ions
As for acidic metabolites, there was dissociation equilibrium in which both neutral, dissociated negative species and positive protons co-existed. In regular MALDI MS, negative ions can be directly detected in the negative ion mode. But, in PICTT MS, neutral species can be detected through electron transfer ionization in addition to negative species. Then, PICTT MS provides stronger signals than regular MALDI MS. Glycosphingolipids (GSLs) are ubiquitously expressed carbohydrate derivatives abundant in the nervous system, which contains a ceramide backbone with varying acyl chain and a glycan moiety.56 Various sulfatides are used as examples to demonstrate the capability of PICTT MS for the detection of negative ions. Sulfatides are representative members of the GSL family that account for almost one third of myelin lipids. They have cell type-specific structural variations with different acyl chain lengths and hydroxylations. In physiological conditions, sulfatides are negatively charged because of the dissociation equilibrium. Mass spectrometric analysis of carbohydrate derivatives is challenging because these species are polar, hydrophilic and poorly retained on reversed-phase high-performance liquid chromatography (RP-HPLC) columns coupled with mass spectrometers. PICTT MS provides a way to detect those species without RP-HPLC. Fig. 6 clearly shows the regional specific distributions of a non-hydroxylated and a hydroxylated sulfatide (C38:1) with PICTT MS imaging that are located at m/z 834.5765 and 850.5714, respectively. It is shown that PICTT MS provides stronger signals and better spatial resolution for the detection of locational changes caused by the hydroxylation than that of regular MALDI MS. Activation of the peroxisome proliferator-activated receptor α (PPARα) may increase the expression of sulfatides and promote the migration and invasion of tumors in breast cancer.57 But the function of the hydroxylation of sulfatide remains unknown. PICTT MS also shows the locational changes caused by chain lengths and desaturations such as ions at m/z 890.6391, 888.6235 and 778.5139, while regular MALDI MS provides images with lower signals and resolution. In particular, accumulated psychosine sulfate at m/z 540.2843, a minor compound in normal brain, was found in the brain of the 4T1 breast tumor-bearing BALB/c adult female nude mouse. The accumulation of psychosine sulfatide indicates the insufficient activity of lysosomal galactosyl-ceramidase (GALC) in the breast tumor-bearing mouse, which is the only enzyme capable of hydrolyzing psychosine. Uridine diphosphate galactose/glucose was detected at m/z 565.0472, from which galactose is transferred to ceramides by ceramide galactosyltransferase (UGT8) so as to form galactosyl ceramides (GalCer) and then to sulfate by GalCer sulfotransferase (GST). High UGT8 expression has been thought to be closely related to tumor grade and size in patients with basal breast cancer.58 Uridine diphosphate-N-acetylgalactosamine/glucosamine was detected at m/z 606.0738 with different regional distributions. It is a nucleotide sugar used by glycosyltransferases for the biosynthesis of glycoproteins, sulfatides, cerebrosides and glycoRNA.59–61
 | ||
| Fig. 6 Comparison of PICTT and MALDI MS imaging of negative ions of brain sections of a 4T1 tumor-bearing BALB/c nude mouse on Au sputtered ITO slides or non-Au sputtered ITO slides with a 9-AA auxiliary matrix. | ||
Application of PICTT MS to profile the metabolic redoxome
The brain of a 4T1 breast tumor-bearing mouse and a control normal mouse were homogenized and mixed with 9-AA. The mixtures were spotted on the Au sputtered ITO slide or non-Au sputtered ITO slide, respectively. Detected ions in cancerous or normal mouse brain homogenates are listed in Tables S1 and S2,† respectively. There are 66 metabolites indicated with red color in Table S1,† which were only detected in the brain of the 4T1 breast tumor-bearing mouse. Fig. 7(A) shows the spatial distribution of these 66 metabolites in the brain slices. It was found that these metabolites are mostly enriched in the spinal cord, medulla oblongata, cerebral cortex, leptomeninges, frontal lobe, parietal lobe and hippocampus regions of functional importance. Leptomeningeal metastasis has been diagnosed in breast cancer patients.62 The leptomeninges (LM) are cerebrospinal-fluid-filled tissues surrounding the brain and spinal cord that are involved in various pathologies. It has not been understood how the metastatic invasion occurs in the LM microenvironment that is anatomically and immunologically sequestered with poor nutrients. Recently, the Sipkins research group has exploited neural signaling pathways for bone-to-meninges metastasis that bypasses the blood–brain barrier.63 They found that breast cancer cells can overexpress the cell surface receptor integrin α6 and invade the LM by traversing the outer surface of blood vessels that connect the adjacent vertebral and skull bone marrow with the central nervous system meninges. And then resident meningeal macrophages are stimulated to secrete glial-derived neurotrophic factor (GDNF) for supporting tumor growth. Our experimental results provide the molecular anatomic support for such metastasis from vertebral bone marrow (BM) to leptomeninges (LM). In particular, Fig. 7(B) clearly shows that the invasion course started from the over-production of phospholipids at m/z 716.5211, 727.5263, 742.5370, 749.4991, 762.5058, 766.7367, 772.5835, 851.5792 and 864.5702. This is in accordance with the report that GDNF regulates lipid metabolism and glioma growth.64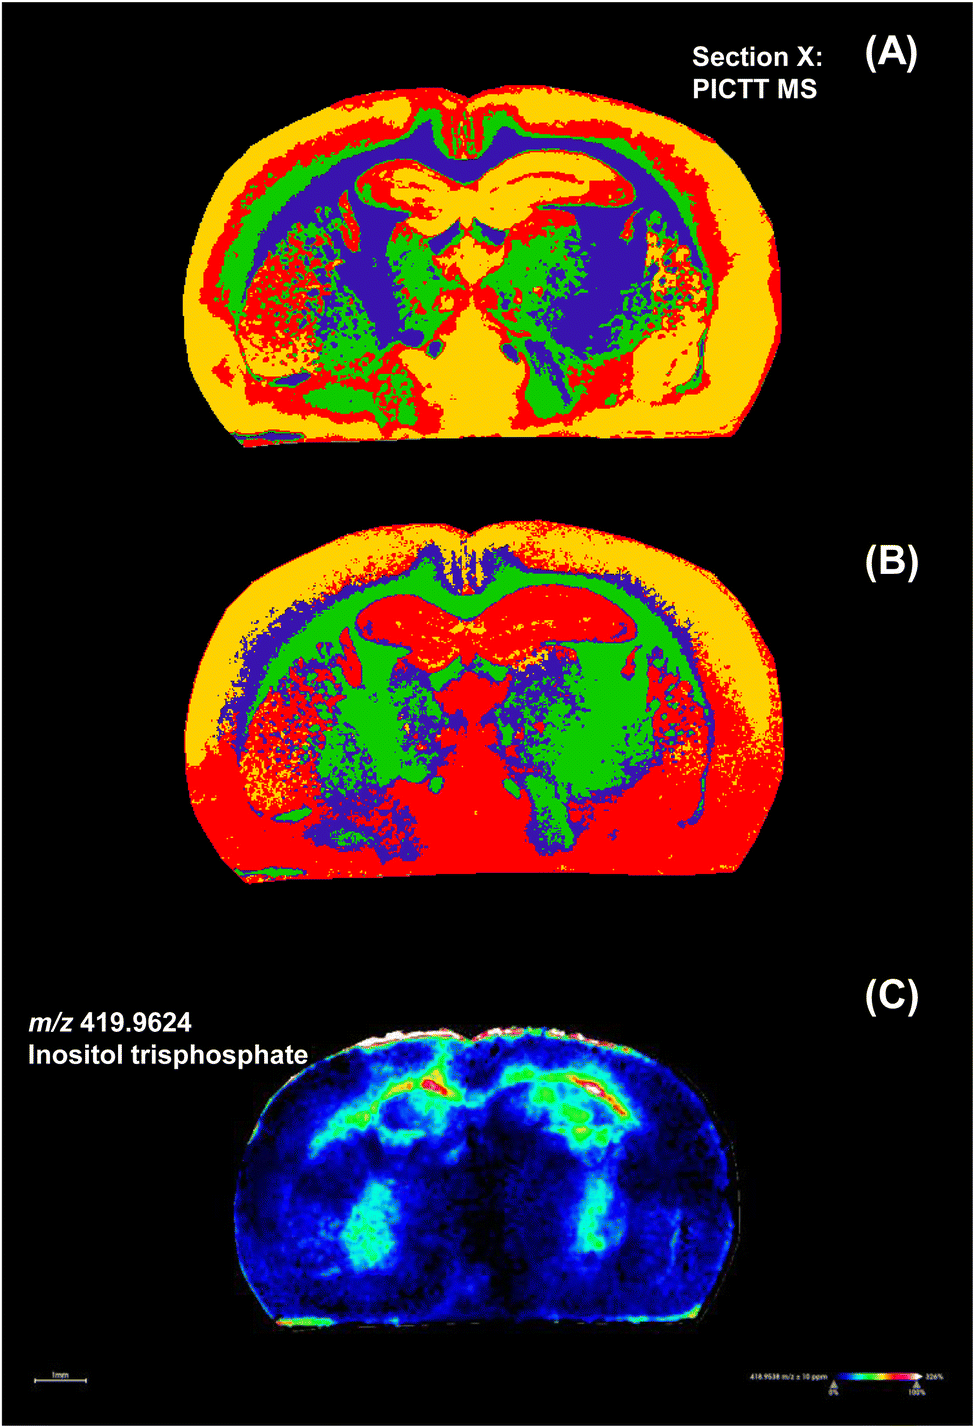 | ||
| Fig. 7 Spatial distribution of ions only detected in the brain of a 4T1 tumor-bearing mouse. (A) Total 66 ions. (B) 9 phospholipids containing odd-numbered fatty acids. The order of averaged intensities of these ions is represented as red, yellow, blue and green, respectively. | ||
Over-produced inositol trisphosphate (IP3) was observed in the brain of the 4T1-tumor-bearing mouse, as shown in Fig. 7(C), which is a second messenger controlling many cellular processes through the generation of internal calcium signals. It has been reported that IP3-dependent nuclear calcium signals regulate angiogenesis and cell motility in triple negative breast cancer.65 And the down-regulation of the IP3 receptor decreases breast cancer cell migration through an oscillatory Ca2+ signal.66 The appearance of IP3 in the brain of the 4T1-tumor-bearing mouse implicates the invasion of the breast tumor to the brain.67
In situ plasmonic chemical reactions and PICTT MS imaging of metal ions
In addition to organic molecules, inorganic metal ions are always present in cells in forms of various metal-binding enzymes or metalloproteins to mediate electron transportation.68,69 Currently, mass spectrometric imaging has been developed mainly for organic molecules. It is still technically challenging for in situ bio-imaging of metal ions. Secondary ion mass spectrometry (SIMS) is a choice.70 But it generates extensive background interferences because it applies energetic primary particles (electrons, ions or photons) to bombard with solid surfaces of samples for ionization and dissociation.71 We take advantage of PICTT MS and develop a plasmonic electron-based soft ionization technique for bio-imaging of metal ions in tissues. By using iohexol as an auxiliary matrix, the illumination of laser pulse (3 ns pulse width, 355 nm) generates iodide ions (Fig. S8†) on Au sputtered ITO slides that can form clusters with various metal ions for mass spectrometric detection. Fig. 8 shows the mass spectrometric imaging of Na+, K+, Ca2+, Cu2+, Fe2+ and Zn2+ ions as well as their isotopes in a brain section of a 4T1 tumor-bearing mouse. There is aberrantly high abundance of these metal ions than that in the normal mouse brain (Fig. S9†), in particular for Na+ and K+ ions. It has been found that voltage-activated sodium channels (VGSCs) are selectively upregulated in metastatic breast cancer to drive Na+ influx, generate action potentials and proceed with propagation.72 Similarly, the expression of the voltage-gated potassium channel is also significantly increased in late stage breast cancer.73 In addition to Na+ and K+, intracellular Ca2+ signaling is a critical factor in breast cancer metastasis. It has been considered as oncogenic markers of breast cancer.74 Although zinc is vital in functions of many proteins for the recognition of specific DNA sequences and regulation of gene transcription, it can be involved in invasive behavior of breast cancer cells. Lots of reports have shown that zinc levels are higher in breast tumors than in normal breast tissues.75 Accordingly, Fig. 8 shows increased levels of Na+, K+, Ca2+, Mg2+ and Zn2+ in the 4T1 tumor-bearing mouse brain. Compared with the normal mouse brain (Fig. S10†), increased transition metal ions such as Fe ions have been observed. But there are no obvious changes in copper ions. By non-covalent coordination with proteins, these transition metals are involved in electron transfer or molecular reduction reactions such as the deactivation of reactive oxygen species (ROS) and mitochondrial energy production. | ||
| Fig. 8 PICTT MS imaging of metal ions and isotopes of a section M of a 4T1 tumor-bearing BALB/c nude mouse on Au sputtered ITO slides with iohexol as an auxiliary matrix. | ||
Conclusions
PICTT MS provides an electron-driven ionization paradigm for mass spectrometric imaging of organic and metallic metabolites. It is based on the plasmon-induced interfacial charge-transfer transition that enables the transfer of plasmonic electrons to strongly coupled redox active species in tissue sections blotted on Au sputtered ITO slides. In combination with the auxiliary matrix material, PICTT MS provides a unique way for simultaneous localization of organic and inorganic metal ions that cannot be protonated or deprotonated in the negative ion mode in current MALDI MS. Highly reactive plasmonic hot electrons are efficient for rapid in situ chemical reactions that can generate coordinative species for mass spectrometric analysis of metal ions. Although photo-induced electron transfer (ET) can also occur on simple ITO slides upon laser irradiation, the ionization efficiency is low without plasmonic Au nanoparticles. PICTT MS paves a new way to tackle with the nature of the electronic excitations at the plasmon–molecule interface because it can directly monitor the outcomes of the interaction of the electron with an adsorbate.Data availability
Data are available upon request.Author contributions
Hongying Zhong developed the original concept, designed the experiments, analyzed the data and wrote the manuscript. Shao Chang, Xin Zhou and Anji Gao performed all experiments. Anji Gao analyzed data, elucidated and drew mechanisms. Shao Chang, Xin Zhou and Anji Gao contributed equally to this work. Yixiang Luo analyzed part of the mass spectrometric data. Yujia Shan developed the computational program Comparedoxome v 1.0. Lin Zhang and Zhengwei Gui were involved in breast tissue analysis. Xincheng Huang, Xiaoyuan Hu and Tianci Huo were involved in mass spectrometric analysis and imaging. Linhui Liu was involved in sample preparation and instrument operation.Conflicts of interest
There are no conflicts to declare.Acknowledgements
The authors thank the final support from the Guangxi Science and Technology Major Program (AA23073019 and AB25069175), National Natural Science Foundation of China (NSFC22474028), Guangxi Natural Science Foundation (2025GXNSFDA069026), as well as research funds of Guangxi University and Central China Normal University.References
- N. Naik, A. Madani, A. Esteva, N. S. Keskar, M. F. Press, D. Ruderman, D. B. Agus and R. Socher, Nat. Commun., 2020, 11, 5727 CrossRef PubMed.
- X. Pan, Y. Lu, R. Lan, Z. Liu, Z. Qin, H. Wang and Z. Liu, Comput. Electr. Eng., 2021, 91, 107038 CrossRef.
- G. Shamai, A. Livne, A. Polónia, E. Sabo, A. Cretu, G. Bar-Sela and R. Kimmel, Nat. Commun., 2022, 13, 6753 CrossRef.
- A. H. Fischer, K. A. Jacobson, J. Rose and R. Zeller, Cold Spring Harb. Protoc., 2008, 5, 4986 CrossRef.
- M. J. Pilling, A. Henderson, J. H. Shanks, M. D. Brown, N. W. Clarke and P. Gardner, Analyst, 2017, 142, 1258–1268 RSC.
- G. Musumeci, J. Histol. Histopathol., 2014, 1, 1–3 CrossRef.
- T. A. A. Tosta, P. R. de Faria, L. A. Neves and M. Z. do Nascimento, Artif. Intell. Med., 2019, 95, 118–132 CrossRef.
- C. Munien and S. Viriri, Comput. Intell. Neurosci., 2021, 2021, 5580914 CrossRef PubMed.
- J. Zheng, H. Zhang, S. Li, Z. Kang, F. Zheng, Q. Yao and M. Chen, BMC Cancer, 2023, 23, 1193 CrossRef.
- T. T. Wong, R. Zhang, P. Hai, C. Zhang, M. A. Pleitez, R. L. Aft, D. V. Novack and L. V. Wang, Sci. Adv., 2017, 3, e1602168 CrossRef.
- L. Kang, X. Li, Y. Zhang and T. T. Wong, Photoacoust, 2022, 25, 100308 CrossRef.
- R. Cao, S. D. Nelson, S. Davis, Y. Liang, Y. Luo, Y. Zhang, B. Crawford and L. V. Wang, Nat. Biomed. Eng., 2023, 7, 124–134 CrossRef PubMed.
- M. Töpperwien, F. van der Meer, C. Stadelmann and T. Salditt, Proc. Natl.Acad. Sci., 2018, 115, 6940–6945 CrossRef.
- Y. Rivenson, T. Liu, Z. Wei, Y. Zhang, K. de Haan and A. Ozcan, Light Sci.Appl., 2019, 8, 23 CrossRef PubMed.
- M. Eckermann, B. Schmitzer, F. van der Meer, J. Franz, O. Hansen, C. Stadelmann and T. Salditt, Proc. Natl. Acad. Sci. U. S. A., 2021, 118, e2113835118 CrossRef.
- C. W. Freudiger, W. Min, B. G. Saar, S. Lu, G. R. Holtom, C. He, J. C. Tsai and J. X. X. S. Kang, Science, 2008, 322, 1857–1861 CrossRef.
- D. A. Orringer, B. Pandian, Y. S. Niknafs, T. C. Hollon, J. Boyle, S. Lewis, M. Garrard, S. L. Hervey-Jumper, H. J. L. Garton, C. O. Maher, J. A. Heth, O. Sagher, D. A. Wilkinson, M. Snuderl, S. Venneti, S. H. Ramkissoon, K. A. McFadden, A. Fisher-Hubbard, A. P. Lieberman, T. D. Johnson, X. S. Xie, J. K. Trautman, C. W. Freudiger and S. Camelo-Piragua, Nat. Biomed. Eng., 2017, 1, 0027 CrossRef PubMed.
- Y. S. Zhang, J. Yao, C. Zhang, L. Li, L. V. Wang and Y. Xia, Angew. Chem., Int. Ed., 2014, 126, 8237–8241 CrossRef.
- L. V. Wang and L. Gao, Ann. Rev. Biomed. Eng., 2014, 16, 155–185 CrossRef CAS.
- Y. Yang, Z. Liu, J. Huang, X. Sun, J. Ao, B. Zheng, W. Chen, Z. Shao, H. Hu, Y. Yang and M. Ji, Theranostics, 2023, 13, 1342 CrossRef PubMed.
- J. L. Ganoza-Quintana, F. Fanjul-Vélez and J. L. Arce-Diego, Appl. Sci., 2021, 11, 6142 CrossRef CAS.
- R. He, Y. Xu, L. Zhang, S. Ma, X. Wang, D. Ye and M. Ji, Optica, 2017, 4, 44–47 CrossRef CAS.
- M. Ji, D. A. Orringer, C. W. Freudiger, S. Ramkissoon, X. Liu, D. Lau, A. J. Golby, I. Norton, M. Hayashi, N. Y. R. Agar, G. S. Young, C. Spino, S. Santagata, S. Camelo-Piragua, K. L. Ligon, O. Sagher and X. S. Xie, Sci. Transl. Med., 2013, 5, 201ra119 Search PubMed.
- Z. Liu, W. Su, J. Ao, M. Wang, Q. Jiang, J. He, H. Gao, S. Lei, J. Nie, X. Yan, X. Guo, P. Zhou, H. Hu and M. Ji, Nat. Commun., 2022, 13, 4050 Search PubMed.
- Z. Takats, J. M. Wiseman, B. Gologan and R. G. Cooks, Science, 2024, 306, 471–473 CrossRef PubMed.
- D. S. Cornett, M. L. Reyzer, P. Chaurand and R. M. Caprioli, Nat. Methods, 2007, 4, 828–833 CrossRef CAS.
- M. Aichler and A. Walch, Lab. Invest., 2015, 95, 422–431 CrossRef CAS.
- K. Chughtai and R. M. Heeren, Chem. Rev., 2010, 110, 3237–3277 CrossRef CAS PubMed.
- C. Bamberger, U. Renz and A. Bamberger, J. Am. Soc. Mass Spectrom., 2011, 22, 1079–1087 CrossRef CAS PubMed.
- K. Chughtai and R. M. Heeren, Chem. Rev., 2010, 110, 3237–3277 CrossRef CAS PubMed.
- D. Calligaris, D. Caragacianu, X. Liu, I. Norton, C. J. Thompson, A. L. Richardson, M. Golshan, M. L. Easterling, S. Santagata, D. A. Dillon, F. A. Jolesz and N. Y. Agar, Proc. Natl. Acad. Sci. U. S. A., 2014, 111, 15184–15189 CrossRef CAS PubMed.
- N. M. Morato and R. G. Cooks, Acc. Chem. Res., 2023, 56, 2526–2536 CrossRef CAS PubMed.
- T. Soudah, A. Zoabi and K. Margulis, Mass Spectrom. Rev., 2023, 42, 751–778 Search PubMed.
- M. Kompauer, S. Heiles and B. Spengler, Nat. Methods, 2017, 14, 90–96 CrossRef CAS PubMed.
- M. Niehaus, J. Soltwisch, M. E. Belov and K. Dreisewerd, Nat. Methods, 2019, 16, 925–931 CrossRef CAS PubMed.
- K. Ščupáková, B. Balluff, C. Tressler, T. Adelaja, R. M. Heeren, K. Glunde and G. Ertaylan, Clin. Chem. Lab. Med. (CCLM), 2020, 58, 914–929 CrossRef PubMed.
- E. Cortés, W. Xie, J. Cambiasso, A. S. Jermyn, R. Sundararaman, P. Narang, S. Schlücker and S. A. Maier, Nat. Commun., 2017, 8, 14880 CrossRef PubMed.
- C. Zhan, J. Yi, S. Hu, X. G. Zhang, D. Y. Wu and Z. Q. Tian, Nat. Rev. Methods Prime., 2023, 3, 13 CrossRef.
- A. Stefancu, N. J. Halas, P. Nordlander and E. Cortes, Nat. Phy., 2024, 20, 1065–1077 CrossRef CAS.
- A. Marimuthu, J. Zhang and S. Linic, Science, 2013, 339, 1590–1593 CrossRef.
- C. Clavero, Nat. Photon., 2014, 8, 95–103 CrossRef.
- M. L. Brongersma, N. J. Halas and P. Nordlander, Nat. Nanotech., 2015, 10, 25–34 CrossRef PubMed.
- J. A. Schuller, E. S. Barnard, W. Cai, Y. C. Jun and J. S. White, Nat. Materials, 2010, 9, 193–204 Search PubMed.
- K. Wu, J. Chen, J. R. McBride and T. Lian, Science, 2015, 349, 632–635 Search PubMed.
- A. J. Wilson and P. K. Jain, Acc. Chem. Res., 2020, 53, 1773–1781 Search PubMed.
- S. Mubeen, J. Lee, N. Singh, S. Krämer, G. D. Stucky and M. Moskovits, Nat. Nanotech., 2013, 8, 247–251 Search PubMed.
- R. Chen, Z. Ren, Y. Liang, G. Zhang, T. Dittrich, R. Liu, Y. Liu, Y. Zhao, S. Pang, H. An, C. Ni, P. Zhou, K. Han, F. Fan and C. Li, Nature, 2022, 610, 296–301 CrossRef PubMed.
- C. D. Lindstrom and X. Y. Zhu, Chem. Rev., 2006, 106, 4281–4300 CrossRef PubMed.
- S. W. Lee, Trends Chem., 2023, 5, 561–571 CrossRef.
- Y. Liu, Q. Chen, D. A. Cullen, Z. Xie and T. Lian, Nano Lett., 2020, 20, 4322–4329 CrossRef PubMed.
- J. Repp, G. Meyer, F. E. Olsson and M. Persson, Science, 2004, 305, 493–495 CrossRef PubMed.
- J. Ji, A. E. Kline, A. Amoscato, A. K. Samhan-Arias, L. J. Sparvero, V. A. Tyurin, B. Fink, M. D. Manole, A. M. Puccio, D. O. Okonkwo, J. P. Cheng, H. Alexander, R. S. B. Clark, P. M. Kochanek, P. Wipf, V. E. Kagan and H. Bayır, Nat. Neurosci., 2012, 15, 1407–1413 CrossRef PubMed.
- F. Fazio, L. Lionetto, G. Molinaro, H. O. Bertrand, F. Acher, R. T. Ngomba, S. Notartomaso, M. Curini, O. Rosati, P. Scarselli, R. D. Marco, G. Battaglia, V. Bruno, M. Simmaco, J. P. Pin, F. Nicoletti and C. Goudet, Mol. Pharmacol., 2012, 81, 643–656 CrossRef PubMed.
- N. Y. Patil, H. Tang, L. Rus, K. Zhang and A. D. Joshi, Mol. Pharmacol., 2022, 101, 45–55 CrossRef PubMed.
- M. Ulivieri, J. M. Wierońska, L. Lionetto, K. Martinello, P. Cieslik, A. Chocyk, M. Curto, L. D. Menna, L. Iacovelli, A. Traficante, F. Liberatore, G. Mascio, N. Antenucci, G. Giannino, M. Vergassola, A. Pittaluga, V. Bruno, G. Battaglia, S. Fucile, M. Simmaco, F. Nicoletti, A. Pilc and F. Fazio, Schizophrenia Bull., 2020, 46, 1471–1481 CrossRef.
- L. Malinina, M. L. Malakhova, A. Teplov, R. E. Brown and D. J. Patel, Nature, 2004, 430, 1048–1053 CrossRef CAS PubMed.
- T. T. Li, G. Li, R. Hu, X. Ji, C. Liu and Y. T. Shao, Neurochem. Res., 2023, 48, 2059–2065 CrossRef CAS PubMed.
- Q. Cao, X. Chen, X. Wu, R. Liao, P. Huang, Y. Tan, L. Wang, G. Ren, J. Huang and C. Dong, J. Exp. Med., 2018, 215, 1679–1692 CrossRef CAS.
- M. R. Bond and J. A. Hanover, J. Cell Biol., 2015, 208, 869–880 CrossRef CAS.
- R. A. Flynn, K. Pedram, S. A. Malaker, P. J. Batista, B. A. Smith, A. G. Johnson, B. M. George, K. Majzoub, P. W. Villalta, J. E. Carette and C. R. Bertozzii, Cell, 2021, 184, 3109–3124 CrossRef CAS PubMed.
- L. Wang, H. Qian, Y. Nian, Y. Han, Z. Ren, H. Zhang, L. Hu, B. V. V. Prasad, A. Laganowsky, N. Yan and M. Zhou, Nature, 2020, 581, 329–332 CrossRef CAS PubMed.
- J. Remsik and A. Boire, Nat. Rev. Cancer, 2024, 24, 448–460 CrossRef CAS PubMed.
- A. E. Whiteley, D. Ma, L. Wang, S. Y. Yu, C. Yin, T. T. Price, B. G. Simon, K. R. Xu, K. A. Marsh, M. L. Brockman, T. M. Prioleau, K. L. Zhou, X. Cui, P. E. Fecci, W. R. Jeck, C. M. McCall, J. L. Neff and D. A. Sipkins, Science, 2024, 384, eadh5548 CrossRef CAS PubMed.
- Z. Y. Yu, H. J. Li, M. Wang, W. Z. Luo and Y. K. Xue, Int. J. Oncol., 2022, 61, 1–2 CrossRef PubMed.
- E. Guimaraes, R. Machado, M. D. Fonseca, A. Franca, C. Carvalho, A. C. Araujo e Silva, B. Almeida, P. Cassini, B. Hissa, L. Drumond and C. Goncalves, PloS One, 2017, 12, e0175041 CrossRef.
- A. Mound, A. Vautrin-Glabik, A. Foulon, B. Botia, F. Hague and J. B. Parys, Oncotarget, 2017, 8, 72324 CrossRef.
- Q. Sun, M. Li, G. Wang, H. Xu, Z. He, Y. Zhou, Y. Zhou, Y. Zhou, H. Song and H. Jiang, Cancer Imaging, 2019, 19, 1–9 CrossRef CAS PubMed.
- E. J. Ge, A. L. Bush, A. Casini, P. A. Cobine, J. R. Cross, G. M. DeNicola, Q. P. Dou, K. J. Franz, V. M. Gohil, S. Gupta and S. G. Kaler, Nat. Rev. Cancer, 2022, 22, 102–113 CrossRef CAS PubMed.
- C. Wang, R. Zhang, X. Wei, M. Lv and Z. Jiang, Adv. Immunol., 2020, 145, 187–241 CAS.
- Y. Shen, L. Howard and X. Y. Yu, Materials, 2024, 17, 528 CrossRef CAS.
- K. S. Kulp, E. S. Berman, M. G. Knize, D. L. Shattuck, E. J. Nelson, L. Wu, J. L. Montgomery, J. S. Felton and K. J. Wu, Anal. Chem., 2006, 78, 3651–3658 CrossRef CAS PubMed.
- S. P. Fraser, J. K. Diss, A. M. Chioni, M. E. Mycielska, H. Pan, R. F. Yamaci, F. Pani, Z. Siwy, M. Krasowska, Z. Grzywna, W. J. Brackenbury, D. Theodorou, M. Koyutürk, H. Kaya, E. Battaloglu, M. T. De Bella, M. J. Slade, R. Tolhurst, C. Palmieri, J. Jiang, D. S. Latchman, R. C. Coombes and M. B. A. Djamgoz, Clin.Cancer Res., 2005, 11, 5381–5389 CrossRef CAS.
- S. H. Jang, K. S. Kang, P. D. Ryu and S. Y. Lee, BMB Rep., 2009, 42, 535–539 CrossRef CAS PubMed.
- D. Lee and J. H. Hong, Cancers, 2021, 13, 1473 CrossRef.
- N. Kagara, N. Tanaka, S. Noguchi and T. Hirano, Cancer Sci., 2007, 98, 692–697 CrossRef.
Footnotes |
| † Electronic supplementary information (ESI) available. See DOI: https://doi.org/10.1039/d5sc02632f |
| ‡ Visiting student of Guangxi University. |
| § These authors contributed equally. |
| This journal is © The Royal Society of Chemistry 2025 |