
 Open Access Article
 This Open Access Article is licensed under a Creative Commons Attribution-Non Commercial 3.0 Unported Licence
Direct detection of microRNA in liquid biopsies from single cancer spheroids†
Chen
Hu
 a,
Essam M.
Dief
a,
Bram G.
Soliman
a,
Sara
Romanazzo
a,
Shilpa
Rana
a,
Kristopher A.
Kilian
ab,
Richard D.
Tilley
*ac and
J. Justin
Gooding
*a
a,
Essam M.
Dief
a,
Bram G.
Soliman
a,
Sara
Romanazzo
a,
Shilpa
Rana
a,
Kristopher A.
Kilian
ab,
Richard D.
Tilley
*ac and
J. Justin
Gooding
*a
aSchool of Chemistry, Australian Centre for NanoMedicine, University of New South Wales, Sydney, NSW 2052, Australia. E-mail: r.tilley@unsw.edu.au; justin.gooding@unsw.edu.au
bSchool of Materials Science and Engineering, University of New South Wales, Sydney, NSW 2052, Australia
cElectron Microscope Unit, Mark Wainwright Analytical Centre, University of New South Wales, Sydney, NSW 2052, Australia
First published on 16th April 2025
Abstract
Exploring cancer heterogeneity is crucial for both understanding cancer and developing prognostic tools to monitor cancer progression during treatment through the liquid biopsy concept. Herein, a nanoparticle-based “dispersible electrodes” biosensor was used to detect ultra-low concentrations of microRNA-155 (miRNA-155) from a single breast cancer spheroid for the first time. The results from the sensor were comparable to the standard real-time polymerase chain reaction analysis, but in a much shorter detection time and without any sample purification or amplification. Owing to the unique ability of the sensor to measure biomarker expression from unaltered and undiluted cancer liquid biopsy from a single cancer spheroid, we then tracked dynamic changes in miRNA-155 expression in a single spheroid treated with the anti-cancer drug doxorubicin. The ability to track dynamic biomarker changes in a single cancer spheroid opens the door to understanding key biological processes such as response to treatment on the cellular and molecular levels, paving the way for adapting liquid biopsy insights to guide oncologists and more personalised treatment strategies.
1. Introduction
Breast cancer is the most common cancer among women globally.1,2 Due to its prevalence, effective early detection approaches and progression tracking are vital for the patients' well-being. Several methods such as mammography, solid biopsy and liquid biopsy, have been developed to improve patient outcomes.3,4 Mammography is crucial for early detection of lumps and solid biopsy provides a detailed characterisation of the tumour to guide oncologists on treatment strategies upon cancer diagnosis. These methods however, do not allow for molecular-level monitoring of cancer progression during drug treatment, making it difficult to track cancer population changes over time.5,6 Being able to frequently monitor cancer progression highlights the strength of the liquid biopsy, where a simple blood draw, or draw of another biofluid, potentially allows a simple route to obtain molecular information about the cancer.7There are two key challenges limiting the widespread usage of liquid biopsy. The first is that there are such tiny amounts of material to be detected, typically in the attomolar to the nanomolar range, and in the case of circulating tumour cells, much lower still.8,9 The second challenge is that even if these tiny amounts of biomarkers are measurable, interpreting what the information from the sensor means is still not well understood. This is partly because the sample being interrogated might be collected remotely from the cancer, and partly due to the inherent biological diversity and heterogeneity of cancers. Developing a reductionist approach to understanding how changes in biomarker levels reflect changes in cancer is crucial.10 Such a reductionist approach necessitates the ability to develop sophisticated in vitro models that can incorporate multiple different cell types as well as different extracellular matrix mimics to replicate the cancer environment and the impact that has on the cells.11,12 These models are now emerging with the development of 3D bioprinting that enable the high throughput production of cancer spheroids and organoid.13–15
The cultivated cancer cell models have been used to mimic cancer microenvironments, but reliable sensing typically requires pooling large numbers of cancer models to provide enough biomarkers to reach the detection range of most sensors. This essentially means that biological variation between cancers, and how they respond, would be lost.16,17 Hence, this poses a challenge for diagnostic tools to detect low amounts of material released from a single cancer spheroid. The sensing community has risen to this challenge through the development of ultra-sensitive sensors, including nanopore sensors, fluorescence sensors, photonic resonator absorption microscope sensors and nanoparticle sensors, which have even been able to perform quantitative analysis with detection limits down to single molecules.18–21
We have proposed the “dispersible electrodes” sensing platform and explored its application.22–27 In this method, the sensor is broken into gold-coated magnetic nanoparticles (Au@MNPs) that can disperse into the sample matrix to capture the analyte, then reassembled using a magnetic field for electrochemical measurement. The Au@MNPs are functionalized with the probe that could specifically capture the target biomarker. In the current study, dispersible electrodes were employed to detect circulating microRNAs (miRNAs).28,29 miRNAs are small (7–25 nucleotides) endogenous non-coding RNAs that modulate cellular processes through regulating protein expression, cell-to-cell communication and cancer progression.30 Therefore, the ability to monitor the expression of miRNAs at the cellular level provides a means to gain molecular insight into the progression of cancers. In addition, miRNA concentrations are changing with molecular-level drug targeting in cancer treatment. Therefore, tracking the changes of cancer cellular regulators would pave the way to an in-depth understanding of the drug action mechanisms and help design better treatment protocols.31,32
In the case of using “dispersible electrodes” for detecting miRNA, a methylene-blue modified DNA was attached to the Au@MNPs(MB-DNA-Au@MNPs), which allowed attomolar detection in whole blood without any amplification.25 This was achieved by the MB-DNA-Au@MNPs forming a network on a macroscopic electrode and when the complementary miRNA binds to the DNA on the particles. Upon binding, the rigidity of the DNA-RNA duplex increases the spacing between the MB-DNA-Au@MNPs with a concomitant decrease in current.33 In this way, a single strand of miRNA can switch off the electrochemistry from thousands of MB-DNA-Au@MNPs.25 Other studies have also enabled miRNA detection, however, achieving ultra-high sensitivity down to attomolar was challenging,34–37 or requiring additional signal amplification strategies such as nucleic acid signal amplification that prolong the process.38–42 This absence of the requirement for amplification means that the “dispersible electrodes” approach can detect miRNA in blood in 30 minutes compared with close to 12 hours when using quantitative PCR.25
Combining the advantages of 3D cancer spheroids and the “dispersible electrodes” system as a tool, this work aims to understand how few cancer spheroids are required to monitor cancer progression and treatment. Being able to detect miRNA from a single spheroid would provide us with the ability to explore heterogeneity in spheroids. Detecting miRNA from single spheroids has not yet been achieved using a sensing technology.
The miRNA to be explored in this study is miRNA-155 because it is upregulated in clinical breast cancer patients' biopsies43 and it is taken as an example for the proof-of-concept study. 3D cancer spheroids were prepared by suspending cancer cells within cell culture media.44 The cancer spheroids were allowed to grow for 7 days and then the media was collected (Fig. 1A(i), the procedure of spheroids generation in Fig. S1†). After exposing the MB-DNA-Au@MNPs biosensor to the media, the miRNA hybridized MB-DNA-Au@MNPs were centrifuged and then all the supernatants were removed (Fig. 1A(ii) and (iii), the procedure of Au@MNPs synthesis and characterisation in Fig. S2 and Table S1†). The Au@MNPs were then redispersed in phosphate-buffered saline (PBS) solution for electrochemical measurement (Fig. 1A(iv)). The square-wave voltammetry (SWV) peak current was measured and it is proportional to the target miRNA concentration (Fig. 1A(v), the mechanism shown in Fig. S3†). We prepared multiple spheroids and monitored the release of miRNA-155 until we show we can effectively monitor miRNA released into the cell culture media in a single spheroid (Fig. 1B). Finally, we incubated the single spheroid with the chemotherapeutic drug doxorubicin to examine the sensor's ability to detect dynamic changes in miRNA expression during cancer treatment to demonstrate its potential to track miRNA fluctuations in the tumour microenvironment during chemotherapy (Fig. 1C).
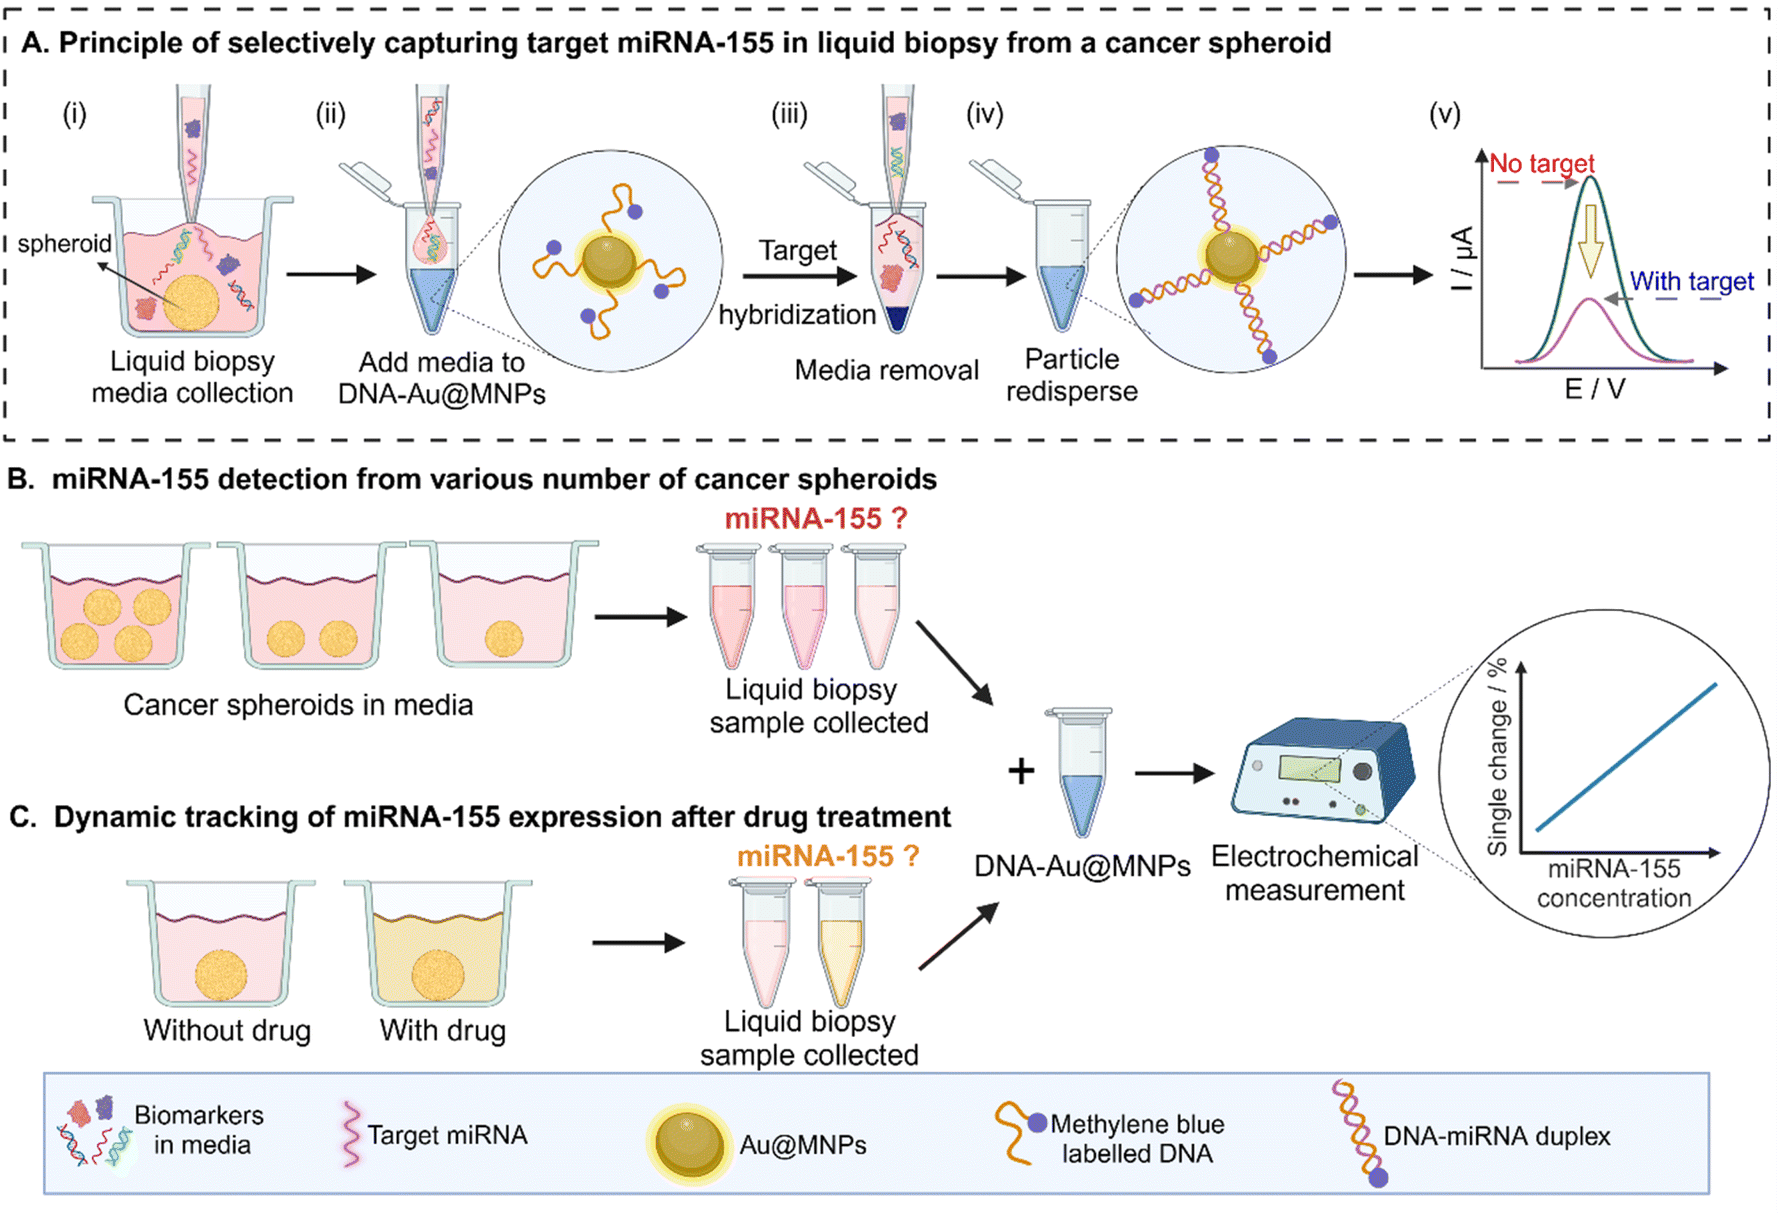 | ||
| Fig. 1 Schematic representation of the steps involved in this work. (A) Principle of the “dispersible electrode” sensing strategy for detecting miRNA-155 from media released from a cancer spheroid, involving the collection of media released from the cancer spheroid (i), introducing media to the methylene blue-DNA modified gold-coated magnetic nanoparticles (MB-DNA-Au@MNPs) (ii), capturing the target miRNA and further removing the unreacted media (iii), redisperse the Au@MNPs in PBS solution (iv), then square-wave voltammetry measurement (v). (B) Procedure for miRNA-155 expression from a series of cancer spheroids. (C) Procedure for dynamic tracking miRNA-155 expression after being treated with an anti-cancer drug. The square-wave voltammetry was measured in the range between −0.45 V to 0 V (versus Ag|AgCl 3 M) with a pulse amplitude of 25 mV and frequency of 10 Hz. Scheme created with https://www.BioRender.com. | ||
2. Methods
2.1 Materials and instruments
Oligonucleotides used in this work were synthesized by Integrated DNA Technologies (IDT) (Iowa, USA). Sodium chloride (NaCl), tris(2-carboxyethyl) phosphine hydrochloride (TCEP), Tween-20 and Dulbecco's phosphate-buffered saline (1× PBS) were purchased from Sigma-Aldrich. Milli-Q water (∼18 MΩ cm, Milli-pore, Australia) was used to prepare experimental solutions. exoRNeasy Kit, miRCURY LNA RT Kit, miRCURY LNA miRNA PCR Assay, and miRCURY LNA miRNA mimic were obtained from Qiagen. CHI660E electrochemical workstation (CHI Instruments, Inc.) was used to measure square wave voltammograms. Transmission electron microscopy (TEM) images were taken by FEI TECNAI G2 microscopy. Real-time reverse transcription-polymerase chain reaction (RT-PCR) was done by Quantstudio 12K Flex Real-Time PCR system (Applied Biosystems). Electrochemical measurement was conducted using a three-electrode system comprising a bare gold foil (2.5 cm × 2.5 cm) as the working electrode (WE), an Ag/AgCl (3.0 M NaCl) as the reference electrode (RE), and a platinum wire as the counter electrode (CE). The sequence used in this work is shown below:Methylene blue-DNA: 5′-Thiol-MC-6-D/AAC CCC TAT CAC GAT TAG CAT TAA/-MB-3′.
MiRNA-155: 5′-UUA AUG CUA AUC GUG AUA GGG GUU-3′.
2.2 Synthesis and modification of Au@MNPs
The Au@MNPs were synthesized according to previous work from our group.22 To modify the Au@MNPs with methylene blue labelled DNA, 1 μM MB-DNA was first treated with 1 mM TCEP for 2 hours to break the disulfide bonds. Then Au@MNPs were added and gently mixed in a rotating wheel for 16 hours. Next, 60 μL of 1 M NaCl was added to 1 mL solution every 2 hours for 4 times reaching the final NaCl salt concanetration of 200 mM. Subsequently, the DNA-Au@MNPs were isolated from the supernatant solution by first applying a centrifugation step at 6500 rpm for 5 minutes. Following centrifugation, the supernatant was removed and then the modified particles were dispersed in 10 μL 1× PBS solution with 0.05% Tween-20.2.3 Target hybridization and electrochemical measurement
For hybridization, the target miRNA was incubated with MB-DNA-Au@MNPs at room temperature. The hybridized Au@MNPs were then separated by centrifugation (6500 rpm, 5 min), washed twice, and resuspended in 1× PBS buffer. For electrochemical measurement, a gold foil was utilized as the working electrode, with a plastic gasket containing a 2 mm-diameter hole placed on top. A glass cell was then positioned over the plastic gasket and secured with a clamp to prevent any liquid leakage. After introducing 1 mL of 1× PBS solution as the electrolyte, the target-hybridized Au@MNPs were incrementally added to the glass cell above the magnet. The setup was allowed to rest for 5 minutes to ensure complete sedimentation of the particles before measuring the SWV result.2.4 Spheroids generation and media collection
The spheroids were prepared by culturing MCF-7 cells in high density (20![[thin space (1/6-em)]](https://www.rsc.org/images/entities/char_2009.gif) 000 cells per well, 30 μL DMEM supplemented with 10% fetal bovine serum and 1% penicillin–streptomycin) within ultra-low attachment plates. The media was replaced every two days. Each time, the media was collected, and fresh media was added. The cell culture media was first centrifuged at 200 rpm for 5 minutes to ensure the removal of any potential cellular components. The supernatant was then collected and added to the sensing system for electrochemical measurements.
000 cells per well, 30 μL DMEM supplemented with 10% fetal bovine serum and 1% penicillin–streptomycin) within ultra-low attachment plates. The media was replaced every two days. Each time, the media was collected, and fresh media was added. The cell culture media was first centrifuged at 200 rpm for 5 minutes to ensure the removal of any potential cellular components. The supernatant was then collected and added to the sensing system for electrochemical measurements.
2.5 Drug treatment on the single spheroid
10 μM doxorubicin solution was prepared and used for all drug-related experiments. The 1 spheroid was first generated by cultivating cancer cells for five days at physiological conditions. For the drug-treated group, after the 1 spheroid was formed, the cell culture media was changed, and fresh media containing doxorubicin were added to allow for drug treatment. After 2 days of incubation, the media was taken out for measurement, and the fresh media containing 10 μM doxorubicin was replaced. On day 5, the media was taken out for measurement to further evaluate how the drug affected the 1 spheroid's performance. Then the fresh media without the drug added was replaced to allow for 2 more days of incubation. While for the non-drug treated group, the media containing no drug was replaced on day 2, day 5, and day 7. For the electrochemical measurement, freshly prepared sensors are used each time on different days.2.6 RNA isolation and quantitative RT-PCR
Media from 96 spheroids was collected and used to analyse their miRNA-155 content. Each sample corresponded to media collected from 96 spheroids, and 3 samples were analysed each time. Briefly, total RNA was isolated with the exoRNeasy Kit, which was subsequently retro-transcribed into cDNA with miRCURY LNA RT Kit according to the manufacturer's instructions. RT-PCR was then performed using Quantstudio 12K Flex Real-Time PCR system. miRCURY LNA miRNA PCR Assay was used together with the miRNA-155 primer for this purpose. The thermocycling conditions were 95 °C for 2 min, followed by 40 cycles of 95 °C for 15 s and 56 °C for 1 min. Absolute quantification of miRNA-155 levels in total RNA extract was performed by using miRCURY LNA miRNA mimic. Serially diluted standards of known concentrations of miR155 were used to generate the standard curve.3. Results and discussion
3.1 Practical applicability of the sensing platform
First, to show the practical applicability to measure in biological conditions, we evaluated the sensor's performance in cell culture media. The SWV was used to detect synthetic miRNA-155 in cell culture media after exposing MB-DNA-Au@MNPs to various concentrations, achieving a lowest detected concentration of 10 aM (Fig. 2A). The relationship between the miRNA-155 to its square wave current follows a linear correlation equation of Y = 9.41X + 163.26 (R2 = 0.9961) (Fig. 2B). The sensor's performance was also evaluated in PBS solution (Fig. S4†). The calibration curve in cell culture media and PBS solution is similar, further demonstrating the capability of the Au@MNPs miRNA biosensor to detect miRNA directly from cell culture media and the robustness of the sensing system in such a complex biological environment. | ||
| Fig. 2 (A) The current intensity in the square wave voltammograms for the detection of different amounts of miRNA-155 in cell culture media solution. The concentration measured: blank (black), 10 aM (purple), 100 aM (blue), 1 fM (light blue), 10 fM (yellow), 100 fM (grey), 1 pM (green), 10 pM (red). (B) Current percentage change for different amounts of miRNA-155. Error bar in (B) represents the standard deviations with 95% confidence limit of the mean on the miRNA-155 amount and it is reported as x± tn−1·s/√n, where tn−1 is 2.57 for 5 measurements, s is the standard deviation, and n is the number of measurements. All the measurements were taken using independently prepared sensors in independent cell culture media. Electrolyte: 1× PBS buffer (pH 7.4); frequency: 10 Hz; pulse amplitude: 25 mV. [Signal change = (current intensityblank − current intensitytarget)/current intensityblank] × 100%. | ||
To demonstrate the sensor's accuracy, we compared it with the standard miRNA analysis method RT-PCR. In the standard RT-PCR method, RNA extraction is usually collected for miRNA measurement. Therefore, in this comparison, 96 spheroids were cultured for media collection and the total RNA was extracted for both RT-PCR and sensor measurements (see the procedure in Fig. S5†). For RT-PCR measurement, a calibration curve was established using varying concentrations of synthetic miRNA-155 mimics, with results showing that miRNA-155 reached amplification saturation after approximately 30 PCR cycles (Fig. S6†). According to the RT-PCR calibration curve, the miRNA-155 detected by RT-PCR for the 96 spheroids was 4.3 ± 1 pM (Fig. 3A, detailed calculation in Table S2†). For the sensing measurement, SWV indicated a signal decrease of 49 ± 15%, leading to a detection of 5.6 ± 2 pM miRNA-155 (Fig. 3B, detailed calculation in Table S3†). The results demonstrated a close correlation between the proposed sensor and RT-PCR, confirming the sensor's reliability (Fig. 3C). Thus, the sensor method can be a practical and efficient tool for miRNA detection.
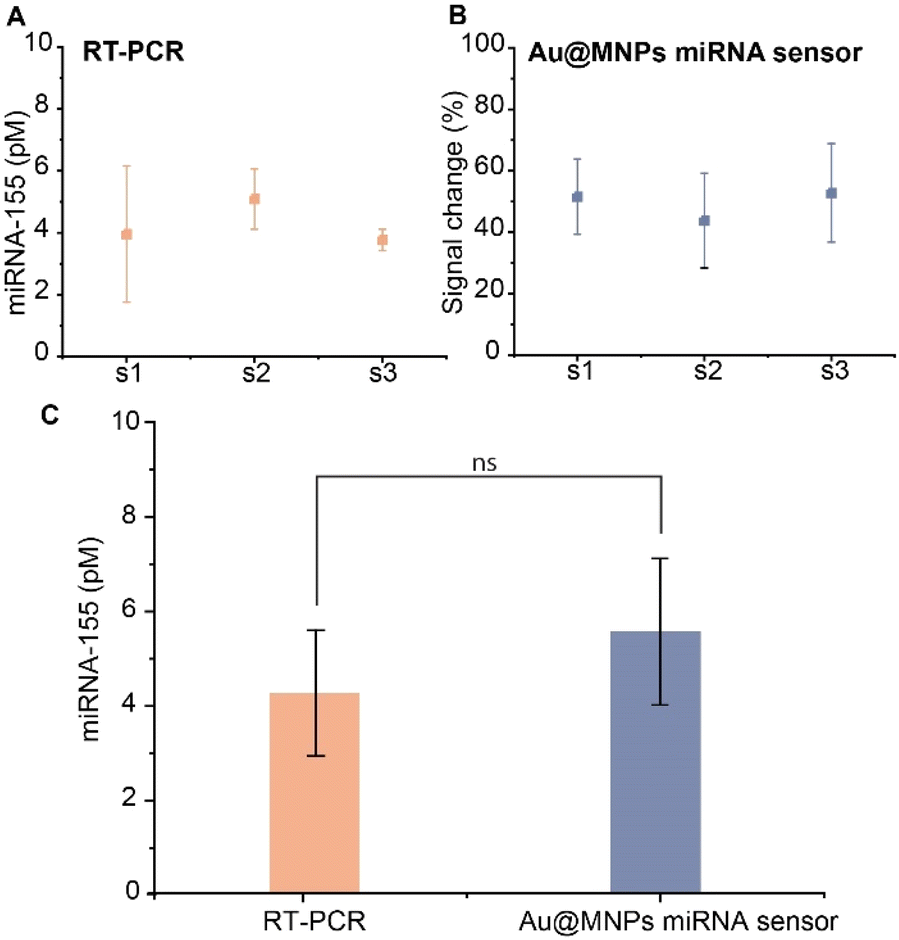 | ||
| Fig. 3 (A) RT-PCR results for miRNA-155 detection in the total RNA extraction of 96 spheroids. (B) Sensor results for miRNA-155 detection in the total RNA extraction of 96 spheroids. (C) Comparison between miRNA-155 concentration by RT-PCR and sensor. Labels s1, s2 and s3 in (A) and (B) represent three batches of samples. Error bar in (C) represents the standard deviations with 95% confidence limit of the mean on the miRNA-155 amount and it is reported as x ± tn−1·s/√n, where tn−1 was 2.31 for 9 measurements, s is the standard deviation, and n is the number of measurements. All the measurements were taken using independently prepared sensors in independent cell culture media. The p-value in (C) was calculated to be 0.0722 by the Mann–Whitney U test, indicating no significance between the RT-PCR and sensor measurement. | ||
3.2 miRNA-155 detection from various numbers of spheroids
With miR-155 levels comparable between the sensor and RT-PCR in measuring from total RNA extractions, we next utilized the sensor to detect miRNA directly from cancer spheroid media. The media was first collected from 12 cancer spheroids (scheme of 12 cancer spheroids generation in Fig. S7†) and the miRNA-155 was measured. Microscopy imaging indicates the spheroids have an average diameter of 800 μm (Fig. 4A). SWV results show that compared with the blank sample (cell culture media without any spheroids grown in it), the cell culture media released from 12 spheroids greatly lowered the signal, indicating a large amount of miRNA released relative to the sensor's detection range (Fig. 4B). The comparison of the signal between the blank sample and the media released from 12 spheroids demonstrates that the cell culture media released from 12 spheroids caused a ∼97% signal decrease, saturating the capacity of the sensor to bind miRNA-155 (Fig. 4C). | ||
| Fig. 4 (A) Microscope image of 12 spheroids. (B) Comparison between current intensity in the square wave voltammograms for the detection of miRNA-155 in blank (cell culture media without any spheroids grown in) and media released from 12 spheroids. (C) Signal percentage change as compared to media without any spheroids grown in. Electrolyte: 1× PBS buffer (pH 7.4); frequency: 10 Hz; pulse amplitude: 25 mV. Error bar in (C) represents the standard deviations with 95% confidence limit of the mean on the miRNA-155 amount and it is reported as x ± tn−1·s/√n, where tn−1 is 2.57 for 5 measurements, s is the standard deviation, and n is the number of measurements. All the measurements were taken using independently prepared sensors in independent cell culture media. | ||
Since the sensor was almost saturated with 12 spheroids, it was clear that we could detect lower amounts of miRNA in cancer spheroids. However, the question that remains was how low can we detect? As such 1, 2 and 4 spheroids were prepared (Fig. 5A), the cell culture media was interrogated by the sensor and the SWV measurement was performed to show that in all cases sufficient miRNA was released into the media to allow the sensor to monitor the miRNA-155 concentration (Fig. 5B). Importantly, these results show the ability to detect miRNA from the media released by just 1 spheroid.
 | ||
| Fig. 5 (A) Microscope image of 1, 2 and 4 spheroids. (B) The current intensity in square wave voltammograms for the detection of miRNA-155 in the cell media from different numbers of spheroids (blank means there are no spheroids but only the cell culture media). (C) The reproducibility in the signal change among three batches of spheroids for measurement. Electrolyte: 1× PBS buffer (pH 7.4); frequency: 10 Hz; pulse amplitude: 25 mV. (D) Comparison between the RT-PCR result and sensor results on the media collected from 1 spheroid. Error bar in (C) and (D) represents the standard deviations with 95% confidence limit of the mean on the miRNA-155 amount and it is reported as x ± tn−1·s/√n, where tn−1 depends on the number of repeats and was varied between 2.57 and 2.31, s is the standard deviation, and n is the number of measurements. All the measurements were taken using independently prepared sensors in independent cell culture media. The p-value in (D) was calculated to be 0.7857 by the Mann–Whitney U test, indicating no significance between RT-PCR and sensor measurement. | ||
The signal difference percentage between the blank and the sample of media released by spheroids was calculated and showed that 1 spheroid caused a 29 ± 5% signal percentage change and that the reproducibility among the triplicate samples was good (Fig. S8†). To further test the reproducibility of this method, the 1, 2 and 4 spheroids were produced and measured with two further batches of spheroids (Fig. S9† and S10†). All the results show satisfactory reproducibility with three replicates. The signal change across three measurement groups shows consistent results between blank samples and varying spheroid numbers, indicating strong batch-to-batch reproducibility of the sensor (Fig. 5C). Thereafter, standard method RT-PCR was used to examine the practicability of the proposed sensing method for direct miRNA-155 detection from the media released from 1 spheroid. Briefly, a plate of 96 spheroids was individually cultured in a 96-well plate. Media from 5 spheroids were collected individually for sensing measurements, while media from the remaining 91 spheroids were used for RT-PCR, where total RNA was extracted for miRNA-155 amplification (procedure shown in Fig. S11†). The PCR results were divided by 91 to calculate the average miRNA-155 concentration per spheroid. The results between the proposed sensor method and the standard method RT-PCR are also similar, showing that the sensor can be a practical and efficient tool for miRNA detection in cell culture media, further confirming the sensor can provide comparable performance to RT-PCR but over much shorter detection time and without requiring any purification of the miRNA (Fig. 5D, detailed calculation in Tables S4 and S5†). This is a significant advancement compared to previous studies that were done in buffer solution or extraction from cell lines using hundreds of spheroids.45–47 The ability to detect in unaltered liquid biopsy of a single spheroid allows non-invasive monitoring of cellular responses and miRNA interactions with the tumour microenvironment. This also opens the possibility of dynamically tracking drug treatment effects, supporting the development of personalized medicine by adjusting treatments based on miRNA expression levels for more effective diagnostics.
3.3 Dynamic tracking of miRNA-155 expression after drug treatment
Cellular secretion is a dynamic process, where miRNA release is expected to fluctuate over time as a function of tumour progression.48 Anti-cancer drugs could rapidly combat dividing cells and slow disease progression, therefore the potential for monitoring dynamic cancer processes is examined by measuring the media from 1 spheroid at various time points during anti-cancer drug interrogation. Doxorubicin can kill cells by damaging DNA, inhibiting topoisomerase II, disrupting mitochondria, and causing oxidative stress, and it is used in this study.49,50 Specifically, a single spheroid was treated with doxorubicin and the miRNA-155 expression was tracked over time using the sensor. The spheroid was first grown for 5 days to generate 1 spheroid and miRNA-155 in the media release from the 1 spheroid was measured and taken as the baseline (day 0, orange line in Fig. 6B and C). Drug treatment was then applied to the spheroid. It was exposed to 10 μM doxorubicin for 5 days, with miRNA levels measured on day 2 and day 5. The spheroid was then cultured for 2 more days in drug-free media, with another measurement on day 7. After each measurement, the media was fully replaced with fresh media. A control group without drug treatment was included at each stage for comparison (Fig. 6A). For the non-drug treated group, miRNA-155 expression was consistent on different days (Fig. 6B). In the drug-treated group, miRNA-155 expression increased on day 2 and day 5 after treatment, then decreased after incubation in drug-free media on day 7 (Fig. 6C). This indicates that miRNA expression is responsive to chemotherapy and that the sensor can track miRNA release during drug treatment.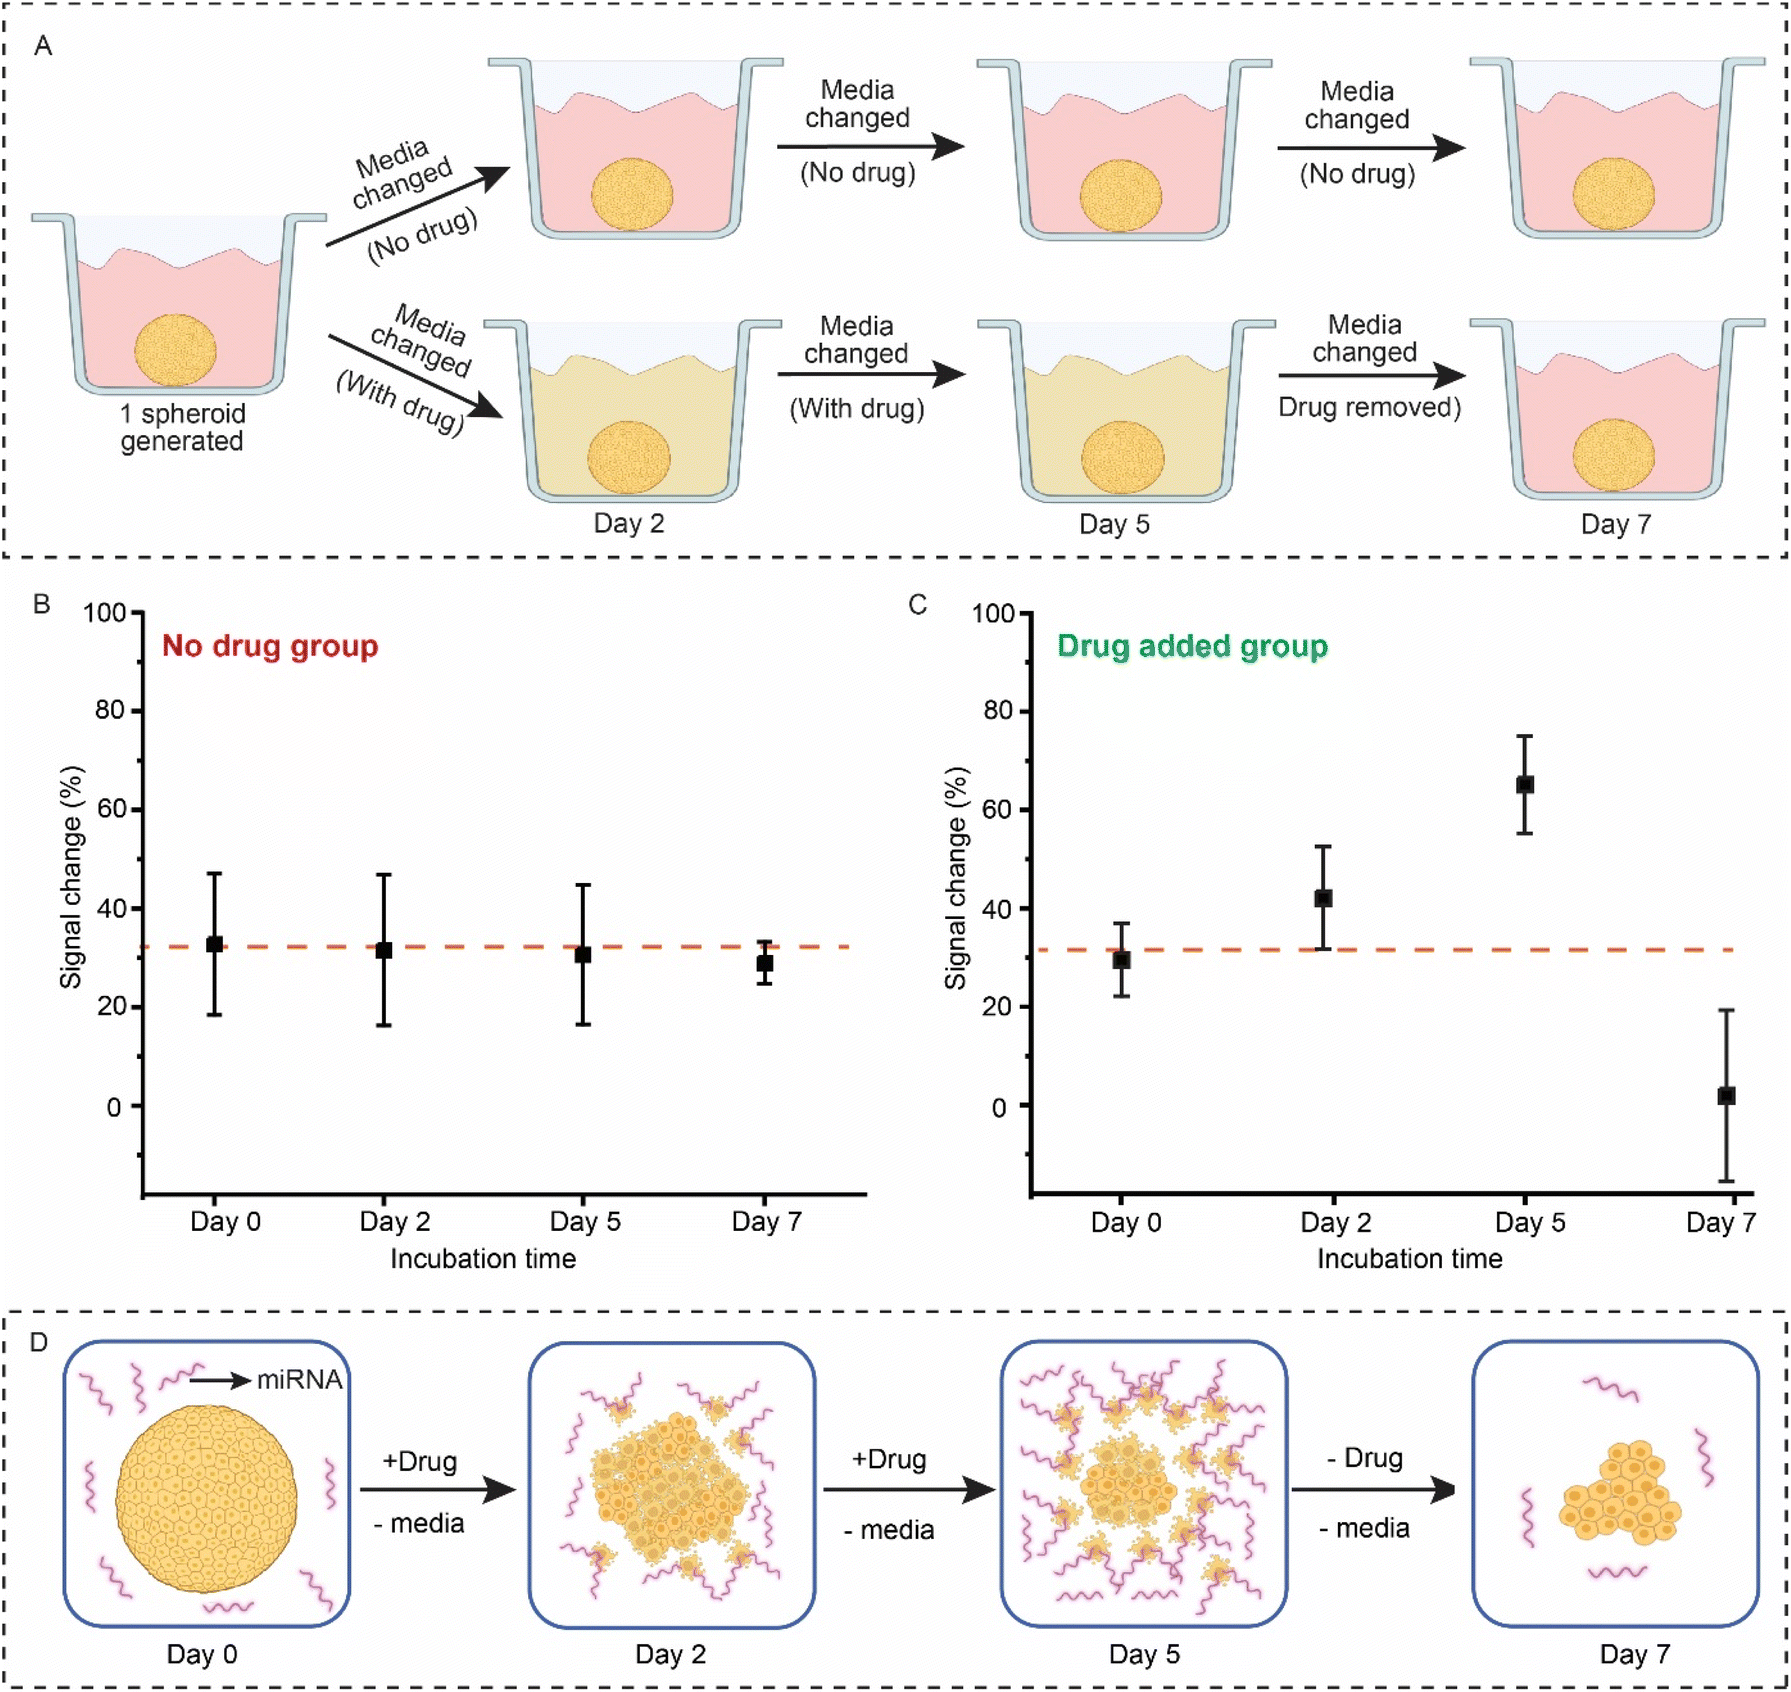 | ||
| Fig. 6 (A) Schematic illustration of the procedure for media change in 1 spheroid. For the drug-treated group, doxorubicin was added after 1 spheroid formed, with measurements taken on days 2 and 5. After day 5, drug-free media was added to evaluate miRNA release from surviving cells. For the non-drug treated group, the media was replaced on days 2, 5, and 7 with media that contained no drug. (Line 1: non-drug treated, Line 2: drug-treated) (B) Signal change in square wave voltammograms for the detection of miRNA-155 in the cell media without drug treatment for 7 days. (C) Signal change in square wave voltammograms for the detection of miRNA-155 in the cell media with drug treatment for 7 days. (D) Possible mechanism explaining the reason for the miRNA amount changes after drug treatment. The drug used is doxorubicin and the drug concentration added is 10 μM. Error bar in (B) and (C) represents the standard deviations with 95% confidence limit of the mean on the miRNA-155 amount and it is reported as x ± tn−1·s/√n, where tn−1 was 2.31 for 9 measurements, s is the standard deviation, and n is the number of measurements. All the measurements were taken using independently prepared sensors in independent cell culture media. | ||
There are several reasons that the miRNA-155 expression is consistent for the non-drug treated group. First, although cell aggregation and spheroid growth are dynamic processes, spheroid growth reaches a steady state where the proliferation of cells at the edge of the spheroid and apoptosis of nutrient-starved cells in the centre of the spheroid lead to a zero net change in spheroid size.51,52 In this study, the drug was added after the spheroid had already grown for 5 days and had reached this steady state. At this point, the spheroids do not grow more or change phenotypically unless an external trigger, such as an anti-cancer drug, is introduced. Hence, we expected the miRNA-155 to stabilise upon reaching steady state, explaining no change in its miRNA expression. Second, the measured miRNA signal comes from the miRNA produced between media changes. Each time after the measurement, the media is changed. Therefore, the miRNAs measured are between day 0 and day 2 for the second point, between day 2 and day 5 for the third point, and between day 5 and day 7 for the fourth point. This also guarantees that both the drug-treated group and non-drug treated groups are grown at the same time in the same conditions, with the only difference being the drug added or removed.
For the drug-treated group, regarding how the drug treatment is affecting miRNA-155 expression, one potential explanation is that after the drug treatment, dead and dying cells released their cargo (including miRNAs) into the media, leading to increased miRNA-155 level on day 2 and day 5. Then, from the result between day 5 and day 7, after taking all the drugs out, the drug-induced cell death is limited, thereby leading to a reduction of miRNA in the media, with the remaining miRNA presumably due to release by surviving cells (Fig. 6D). The low miRNA-155 levels at day 7 support the idea that cell death during the first 5 days released intracellular miRNA into the media. The literature also suggests that certain chemo-resistant miRNAs upregulate in MCF-7 cells in response to doxorubicin, further supporting our explanation.53–55 This suggests that miRNA expressions are related to the drug treatment and that our system can track this process. However, we cannot discount the possibility that other cellular processes are regulating the increase in miRNA at the intermediate time points. Overall, the ability of our sensor to track dynamic miRNA profiles in the liquid biopsy from a single spheroid provides a tool for tracking cancer progression, which might help in understanding how miRNA expression relates to cancer progression and treatment efficacy.
4. Conclusions
In this work, we have enabled the detection of miRNA from a single cancer spheroid and obtained dynamic tracking of miRNA level changes with drug treatment. We believe that the ability to monitor miRNA expression and its drug response provides new insights for tracking cancer progression and treatment. The combination of the “dispersible electrodes” concept presented herein for detecting the release of biomarkers from single spheroids and advances in developing sophisticated cancer organoids means that we now have the tools to start understanding subtle and rapidly changing miRNA levels and how they relate to upstream changes in the cancer using a reductionist approach. Combining these tools could have an impact in understanding the information from the liquid biopsy and hence providing oncologists with the information they need to adjust treatments to an individual's cancer. This also opens a window for future investigation on cancer heterogeneity, tumour development, and how drugs influence cancer progression. Since this method is suitable for different miRNA detections in different types of spheroids, we will be further expanding its application and we envision its potential for multiplexing and real-time follow-up of cancer diagnosis, tumour progression, metastasis, and recurrence.Data availability
The synthesis and characterisation of the gold-coated magnetic nanoparticles (Au@MNPs), the supplementary scheme illustrating the formation of spheroids and supplementary figures for different batches of spheroids measurement are described in the ESI.†Author contributions
Chen Hu: conceptualization, methodology, investigation, formal analysis, writing—original draft. Essam M. Dief: investigation, methodology, writing—review & editing. Bram G. Soliman: investigation, methodology, writing—review & editing. Sara Romanazzo: investigation. Shilpa Rana: investigation. Kristopher A. Kilian: writing—review & editing. Richard D. Tilley: supervision, writing—review & editing. J. Justin Gooding: supervision, writing—original draft, review & editing, resources.Conflicts of interest
The authors declare no competing financial interest.Acknowledgements
This research was financially supported by the National Health and Medical Research Council Investigator Grant (GNT1196648 JJG), Australian Research Council Discovery Projects (DP210102698 JJG). The authors would like to acknowledge https://www.BioRender.com for generating schemes in this work. The authors would also like to acknowledge H. T. Kim Duong for her help with the TEM imaging of the nanoparticles.Notes and references
- L. A. Torre, F. Islami, R. L. Siegel, E. M. Ward and A. Jemal, Cancer Epidemiol., Biomarkers Prev., 2017, 26, 444–457 CrossRef.
- B. S. Chhikara and K. Parang, Chem. Biol. Lett., 2023, 2023, 1–16 Search PubMed.
- S. H. Jafari, Z. Saadatpour, A. Salmaninejad, F. Momeni, M. Mokhtari, J. S. Nahand, M. Rahmati, H. Mirzaei and M. Kianmehr, J. Cell. Physiol., 2018, 233, 5200–5213 CrossRef CAS.
- Z. He, Z. Chen, M. Tan, S. Elingarami, Y. Liu, T. Li, Y. Deng, N. He, S. Li, J. Fu and W. Li, Cell Proliferation, 2020, 53, 1–16 Search PubMed.
- S. Ramakrishna and N. N. Shah, Nat. Med., 2020, 26, 1813–1814 CrossRef CAS PubMed.
- L. Pappas, V. A. Adalsteinsson and A. R. Parikh, Nat. Cancer, 2022, 3, 1420–1422 CrossRef.
- P. Song, L. R. Wu, Y. H. Yan, J. X. Zhang, T. Chu, L. N. Kwong, A. A. Patel and D. Y. Zhang, Nat. Biomed. Eng., 2022, 6, 232–245 CrossRef CAS PubMed.
- J. Cacheux, A. Bancaud, T. Leichlé and P. Cordelier, Front. Chem., 2019, 7, 815 CrossRef CAS.
- E. M. Dief, R. D. Tilley and J. J. Gooding, Aust. J. Chem., 2024, 77, 1–13 CrossRef.
- L. C. Kimlin, G. Casagrande and V. M. Virador, Mol. Carcinog., 2013, 52, 167–182 CrossRef PubMed.
- I. Eke and N. Cordes, Radiother. Oncol., 2011, 99, 271–278 CrossRef PubMed.
- V. Stankevicius, G. Vasauskas, D. Bulotiene, S. Butkyte, S. Jarmalaite, R. Rotomskis and K. Suziedelis, BMC Cancer, 2016, 16, 789 CrossRef PubMed.
- R. H. Utama, L. Atapattu, A. P. O'Mahony, C. M. Fife, J. Baek, T. Allard, K. J. O'Mahony, J. C. C. Ribeiro, K. Gaus, M. Kavallaris and J. J. Gooding, iScience, 2020, 23, 101621 CrossRef CAS PubMed.
- R. H. Utama, V. T. G. Tan, K. C. Tjandra, A. Sexton, D. H. T. Nguyen, A. P. O'Mahony, E. Y. Du, P. Tian, J. C. C. Ribeiro, M. Kavallaris and J. J. Gooding, Macromol. Biosci., 2021, 21, 1–9 CrossRef.
- M. S. Jung, S. Ghamrawi, E. Y. Du, J. J. Gooding and M. Kavallaris, Adv. Healthcare Mater., 2022, 11, 2200690 CrossRef CAS.
- D. Rodenhizer, T. Dean, E. D'Arcangelo and A. P. McGuigan, Adv. Healthcare Mater., 2018, 7, 1–36 Search PubMed.
- G. Trujillo-de Santiago, B. G. Flores-Garza, J. A. Tavares-Negrete, I. M. Lara-Mayorga, I. González-Gamboa, Y. S. Zhang, A. Rojas-Martínez, R. Ortiz-López and M. M. Álvarez, Materials, 2019, 12, 2945 CrossRef CAS.
- J. J. Gooding and K. Gaus, Angew. Chem., Int. Ed., 2016, 55, 11354–11366 CrossRef CAS.
- Y. Wu, R. D. Tilley and J. J. Gooding, J. Am. Chem. Soc., 2019, 141, 1162–1170 CrossRef CAS.
- T. D. Canady, N. Li, L. D. Smith, Y. Lu, M. Kohli and A. M. Smith, Proc. Natl. Acad. Sci. U.S.A., 2019, 116, 19362–19367 CrossRef CAS PubMed.
- X. Wang, S. Shepherd, N. Li, C. Che, T. Song, Y. Xiong, I. R. Palm, B. Zhao, M. Kohli, U. Demirci, Y. Lu and B. T. Cunningham, Angew. Chem., Int. Ed., 2023, 62, e202217932 CrossRef CAS PubMed.
- I. Y. Goon, L. M. H. Lai, M. Lim, R. Amal and J. J. Gooding, Chem. Commun., 2010, 46, 8821–8823 RSC.
- L. M. H. Lai, I. Y. Goon, M. Lim, D. B. Hibbert, R. Amal and J. J. Gooding, J. Electroanal. Chem., 2011, 656, 130–135 CrossRef CAS.
- K. Chuah, L. M. H. Lai, I. Y. Goon, S. G. Parker, R. Amal and J. J. Gooding, Chem. Commun., 2012, 48, 3503–3505 RSC.
- R. Tavallaie, J. McCarroll, M. Le Grand, N. Ariotti, W. Schuhmann, E. Bakker, R. D. Tilley, D. B. Hibbert, M. Kavallaris and J. J. Gooding, Nat. Nanotechnol., 2018, 13, 1066–1071 CrossRef CAS.
- D. Chen, Y. Wu, S. Hoque, R. D. Tilley and J. J. Gooding, Chem. Sci., 2021, 12, 5196–5201 RSC.
- D. Chen, Y. Wu, R. D. Tilley and J. J. Gooding, Biosens. Bioelectron., 2022, 206, 114126 CrossRef CAS PubMed.
- M. Ferracin, A. Veronese and M. Negrini, Expert Rev. Mol. Diagn., 2010, 10, 297–308 CrossRef CAS PubMed.
- X. Liu, D. Papukashvili, Z. Wang, Y. Liu, X. Chen, J. Li, Z. Li, L. Hu, Z. Li, N. Rcheulishvili, X. Lu and J. Ma, Front. Oncol., 2022, 12, 1–27 Search PubMed.
- H. Dong, J. Lei, L. Ding, Y. Wen, H. Ju and X. Zhang, Chem. Rev., 2013, 113, 6207–6233 CrossRef CAS PubMed.
- J. Lu, G. Getz, E. A. Miska, E. Alvarez-Saavedra, J. Lamb, D. Peck, A. Sweet-Cordero, B. L. Ebert, R. H. Mak, A. A. Ferrando, J. R. Downing, T. Jacks, H. R. Horvitz and T. R. Golub, Nature, 2005, 435, 834–838 CrossRef CAS.
- S. F. Tavazoie, C. Alarcón, T. Oskarsson, D. Padua, Q. Wang, P. D. Bos, W. L. Gerald and J. Massagué, Nature, 2008, 451, 147–152 CrossRef CAS.
- R. Tavallaie, N. Darwish, D. Brynn Hibbert and J. Justin Gooding, Chem. Commun., 2015, 51, 16526–16529 RSC.
- P. Wang, X. Wei, L. Shen, K. Xu, Z. Wen, N. Gao, T. Fan, S. Xun, Q. Zhu, X. Qu and Y. Zhu, Anal. Chem., 2024, 96, 4860–4867 CrossRef CAS.
- B. Tian, Y. Wang, W. Tang, J. Chen, J. Zhang, S. Xue, S. Zheng, G. Cheng, B. Gu and M. Chen, Talanta, 2024, 266, 124995 CrossRef CAS PubMed.
- S. Zhao, Q. Zhang, R. Luo, J. Sun, C. Zhu, D. Zhou and X. Gong, Chem. Sci., 2024, 15, 18347–18354 RSC.
- C. Ma, Q. Zhou, J. Shi, H. Gao, D. Huang, H. Xue, H. Wang, Z. Zhang, S. Yang, J. Zhang and K. Zhang, Talanta, 2024, 266, 125125 CrossRef CAS PubMed.
- J. Xu, X. Luo, Y. Li, Y. Liu, J. Lu, X. Lin and K. J. Huang, Sens. Actuators, B, 2024, 420, 136487 CrossRef CAS.
- J. Cui, J. Piao, H. Han, W. Peng, M. Lin, D. Zhou, C. Zhu and X. Gong, Anal. Chem., 2024, 96, 10496–10505 CrossRef CAS PubMed.
- D. Li, Y. Liu, Y. Li, Y. Xiang and R. Yuan, Anal. Chem., 2024, 96, 3329–3334 CrossRef CAS PubMed.
- M. Zhou, C. Li, R. Wei, H. Wang, H. Jia, C. Yan and L. Huang, Anal. Chem., 2024, 96, 4322–4329 CrossRef CAS.
- J. Meng, Z. Xu, S. Zheng, H. Yang, T. Wang, H. Wang and Y. Zhang, Anal. Chim. Acta, 2024, 1285, 342026 CrossRef CAS PubMed.
- M. V. Iorio, M. Ferracin, C. G. Liu, A. Veronese, R. Spizzo, S. Sabbioni, E. Magri, M. Pedriali, M. Fabbri, M. Campiglio, S. Ménard, J. P. Palazzo, A. Rosenberg, P. Musiani, S. Volinia, I. Nenci, G. A. Calin, P. Querzoli, M. Negrini and C. M. Croce, Cancer Res., 2005, 65, 7065–7070 CrossRef CAS.
- J. Friedrich, C. Seidel, R. Ebner and L. A. Kunz-Schughart, Nat. Protoc., 2009, 4, 309–324 CrossRef CAS PubMed.
- X. Lu, C. Hu, D. Jia, W. Fan, W. Ren and C. Liu, Nano Lett., 2021, 21, 6718–6724 CrossRef CAS.
- C. Qian, Y. Xiao, J. Wang, Y. Li, S. Li, B. Wei, W. Du, X. Feng, P. Chen and B. F. Liu, Sens. Actuators, B, 2021, 333, 129559 CrossRef CAS.
- Y. Wu, J. Huang, X. Yang, Y. Yang, K. Quan, N. Xie, J. Li, C. Ma and K. Wang, Anal. Chem., 2017, 89, 8377–8383 CrossRef CAS.
- O. Tacar, P. Sriamornsak and C. R. Dass, J. Pharm. Pharmacol., 2013, 65, 157–170 CrossRef CAS.
- J. L. Nitiss, Nat. Rev. Cancer, 2009, 9, 338–350 CrossRef CAS.
- J. Kwon, K. Y. Eom, T. R. Koo, B. H. Kim, E. Kang, S. W. Kim, Y. J. Kim, S. Y. Park and I. A. Kim, Int. J. Breast Cancer, 2017, 20, 65–73 CrossRef PubMed.
- R. Chignola, A. Schenetti, G. Andrighetto, E. Chiesa, R. Foroni, S. Sartoris, G. Tridente and D. Liberati, Cell Proliferation, 2000, 33, 219–229 CrossRef CAS PubMed.
- C. Guiot, P. G. Degiorgis, P. P. Delsanto, P. Gabriele and T. S. Deisboeck, J. Theor. Biol., 2003, 225, 147–151 CrossRef PubMed.
- E. Tormo, B. Pineda, E. Serna, A. Guijarro, G. Ribas, J. Fores, E. Chirivella, J. Climent, A. Lluch and P. Eroles, J. Cell. Biochem., 2015, 116, 2061–2073 CrossRef CAS.
- A. Rodríguez-Martínez, D. De Miguel-Pérez, F. G. Ortega, J. L. García-Puche, I. Robles-Fernández, J. Exposito, J. Martorell-Marugan, P. Carmona-Sáez, M. D. C. Garrido-Navas, C. Rolfo, H. Ilyine, J. A. Lorente, M. Legueren and M. J. Serrano, Breast Cancer Res., 2019, 21, 1–9 CrossRef.
- A. Mizielska, I. Dziechciowska, R. Szczepański, M. Cisek, M. Dabrowska, J. Slezak, I. Kosmalska, M. Rymarczyk, K. Wilkowska, B. Jacczak, E. Toto, N. Lisiak, P. Kopczynski and B. Rubis, Genes, 2023, 14, 702 CrossRef CAS.
Footnote |
| † Electronic supplementary information (ESI) available. See DOI: https://doi.org/10.1039/d5sc01036e |
| This journal is © The Royal Society of Chemistry 2025 |