
 Open Access Article
 This Open Access Article is licensed under a Creative Commons Attribution-Non Commercial 3.0 Unported Licence
Insights into topochemical versus stress-induced high-pressure reactivity of azobenzene by single crystal X-ray diffraction†
Milo
Agati
 ab,
Sebastiano
Romi
*ab,
Samuele
Fanetti
ac,
Krzysztof
Radacki
d,
Michael
Hanfland
e,
Holger
Braunschweig
d,
Todd B.
Marder
d,
Stewart J.
Clark
f,
Alexandra
Friedrich
*d and
Roberto
Bini
abc
ab,
Sebastiano
Romi
*ab,
Samuele
Fanetti
ac,
Krzysztof
Radacki
d,
Michael
Hanfland
e,
Holger
Braunschweig
d,
Todd B.
Marder
d,
Stewart J.
Clark
f,
Alexandra
Friedrich
*d and
Roberto
Bini
abc
aLENS, European Laboratory for Non-linear Spectroscopy, Via N. Carrara 1, I-50019 Sesto Fiorentino, Firenze, Italy. E-mail: romi@lens.unifi.it
bDipartimento di Chimica “Ugo Schiff”, Università di Firenze, Via Della Lastruccia 3, I-50019 Sesto Fiorentino, Firenze, Italy
cICCOM-CNR, Istituto di Chimica Dei Composti OrganoMetallici, Via Madonna Del Piano 10, I-50019 Sesto Fiorentino, Firenze, Italy
dJulius-Maximilians-Universität Würzburg, Institut für Anorganische Chemie, Am Hubland, 97074 Würzburg, Germany. E-mail: alexandra.friedrich1@uni-wuerzburg.de
eEuropean Synchrotron Radiation Facility, ESRF, 71 Avenue des Martyrs, CS40220, 38043 Cedex 9 Grenoble, France
fDepartment of Physics, University of Durham, Science Labs, South Road, Durham DH1 3LE, UK
First published on 4th April 2025
Abstract
This study addresses azobenzene's structural compression and reactivity under hydrostatic high-pressure conditions. Synchrotron X-ray diffraction data of single crystals compressed with neon as the pressure-transmitting medium allowed the refinement of the crystal structure up to 28 GPa, at which the onset of the reaction was observed. Analysis of the pressure-dependent lattice parameters reveals a first-order isostructural phase transition at 13 GPa. We have solved the crystal structure of the high-pressure phase of azobenzene offering a key insight into the strong contribution of stress on the structural compression mechanism and crystal's reaction chemistry at elevated pressures. While the collapse of the b cell parameter, previously observed under non-hydrostatic conditions, was identified as the crucial step toward the formation of azobenzene-derived double-core nanothreads, under quasi-hydrostatic conditions the compression of the cell parameters up to 33 GPa followed a different route. The evolution of the cell parameters and the refinement of the crystal structure close to the onset of the reaction identified a topochemical polymerization path, corroborated by reaction kinetics data by infrared spectroscopy and by computed polymer structures, suggesting a complex growth process, resulting in a distinctly different material compared to that formed upon non-hydrostatic compression. These findings underscore the pivotal role of compression conditions in determining the reaction pathways of azobenzene, providing novel insights for its application in nanomaterial synthesis.
1 Introduction
Nanothreads are the thinnest crystalline one-dimensional nanomaterial made by saturated carbon atoms primarily synthesized by compressing aromatic and heteroaromatic molecules. Their formation apparently challenged previous studies in which the compression of model aromatic molecules led to amorphous materials. The benzene case is paradigmatic, as this molecule is representative of the behavior of aromatics. The nanothread synthesis from benzene1 was at variance with previous reports which identified the product of the high-pressure reaction as an amorphous hydrogenated carbon species.2,3 This apparent contradiction was explained by identifying the pathway leading to the nanothread formation, the diagonal of the unit cell, as non-topochemical and becoming favored once the applied stress is aligned along this crystal direction.4 However, experimental evidence of microscopic mechanisms governing the selection of a non-topochemical path at the expense of the topochemical one are still missing. From this point of view, the reactivity of azobenzene induced by pressure is of notable significance. This compound also exhibits an apparent competition between two reaction paths leading to the formation of crystalline double-core nanothreads or amorphous hydrogenated carbon materials. Spectroscopic and diffraction experiments were recently performed to characterize the reaction evolution and the products formed.5–7 Azobenzene, compressed with no pressure-transmitting medium (PTM) up to 25–30 GPa while avoiding laser irradiation, transformed into micron size 2D crystalline double-core nanothreads embedded in an amorphous matrix.6,7 This reaction was also investigated by computational studies, confirming the experimental observations concerning the chemical inertness of the azo groups, which remain untouched during the polymerization, acting as an unsaturated bridge linking the two nanothread cores.8 Azobenzene-derived nanothreads are the product of the reactivity of aromatic moieties along their stacking axis direction, which is the b axis according to the reported P21/c crystal structure.9 A recent study also hypothesized a different reaction product arising from the topochemical polymerization of azobenzene under non-hydrostatic reaction conditions.10 According to this study, nanoribbons of polymerized azobenzene are formed, also involving reaction of the azo groups, through the polymerization of azobenzene along the ab crystallographic plane (using the previous frame of reference, P21/c).The driving force leading to the linear polymerization along a specific crystallographic direction, which is crucial for nanothread synthesis, has been attributed to distinct phenomena strongly dependent on the intra- and intermolecular interactions characterizing the starting precursor. There are several examples of such reactions proceeding along the topochemical direction. The clearest examples are probably the reactivity of triazine11 and arene-perfluoarene co-crystals,12–15 both of which react exploiting the favorable stacking arrangement determined by the π–π interactions. The reactivity of cubane forming nanothreads, for example, is attributed to the energy release of the highly strained bonds triggered by the high temperature under high-pressure conditions, permitting polymerization along the direction corresponding to the shortest C⋯C contacts.16 The high-pressure reactivity of aniline to yield nanothreads17 was attributed to a topochemical process involving the complex hydrogen bond framework18 and lattice motions.2 This is an example of how the linear polymerization into nanothreads can be driven by thread-directing groups or side reactions as also reported for pyridazine19 and diphenylacetylene.20 Remarkably, in the latter case, the polymerization of the acetylene moieties triggers the nanothread formation also explaining the very similar reactivity of diphenylacetylene observed in both non-hydrostatic20 and quasi-hydrostatic21 compressions. A common aspect of all of the topochemical reactions is the large amount of transformed material (reaction yield).
On the other hand, polymerization into nanothreads was widely observed even for precursor crystals for which the topochemical path leads to a different product. The most remarkable case is certainly benzene,1,2 a model for nanothread synthesis. To explain the non-topochemical reactivity to form nanothreads of these systems, the effect of the strong deviatoric stress introduced upon compressing the samples with diamond anvil cells (DAC) without a pressure-transmitting medium was invoked.4,22 The DAC itself provides the necessary strong anisotropic load,23 and the uniaxial stress can result in significant distortions of the crystal unit cell at high pressure compared to similar loads applied quasi-hydrostatically.24 The effect of the uniaxial stress influences the reactivity by the introduction of defects and dislocations into the crystals,25 which act as nucleation centers permitting reactivity in systems that present a remarkable chemical inertness in a quasi-hydrostatic environment.26 The effect of uniaxial stress can also discriminate different reaction pathways, inducing the system to follow non-topochemical routes leading to different reaction products.27,28
With regard to azobenzene and stilbene, once compressed without using any PTM, immediately above a phase transition between 10 and 12 GPa a sudden decrease of a lattice parameter, namely the b axis, determines a molecular arrangement which is very similar to the one of the nanothreads forming around 20 GPa.6,7,29 This suggests a topochemical reaction likely favored by a more efficient charge delocalization on the aromatic rings as recently evidenced in the case of stilbene.30 With this in mind, we have studied the pressure-induced reactivity of azobenzene when compressed in a quasi-hydrostatic way (employing both neon and argon as PTM). High quality single-crystal data confirmed the occurrence of a phase transition at 13 GPa and evidenced the crucial role that it plays in determining the reaction pathway. Indeed, nanothreads do not form, but a polymer is obtained upon compressing azobenzene hydrostatically. The structure of the polymer obtained is proposed by merging numerous results, obtained from detailed single-crystal X-ray diffraction (SC-XRD) experiments, the reaction kinetics analysis realized through in situ Fourier transform infrared spectroscopy (FTIR), and quantum mechanical computations based on density functional theory (DFT). This polymer drastically differs from azobenzene-derived nanothreads, which are demonstrated to be the non-topochemical product of the non-hydrostatic compression of azobenzene.
2 Results and discussion
Azobenzene single crystals were compressed to 33 GPa using neon as pressure-transmitting medium, which ensures quasi-hydrostaticity throughout the pressure range.31 Diffraction data were collected from two differently oriented crystals using synchrotron X-ray radiation, and data were combined for the determination of the crystal structures on pressure increase up to 28 GPa. Pictures of the crystals investigated are shown in Fig. S1 in the ESI.† The different orientation of the two crystals in reciprocal and real space is shown in Fig. S7.† The merging of data sets from two crystals improved the completeness of the high-pressure data, which usually suffers from the restriction of access to reciprocal space induced by the high-pressure cell. This is especially important for low-symmetry compounds and corroborates the high quality of our SC-XRD data. The high data quality is also apparent in the diffraction images acquired at 0.2 and 28 GPa (Fig. 1). | ||
| Fig. 1 Top: inner sections of wide-scan (δω = 65°) X-ray diffraction images of azobenzene single crystal at (a) 0.2 GPa, (b) 28 GPa, before the reaction, and (c) after decompressing the polymer at 1.3 GPa, using neon as the pressure-transmitting medium. Of particular interest is the observation of single-crystal spots from the recovered polymer (c), that allowed indexing of the unit cell parameters of the product. Bottom: 1D azimuthally integrated diffraction patterns of the respective images. Ticks indicate the calculated reflection positions using the unit cell metrics determined at the respective pressure. Diffraction from neon is marked by asterisks. | ||
2.1 Unit-cell compression of azobenzene
The unit-cell volume of azobenzene as a function of pressure is shown in Fig. 2 for experiments performed under different conditions, while the pressure evolution of the cell axes and the monoclinic β-angle are shown in Fig. 3. Red filled and empty dots represent the current single-crystal compression and decompression data, respectively, while green and blue dots represent results from our previous diffraction experiments on azobenzene powder samples compressed with nitrogen as the PTM and without a PTM, respectively.7 The high quality of our single-crystal diffraction data is obvious from the minor data scatter, the consistency between the unit-cell volumes of the two individual crystals (light and dark red dots, respectively), and the small standard uncertainties which are smaller than the symbol size. Slight deviations in the unit-cell compression of the two crystals are only observed at pressures >13 GPa for the unit-cell axes and the β-angle (Fig. 3), and may be attributed to artifacts arising from the different orientation of the crystals in the diamond anvil cell and, hence, differently restricted access to the reciprocal space. | ||
| Fig. 2 Volume of the unit cell as a function of pressure under different experimental conditions. Data from ref. 7 for compressions of azobenzene powder without a PTM and with N2 as the PTM are reported with blue and green dots, respectively. The two shades of red dots are related to the compression of the two single crystals of azobenzene using Ne as the PTM. Empty dots refer to data acquired of the same crystals in decompression. The solid black line represents the Rose–Vinet equation of state employed to fit the single crystal data, for which parameters are shown in the graph. The fit was performed in the pressure range 0 to 13 GPa before the phase transition. An enlarged view of the pressure evolution of the volume across the transition (single crystal data) is reported as an inset. Only a few error bars are reported for the sake of clarity; error bars smaller than the dot diameter characterize the single crystal experiment. | ||
 | ||
| Fig. 3 Pressure evolution of the crystal cell parameters: blue and green dots refer to data sets from ref. 7 of azobenzene powder compressed without any PTM and with N2 as the PTM, respectively. The two shades of red dots are obtained during the compression of the two azobenzene single crystals using neon as the PTM. For the sake of clarity only a few error bars are shown. Error bars smaller than the dot diameter characterize the single crystal experiment. | ||
The unit-cell volume shows a nearly continuous reduction up to ca. 28 GPa with only a very slight anomaly at 13 GPa (see the inset in Fig. 2). However, strong discontinuities are observed in the pressure evolution of the cell axes and β-angle at 13 GPa, at which an abrupt decrease of the crystallographic a axis and increase of both the b axis and the monoclinic β-angle occur (Fig. 3). Hence, our single-crystal data clearly highlight a first-order phase transition at 13 GPa and allow us to determine precisely the unit cell of the high-pressure phase. The c axis is only slightly decreased and the α- and γ-angles remain 90° (see Fig. S2 in the ESI†), therefore indicating the preservation of monoclinic symmetry. The occurrence of a pressure-induced phase transition has previously been reported for azobenzene at 7.5–10 GPa from high-pressure Raman spectroscopy and powder X-ray diffraction.5,7,10 The lower transition pressure observed in the previous experiments, in which no PTM was used, is attributed to the less hydrostatic conditions compared to the quasi-hydrostatic conditions provided by neon as the PTM in our single-crystal XRD experiments. The dependence of the transition pressure on the hydrostaticity also explains why only hints of a reversible phase transition were observed in previous powder XRD experiments up to 12 GPa using N2 as the PTM, which also preserves more quasi-hydrostatic conditions in this pressure range.7
Single-crystal unit-cell volume data up to a pressure of 13.0 GPa, at which the phase transition takes place, were fitted to a Rose–Vinet equation of state.32 The value of V0 = 991 Å3 was fixed to the literature value.9 The fit yielded a bulk modulus B0 = 6.7(1) GPa and its pressure derivative B′ = 8.5(1), typical values for a molecular crystal.33 This result represents the best fit (solid line in Fig. 2) for the low-pressure phase excluding experimental data of the high-pressure phase (p > 13 GPa). The cell axes exhibit an almost isotropic reduction between 0 and 13 GPa (relative length reductions: a axis −13.6%, b axis −11.4% and c axis −11.2%).
Up to ca. 10 GPa (which is close to the hydrostatic limit of N2),31 the present data are in satisfactory qualitative agreement with previous experiments we performed on azobenzene powder samples, both with and without a PTM (green and blue dots, respectively, in Fig. 3). For higher pressures, while the unit-cell volume is still in agreement, the individual cell parameters follow distinct paths depending on the compression environment. In particular, the pressure evolution of the a and b axes diverges after the phase transition. The behavior of the b axis is of particular interest; while its collapse under non-hydrostatic conditions was identified as the key factor leading to the formation of nanothreads along this direction,6,7 the b axis increases upon compressing azobenzene quasi-hydrostatically (this study). The opposite is observed for the a axis. This indicates a significant role of hydrostaticity versus stress on the unit-cell geometry and, hence, the structural configuration of the high-pressure phase and the compression behavior of this system on further pressure increase. Interestingly, under quasi-hydrostatic conditions, the b axis is almost non-compressible in the high-pressure phase of azobenzene up to 28 GPa and even along the following polymer formation up to the highest pressure of 33.0 GPa. This underlines its minor role in the bond formation mechanism on polymerization in the topochemical reaction. While the unit-cell compression was almost isotropic in the low-pressure phase (0–13 GPa), the cell anisotropically shrinks after the phase transition. In particular, while the b axis varies by less than 1.0%, the a and c axes are shortened by −15.0% and −9.6%, respectively, in the pressure range from 13 to 32.5 GPa.
A discontinuous drop is observed in the unit-cell volume between 28.2 and 29.7 GPa, and then the volume continuously decreases again up to 32.5 GPa, the highest pressure of our study (Fig. 2). This volume drop is attributed to the polymerization reaction and the change of unit-cell dimensions in the polymer. The pressure-induced formation of azobenzene-derived nanothreads under non-hydrostatic conditions has already been reported with the onset at lower pressures (18–20 GPa), and a higher transformation rate at 25 GPa.6,7,10 The higher reaction pressure observed in this study is attributed to the absence of deviatoric stress due to quasi-hydrostatic conditions in the pressure chamber. A discontinuity in the pressure evolution is also obvious in the reduction of the a and c cell parameters, a slight increase of the b axis, and an evident decrease of the β-angle by ca. −1° (Fig. 3). It needs to be noted here that the quality of the single-crystal diffraction is strongly decreased by the reaction and distinct single-crystal diffraction spots are only observed at low resolution, which indicates the presence of local order but a high degree of disorder in the polymer structure. However, we succeeded in indexing the polymer phase and following the unit-cell compression up to 32.5 GPa and on decompression down to 1.28(2) GPa, at which the diamond-anvil cell got stuck.
Our decompression data of the polymer confirm the irreversibility of the process occurring at ca. 28–29 GPa, and the stability of the polymer on pressure quenching. A comparison of the unit-cell volumes of the molecular and polymer structures of azobenzene at the same pressure of 1.28 GPa shows a volume reduction of ca. 18% in the polymer.
2.2 Structure compression of the low-pressure phase up to 13 GPa
The crystal structure of trans-azobenzene was first published in the monoclinic space group P21/a, a non-standard setting of space group no. 14,34,35 and later on in the standard setting of the space group, in P21/c.9 The b axis is the common axis in both settings and the transformation matrix from P21/a to P21/c is (![[1 with combining macron]](https://www.rsc.org/images/entities/char_0031_0304.gif) 0 , 0 1 0, 1 0 0). Both settings have been used in subsequent work, the P21/a setting in the temperature-dependent studies on the pedal motion in azobenzene by Harada and Ogawa,36,37 and the P21/c setting in the pressure-dependent studies by Li et al., Romi et al., and Zhang et al.7,10,38 In this study, we will refer to the P21/c standard setting.
0 , 0 1 0, 1 0 0). Both settings have been used in subsequent work, the P21/a setting in the temperature-dependent studies on the pedal motion in azobenzene by Harada and Ogawa,36,37 and the P21/c setting in the pressure-dependent studies by Li et al., Romi et al., and Zhang et al.7,10,38 In this study, we will refer to the P21/c standard setting.
There are two symmetry-independent molecules in the unit cell, both having inversion symmetry. Molecule A is located on the inversion center in 1/2, 0, 1/2 (and 1/2, 1/2, 0) with Wyckoff symmetry 2d (referred to as site 1), and molecule B is dynamically disordered at room temperature on the inversion center in the origin 0, 0, 0 (and 0, 1/2, 1/2) with Wyckoff symmetry 2a (referred to as site 2). The configurational disorder of molecule B was first described by Brown35 and its degree was refined to 17% at ambient temperature by Bouwstra, Schouten, and Kroon.9 The two conformers of molecule B are related by an approximate 2-fold rotation about the longest axis of the molecules,9,35 or, as will be seen in the high-pressure structures in this study, by reflection about a vertical plane perpendicular to the plane of the molecules through the longest axis of the molecules. The temperature-dependence of the disorder was studied in detail by Harada and Ogawa.36,37 They found that it is dynamic, as the degree of orientational disorder, due to a pedal motion, decreases on cooling and disappears at 150 K in the equilibrium state.36 However, the minor, unstable conformer could be preserved on shock-cooling in the thermodynamic non-equilibrium state with the degree of disorder depending on the cooling rate.37
In our study, the crystal structure of azobenzene was determined at ambient pressure and room temperature and at 100 K to serve as a reference for the high-pressure structures. Our structural parameters and refined degrees of pedal motion disorder (17(2)%) at 298 K and unobserved at 100 K, respectively, (Table S1†) agree well with those reported by Bouwstra, Schouten, and Kroon9 and Harada and Ogawa36 at room temperature (17–19%) and by Harada and Ogawa36,37 at 150 K (6%) and 90 K (no disorder observable in the equilibrium state).
The evolution of the pedal motion disorder of molecule B with pressure is shown in Fig. 4. Our high-pressure structure data reveal a decrease of the disorder from 15(2)% at ambient pressure to 4(1)% at 4 GPa, which is in accordance with a dynamic disorder and the observed decrease on lowering the temperature. However, on further pressure increase, the disorder increases again up to 33(2)% at 12–13 GPa. This indicates that the minor conformer again becomes more stable with respect to the main conformer on pressure increase. We suppose this to be a static disorder, as dynamic motion is not supposed to be present at these high pressures. Note that the neon PTM freezes at ca. 5 GPa; hence, the slightly different surrounding conditions may have an effect on the crystals in the pressure chamber. At 13 GPa, the phase transition to the high-pressure structure takes place and this is accompanied by a loss of the disorder. Only one stable structural configuration exists in the high-pressure phase.
 | ||
| Fig. 4 Degree of the pedal motion disorder (%) of molecule B (site 2) of azobenzene as a function of pressure. At 13 GPa, the phase transition takes place and no disorder is observed in the high-pressure phase. Molecule B is drawn at distinct pressures and the site occupation factor is expressed by the opacity of the nitrogen atoms. Hydrogen atoms are omitted for clarity. | ||
In the azobenzene molecules, the phenyl rings are parallel but not coplanar. The evolution of the interplanar separation s between the planes of the phenyl rings as a function of pressure is shown in Fig. 5. The value of s varies between 0.07 and 0.55 Å in the whole pressure range. While s decreases on pressure increase up to the phase transition at 13 GPa in molecule A, which is becoming more coplanar, s is strongly increasing in the disordered molecule B, which becomes more distorted. At the phase transition, the loss of the disorder in molecule B is accompanied by a strong decrease of s. In the high-pressure phase, both molecules exhibit a similarly small separation, which is again increased in both molecules on pressure increase. Interestingly, s and, hence, the distortion of molecule B, strongly increases close to the onset of polymerization at ca. 28 GPa.
 | ||
| Fig. 5 Interplanar separation, s, between the planes of the parallel phenyl rings of the azobenzene molecules A and B as a function of pressure. | ||
As mentioned above, azobenzene molecules are situated on inversion centers in the crystal structure (Fig. 6). They are staggered along the b axis with the b cell parameter being the separation distance of the molecules in this direction (b = 5.788(2) Å at ambient conditions). The planes of the phenyl rings and, hence, the molecules are tilted by the angle ϕ with respect to the staggering axis, i.e., the b axis. This angle is 24.3° and 27.8° for molecules A and B, respectively, at ambient conditions (Fig. 7). Considering the long intermolecular separation along b and the small tilt angles ϕ of the phenyl rings with the b axis, it is obvious that there is no π-stacking interaction present along the b axis. Indeed, there is no π-stacking interaction present in the low-pressure structure at all. On pressure increase, the b axis is reduced to 5.149(1) Å at 12.7 GPa and ϕ is slightly decreased to 22.1° and 23.8° for molecules A and B, respectively.
 | ||
| Fig. 6 Crystal structure (left) of the azobenzene low-pressure phase at 12.7 GPa and (right) the high-pressure phase at 13.6 GPa. Top: crystal structure projected along the b direction; bottom: part of the crystal structure with all molecules situated on inversion centers at z = 0, projected along the c direction. Hydrogen atoms are omitted for clarity. Molecules A are located at x = 0.5, molecules B at x = 0. The site occupation factor of the disordered nitrogen atoms is reflected by the degree of opacity. The shaded boxes delimit the size of the projected molecule B before (red) and after (blue) the phase transition. | ||
 | ||
Fig. 7 Pressure evolution of the ϕ and θ angles of molecules A and B on compression and across the phase transition at 13 GPa. A scheme of one stack of azobenzene molecules along the b axis is also shown. The distance between the aromatic ring centroids (d) corresponds to the value of the b axis; ϕ and θ are the angles between the phenyl rings (C6) or the N![[double bond, length as m-dash]](https://www.rsc.org/images/entities/char_e001.gif) N double bond and the b direction, respectively. N double bond and the b direction, respectively. | ||
The equivalent isotropic displacement parameters have also been extracted for all atoms and their evolution as a function of pressure (Fig. S8†) closely reflects the structural changes previously discussed. A rapid decrease of all the Ueq with pressure, from ∼0.08 Å2 to a minimum of ∼0.02 Å2 around 6 GPa occurs, which is expected due to the high density increase of the crystal that progressively reduces the molecule's motion.13,39 Up to the phase transition, molecule B has values of Ueq consistently larger than molecule A by ca. 0.01 Å2, and its behavior closely resembles the pedal motion disorder (Fig. 4). Before the phase transition at 13 GPa, the Ueq values increase up to ∼0.045 Å2 to then abruptly drop to ∼0.02 Å2 again. Just before the polymerization threshold at 28 GPa, another rapid increase is observed which is indicative of a reactive state.
2.3 Phase transition and high-pressure phase compression up to pressure-induced polymerization reaction
At 13.04(6) GPa, both the low- and the high-pressure phases were concomitantly present in one of the crystals and data of both phases were integrated from a single data set. Hence, this was found to be the pressure of the phase transition. We have determined the crystal structure of the high-pressure phase at slightly higher pressure when the transition was complete. Structural changes will subsequently be discussed on the refined structures of the low-pressure phase at 12.7 GPa and of the high-pressure phase at 13.6 GPa.The crystal structure of the high-pressure phase was solved in the same translational lattice and space group, P21/c, hence, they are isostructural. From the projection onto the ac plane, i.e., (010), we can observe minimal changes concerning molecules A aligned at x = 0.5 (Fig. 6). In contrast, distinct changes are observed for molecules B at x = 0, which lose their conformational disorder and tilt aligning more parallel to the b axis. The tilt is quantitatively derived by following the parameters defined in Fig. 7, in which a simplified representation of one stack of azobenzene molecules aligned along the b axis is displayed. The distance between the aromatic ring centroids (d) corresponds to the value of the b axis and the angles ϕ, between the phenyl rings and the b direction, and θ, between the NN double bond and the b axis, indicate by how much the molecules are tilted with respect to the b axis. Both angles ϕ and θ decrease at the phase transition (Δϕ = −8.2°; Δθ = −26.2°). Especially, the latter is strongly reoriented with θ decreasing for the molecule B from 46.8° at 12.7 GPa to 20.4° at 13.6 GPa. In addition, the intramolecular separation s between the phenyl rings of molecule B decreased from 0.52 Å at 12.7 GPa to 0.17 Å at 13.6 GPa making molecule B flatter (Fig. 5). The reorientation of molecule B towards the b axis results in the increase of the b cell parameter and, hence, distance d from 5.15(1) Å (12.7 GPa) to 5.45(1) Å (13.6 GPa) and the decrease of the a cell parameter from 13.09(1) Å (12.7 GPa) to 12.40(3) Å (13.6 GPa) at the phase transition (Fig. 3). This is qualitatively shown in Fig. 6 using red and blue shaded boxes to delimit the azobenzene molecule at 12.7 and 13.6 GPa, respectively. Also, for molecules A, the ϕ angle considerably decreases, indicating a more pronounced alignment of the aromatic rings along the b axis.
All of these changes highlight the stiffness of the b axis of azobenzene single crystals on quasi-hydrostatic compression and the obvious absence of π-stacking in this direction. This is in stark contrast to earlier experiments on azobenzene powder samples under non-hydrostatic conditions, in which the b axis was strongly reduced at the phase transition, and this was interpreted by a rearrangement of molecules A and B perpendicular to the b axis, instead of parallel, as observed under quasi-hydrostatic conditions. A reorientation perpendicular to the b axis under stress could result in π-stacking and, hence, in a conformation suitable to induce nanothread formation along this axis, as suggested in the earlier studies.6,7 There is no indication for such a rearrangement at the phase transition under quasi-hydrostatic conditions.
As already noted above, after an almost isotropic reduction of the cell parameters between 0 and 13 GPa, the unit cell of the high-pressure phase shrinks anisotropically on further compression. The b axis is almost non-compressible even up to 33.0 GPa, the highest pressure obtained in this study. This is in agreement with the further decrease of the ϕ and θ angles of the molecules and, hence, the tilt towards a more parallel arrangement with the b axis (Fig. 7). At the highest pressure at which we refined the crystal structure (28.2 GPa), the ϕ angles reach 11.1° and 9.9° for molecules A and B, respectively. This is responsible for the crystal stiffness along the b axis. The distance d between the centroids of the aromatic rings of molecules stacked along b at 28.2 GPa is almost equal to that at 13.6 GPa (d = 5.45(1) and 5.49(1) Å at 13.6 and 28.2 GPa, respectively). The most compressible axis in the high-pressure phase is the a axis and to a lesser extent the c axis (shortened by 15.0% and 9.60%, respectively, between 13 and 33 GPa).
The strong anisotropic contraction of the unit cell upon compression implies different relative displacements of the azobenzene molecules as reported in Fig. 8. In the upper panel of this figure, the shortest carbon–carbon contacts are reported as a function of the applied pressure. The nitrogen–carbon contacts have been neglected as evidence of their involvement in the reaction is missing.6,8 A separate plot of the N⋯C contacts can be found in the ESI, Fig. S4.† Further confirmation of the chemical inertness of the azo group will be provided below. An abrupt reduction of all the contacts takes place near the phase transition, whereas they undergo a continuous linear shortening on further pressure increase (Fig. 8). All of these C⋯C contacts were selected because they are shorter than 3.4 Å, which is double the van der Waals radius of carbon and is considered a limit for the molecular stability in photo-induced reactions.40 Remarkably, all of them belong to the ac plane as there is practically no contraction of the crystal along the b axis, as extensively discussed. The possibility of reactivity occurring along the b axis, observed in azobenzene compressed non-hydrostatically, i.e., when subjected to strong anisotropic stress,6,7,10 is therefore excluded. On the other hand, the shortest contacts still belong to aromatic rings residing in planes parallel to each other, but lying along the a axis of the crystal unit cell. This direction is the most compressible after the phase transition (overall shortening of 27.0%) leading to the important consequence of progressively increasing π–π interactions (Table S7†).
 | ||
| Fig. 8 Short intermolecular C⋯C contacts in the azobenzene high-pressure phase. In the upper panel, the contact distance of the shortest carbon–carbon contacts is given as a function of pressure from 12 GPa up to the highest pressure (∼28 GPa) at which the structure was refined. In the bottom panel, the azobenzene crystal structure, as obtained from the refinement of single-crystal data at 28.2 GPa, is shown. The shortest contacts are highlighted using a combination of colors and symbols consistent with those reported in the upper panel. | ||
2.4 Polymerization pathways: experimental and computational results
One of the main purposes of this work is to pinpoint the topochemical routes characterizing azobenzene polymerization when subjected to quasi-hydrostatic compression. According to both previous theoretical and experimental studies, the lattice phonon-assisted topochemical reaction between aromatic rings occurs when the C⋯C distance is between 2.7 and 2.5 Å.2,13,41 At room temperature the computed thermal translational contribution is of the order of 0.25 Å;2 therefore, the carbon atoms that likely react in the azobenzene crystal at high pressure can be identified from Fig. 8 as those lying below 2.9 Å. Starting from ca. 26 GPa, the C5⋯C12 (orange pentagon) and C8⋯C11 (green diamond) contacts decrease greatly on increasing pressure to below 2.5 Å at the onset of the polymerization reaction. This likely indicates a preference for their involvement in the reaction. Furthermore, it is important to note that the formation of specific new bonds precludes the possibility of forming others involving the same carbon atoms, in spite of the C⋯C distance being adequately short. This means that, when favoring the C5⋯C12 and C8⋯C11 contacts for bond formation, the other contacts with the respective carbon atoms, i.e., C8⋯C12 (black dot), C9⋯C12 (violet downward triangle), and C4⋯C8 (golden cross), cannot form bonds concomitantly. Under this preassumption, another good candidate remaining for bond formation is the short C2⋯C6 contact (red squares), formation of which would preclude the formation of bonds from C2⋯C5 (empty triangle), C6⋯C10 (purple triangle), and C3⋯C6 (pink hexagon) contacts.All of this reasoning is also supported by theoretical calculations of possible stable polymer structures in the athermal limit. The crystal structure of molecular azobenzene obtained experimentally at the highest pressure of 28.2 GPa was geometry-optimized in space group P1, i.e., without considering symmetry, at various high pressures equal to and above 30 GPa. The experimentally obtained unit-cell parameters of the main polymer phase were taken as the starting values. Two polymer structures were found, both of them being stable at 30 GPa which we will refer to as “polymer I” and “polymer II” (Fig. 9). The phonon dispersion curves for both polymer structures (Fig. S9†) present only positive real modes ensuring that they are in an energy minimum. As the unit-cell angles of both computed polymers pointed to monoclinic symmetry, the computed structures in P1 could be transformed by 100% to monoclinic structures in space group P21/c for polymer I and P21/n for polymer II using PLATON software.42 The structure of polymer II was then transformed to the same P21/c space group setting in order to make it comparable with both the molecular structure and the structure of polymer I. Polymer I seems to be an intermediate structure that is stable over a pressure range of only a few GPa, showing a few bonds between the molecules, and would transform on further pressure increase to polymer II, which is fully saturated with several bonds between the molecules, also involving the nitrogen atoms of the azo groups. The intermediate polymer I better fits our experimental results in the pressure range investigated up to ca. 33 GPa at quasi-hydrostatic conditions: C8–C11 bonds are formed in layers of molecules B, C2–C6 bonds in layers of molecules A, and C5–C12 bonds between those layers. Computations to find another intermediate polymer phase that involves C–N bond formation with the azo group only of molecules B, were not successful, and always resulted in one of the two other polymers. This suggests that polymer II would be the final polymer structure obtained if the pressure were increased beyond the values achieved in our experimental study. However, under the conditions of our experiments up to 33 GPa, polymer II does not seem to be accessible. Our unit-cell data of the polymer compare better with those of polymer I at the same pressure (Table S9†) and, also, considering the IR studies (vide infra), the azo groups are thought to be preserved in the reaction, as was also observed under non-hydrostatic conditions.6,8
 | ||
| Fig. 9 (a and b) Schematic and experimental view of the short contacts that lead to the formation of theoretical polymer I (d) and polymer II (e). The same color and symbol coding used in Fig. 8 is employed, while the bonds that form in polymer II are highlighted with star shaped symbols. The perspective shown in panel (c) highlights the layering nature of the bonds that extend in the c direction between molecules of the same type, and along the a axis through bonds between A and B molecules. | ||
It has to be noted that in polymer I, unsaturations remain on the C3–C4 and C9–C10 bonds for molecules A and B, respectively (Fig. 10d). This is also confirmed by their bond lengths of 1.306 Å and 1.316 Å, which are very similar to their respective values in the unreacted molecule (1.36 Å), while all the other bonds lengthen due to the change in hybridization of the carbon atoms (Table S13†). These bond lengths range in value between 1.46 Å and 1.52 Å, which are in perfect agreement with the expected values for Csp3–Csp2 and Csp3–Csp3 carbon bonds. A similar observation is made for the C1 and C7 atoms of molecules A and B, which form bonds with the N1 and N2 nitrogen atoms, respectively, and show a decrease of the C–N bond lengths by about 0.1 Å while the bonds of the azo groups increase by the same amount. This can be rationalized by the formation of double bonds between the carbon and nitrogen atoms, while the bonds between the nitrogen atoms become single bonds. Therefore, polymer I does not include any ionic or radical species and the valence of all the atoms is respected. Another point to note with respect to the polymer II structure, is its rather long, newly formed C1–C9 bond of 1.84 Å. The formation of bonds with similar length has already been reported for specifically designed, highly strained compounds.43 Given the extreme pressure conditions at which the polymer II structure would form, it is likely that the bond in question is lengthened from the high degree of strain that the structure experiences. The bond formation is also signaled by its Mulliken's population value, which is similar to the values obtained for the other bonds.
 | ||
| Fig. 10 Alternative pathways (a–c and e–g) compared to polymer I (d and h) considering the distribution of the shortest contacts among azobenzene molecules at high pressure which do not produce ionic or radical species. Bonding sites have the same color coding as employed in Fig. 8. At the top, the respective configurations of the aromatic rings after bond formation is shown. These examples are not mutually exclusive, highlighting the branching nature of the polymerization, forming two-dimensional branched layers from molecules A and B that extend in the ac plane. Interlinking between layers may occasionally be present through the C5–C12 bond. | ||
Considering other short contacts, slightly different alternative reaction pathways that do not produce ionic or radical species may be described. Such pathways are depicted in Fig. 10 where bonds are formed from the short contacts C3⋯C6 and C2⋯C5 next to each other on one side of the phenyl ring for molecules A, and C9⋯C12 and C8⋯C11 for molecules B, respectively, which corresponds to a [2 + 2] cycloaddition reaction (depictions a, b, e and f of Fig. 10). Another possibility is the formation of only one of these bonds, but on both sides of the phenyl ring on the same aromatic ring (depictions c and g of Fig. 10). It is important to note that these pathways can be combined with each other, which is ultimately what leads to a spread out polymer. Branching between layers is still likely to occur occasionally through the C5–C12 bond wherever these carbon atoms are available to bond.
Nevertheless, these considerations would not preclude the polymerization to develop in other directions. It is reasonable that, due to the numerous short contacts involving azobenzene molecules under high-pressure conditions, the proposed polymers and reaction pathways are not the only ones with a chemically ordered structure. The actual product is locally ordered but, due to the large number of possible competitive paths, branched disordered and amorphous regions are likely obtained. Furthermore, the possibility to form ionic and radical species can open reactive channels difficult to foresee. However, it is important to note that all new bonds allowed by the reconstruction of the short contacts of the high-pressure azobenzene crystal phase, compressed with the PTM, have their components distributed along more than one direction, thus excluding the possibility to synthesize the carbon nanothreads obtained upon compressing azobenzene non-hydrostatically.
2.5 Reaction kinetics from high-pressure infrared spectroscopy
The compression and polymerization of azobenzene under quasi-hydrostatic conditions were analyzed in detail by FTIR spectroscopy, and the results are summarized in Fig. 11. A few crystals of azobenzene were loaded into a DAC together with argon acting as pressure-transmitting medium. Despite the fact that the hydrostatic limit of argon is lower than that of neon,31 which could affect the overall hydrostaticity of the compression, it was found not to alter the reactivity of azobenzene compressed quasi-hydrostatically. Indeed, as will be discussed below, it was possible to distinguish the reactivity of azobenzene compressed with Ar unambiguously from that compressed non-hydrostatically. This is indirect evidence of the primary role that the phase transition plays in selecting the reaction pathway. Indeed, argon exhibits good hydrostaticity up to about 18 GPa,31 thus ensuring the passing of the phase transition under quasi-hydrostatic conditions. The effects of the quasi-hydrostatic compression are also visible in the IR absorption spectra. A selection is reported in the upper panel of Fig. 11, where the preservation of a remarkable quality can be appreciated well above the phase transition. A general blue shift of all vibrational modes was observed as expected by the density increase. Above 15 GPa, a widespread broadening of the bands also occurred, ascribable to the progressive increase of defects upon compression. This occurrence is particularly relevant in IR absorption experiments as the IR beam probes the entire sample of 150 μm in diameter. The line broadening complicates the identification of the reaction onset, also considering that it takes place well above 20 GPa. To overcome this issue we used the absorbance difference of two IR spectra measured at the same pressure, but separated by a few minutes (an example of the procedure is reported in Fig. S5†). The reaction onset was identified to occur at 24 GPa, by the appearance of sharp negative bands in the spectral window 700–1700 cm−1. These vibrations are characteristic of the aromatic moiety;44 thus, the intensity drop is attributed to the progress of a chemical reaction involving the phenyl rings of azobenzene.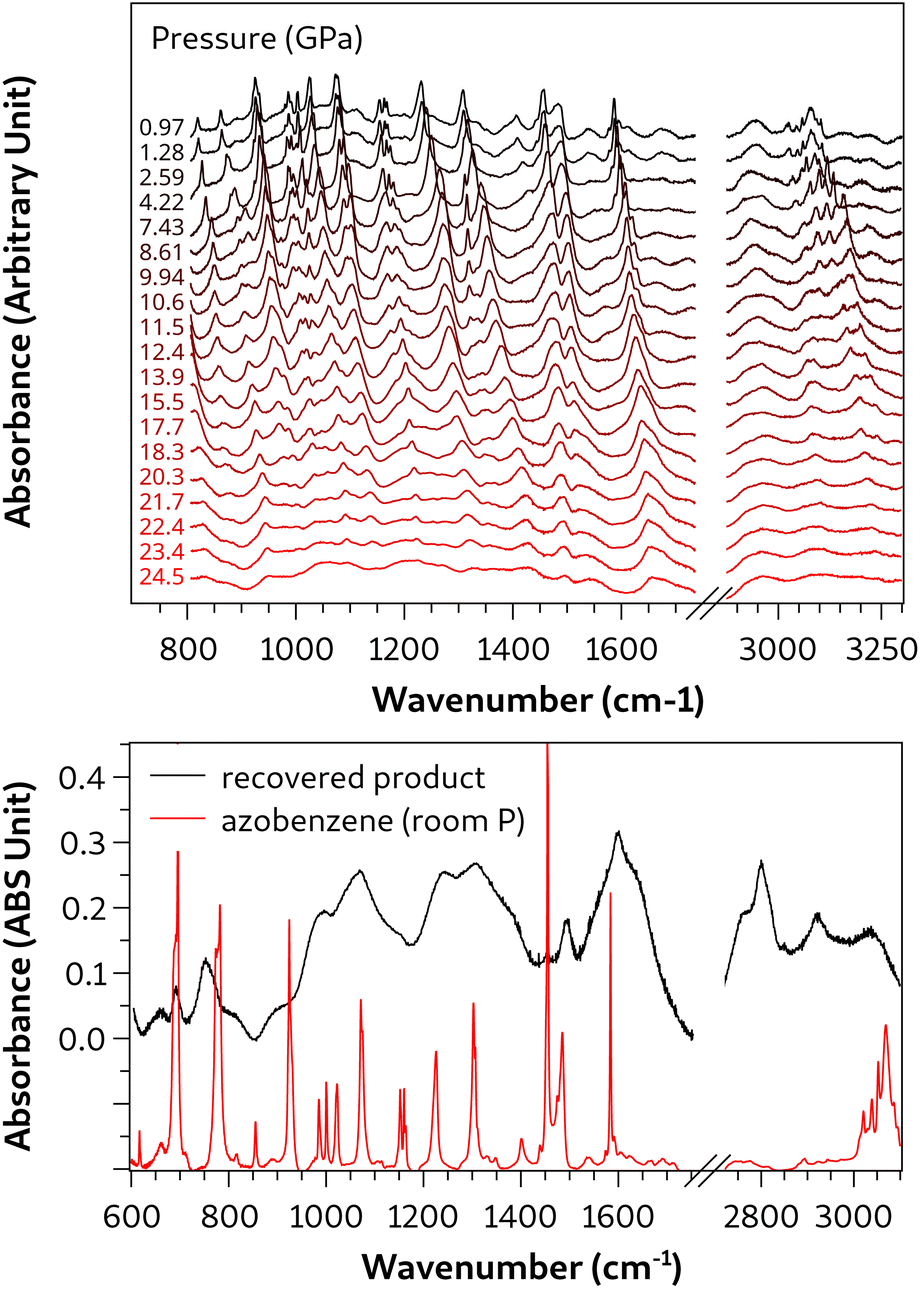 | ||
| Fig. 11 Upper panel: selection of infrared spectra of azobenzene single crystals compressed up to 24 GPa using Ar as the PTM. Lower panel: IR spectrum of the recovered reaction product obtained upon decompressing the sample, measured at room pressure inside the DAC. | ||
After the reaction reached the equilibrium, the sample was decompressed and the IR spectrum of the product recovered at ambient pressure was acquired and is reported in the lower panel of Fig. 11. The most remarkable indication of the chemical reaction is given by the new intense bands centered below 3000 cm−1, indicating the presence of CH stretching modes involving sp3 hybridized carbon atoms, evidence of the saturation, even partial, of the aromatic moieties. The broad band centered above 3000 cm−1 is instead attributed to sp2 CH stretching modes, indicating that the reaction product still contains a significant amount of unsaturation. Both features are in agreement with the proposed polymer (Fig. 9).
There is no clear sign of reaction from the azo group in the spectrum of the recovered product and the relatively sharp band located at 1475 cm−1, related to the NN stretching mode,44 hints that the azo group did not participate in the polymerization reaction. Additionally, the lesser absorbance decrease of this band during the reaction and in the recovered product with respect to the other monomer bands supports this assumption.
Although the analysis of the infrared spectrum of the reaction product derived from the quasi-hydrostatic compression of azobenzene is of undeniable interest, it does not provide enough information to distinguish this reaction product from the already characterized nanothreads, which primarily constitute the product of azobenzene compressed up to similar pressures but without a pressure-transmitting medium. Compelling support for the formation of a polymeric material different from the nanothreads, which adds to the XRD pattern of the recovered reaction product, comes from the reaction kinetics. The intensity of azobenzene absorption bands in the 1500 and 1800 cm−1 frequency range was obtained by fitting these bands with Voigt functions. An example of the fit is shown in Fig. S6.† The absorbance, which is proportional to the azobenzene concentration, as the entire sample chamber is probed by the IR beam, was determined as a function of time. Specifically, the intensity was first normalized and then expressed as the fraction of the consumed reagent. This resulted in the data presented in Fig. 12. The data were then analyzed with the Avrami kinetic law, opportunely modified to describe solid-state diffusion controlled reactions33,45–47 which is formally:

 | ||
| Fig. 12 Time evolution of selected infrared bands of the reaction product in the region of 1500–1800 cm−1 measured at 24 GPa. The error bars are due to the fit uncertainty. Experimental data have been fit to the Avrami kinetic law for diffusion-controlled solid state reactions45–47 (see text) and the related parameters are summarized in the inset. The values of the parameters k, n and t0 are not influenced by R∞, which is characterized by an undefined uncertainty. | ||
3 Conclusions
The structural evolution and the chemical transformation of azobenzene subjected to a quasi-hydrostatic compression up to ∼30 GPa, employing both argon and neon as pressure-transmitting media, were investigated and compared with the non-hydrostatic high-pressure reactivity. Azobenzene represents an attractive material being widely employed for realizing functional materials,48 molecular photo-switches,49–51 and graphene composites.52 As a building block of double-core carbon nanothreads, its photochemical properties are particularly appealing as they can be finely tuned by decorating the aromatic rings with functional groups53 or by interspersing it with other pseudo stilbenes.54 As a whole, polymers and other azobenzene derivatives can represent attractive nanomaterials of potential interest in various scientific, medical, and industrial fields. The most important result achieved in this study is the detailed characterization of the crystalline structure of azobenzene by single-crystal XRD analysis up to the reaction threshold that allowed us to depict the topochemical reaction which leads to a novel polymeric nanomaterial. According to the relative molecular orientations in the high-pressure crystal and distinct possible reaction pathways that lead to polymer branching, the formation of a mostly two-dimensional polymer derived from the cross linking of the aromatic moieties without the involvement of the azo group has been proposed. As the stable polymer structure that best fits to our experimental data, the three-dimensional polymer I was obtained from theoretical computations. Our results clearly define the role of the unidirectional applied stress in driving the nanothread formation observed in the previous studies. The isostructural phase transition occurring at 13 GPa represents the trigger of the transformation into nanothreads or branched polymers occurring at higher pressure depending on the compression conditions. Under the unidirectional stress exerted by the diamond anvil cell the crystal structure is forced to collapse along the b axis, i.e., the coordinate along which the nanothread develops. In contrast, this direction becomes extremely rigid once the phase transition is accomplished under quasi-hydrostatic compression conditions. The paramount importance of this discovery lies in the fact that the differences between the topochemical and non-topochemical reaction pathways of azobenzene have been clearly highlighted, a result that, in spite of the flourishing literature concerning the reaction mechanism characterizing small aromatic molecules involved in the nanothreads synthesis, was never experimentally demonstrated to the best of our knowledge.4 Experimental
4.1 In house single-crystal X-ray diffraction
Crystals suitable for single-crystal X-ray diffraction were selected, coated in perfluoropolyether oil, and mounted on polyimide microloops. Diffraction data were collected on a Rigaku Oxford Diffraction XtaLAB Synergy-R diffractometer with a semiconductor HPA-detector (HyPix-Arc-150) and multi-layer mirror monochromated Cu-Kα radiation generated by a rotating anode PhotonJet-R source. The temperature was regulated using an Oxford Cryostream 800 low-temperature device. Diffraction data were collected at 100 K and 298 K. The images were processed and corrected for Lorentz-polarization effects and absorption (empirical scaling) using the CrysAlisPro software55 from Rigaku Oxford Diffraction. The structures were solved using the intrinsic phasing method (SHELXT)56 and Fourier expansion technique. All non-hydrogen atoms were refined in anisotropic approximation, with hydrogen atoms ‘riding’ in idealized positions, by full-matrix least squares against F2 of all data, using SHELXL57 software and the SHELXLE58 graphical user interface. Diamond59 software was used for graphical representation. Other structural information was extracted using OLEX2 (ref. 60) and VESTA61 software. Crystal data and experimental details are listed in Table S1 in the ESI;† full structural information has been deposited with the Cambridge Crystallographic Data Centre. CCDC-2336566 and 2336607.4.2 High-pressure single-crystal synchrotron X-ray diffraction
Two azobenzene single crystals (25–50 μm diameter and 25 μm thickness) of different orientations were loaded together with small ruby balls (5–10 μm diameter) and two crystals of stilbene (related to another experiment) into a hole of 300 μm in a steel gasket pre-indented to a thickness of 80 μm in a membrane diamond anvil cell62 equipped with conical diamonds63 of 600 μm culet diameter and 64° opening angle, i.e., X-ray aperture. As a strong X-ray absorber, a small piece of gold was placed in the pressure chamber alongside the crystals for centering them at the ω rotation axis. The ruby balls were loaded for pressure determination using the pressure shift of the ruby fluorescence, which was induced by laser light (532 nm), using the pressure scale of Mao et al.64 Rubies were placed far away from the samples in order to avoid any possible laser damage or photo-induced reactivity. Compressed neon gas was loaded as a pressure-transmitting medium using a gas-loading autoclave system.High-pressure single-crystal X-ray diffraction experiments were performed using synchrotron radiation with a wavelength of 0.4100 Å and a beam diameter of about 10 μm at the ID15B beamline at the ESRF. A large area EIGER2 X 9M CdTe (340 × 370 mm) flat panel detector from DECTRIS company was used and the sample-to-detector distance was 180 mm, calibrated using a silicon standard. A vanadinite and an enstatite (MgSiO3) single crystal were used for the calibration of the detector parameters for data reduction in the program CrysAlisPro.55 The diffraction images were collected on compression at various pressures up to 32.46(6) GPa and on decompression down to 1.28(2) GPa by 0.5° ω-scanning across the opening angle of the diamond anvil cell. The image format was converted according to the procedure described by Rothkirch et al.65 for further processing with the CrysAlisPro software55 for indexing reflections, intensity data reduction, and empirical absorption correction. Crystal structures were refined with the SHELXL program57 using the SHELXLE graphical user interface.58 At each pressure, a single data set was recorded for each of the crystals and the data sets were combined in the structure refinement using different scaling factors. Due to the different orientations of the monoclinic crystals in the pressure chamber, the completeness of the data was increased from 31% and 44% for crystals 1 and 2 at d = 0.8 Å resolution (19% and 25% at d = 0.57 Å, respectively) to a completeness of ca. 54% at d = 0.8 Å (35% at d = 0.57 Å), which resulted in a significant improvement of the quality of the refined crystal structure. All non-hydrogen atoms were refined in anisotropic approximation, with hydrogen atoms ‘riding’ in idealized positions. The equivalent isotropic displacement parameters (Ueq), reported in Fig. S8,† have been extracted for every atom at each pressure point with the Python library and GUI crystchemlib.66 Crystal data and experimental details at high pressure and ambient temperature are listed in Table S2 in the ESI,† cell parameters of crystals 1 and 2 as a function of pressure are given in Tables S3 and S4 in the ESI,† respectively; full structural information has been deposited with the Cambridge Crystallographic Data Centre. CCDC-2336562–2336565, 2336567–2336606, and 2336608–2336622.
4.3 IR spectroscopy
Crystalline azobenzene (Sigma Aldrich, purity of 99%) was loaded in a membrane diamond anvil cell equipped with IIa type, Raman grade diamonds. Samples were laterally contained by a pre-indented stainless steel gasket drilled to have an initial sample chamber of about 150 μm diameter and 50 μm thickness. A micrometric ruby chip was loaded together with the sample in order to measure the pressure by the ruby fluorescence technique64 using few mW of a 532 nm laser line from a frequency-doubled Nd:YAG laser source. To avoid laser damage or photo-induced reactivity, the ruby was placed in an empty space within the gasket, ensuring it was kept separate from the sample. Argon was liquefied under gas pressure of 3–5 bar within a closed chamber that was cooled in a bath of liquid nitrogen, and loaded cryogenically in the pressure chamber of the diamond anvil cell as PTM. No irreversible phase transitions of azobenzene were induced by the cryogenic bath, as confirmed by laboratory XRD measurements performed just after the loading procedure. Fourier transform infrared absorption spectra were recorded using a Bruker-IFS 120 HR spectrometer suitably modified for experiments in a diamond anvil cell, with an instrumental resolution set to 1 cm−1.674.4 Computational details
The electronic and geometric structure calculations were performed within the density functional formalism using the CASTEP program.68 This is an implementation of the Kohn–Sham scheme based on a plane-wave basis set in conjunction with pseudopotentials. The calculations were performed with the accurate69 pseudopotentials from the CASTEP database using a kinetic cutoff energy and a Monkhorst–Pack grid70 which converges total energy differences to better than 1 meV per atom. The PBE71 exchange-correlation functional was employed. We consider that geometry self-consistency was achieved when the residual stress was <0.05 GPa and the maximal force <0.01 eV Å−1, yielding structures accurate to 0.005 Å with respect to numerical convergence.For the optimization of the lowest-energy minimum structure, all structural parameters were relaxed simultaneously in space group P1; symmetry was not constrained to allow for symmetry lowering geometries (commensurate with the unit cell). Crystal structure starting values were taken from the crystal structure of the high-pressure phase determined experimentally at 28.2 GPa and unit cell parameters from experimental values of the polymer phase at 30 GPa. Full geometry relaxations were then performed at various pressures at and above 30 GPa until polymerization occurred. The structures of molecular azobenzene and two polymer structures (named “polymer I” and “polymer II”) were fully geometry relaxed at 30 GPa and both found to be thermodynamically metastable at this pressure. The phonon dispersion curves (Fig. S9†) are calculated in space group P1 to avoid any constraints. The calculated modes are all positive without the presence of any imaginary mode, which ensures that the calculated structures lie on an energy minimum. Platon software42 was used to search for higher symmetry and retransform the triclinic structures to structures of monoclinic P21/c space group using the same setting as the starting molecular structure of azobenzene.
Data availability
Deposition numbers CCDC-2336562–2336622 contain the supplementary crystallographic data for this paper. These data can be obtained free of charge via the joint Cambridge Crystallographic Data Centre (CCDC) and Fachinformationszentrum Karlsruhe. FTIR data that support the findings of this study are available from the corresponding authors upon request.Author contributions
R. B. and A. F. conceptualized the work. A. F. analyzed crystallographic data, M. A. and S. R. analyzed spectroscopic data, S. J. C. carried out the computational analysis. M, A., A. F. and K. R. collected crystallographic data, M. A. and S. R. collected spectroscopic data. R. B., A. F. and S. R. wrote the original draft. M. A., R. B., A. F., T. B. M. and S. R. edited and reviewed the manuscript. M. H. supported synchrotron beamtime. S. F. and H. B. supported the preparation of the manuscript. R. B. and A. F. supervised and coordinated the project. R. B. acquired financial support leading to this publication.Conflicts of interest
There are no conflicts to declare.Acknowledgements
We acknowledge financial support under the National Recovery and Resilience Plan (NRRP), by the Italian Ministry of University and Research (MUR), funded by the European Union – NextGenerationEU – “Integrated infrastructure initiative in Photonic and Quantum Sciences” – I-PHOQS (IR0000016, ID D2B8D520, CUP B53C22001750006). We also acknowledge financial support by the Italian Ministry of University and Research (MUR) under the Project entitled NEw MatErials by high-presSure chemIStry- – CUP B53D23015760006. This study was also supported by the Deep Carbon Observatory (DCO, Alfred P. Sloan Foundation) initiative under the project Physics and Chemistry of Carbon at Extreme Conditions. We also thank ESRF, the European synchrotron, for hosting our experiment under proposal number CH-6291. Support from the Julius-Maximilians-Universität Würzburg is gratefully acknowledged.References
- T. C. Fitzgibbons, M. Guthrie, E. S. Xu, V. H. Crespi, S. K. Davidowski, G. D. Cody, N. Alem and J. V. Badding, Nat. Mater., 2015, 14, 43–47 CrossRef CAS PubMed.
- L. Ciabini, M. Santoro, F. A. Gorelli, R. Bini, V. Schettino and S. Raugei, Nat. Mater., 2007, 6, 39–43 CrossRef CAS PubMed.
- M. Citroni, R. Bini, P. Foggi and V. Schettino, Proc. Natl. Acad. Sci. U. S. A., 2008, 105, 7658–7663 CrossRef CAS PubMed.
- X. Li, M. Baldini, T. Wang, B. Chen, E.-s. Xu, B. Vermilyea, V. H. Crespi, R. Hoffmann, J. J. Molaison, C. A. Tulk, M. Guthrie, S. Sinogeikin and J. V. Badding, J. Am. Chem. Soc., 2017, 139, 16343–16349 CrossRef CAS PubMed.
- Z. Dong, N. M. Seemann, N. Lu and Y. Song, J. Phys. Chem. B, 2011, 115, 14912–14918 CrossRef CAS PubMed.
- S. Romi, S. Fanetti, F. Alabarse, A. M. Mio and R. Bini, Chem. Sci., 2021, 12, 7048–7057 RSC.
- S. Romi, S. Fanetti, F. Alabarse and R. Bini, J. Phys. Chem. C, 2021, 125, 17174–17182 CrossRef CAS.
- C. M. Miliante, J. D. de Matos and A. R. Muniz, Carbon, 2023, 215, 118387 CrossRef CAS.
- J. A. Bouwstra, A. Schouten and J. Kroon, Acta Crystallogr., Sect. C:Cryst. Struct. Commun., 1983, 39, 1121–1123 CrossRef.
- P. Zhang, D. Gao, X. Tang, X. Yang, H. Zheng, Y. Wang, X. Wang, J. Xu, Z. Wang, J. Liu, X. Wang, J. Ju, M. Tang, X. Dong, K. Li and H.-k. Mao, J. Am. Chem. Soc., 2023, 145, 6845–6852 CrossRef CAS PubMed.
- D. Gao, X. Tang, J. Xu, X. Yang, P. Zhang, G. Che, Y. Wang, Y. Chen, X. Gao, X. Dong, H. Zheng, K. Li and H. K. Mao, Proc. Natl. Acad. Sci. U. S. A., 2022, 119, e2201165119 CrossRef CAS PubMed.
- M. D. Ward, W. S. Tang, L. Zhu, D. Popov, G. D. Cody and T. A. Strobel, Macromolecules, 2019, 52, 7557–7563 CrossRef CAS.
- A. Friedrich, I. E. Collings, K. F. Dziubek, S. Fanetti, K. Radacki, J. Ruiz-Fuertes, J. Pellicer-Porres, M. Hanfland, D. Sieh, R. Bini, S. J. Clark and T. B. Marder, J. Am. Chem. Soc., 2020, 142, 18907–18923 CrossRef CAS PubMed.
- M. C. Gerthoffer, S. Wu, B. Chen, T. Wang, S. Huss, S. M. Oburn, V. H. Crespi, J. V. Badding and E. Elacqua, Chem. Sci., 2020, 11, 11419–11424 RSC.
- M. C. Gerthoffer, B. Xu, S. Wu, J. Cox, S. Huss, S. M. Oburn, S. A. Lopez, V. H. Crespi, J. V. Badding and E. Elacqua, Polym. Chem., 2022, 13, 1359–1368 RSC.
- H.-T. Huang, L. Zhu, M. D. Ward, T. Wang, B. Chen, B. L. Chaloux, Q. Wang, A. Biswas, J. L. Gray, B. Kuei, G. D. Cody, A. Epshteyn, V. H. Crespi, J. V. Badding and T. A. Strobel, J. Am. Chem. Soc., 2020, 142, 17944–17955 CrossRef CAS.
- M. M. Nobrega, E. Teixeira-Neto, A. B. Cairns, M. L. A. Temperini and R. Bini, Chem. Sci., 2018, 9, 254–260 RSC.
- S. Fanetti, M. M. Nobrega, E. Teixeira-Neto, M. L. A. Temperini and R. Bini, J. Phys. Chem. C, 2018, 122, 29158–29164 CrossRef CAS.
- S. G. Dunning, L. Zhu, B. Chen, S. Chariton, V. B. Prakapenka, M. Somayazulu and T. A. Strobel, J. Am. Chem. Soc., 2022, 144, 2073–2078 CrossRef CAS.
- S. Romi, S. Fanetti, F. G. Alabarse, R. Bini and M. Santoro, Chem. Mater., 2022, 34, 2422–2428 CrossRef CAS.
- S. Fanetti, S. Romi, W. Crichton, A. Rosenthal, D. Scelta, F. Alabarse, R. Bini and M. Santoro, Diamond Relat. Mater., 2023, 136, 109912 CrossRef CAS.
- B. Chen, R. Hoffmann, N. W. Ashcroft, J. Badding, E. Xu and V. Crespi, J. Am. Chem. Soc., 2015, 137, 14373–14386 CrossRef CAS PubMed.
- A. L. Ruoff, J. Appl. Phys., 2008, 46, 1389–1392 CrossRef.
- R. T. Downs and A. Singh, J. Phys. Chem. Solids, 2006, 67, 1995–2000 CrossRef CAS.
- Z. A. Dreger, E. Balasubramaniam, Y. M. Gupta and A. G. Joly, J. Phys. Chem. A, 2009, 113, 1489–1496 CrossRef CAS PubMed.
- P. Ray, J. L. Gray, J. V. Badding and A. D. Lueking, J. Phys. Chem. B, 2016, 120, 11035–11042 CrossRef CAS PubMed.
- A. Politov, A. Chupakhin, V. Tapilin, N. Bulgakov and A. Druganov, J. Struct. Chem., 2010, 51, 1064–1069 CrossRef CAS.
- V. Tapilin, N. Bulgakov, A. Chupakhin, A. Politov and A. Druganov, J. Struct. Chem., 2010, 51, 635–641 CrossRef CAS.
- S. Romi, S. Fanetti, F. Alabarse, A. M. Mio, J. Haines and R. Bini, Nanoscale, 2022, 14, 4614–4625 RSC.
- M. Agati, S. Fanetti and R. Bini, J. Chem. Phys., 2023, 158, 034505 CrossRef CAS PubMed.
- S. Klotz, J.-C. Chervin, P. Munsch and G. L. Marchand, J. Phys. D: Appl. Phys., 2009, 42, 075413 CrossRef.
- P. Vinet, J. R. Smith, J. Ferrante and J. H. Rose, Phys. Rev. B, 1945, 35, 1945–1953 CrossRef PubMed.
- R. Bini and V. Schettino, Materials Under Extreme Conditions, Imperial College Press, London, 2014 Search PubMed.
- J. J. De Lange, J. M. Robertson, I. Woodward and W. H. Bragg, Proc. R. Soc. London, Ser. A, 1939, 171, 398–410 CAS.
- C. J. Brown, Acta Crystallogr., 1966, 21, 146–152 CrossRef CAS.
- J. Harada and K. Ogawa, J. Am. Chem. Soc., 2001, 123, 10884–10888 CrossRef CAS PubMed.
- J. Harada and K. Ogawa, J. Am. Chem. Soc., 2004, 126, 3539–3544 CrossRef CAS PubMed.
- A. Li, C. Bi, S. Xu, H. Cui and W. Xu, J. Mol. Struct., 2020, 1206, 127745 CrossRef CAS.
- N. Casati, A. Genoni, B. Meyer, A. Krawczuk and P. Macchi, Acta Crystallogr., Sect. B:Struct. Sci., Cryst. Eng. Mater., 2017, 73, 584–597 CrossRef CAS PubMed.
- J. R. Scheffer, Acc. Chem. Res., 1980, 13, 283–290 CrossRef CAS.
- R. Engelke, P. J. Hay, D. A. Kleier and W. R. Wadt, J. Chem. Phys., 1983, 79, 4367–4375 CrossRef CAS.
- A. L. Spek, Acta Crystallogr., Sect. D: Biol. Crystallogr., 2009, 65, 148–155 CrossRef CAS PubMed.
- Y. Ishigaki, T. Shimajiri, T. Takeda, R. Katoono and T. Suzuki, Chem, 2018, 4, 795–806 CAS.
- D. R. Armstrong, J. Clarkson and W. E. Smith, J. Phys. Chem., 1995, 99, 17825–17831 CrossRef CAS.
- M. Avrami, J. Chem. Phys., 1939, 7, 1103–1112 CrossRef CAS.
- M. Avrami, J. Chem. Phys., 1940, 8, 212–224 CrossRef CAS.
- M. Avrami, J. Chem. Phys., 1941, 9, 177–184 CrossRef CAS.
- E. Wagner-Wysiecka, N. Łukasik, J. F. Biernat and E. Luboch, J. Inclusion Phenom. Macrocyclic Chem., 2018, 90, 189–257 CrossRef CAS PubMed.
- D. Bléger and S. Hecht, Angew. Chem., Int. Ed., 2015, 54, 11338–11349 CrossRef.
- S. Crespi, N. A. Simeth and B. König, Nat. Rev. Chem, 2019, 3, 133–146 CrossRef CAS.
- M. Dong, A. Babalhavaeji, S. Samanta, A. A. Beharry and G. A. Woolley, Acc. Chem. Res., 2015, 48, 2662–2670 CrossRef CAS PubMed.
- M. Döbbelin, A. Ciesielski, S. Haar, S. Osella, M. Bruna, A. Minoia, L. Grisanti, T. Mosciatti, F. Richard, E. A. Prasetyanto, L. De Cola, V. Palermo, R. Mazzaro, V. Morandi, R. Lazzaroni, A. C. Ferrari, D. Beljonne and P. Samorì, Nat. Commun., 2016, 7, 11090 CrossRef PubMed.
- H. M. D. Bandara and S. C. Burdette, Chem. Soc. Rev., 2012, 41, 1809–1825 RSC.
- M. Agati, S. Romi, S. Fanetti and R. Bini, J. Chem. Phys., 2023, 159, 244507 CrossRef CAS PubMed.
- Rigaku Oxford Diffraction, CRYSALIS PRO software system, versions 1.171.41.93a, 1.171.41.123a, 1.171.42.30a, and 1.171.42.58a, Rigaku Oxford Diffraction: Oxford, UK, 2022 Search PubMed.
- G. M. Sheldrick, Acta Crystallogr., Sect. A:Found. Adv., 2015, 71, 3–8 CrossRef PubMed.
- G. M. Sheldrick, Acta Crystallogr., Sect. C:Struct. Chem., 2015, 71, 3–8 Search PubMed.
- C. B. Hübschle, G. M. Sheldrick and B. Dittrich, J. Appl. Crystallogr., 2011, 44, 1281–1284 CrossRef PubMed.
- H. Putz and K. Brandenburg, Diamond (version 4.6.7), Crystal and Molecular Structure Visualization, Crystal Impact, GbR, Bonn (Germany), 2022 Search PubMed.
- O. V. Dolomanov, L. J. Bourhis, R. J. Gildea, J. A. K. Howard and H. Puschmann, J. Appl. Crystallogr., 2009, 42, 339–341 CrossRef CAS.
- K. Momma and F. Izumi, J. Appl. Crystallogr., 2008, 41, 653–658 CrossRef CAS.
- R. Letoullec, J. P. Pinceaux and P. Loubeyre, High Pressure Res., 1988, 1, 77–90 CrossRef.
- R. Boehler and K. D. Hantsetters, High Pressure Res., 2004, 24, 391–396 CrossRef.
- H. K. Mao, J. Xu and P. M. Bell, J. Geophys. Res.:Atmos., 1986, 91, 4673–4676 CrossRef CAS.
- A. Rothkirch, G. D. Gatta, M. Meyer, S. Merkel, M. Merlini and H.-P. Liermann, J. Synchrotron Radiat., 2013, 20, 711–720 CrossRef CAS PubMed.
- S. V. Rashchenko, J. Appl. Crystallogr., 2025, 58, 290–295 CrossRef CAS.
- R. Bini, R. Ballerini, G. Pratesi and H. J. Jodl, Rev. Sci. Instrum., 1997, 68, 3154–3160 CrossRef CAS.
- S. J. Clark, M. D. Segall, C. J. Pickard, P. J. Hasnip, M. I. Probert, K. Refson and M. C. Payne, Z. Kristallogr. - Cryst. Mater., 2005, 220, 567–570 CrossRef CAS.
- K. Lejaeghere, G. Bihlmayer, T. Björkman, P. Blaha, S. Blügel, V. Blum, D. Caliste, I. E. Castelli, S. J. Clark, A. D. Corso, S. de Gironcoli, T. Deutsch, J. K. Dewhurst, I. D. Marco, C. Draxl, M. Dułak, O. Eriksson, J. A. Flores-Livas, K. F. Garrity, L. Genovese, P. Giannozzi, M. Giantomassi, S. Goedecker, X. Gonze, O. Grånäs, E. K. U. Gross, A. Gulans, F. Gygi, D. R. Hamann, P. J. Hasnip, N. A. W. Holzwarth, D. Iuşan, D. B. Jochym, F. Jollet, D. Jones, G. Kresse, K. Koepernik, E. Küçükbenli, Y. O. Kvashnin, I. L. M. Locht, S. Lubeck, M. Marsman, N. Marzari, U. Nitzsche, L. Nordström, T. Ozaki, L. Paulatto, C. J. Pickard, W. Poelmans, M. I. J. Probert, K. Refson, M. Richter, G.-M. Rignanese, S. Saha, M. Scheffler, M. Schlipf, K. Schwarz, S. Sharma, F. Tavazza, P. Thunström, A. Tkatchenko, M. Torrent, D. Vanderbilt, M. J. van Setten, V. V. Speybroeck, J. M. Wills, J. R. Yates, G.-X. Zhang and S. Cottenier, Science, 2016, 351, aad3000 CrossRef PubMed.
- H. J. Monkhorst and J. D. Pack, Phys. Rev. B, 1976, 13, 5188–5192 CrossRef.
- J. P. Perdew, K. Burke and M. Ernzerhof, Phys. Rev. Lett., 1996, 77, 3865–3868 CrossRef CAS PubMed.
Footnote |
| † Electronic supplementary information (ESI) available: For ESI, calculations output files (CASTEP) and relative structures (CIF). CCDC 2336562–2336622. For ESI and crystallographic data in CIF or other electronic format see DOI: https://doi.org/10.1039/d5sc00432b |
| This journal is © The Royal Society of Chemistry 2025 |