
Student success and experience in a flipped, senior physical chemistry course spanning before and after the COVID-19 pandemic†
Trisha M.
Gomez
,
Charmaine
Luciano
,
Tam
Nguyen
,
Sachel M.
Villafañe
 * and
Michael N.
Groves
*
* and
Michael N.
Groves
*
Department of Chemistry and Biochemistry, California State University Fullerton, Fullerton, CA 92831, USA. E-mail: svillafane@fullerton.edu; mgroves@fullerton.edu
First published on 24th August 2024
Abstract
A flipped classroom is typically one where some of the instruction occurs asynchronously prior to the scheduled synchronous meeting between students and the instructor. Since 2000, they have gained substantial popularity especially in STEM fields where they have been shown to have increased exam scores and reduce the number of students who fail. In the university setting, many of these studies have been performed in lower division courses. Very few studies have been conducted in senior physical chemistry courses resulting in very little data being collected on this instructional technique at this level. The purpose of this study is to assess student outcomes when flipped classroom techniques are implemented in a senior physical chemistry course. In our flipped classroom, students were expected to watch lecture videos and complete preparation exercises created by the authors prior to coming to class. Then in class, a just in time teaching model was employed prior to students working in groups to complete activities created by the authors. Seven quizzes were performed individually and in groups while three midterms and a cumulative final exam were performed individually. Grade, student opinion questionnaires and survey data collected over seven semesters from Fall 2017 to Spring 2022 will be presented. Our findings indicate that there was only one semester out of seven where the average GPA of the students was significantly higher than the control class which was taught in a traditional lecture style. According to student surveys, the students focused on the importance of the preparation questions and dismissed the importance of completing activity/homework problems given that preparation activities were assigned credit while homework was not. Given that the in-class activities/homework questions resembled the material in assessments like quizzes, midterms and final exams, while preparation questions were scaffolded formative problems meant to introduce students to the concepts to be studied during the synchronous lecture, an important link between course concepts and material on summative assessments was not made. Future changes to address this issue will be discussed as well as how COVID-19 affected students during the pandemic as well as flipped classroom instruction.
1 Introduction
A flipped classroom is typically one where some of the instruction occurs asynchronously prior to the scheduled synchronous meeting between students and the instructor. During the synchronous meeting, many activities can occur including students solving problems and engaging in active learning activities that expand or reinforce the material assigned during the asynchronous part (Strayer, 2012; Seery, 2015). Since 2000, when some of the first instances of flipped learning were reported (Baker, 2000; Lage et al., 2000) many instructors have adopted this instructional technique especially in STEM fields (Casselman et al., 2020). Several studies have measured improvements to exam scores (Tune et al., 2013; Bernard et al., 2014; Weaver and Sturtevant, 2015) and a reduction in the number of students who fail flipped courses (Flynn, 2015) relative to traditionally delivered courses. Proponents of the model claim that the flipped model helps students become more engaged with course material, persist in their learning, and perform better compared to a standard format course (Gross et al., 2015). Others have theorized that the flexibility to meaningfully interact with the material outside of synchronous meetings will reduce the cognitive load on students thereby increasing their ability to incorporate topics into their long-term memory (Casselman et al., 2020). However, detractors argue that the flipped classroom method itself does not promote student success on its own, but instead simply makes room for active learning in synchronous meetings (Jensen et al., 2015) which has been demonstrated to increase student achievement and reduce failure rates (Freeman et al., 2014).A majority of the effort and research in flipped classroom instruction in Chemistry has focused on first and second-year courses like general chemistry (Smith, 2013; Weaver and Sturtevant, 2015; Ryan and Reid, 2016; Rau et al., 2017; Bokosmaty et al., 2019; Bancroft et al., 2020; Naibert et al., 2020; Petillion and McNeil, 2020; Ranga, 2020; Brady and Voronova, 2023; Vyas and Reid, 2023) and organic chemistry (Christiansen, 2014; Flynn, 2015; Crimmins and Midkiff, 2017; Casselman et al., 2020; Dehghan et al., 2022; Sigmon and Bodek, 2022; Torres et al., 2022). Few published flipped classroom examples have focused on senior courses like physical chemistry (Gross et al., 2015) where the expectation is that students will combine concepts and have the opportunity to complete assessments that require higher cognitive processes on Bloom's taxonomy instead of recall of fundamental facts and apply basic algorithmic procedures prevalent in lower level courses (Stowe et al., 2021). As a result, there is little data to facilitate discussions on the efficacy of flipped classroom instruction in senior chemistry courses.
Furthermore, given that the COVID pandemic forced all courses online, several reports have been published about the challenges and lessons learned during this time (Crucho et al., 2020; Dicks et al., 2020; Sunasee, 2020; Contreras et al., 2022; Mojica and Upmacis, 2022). A decrease in student engagement in general chemistry, especially for students from underrepresented backgrounds (Wu and Teets, 2021) was observed, as well as a decrease in engagement with the content material across the semester (LeSuer and Reed, 2022). It has also been reported that even with a decrease in student engagement, there was no obvious decrease in student performance and no evidence of the prevalence of cheating during online exams in a general chemistry course (Sorenson and Hanson, 2023). An interesting and concerning finding was reported for a general chemistry sequence, where it was found that students withdrew from classes at a higher rate than when classes were in person, forcing faculty to adapt to newer technology in their courses (Villanueva et al., 2020). Other courses made changes to their instructional pedagogies, incorporating more collaborative active learning in their classroom (Gemmel et al., 2020; George-Williams et al., 2020; Van Heuvelen et al., 2020; Villanueva et al., 2020; dos Santos Belmonte et al., 2022). Most reports involved general chemistry (Van Heuvelen et al., 2020; Villanueva et al., 2020; Wu and Teets, 2021; LeSuer and Reed, 2022; Mojica and Upmacis, 2022) and organic chemistry lectures and labs (Crucho et al., 2020; Gemmel et al., 2020; Sunasee, 2020), but fewer for upper-division courses like analytical chemistry (Dukes III, 2020; Rodríguez-Rodríguez et al., 2020; Valle-Suárez et al., 2020), and biochemistry (Contreras et al., 2022; Nag, 2023). In particular there are very few reports that examine the effect of flipped classroom instruction comparing its efficacy prior to, during, and after the COVID-19 pandemic in physical chemistry classrooms (Bopegedera, 2020; dos Santos Belmonte et al., 2022).
1.1 Purpose and significance of the study
Based on this context, the authors pose two research questions:1. How effective is a flipped classroom model in a senior undergraduate physical chemistry course?
2. For a senior undergraduate physical chemistry course, what effect did the COVID-19 pandemic have on student success?
The purpose of this study is two-fold: first, it will report on students' performance in a senior undergraduate physical chemistry course that focuses on thermodynamics and kinetics and that is taught using a flipped classroom model. It will also report on students' perceptions of the flipped classroom environment across the semester. Second, this study will provide an analysis of the effects of the COVID-19 pandemic on student success given the change in modalities experienced in in education. This class is a strong place to examine the effects of the pandemic since the course itself remained largely unchanged when instruction transitioned online and then back again to in person. The dataset presented here is composed of data from before, during and after COVID-19 generally forced changes in how instructors taught their courses.
2 Methods
2.1 Course description
The data collected for this study comes from one of two required physical chemistry courses for BS Biochemistry and BA Chemistry majors at the authors' institution. This course focuses on thermodynamics and kinetics, while the other course in the physical chemistry sequence, where no data is reported from, focuses on quantum mechanics. In the reported course's sixteen-week semester, there are three midterm-style exams that assess the thermodynamics and kinetic concepts instructed over flipped lectures and quizzes. The first midterm covers thermodynamic quantities such as work, heat, internal energy, the first law of thermodynamics, and statistical mechanics. Based on these topics, the first midterm typically has some minor questions as well as two major questions: a heat engine question and a statistical mechanics question. The second midterm covers topics that include entropy, Gibbs free energy, mixtures, colligative properties, and equilibrium. There are no major questions that are typical for this exam. Instead, it just has more smaller value questions. The third midterm covers topics that include solubility, acid/base chemistry, and electrochemistry taking into account the role of ions, as well as kinetics topics like rate laws, integrated rate laws, reaction half-life, and temperature dependence of rate constants. The third midterm typically has some minor questions and two major questions: one question on equilibrium while including the role of ions in the solution and a kinetics question where the students need to determine the integrated rate law of a process and calculate the half-life given initial conditions. The final topics of the course, consecutive reactions and Michaelis–Menten enzyme kinetics including the three basic types of enzyme inhibition, were assessed on a quiz prior to the final exam.All students must have completed the first year calculus sequence (differential and integral calculus) as a prerequisite for the course. It is common, however, that they completed this calculus sequence a couple of years prior to taking this physical chemistry course. To accommodate this reality, the preparation activity for the first lecture includes watching Khan Academy calculus videos focusing on the power rule as this is the primary calculus concept that is used in the course. The in-class activity also focuses on reviewing the power rule. As the students work through the activity, the co-author instructor emphasizes that the students will commonly use the power rule in the course and that they should also be familiar with the  as this is a very common integral that they will use/see within the course. The co-author also reiterates throughout the semester that the students will be tested on physical chemistry concepts and that while they need to know how to do the math, they will not be tested on doing the math for math's sake. Part of this philosophy comes from how short exams are: midterms are 75 minutes and the final is only 110 minutes long. If a problem is posed where the computational part involves a multi-step calculus-based solution, then there is a substantial part of the exam that is focused on something, performing math, that is not a physical chemistry course concept and this takes away from testing other physical chemistry course concepts. While students struggle with the inclusion of calculus concepts in the course, it is not a typical factor which prevents students from being successful in the course.
This course employed a flipped classroom model where students would interact with preparation materials and complete pre-class questions on the learning management system prior to coming to class. The preparation materials are almost exclusively video lectures that the authors produced and posted to YouTube. They are freely available for anyone to use. The lecture videos were meant to mimic what they would have seen in a traditional lecture setting and are meant to convey the critical concepts for the day's lesson as well as present how to solve problems using these concepts. The total duration of the lecture videos for each of the 20 lecture sessions ranged from 20 minutes to 70 minutes. Each set of lecture videos are then broken down into smaller videos of 3 to 15 minutes each to convey a concept or worked example through static slides with dynamic animations to emphasize certain features of the slides as well as worked problems solved in real time written out using a stylus all with a voice over. The set of pre-class questions (preparatory questions hereafter) based on the topics in the assigned lecture videos, needed to be completed by the start of class. Students were provided an unlimited number of attempts since the goal of these preparatory questions was for students to work on the questions and get familiar with the topics rather than assessing them on their understanding of the topics. These questions were scaffoled in such a way that larger concepts are broken down into steps so that students could attempt each step one at a time and build confidence towards solving the larger problem. An example of a preparation question activity is included in the ESI,† to provide insight to how these questions were scaffolded. The students were expected to watch the videos and complete the preparation questions.
Included in the preparation question was a prompt for students to reflect on what they did not understand from the preparation materials. From these responses, the author would build a just-in-time teaching (JITT) lecture that would be presented at the start of the synchronous session. Once completed the students work in teams to discuss and complete provided active learning activities based on the day's topic. The activities typically consisted of a mixture of conceptual questions and questions that students need to compute a quantitative solution. Whenever possible, these questions are broken down into pieces such that they can solve each step one at a time to build towards solving larger problems. As students work on these activities together, the co-author would move between groups to answer questions and sometimes bring the whole class together to discuss the learning objectives for the day. No graded homework was assigned, however, additional ungraded practice problems were provided to students with the daily activities. An example of the in-class activity is included in the ESI.†
Throughout the semester there were a total of 10 in-class assessments: 7 quizzes and 3 midterms. Each midterm had two quizzes leading up to it and the 7th and final quiz occurred in the last week of classes to capture the material covered after the third midterm. For the lower stakes quiz assessments, the course employed group quizzes where students completed a quiz individually, and then come together in a group and complete the same quiz. These quizzes are weighted 60![[thin space (1/6-em)]](https://www.rsc.org/images/entities/char_2009.gif) :40 between the individual and group scores. Students completed the midterm and final exams individually, however, they contribute questions to these exams by completing a participation activity through the online PeerWise tool (Denny et al., 2008; Bottomley and Denny, 2011; Ryan, 2013; Galloway and Burns, 2015). For a mandatory participation credit, students create a problem that is suitable for the upcoming exam and then participate in a peer-review of another student's question. At least one problem from the PeerWise database will appear on the exam, however it is typical that at least 25% of the total points in the exam are assigned to questions that are pulled from the student generated PeerWise database. The questions that appear on exams are selected by the instructor and are equivalent to questions they would have assigned.
:40 between the individual and group scores. Students completed the midterm and final exams individually, however, they contribute questions to these exams by completing a participation activity through the online PeerWise tool (Denny et al., 2008; Bottomley and Denny, 2011; Ryan, 2013; Galloway and Burns, 2015). For a mandatory participation credit, students create a problem that is suitable for the upcoming exam and then participate in a peer-review of another student's question. At least one problem from the PeerWise database will appear on the exam, however it is typical that at least 25% of the total points in the exam are assigned to questions that are pulled from the student generated PeerWise database. The questions that appear on exams are selected by the instructor and are equivalent to questions they would have assigned.
2.2 Demographics of the course
The demographics of this class are very different from other reports of flipped classrooms in the literature. The authors' home institution is a primarily undergraduate, Hispanic-serving institution (HSI). In the Fall 2022 semester, 52.7% of students are underrepresented (predominantly Hispanic – 50.2% of the entire CSUF student population identifies as Hispanic) and 16.4% are white. 32.2% of students are the first in their family to attend an institution of higher education and 66.1% of students are receiving financial aid. Finally, 58.4% are female. Table 1 summarizes the breakdown per semester of these demographic statistics for the course studied in this work. Based on the data in the table, this course tends to have fewer underrepresented (UR) students than what is present in the entire CSUF student population. The number of first-generation students tends to match CSUF-wide data, and there tend to be more female students than male students which is also consistent with CSUF-wide statistics.| Pell | UR | First gen | Female/male | |
|---|---|---|---|---|
| Fall 2016 | 33 (61%) | 13 (24%) | 17 (31%) | 27/27 |
| Fall 2017 | 39 (54%) | 25 (35%) | 22 (31%) | 38/34 |
| Fall 2018 | 17 (35%) | 23 (47%) | 11 (22%) | 18/31 |
| Spring 2019 | 22 (61%) | 13 (36%) | 8 (22%) | 25/11 |
| Fall 2019 | 22 (47%) | 16 (34%) | 10 (21%) | 26/21 |
| Fall 2020 | 25 (49%) | 18 (35%) | 20 (39%) | 34/17 |
| Fall 2021 | 26 (54%) | 16 (33%) | 13 (27%) | 33/15 |
| Spring 2022 | 21 (49%) | 19 (44%) | 16 (37%) | 23/20 |
The Physical Chemistry course under study is taught in both the spring and fall semesters. The semesters that are reported in this paper are the semesters where the course was taught by the co-author in a flipped modality as described in the paper. The other semesters not reported here were taught by other faculty members in the department and no data was collected from them. Given that the course topics between the two courses are distinct and can be taught in isolation, students are able to take the two Physical Chemistry courses in either order. For a variety of reasons, students tend to not follow pre-set, 4 year course schedule plans meaning that the majority of students attempting the course in both the spring and fall semesters are doing so for the first and only time. Therefore, a student taking this course in the spring semester does not mean they are retaking the course any more than a student taking the course in the fall semester.
The class was delivered in person for all the reported semesters except for the Fall 2020 semester due to social distancing measures as a result of the COVID-19 pandemic. During the Fall 2020 semester, the course was still delivered much in the same way that is described in the previous paragraphs. The notable exceptions were that synchronous lectures were conducted over Zoom and group work was facilitated using the breakout room option. Assessments were also conducted virtually and synchronously through the learning management system and proctored using Zoom. All assessments were open book with the only stipulation that students could not seek help from another human in real-time during the synchronous assessment session. All questions on a student's assessment came from an author-generated database grouped by topic. This way every student's exam was unique, but still contained all the same topics.
2.3 Surveys description
All students in the course were offered to voluntarily and anonymously complete a survey at four points during the semester: on the first day of classes, and in the class after each of the three midterms. Surveys were constructed in Qualtrics based on a survey previously used to in a flipped classroom setting (Smith, 2013) and examples of surveys used for this work can be found in the ESI.† The number of students who responded to each survey is included in Table 2. Class time was set aside for students to complete the survey, however, the link was left active after class so that students could continue providing responses at home, and for students who were absent from class to still provide feedback. According to the data presented in Table 2, the number of students tended to drop as the semester progressed.| Start | Midterm 1 | Midterm 2 | Midterm 3 | |
|---|---|---|---|---|
| Fall 2017 | — | — | 59 | 53 |
| Fall 2018 | 37 | 42 | 36 | 35 |
| Spring 2019 | 32 | 26 | 23 | 25 |
| Fall 2019 | 43 | 43 | 38 | 34 |
| Fall 2020 | 40 | 37 | 36 | 27 |
| Fall 2021 | 33 | 31 | 30 | 24 |
| Spring 2022 | 31 | 31 | 22 | 21 |
Some survey questions were consistent for all surveys between 2017 to 2022 while others were added to reflect changes due to the pandemic. For example, the questions related to what students enjoy the most about the course, not enjoy most about the course, and what they find most useful are consistent throughout all administrations of the survey. Questions about academic dishonesty and how students are coping with the transition to online-only instruction during the pandemic as well as the transition back to in-person classes were added to the survey during the pandemic to try and capture COVID-19 related effects in real-time.
Students' responses to the surveys were analyzed by the authors. Responses were coded according to the authors' discussed categories that were determined prior to coding them to reflect major categories of responses that the authors observed over the seven semesters that data was collected. A deliberate decision to code into different categories pieces of flipped classroom instruction, including lecture videos, preparation questions, JITT etc., was to gain a more precise description of the aspects of the course that the students were commenting on.
2.4 Ethical considerations
Students were asked to voluntarily and anonymously participate in the research and consent was obtained following Cal State Fullerton (CSUF) Institutional Review Board (IRB) guidelines who approved this project's methodologies. The instructor for the course, who is a co-author on this manuscript, administered the surveys. Prior to participants providing consent they were given information on the study, that the study was approved by the CSUF IRB, that they could withdraw their consent at any time, and that they can contact the CSUF IRB with any concerns. Additionally, survey participants were informed that they could contact another co-author, who was never a course instructor, with any questions or concerns. Participants were instructed that they were providing their consent by continuing past the informational page and begin to complete the survey.3 Findings
3.1 Grade distributions and student opinion questionnaires
Fig. 1 illustrates the average grade point average (GPA) results from all students in the course, including students who were unsuccessful in achieving a passing grade, as well as the average response for all student opinion questionnaires (SOQ) as a function of semester. The Fall 2016 semester is included as a comparison to show the GPA and SOQ values when the same instructor taught this course in a more traditional way where the content was delivered using live lectures and without any of the flipped classroom aspects described in the previous section. Independent sample T-tests were performed using SPSS for GPA comparisons between the traditional taught semester (Fall 2016) and the flipped semesters. Bonferroni correction was done for the alpha level; since there were seven comparisons, the alpha level (p-value) was set at 0.007. The only statistically significant comparison was between the Fall 2016 GPA and Fall 2019 (t(97) = −3.035, p = 0.003), with a mean GPA difference of 0.548. This difference has a large effect size (d = 0.89). Additionally, for the period between Fall 2016 and Fall 2019, the average SOQ responses seem to cluster around 3.7 out of 4 where the traditionally taught class in Fall 2016 follows this trend. | ||
| Fig. 1 Part a illustrates average GPA, including students who were unsuccessful in the course, and responses to all quantitative student opinion questions. The scale for both data sets is 0–4. The department standard range for GPAs in this course is 2.0–3.0 while the department standard range for student opinion question responses for this course is 2.7–3.5. The Fall 2016 semester was taught traditionally using live lectures during scheduled course times. Only the Fall 2020 semester was 100% online due to the COVID-19 pandemic. The asterisk above the GPA result in Fall 2019 indicates that it is the only semester with a significantly significant difference relative to the traditionally taught Fall 2016 semester. Part b illustrates the difference between the difference in SOQ responses for each of the eight questions for the Fall 2017 to Fall 2019 responses from the Fall 2020 to Spring 2022 (COVID courses minus pre-COVID responses) for both the CHEM 361A course by the author and all data from lecture-based courses for the department. | ||
For Fall 2020 and beyond, the increasing trend in GPA data shifts. The online Fall 2020 semester and the two in-person semesters afterward (Fall 2021 and Spring 2022) starts to trend downwards, however, according to the T-test, they do not show a statistically significant difference compared to the Fall 2016 semester. It is interesting to note that the average value of the GPA for the online Fall 2020 semester is tied for the third largest of the data set, however, the GPA values for the Fall 2021 and Spring 2022 semesters where students returned to in-person instruction are tied for the lowest values in the data set.
Table 3 shows the percent of students to were unsuccessful in the course for each of the semesters under study for this paper. The average DFW rate for the course during the semesters reported here was 10 ± 2%. Based on the data in Table 3, the semesters with higher DFW rates also correspond to semesters with elevated numbers of students with F grades. This is notable because students did not typically withdraw from the course. They instead just stop participating, anecdotally due to some external factor that probably forces them to redirect all their attention from their studies to something else, and typically take an F standing based on the work they had produced to that point. It is rare for a student who persists all semester to get an F in the course. Students who persist the whole semester tend to get a C−, D+, or a D standing in the course. If this holds, then the elevated DFW rates in Spring 2019 (13.9%) could be attributed to the higher number of students experiencing hardships that force them to exit their studies during the semester. This explanation does not completely explain the very high rate in Fall 2021 (18.8%) which also shows the highest rate of failing grades that are larger than F (C < grade < F).
| Semester | DFW rate (%) | # of F students |
|---|---|---|
| FA16 | 7.4 | 2 |
| FA17 | 9.7 | 2 |
| FA18 | 8.2 | 1 |
| SP19 | 13.9 | 4 |
| FA19 | 4.4 | 1 |
| FA20 | 10.6 | 1 |
| FA21 | 18.8 | 3 |
| SP22 | 9.8 | 3 |
| Average | 10 ± 2 |
Being able to compare different semesters means that the exam materials should be of equivalent difficulty. During the development of the course certain questions appear more often than others as they test major learning objectives for the instructor. This led to exams, including the final exam to include similar types of questions between semesters. This was especially useful for the Fall 2020 online semester when exam banks were created such that a set of questions were created where the procedure to answer these questions would be equivalent. Other variations of these questions were created using different numbers within the questions to ensure that the pool was large enough that it would be unlikely that if students were colluding during the exam they would have the exact same question. The exam database proved useful after the return of in-person classes since they have been used to create the first draft of future exams in iterations of the course taught by the co-author. Furthermore, all final exams, including the Fall 2020 exam, were partially created by the students themselves through the PeerWise activity. This gave all students, including the Fall 2020 students equal ability to prepare for the questions that they would see on the final exam.
Final exam statistics are presented in Table S1 (ESI†) and all semesters except for the Fall 2017 semester seem to have an equivalent set of statistics. The exam statistics for the Fall 2017 final exam are consistently lower than the other semesters. Final exam scores as a metric, it appears that the exam database that was used to create a unique exam for each student in the Fall 2020 semester seems to have produced an equivalent set of exams as what students experienced in other semesters. Furthermore, the assigned percentage of points for questions that commonly appeared in final exams is presented in Table S2 (ESI†). The scores for the Fall 2017 final exam tends to appear at the bottom of the rankings, however, some scores from the Spring 2022 semester are the lowest for the heat cycle and ions and equilibrium question. The kinetics question appears to have the largest variation of scores which might be related to how this question appears only on a quiz and does not appear on a midterm as the material is taught after the third midterm. Finally, the online Fall 2020 exam does not appear to stand out among the other years. The pool of questions that were placed in the final exam in Fall 2020 appears to reflect the variation that was used in the other years when the exam was in person.
Turning to the SOQ data for the Fall 2020 semester and beyond, there was a drop in SOQ results relative to the other five semesters. The Fall 2020, Fall 2021 and Spring 2022 semesters are the three lowest SOQ values in the eight semester data set. This is illustrated in Fig. 1a. It is noteworthy that the difference between the online Fall 2020 semester and the in-person Fall 2021 semester SOQ results is small, and the in-person Spring 2022 semester SOQ result increases relative to the Fall 2021 result. As illustrated in Fig. 1b, this drop does not seem to be linked to any one question. Across all eight questions, the decline in SOQ values appears to be in the same range. This decline does not seem to be matched by the rest of the department. Looking at the SOQ responses for all instructors in lecture-based courses in the department it appears that SOQ results have increased across all questions since the Fall 2020 online semester (looking at Fall 2020, Fall 2021, and Spring 2022), relative to the pre-pandemic semesters (Fall 2017, Fall 2018, Spring 2019, and Fall 2019).
3.2 Equity gaps
Final grade scores, expressed as a GPA, broken down by underrepresented minority (URM) status, sex, Pell awarded, and parental education level are presented in Fig. 2. Fig. 2a illustrates how the GPA of students who have identified their race/ethnicity as African American, American Indian or Native American, Hispanic, and Pacific Islander (underrepresented minority students – URM) differ from students identified as all other racial/ethnic groups. According to the data, with the exception of the Fall 2018 class, the highest average GPA for URM students was 2.6. There does not appear to be a large difference between the traditionally taught Fall 2016 class and any of the flipped semesters, including the COVID-affected semesters, except for Fall 2018. For the non-URM students, they seem to have a large increase in GPA results in Spring 2019 and Fall 2019 compared to the traditionally taught Fall 2016 class and flipped Fall 2017 class. However, once COVID starts, the GPA values of the non-URM students drop again and match more closely the first two semesters. | ||
| Fig. 2 All four plots illustrate GPA as a function of semester when students are separated by (a) URM status, (b) sex, (c) Pell eligibility, and (d) education level of their parents. The traditionally taught semester (Fall 2016) is highlighted in green and the semester that was taught 100% online due to COVID-19 (Fall 2020) is highlighted in magenta. | ||
Fig. 2b illustrates the equity gap based on sex. In general, before the pandemic, female students tended to outperform male students where they had final GPA scores that were higher than male students in the Fall 2017 and Fall 2018 semesters. It also appears that the female student GPA scores are gradually increasing. Indeed, during the Fall 2018 semester there is a large increase in the GPA result compared to the traditionally taught Fall 2016 semester. More recently, during the post-COVID semesters, the male students tended to outperformed the female students. For example, during the Fall 2021 semester, there is a large 0.6 point gap between the male GPA scores and the female GPA scores. In this semester, the male students perform at their highest recorded level while the female students are performing at the lowest level of this data set.
Fig. 2c shows the equity gap based on Pell grant eligibility. Prior to the COVID-affected semesters there does not appear to be any large differences in the Pell eligible versus not Pell eligible groups. There also appears to be an upward trend in GPAs for Pell-eligible students up to and including the online-only COVID-19 semester. However, after that semester, when the university returned to in-person instruction in Fall 2021, the GPAs of Pell-eligible students decreased. Indeed, the GPA of Pell-eligible students in Spring 2022 is 2.1 ± 0.3 and this result is much lower than the high point of 3.0 for the Spring 2019, Fall 2019, and Fall 2020 semesters as well as the 2.7 ± 0.2 result in the Fall 2017 first flipped classroom semester.
Finally, Fig. 2d illustrates GPA results based on parent education level as a function of semester. Students with parents completing college seem to remain at a stable level through the eight semesters. There does not appear to be a major difference between traditional and flipped classroom instruction for these students. The only real deviation from this trend is the dip during the online-only Fall 2020 semester where students with both parents completing post-secondary education hit a low of 2.4 ± 0.3. For students with parents only partially completing post-secondary degrees they also seem to remain stable during the transition between traditional and flipped classroom instruction. However, once the COVID-19 pandemic hits, the GPA values for these students decrease dramatically from a high point of 3.2 ± 0.2 in Spring 2019 to a low of 2.0 ± 0.4 in Spring 2022. Finally, for the students whose parents never attended college, so-called first-generation students, there is a large increase in student achievement between the traditionally taught class over the initial flipped classroom semesters. In Fall 2016, the first-generation students' GPA average was 2.4 ± 0.3 and it increased to 3.4 ± 0.3 in Fall 2019. Once COVID hit, the GPA results in this student population drops relative to this high point over the next couple of semesters including the return to in-person instruction hitting a low point of 2.2 ± 0.3 in Spring 2022.
3.3 Most/least enjoy and most useful
We will now examine the results from the student surveys. The first three questions of the surveys were open-ended. The questions asked were aimed to determine which aspects of the flipped classroom students enjoyed the most, enjoyed the least, and found most useful. Each student's response was categorized into one or more classifications. The most common classifications were videos, preparation questions, group work, JITT, and content. The results for these three questions are presented in Fig. 3. Results did not typically change across semesters so results are averaged over the 7 semesters the flipped model was employed. Any large changes between semesters will be discussed later as the meaningful changes in student responses tended to occur during the semester. | ||
| Fig. 3 Coded survey results where student responses at each time data is collected in a semester is averaged across all seven semesters students were surveyed for the “most liked”, “least liked” and “most useful” questions. Part (a) is the coded responses for the most liked question while part (b) is the same data where the y-axis is rescaled to better see the majority of the data. Part (c) is the coded responses for the least liked question while part (d) is the same data where the y-axis is rescaled to better see the majority of the data. Part (e) illustrates the coded data from the most useful survey question. | ||
Fig. 3a and b shows the results from the question “In this course, what aspect do you enjoy the most?”. At the start of the course, denoted as “Pre”, the vast majority of the students were excited about studying content-related topics and using math to solve chemistry problems. As the semester progressed, a major decrease in students indicated that content-related topics were what they were most excited about. Before the semester started, 55 ± 7% of students believed that the aspect they would enjoy the most would be related to the content of the course. At the end of the course, after Midterm 3, only 13 ± 2% of students still believed that topics relating to the material were the aspect they enjoyed the most. The right panel of Fig. 3a shows a resized range of the left panel to make it easier to see the differences between the other responses. There we can observe that group work was consistently a response that students enjoyed the most. Lecture videos and preparation questions were not common responses to this question when the semester started, however, as the semester progressed those two responses increased in popularity until they matched both group work and course content. Finally, JITT was the lowest of the five groups.
The coded student responses to the second question “In this course, what aspect do you enjoy the least?” are illustrated in Fig. 3c and d. At the start of the semester, many student responses focused on their worry that the content or math components would be too challenging. As the semester progressed, however, these sorts of comments dramatically decreased and were overtaken by other aspects of the course like preparation questions. In the pre-course survey, an average across all semesters of 42 ± 8% of students stated that they were not fond of content relating to Physical Chemistry. At Midterm 2, the rate drops to 7 ± 2%, the lowest response rate on average for this idea during the semester. The response rate for Preparation Questions was initially low but then grew over the semester to become the largest response, on average. When averaged across all semesters, we can observe that 5 ± 2% of students' responses to the pre-course survey, predicted that the Preparation Questions were the aspect they would enjoy the least. By Midterm 3, the response rate averaged across all semesters had risen to its highest value of 16 ± 4%. For the other three coded students' responses for this question, when averaged across all semesters, students mentioned the Video Lectures and Group Work the same at every point in the semester and were ranked below Preparation Questions with the exception of the survey administered at the start of the semester. JITT was mentioned the fewest number of times frequently being mentioned zero times as a response to a survey.
The responses to the third open-ended question, “In this course, what do you find most useful?”, are shown in Fig. 3e. When averaged across all semesters, students indicated that they would find the Group Work and Content of the course most useful. However, as the semester progresses, these responses drop significantly and are replaced by responses that indicate students are finding the Preparation Questions, and JITT the most useful. At the beginning of the course, 10 ± 2% agreed that the preparation questions were the most useful aspect of the course. The rate jumps to 20 ± 2% after Midterm 1, then 21 ± 4% after Midterm 2, and finally reaches a maximum of 25 ± 3% after Midterm 3. Additionally, averaged across all semesters, in the start of the course survey students responded that JITT was the most useful 3 ± 1% of the time. This rate then increases to 14 ± 2% after Midterm 1, 17 ± 4% after Midterm 2, and 16 ± 3% after Midterm 3.
Only one major trend across semesters was observed in students' responses to these three open-ended questions. For both the enjoyed most and found useful questions, JITT showed a substantial jump in response rates in the Fall 2021 semester. This is shown in Fig. 4. The averages are based on responses from the post-Midterm 1, post-Midterm 2, and post-Midterm 3 surveys. Pre-course responses were omitted due to very low rates, which probably arose due to students not being familiar with JITT at the start of the course. For the enjoy most question, each semester had an average response rate of ≤7% with the exception of Fall 2021. In Fall 2020, the post-midterm 1 survey had the largest percent of respondents (13%) that were coded as they enjoyed JITT the most, while post-midterm 2 showed the smallest percent of responses (3%). This variation is what leads to the large uncertainty on the average Fall 2020 data. Fall 2021 had an average of 16 ± 1%, the highest reported average for the enjoyment of JITT where the percentage of responses remained at 14% or higher for all three post-midterm surveys. For the most useful question, the response rates for JITT are always higher than for the most enjoyed question. Again, there is a significant jump in response rates for the Fall 2021 semester where on average 30 ± 5% of all open-answer responses on each post-midterm survey identified JITT as something the students found the most useful.
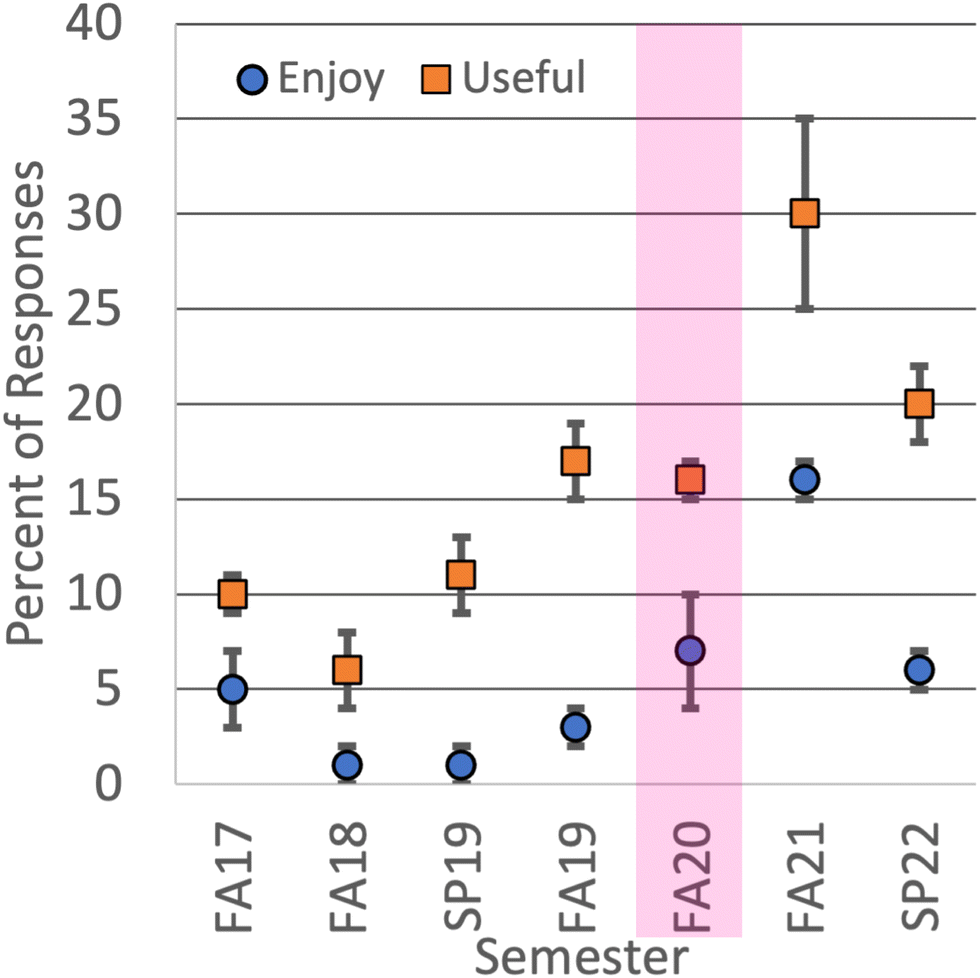 | ||
| Fig. 4 Percent of responses to the open-ended question “In this course, what aspect do you enjoy the most?” and “In this course, what do you find most useful?” that was coded to Just in Time Teaching. Only the data from post-midterm 1–3 are included. The semester that was taught 100% online due to COVID-19 (Fall 2020) is highlighted in magenta. | ||
3.4 What to add to the lecture
For the question “What would you add to the live lecture that would make it more useful/engaging?” the most common response across all semesters was some combination of more preparation or example problems. The average response rate to this question was 40 ± 2%. There were fluctuations to this answer during the semester. The average response rate after Midterm 1 was 37 ± 3%. It then rises to a maximum of 46 ± 4% after Midterm 2 and then falls back to 37 ± 3% after Midterm 3. The second most common response to this question was responses that essentially said that the status quo was good. This included responses where the students wrote “Nothing”, “N/A”, or simply left the field blank yet still responded to questions before and after this question. The average response rate across all surveys is 25 ± 2%. The average response rate after the first midterm is 24 ± 1%, after the second midterm is 25 ± 4%, and after the third midterm is 25 ± 4%. The third most common response was to have more time for or go into more depth with the group activities. The average response rate across all surveys is 12.0 ± 2%. The average response rate after the first midterm is the largest at 15 ± 3%. It then drops to 9 ± 2% after the second midterm and then rises again after the third midterm to 12 ± 3%. Finally, the fourth most common response centered around having more time devoted to a live lecture discussing the content of the course from the instructor. The average response rate across all surveys is 11 ± 1%. The average response rate after the first midterm is 15 ± 3%, after the second midterm is 9 ± 2% and after the third midterm is 12 ± 2%. This data is visualized in Fig. 5. | ||
| Fig. 5 Student response rates organized by how responses were coded to the question “What would you add to the live lecture?” as a function of which midterm the responses were collected after. The semesters that are included in this data are Spring 2022, Fall 2021, Fall 2020, Fall 2019, Spring 2019, and Fall 2018. The percent values may not add up to 100%. This is because the plot shows the four largest categories of responses that represent the large majority of respondents. | ||
3.5 Level of satisfaction
The next set of questions in the survey are closed-ended questions where students have to choose their level of agreement or rank their answers. For the first question on this set, students were asked “How satisfied are you with the delivery of the course?” In general, the satisfaction of students with the delivery of the course increases within the semester as shown in Fig. 6. The level of satisfaction starts lower in the semester as students get used to the format of the class, however, it steadily increases as the semester advances. It is notable that when comparing levels of satisfaction across semesters, in general, students were always on average at least somewhat satisfied with the delivery of the course at the end of the semester (values higher than 4 in a 7-point satisfaction scale). In addition, the satisfaction level for Fall 17 was the lowest; which was expected since it was the first time this course was taught in a flipped model and students were not sure what to expect. There was also a decrease in the overall satisfaction with the course during and after the COVID semesters (Fall 2020, Fall 2021, and Spring 2022). In these semesters, the satisfaction level is comparable with the Fall 2017 semester. | ||
| Fig. 6 Average students' level of satisfaction responses by semesters. Level of satisfaction scales is from 1 (extremely dissatisfy) to 7 (extremely satisfy). The pink rectangle represents the semester that was taught 100% online due to the COVID-19 pandemic. All other semesters were taught in-person. | ||
3.6 Usefulness of course tasks
The next set of questions asked students to rate how useful they found different course tasks that they completed before and during class. These tasks included pre-recorded video lectures assigned outside of class (Videos), working on preparatory assignments to reinforce concepts (PA Reinforce), working on preparatory assignments because they covered the material presented in the lecture videos (Pa material), having time in class to answer what topics were unclear in the preparatory assignments to understand material (Time material) and to prepare for in-class activities (Time class act). In general, students found that the preparation assignments are useful to reinforce concepts presented in the lecture videos. Additionally, spending time clarifying topics that were unclear in the preparation material was found useful for students to prepare for the in-class activities and to understand the lecture material. The trend observed is that students find these activities to be more useful across the semester with students' responses for post midterm 3 consistently being scored the highest as shown in Fig. 7. | ||
| Fig. 7 Average students' responses for how useful they found different activities before and during class. Level of satisfaction scales is from 1 (extremely useless) to 7 (extremely useful). | ||
3.7 Usage of lecture videos
In order to have a better insight into how students use the pre-recorded lecture videos, students were also asked to rank how they use the pre-recorded lectures in the class from 1 to 5. There were five options given to students that involved using the pre-recorded lectures to help them prepare for class (PrepareClass), to complete preparation assignments (Complete PA), to complete in-class activities (CompleteCA), to prepare for quizzes and exams (PrepExamQ), and to reinforce course concepts (ReinforceConc). Students ranked as their first option on average “to complete preparation assignments” followed by “to prepare for quizzes and exams”, and “to prepare for class” as the third rank as shown in Fig. 8. One interesting finding is that the lowest ranked items are “to complete in-class activities” and “to reinforce concepts”. As instructors we would hope that watching the videos would be to complete class activities and reinforce concepts. However, since the preparation assignments are due before class, students rely on the lecture videos to complete them and prepare for class.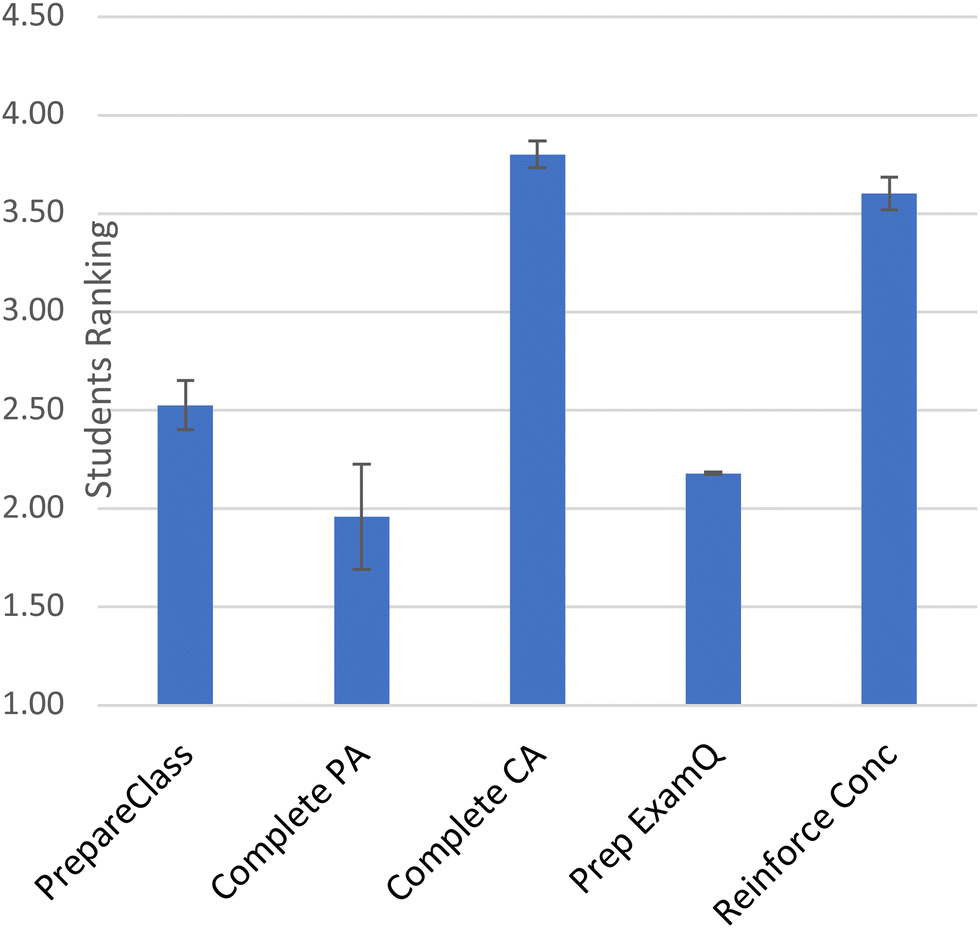 | ||
| Fig. 8 Average of students' ranking for how students use the pre-recorded lecture. Ranking goes from 1 to 5, being 1 the highest rank and 5 the lowest rank. | ||
The students were also surveyed on how much and what topics in the lecture videos they watched. The responses for each category were averaged over six semesters. The results from these questions are illustrated in Fig. S1 (ESI†) and described here. The first question asked whether students watch none, a quarter, half, three-quarters, or all of each lecture video. At the start of the semester, 69 ± 5% of students reported that they planned to entirely watch all the lecture videos. This percentage increased to 77 ± 3% after Midterm 1, decreased to 71 ± 5% after Midterm 2, and further dropped to 61 ± 6% after Midterm 3. We observed that as the semester progressed, students reported that they watched less of each lecture video. The second question asked if students focused on background/derivations, worked examples, both, or neither parts of the lecture videos. The worked examples and both survey responses were by far the most selected answers on the survey. After each midterm, more students watched only the worked examples (Pre-Course – 23 ± 3%; Midterm 1 – 26 ± 4%; Midterm 2 – 30 ± 3%; Midterm 3 – 36 ± 4%), while fewer reported that they watched both the background/derivations and the worked examples (Pre-Course – 74 ± 3%; Midterm 1 – 73 ± 4%; Midterm 2 – 69 ± 3%; Midterm 3 – 63 ± 4%). Towards the end of the course, the number of students who watched only the worked examples increased, while those who watched both the background/derivations and the worked examples decreased.
3.8 Level of agreement: time spent and instructor interactions
Students were asked about their level of agreement with statements related to the time spent in class and the instructor interactions during class. In general, students agreed with statements presented as shown in Table 4. The first four statements are related to how the time spent in class helps them to understand the material, to prepare for exams and quizzes, to become more critical thinkers, and to become better at working in a team. The next two statements are related to the interactions with the instructor during in-class activities to help them complete the group activity and understand the course material. In both sets of statements, students positively agreed with them and as we can observe the level of agreement increased as the semester progressed. Students' responses for the three time points ranged from 5.08 to 6.02. The statements related to the interaction with students have the highest level of agreement indicating how important are these interactions in a flipped classroom.| Midterm 1 | Midterm 2 | Midterm 3 | ||||
|---|---|---|---|---|---|---|
| Mean | SD | Mean | SD | Mean | SD | |
| I found the time spent in class on the activities helps me | ||||||
| (a) Understand the lecture material more clearly | 5.26 | 0.15 | 5.27 | 0.19 | 5.66 | 0.19 |
| (b) Prepare for quizzes and exams | 5.40 | 0.19 | 5.25 | 0.17 | 5.79 | 0.17 |
| (c) To become a more critical thinker | 5.16 | 0.21 | 5.16 | 0.14 | 5.58 | 0.21 |
| (d) To become better at working in a team | 5.23 | 0.16 | 5.08 | 0.12 | 5.54 | 0.17 |
| Being able to interact personally with the instructor during in-class activities | ||||||
| (a) Is helpful to complete the group activity | 5.65 | 0.16 | 5.73 | 0.13 | 5.98 | 0.13 |
| (b) Helps me better understand the course material | 5.79 | 0.12 | 5.77 | 0.10 | 6.02 | 0.10 |
3.9 Student reaction to COVID
The results to the questions that were added due to the COVID-19 pandemic will be summarized in this section. Fig. 9 shows the responses to the question that asked students how they were coping with the transition online (Fall 2020) and back to in-person instruction (Fall 2021 and Spring 2022). For the semester that was online (Fall 2020) the majority of students expressed having a difficult time adjusting to the online delivery of the material throughout the whole semester (Midterm 1 – 62%; Midterm 2 – 57%; Midterm 3 – 64%). The percent of responses that were coded as having found the transition manageable were in the minority (Midterm 1 – 36%; Midterm 2 – 35%; Midterm 3 – 26%). When instruction for this course changed back to in-person delivery the opinion expressed by the respondents changed as the semester progressed. For both Fall 2021 and Spring 2022, at the post-Midterm 1 survey, students who report having a difficult time adjusting to the transition back to in-person instruction is the highest (Fall 2021 – 53%; Spring 2022 – 25%) and students who report the transition being manageable the lowest (Fall 2021 – 27%; Spring 2022 – 39%). As time progresses in the semester, however, the number of students who report having a difficult time with the transition drops, and the number of students who report the transition being manageable increases. | ||
| Fig. 9 Student response rates organized by how responses were coded to the question “How are you coping with the 100% online environment and COVID? Is there anything that the instructor can do to help?” (Fall 2020) and “How are you coping with returning to in-person classes? Is there anything that the instructor can do to help?” (Fall 2021 and Spring 2022) as a function of which midterm the responses were collected after. The percent values may not add up to 100%. This is because the question is an open response, and some respondents elected to leave this blank or write something along the lines of ‘N/A’. | ||
The responses to the question “Have you found that your study habits have changed since classes transitioned online/in-person?” are presented in Fig. 10. In general, the majority of respondents for all three semesters surveyed reported that their study habits changed due to the shift in course delivery both for the transition to online instruction as well as when the university switched back to in-person instruction. The average respondent rate for the Fall 2020 semester is 63 ± 3%, for the Fall 2021 semester, the average is 83 ± 3% and for the Spring 2022 semester, the average is 69 ± 1%.
 | ||
| Fig. 10 Student response rates organized by how responses were coded to the question “Have you found that your study habits have changed since classes transitioned online/in-person?” as a function of which midterm the responses were collected after. The semesters that are included in this data are Spring 2022, Fall 2021, and Fall 2020. The percent values may not add up to 100%. This is because the question is an open response and some respondents elected to leave this blank or write something along the lines of ‘N/A’. There is no data from the post-Midterm 1 survey since the question was only added for the post-Midterm 2 survey and beyond. | ||
Finally, the responses to the question ‘Have you noticed a change in cheating/academic dishonesty since classes transitioned online/back in-person. Explain.’ are illustrated in Fig. 11. The responses indicated that during the online Fall 2020 23% after Midterm 2, and 30% after Midterm 3 were aware of an increase in academic dishonesty. During the following in-person Fall 2021 semester, an average of 19 ± 1% of students responded that they had seen a decrease in academic dishonesty. A similar sentiment was expressed in the Spring 2022 semester, where 20 ± 10% of respondents observed a decrease in academic dishonesty after the return to in-person instruction.
 | ||
| Fig. 11 Student response rates organized by how responses were coded to the question “Have you noticed a change in cheating/academic dishonesty since classes transitioned online/in-person.” as a function of which midterm the responses were collected after. The semesters that are included in this data are Spring 2022, Fall 2021, Fall 2020. The percent values may not add up to 100%. This is because the question is an open response and some respondents elected to leave this blank or write something along the lines of ‘N/A’ or ‘I don't know’. There is no data from the post-Midterm 1 survey since the question was only added for the post-Midterm 2 survey and beyond. | ||
4 Discussion, limitations, and implications
4.1 Limitations of the study
Respondents to the survey were self-selected to complete the surveys and the pool was generally students who were still attending class. This probably put a bias in our results relative to what they would have been if a broader sample of the course was surveyed. This bias might be accentuated by the fact that fewer students completed the survey at the end of the semester after Midterm 3 relative to the number of students who took it on the first day of classes.Additionally, there is only one semester with 54 students where the course was taught traditionally by the co-author to compare the 7 semesters of flipped classroom instruction to. This limits the ability of the work to conclusively quantify any changes to GPAs due to the flipped classroom model given the small number of students associated with the control group.
4.2 Discussion and implications
Our discussion on the efficacy of the flipped classroom model will then focus primarily on how the students, in general, overemphasized the importance of the preparation questions that were due before the start of each class for their success in the course. In this implementation of the flipped classroom, there are preparation questions prior to the start of class as well as activities with multiple problems that are completed in groups during the synchronous class. For the preparation questions, the authors created primarily single step, scaffolded questions to reinforce ideas presented in the lecture videos and help students get started with answering questions they will encounter in class group activities. The activities tended to ask more multi-step type problems that would be the style of question that would appear on in-class examinations. Only the preparation questions are submitted for grading by the learning management system, while it is up to the student to choose to complete the classroom activities in preparation for quizzes, midterms, and the final exam. Using the data presented in this paper and other work from the literature, we will suggest that for flipped classroom settings to increase GPA scores, students need to turn in homework where students will be expected to answer multi-step problems that combine course concepts after the synchronous class session so that they are compelled to be better prepared for in-class examinations.
Looking back at Fig. 3b when asked what aspect of the flipped classroom the students disliked the most as the semester progressed, a larger number of student respondents tended to dislike the preparation questions more and more. Indeed, by midterm 3, the preparation questions response was the largest on average of all the coded responses. Our interpretation of students enjoying the preparation exercises less and less as the semester went on is from the constant nature of having to do them. Students get less engaged as the semester progresses due to many factors including fatigue. Having to constantly engage with the preparation activities becomes more and more difficult especially as other deadlines multiply at the end of the semester. However, as indicated in Fig. 3c, as the semester progressed, students also found the preparation questions more useful the further they got into the course. Though many students increasingly disliked the preparation questions, they saw their value in solidifying concepts as well as preparing for quizzes and exams. One student states, “I do not enjoy doing the before class activity assignment, but I do think it is necessary for us to practice on the material and struggle. I actually heavily dislike it, but allow us to see the gaps in our understanding.” Some other student responses include: “The most helpful things we do are the preparation lecture/material and quizzes because they are usefully fair questions that solidify our understanding of the topics.” and “I think the most useful thing we do are the preparation and end of lecture assignments because it allows us to practice the content for each lecture, as well as prepare for our quizzes and midterms.” Additionally, in Fig. 7, the tasks that students found most useful tended to relate to completing the preparation exercises instead of completing the in-class activities. Finally, in Fig. 8, students ranked using the pre-recorded lecture videos to ‘complete the preparation activities’ and ‘preparing for exam questions’ much higher than ‘reinforcing concepts’ and ‘completing the in-class activity’. All of this data together suggests that the students are heavily emphasizing the completion of the preparation activity over other in-class activities that might help them perform well on exams. There are two notable things at play here: first, students dislike being compelled to answer questions on the learning management system that are individual to themselves, however, they see the value in doing the activity. Second, there is no coded response on the liking, disliking, or finding useful the synchronous class active learning activities. This is notable as the questions that appear in the activities represent what might appear on quizzes, midterms, and the final exam. The authors hypothesize that since there is no requirement to turn in any material from the in-class activities, students, in general, place limited emphasis on completing it.
Given that students are not compelled to interact with multi-step problems on their own then they might be less prepared to answer these types of questions on summative assessments. This conclusion seems to be supported by the literature, where flipped courses that maintained having each student submit graded homework after class saw significant increases in student success (Flynn, 2015; Gross et al., 2015; Weaver and Sturtevant, 2015; Crimmins and Midkiff, 2017; Rau et al., 2017; Bancroft et al., 2020; Brady and Voronova, 2023) while flipped courses with no graded post-class homework from each student did not seem to result in significant increases in student success (Christiansen, 2014; Ryan and Reid, 2016; Dehghan et al., 2022). This is not to say that post-class homework is more important than pre-class questions. A study by Ranga showed that students who completed all their pre-lecture and post-lecture homework in an integrated flipped classroom environment performed much better on summative assessments than students who did not complete all their pre- and post-class homework activities (Ranga, 2020). Based on the findings reported in this work and others in the literature, it appears that both pre- and post-lecture homework is important to compel students to engage regularly with the topics they will encounter on summative assessments, even in a flipped classroom environment.
Additionally, even though there are already a lot of practice questions provided to students, a plurality of them are still looking for more. This is based on the results in Fig. 5. The ‘more practice problems’ coded responses in the ‘What would you add to the lecture?’ question see a maximum at Midterm two. This is attributed to the number of emphasized questions for Midterm 2 relative to what is emphasized to be on Midterm 1 and Midterm 3. Table 5 shows how the topics covered in the course are distributed for each midterm. Each of the three midterms covers a similar number of topics. However, for Midterms 1 and 3, the instructor emphasizes 2 types of questions that will appear on the Midterm. For Midterm 1, there is going to be a question regarding the evaluation of a heat cycle, as well as a question on statistical mechanics. A heat cycle question is used since it integrates several thermodynamics topics that are covered in that section of the course (gas laws, heat, work, internal energy, enthalpy, and the first law of thermodynamics). A statistical mechanics question is also included since it helps to set up the discussion regarding entropy, which is covered soon afterward. For Midterm 3, there is an equilibrium question where the student must take into account the role of the ions in solution. This takes the form of a solubility or acid–base question. The other question is a kinetics question where the students need to integrate a rate law expression and determine the half-life for a process. In contrast to this, Midterm 2 does not have any emphasized questions that will appear on that evaluation. The authors speculate that this is the rationale for the increase in the response rate for more practice problems at Midterm 2. With less certainty on what types of questions will appear on the midterm, the students want to have more example problems to study with so that they feel more prepared for the evaluation. This sentiment is probably not tied to the flipped classroom environment, however, it indicates that there is room to provide more required questions in the form of post-class homework to the course reported here to compel students to better prepare for summative assessments.
| Topics covered | Number of emphasized questions | |
|---|---|---|
| Midterm 1 | Gas laws, heat, work, internal energy, first law of thermodynmics, enthalpy, statistical mechanics | 2 |
| Midterm 2 | Entropy, free energy, mixtures, colligative properties, equilibrium | 0 |
| Midterm 3 | Ions in solution, acid–base equilibrium, electrochemistry, rate law expressions, temperature dependence of rate constants | 2 |
| After Midterm 3 | Kinetics and equilibrium, consecutive chemical reactions, enzyme kinetics |
It also appears that the shift back to in-person was also difficult. There was a cohort of students who did not spend much time on campus prior to the pandemic, so returning to in-person instruction was also a large change. For example, student responses after the first midterm included, “Overall, returning to in-person has been a big shock. As understanding as teachers are being, it really does feel like those two years weren't spent learning. Returning to in-person as a junior or senior with the expectations of this class standing has been difficult. The bulk of this course seems to be done at home, with the added time of in person class. This makes it difficult to keep up with all the material, especially when taking other courses into consideration.” and “Due to the not-very-smooth transition from all online to all in person, it has taken a toll on my mental health and physical health, and it makes it hard to keep up with my classes and my self-care. I wish it would be easier if the instructor could be more understanding and not too hard on the class.” The difficulty that students experienced seemed to become more manageable as the semester went on. One student remarked “I think that at the beginning of the semester it was a big change having to come back in person. After being online for so long, it was difficult getting used to the routine of waking up, coming to campus, and attending classes in person. However, now I feel that it has gotten a lot easier.”
The results from the question “Have you found that your study habits have changed since classes transitioned online/in-person?” provide more context to how students were handling the transition. They expressed that there was a lot of upheaval to their study habits when the modality shifted. They also expressed that there was no ideal delivery method for their study habits. For example, when classes were online (Fall 2020 data) students remarked that there were too many distractions and responsibilities at home that prevented them from being able to focus on their work. For example, two students remarked “Yes, I am now study more than in person class, because there are many things to distract so I have to study hard so I can pass” and “Yes, I am more reliant on myself to learn the material which makes it more difficult. Before, I had more opportunities to learn from my peers or ESI.†” When students returned to in-person instruction (Fall 2021 and Spring 2022 data) there appeared to be more pressure on their time, given that they need to commute to the university and work. Two student responses include “I am less likely to procrastinate because I have less time to do so when factoring in commuting, work, and etc.” and “Yes, I have less time now so I have to force more studying in between classes or small time blocks throughout the day.” For commuter students at an institution where a vast majority of students work part-time and more than 66.1% of our student population is receiving need-based financial aid these comments seem to indicate that when it comes to study habits, there does not appear to be an ideal modality. There are benefits and problems with both online and in-person instruction for everyone. It appears, however, that the transition between the two modalities caused significant upheaval. One underlying theme that a lot of comments shared was that their routines were modified when an instructional shift occurred, and that required a dramatic shift in how they had to plan their day/life.
The final COVID-related question focused on academic dishonesty by asking if students perceived any changes in cheating when classes transitioned online and then back in person. Students in online courses have the same ability to cheat in most activities as in-person students, including on homework, take-home assignments, essays, group work etc. The major exception is during exams that are designed to be invigilated. For these types of assessments, students are under increased pressure and will tend to cheat more when they perceive a lower likelihood of getting caught (Gamage et al., 2020) or when cheating is perceived as usual or acceptable by a student's peers (Daumiller and Janke, 2020). It is surprising to note that academic dishonesty rates in online courses are typically lower compared to in-person delivery. This has been attributed to how students in online courses skew older than in-person students and academic dishonesty rates tend to decrease with the maturity of the student. Although this trend is probably not applicable here given the widespread use of online instruction due to COVID-19 meaning that this period is not a true representation of traditional online learning offerings given the sudden and unwilling participants, both students and instructors (Eaton, 2020; Hodges et al., 2020).
Some reported pre-pandemic levels of academic dishonestly include a 2005 study, which surveyed over 80000 students in the USA and Canada, where 21% of student respondents admitted to copying from another student on a test, used unauthorized crib/cheat notes or helped someone else cheat on a test (McCabe, 2005a). Response rates of students admitting to academic dishonesty are expected to the under-reported due to student fears of reprisal. The author admits that this result might be even lower than is expected given that the survey was administered over the web which the author suspected further exasperated the fear of being caught (McCabe, 2005b). Another world-wide study surveying economics and business students reported that 61.7% of respondents admitted to at least sometimes engaging in academic fraudulent behavior (Teixeira and Rocha, 2010). Many studies put self-reported rates of cheating at least once over their undergraduate studies at about half to two-thirds (Daumiller and Janke, 2020).
In the context of the pandemic, instructors have observed an increase in academic dishonesty. For example, researchers in Australia found that at least 34.9% of students in an introductory chemistry course used a response provided by Google when instructed that they could not use search tools like Google for an online exam. They then examined the grades of the students who they found to have inputted this Google-derived incorrect answer and found that they received, on average lower grades in the course. This could partially be due to the fact that the Googled answers were incorrect and the student did not know better (Schultz et al., 2022), however, there is also evidence that students who perform better in courses tend to cheat at a lower rate (Bing et al., 2012).
The 20% jump in reported academic dishonesty seems to be in line with other examples from online surveys and possibly represents a lower bound on the actual amount ongoing during this time. Two student responses that support that this is a lower bound include: “Yes. It is just easier to cheat now. I don't think it's right to cheat but I know there is a lot of academic dishonesty happening.” and “I've noticed a massive increase.” However, other student responses include: “I have noticed an increase in cheating because of the online format, but don't feel as though it is as rampant as some people feel.” and “I can't really say objectively if cheating has increased amongst my peers as I haven't been exposed to it, I'm more focused on my exams and quizzes.” These quotes demonstrate that students either have witnessed or perceive an increase in academic dishonesty due to the online format, however, there is some uncertainty as to how rampant it actually is. This makes judging how much more academic dishonesty that is occurring above the 20% floor difficult.
Another issue to consider in the discussion of this result is what students perceive as academic dishonesty. Many of the responses focused on using banned sources to look up answers as the primary example of cheating in courses. One student remarked: “Yes, I have heard from a lot of other students that they look up answers because you can find a lot of them online, like on quizlet.” In the course under study here during the virtual Fall 2020 semester, exams were open book. Students were told that they could use whatever resource they wanted as they completed the exam through the LMS, except that they could not interact with another person in real-time during the exam. To try to ensure that students would be discouraged from collaborating during a test, each student had a unique exam where each question had several variations and different numbers in the prompt. Exams were also a little longer than what would be created for an in-person class, adding time pressure on students to complete the exam. Also, the content for a senior physical chemistry course on thermodynamics, statistical mechanics, and kinetics would have longer questions that are not easily found through search engines or other sites like Course Hero and Chegg. The added time pressure was in part to deter students from posting problems to these sites since they may not get responses in time to help for the exam. The instructor periodically searched these sites for their exam questions and never found any posted leading them to conclude that students were not attempting to interact with these banned resources during exams. The 20% value might be related to how the common way that students would try to cheat (look up answers/have crib sheets) was not academic dishonesty in this course, so when students answered this question, they may have been predisposed to say that they have not been exposed to academic dishonesty as they did not see the need to cheat here.
Finally, the students taking this course were close to graduation and were probably more mature than younger students. As was discussed before, more mature students tend to cheat less. For example, some students remarked: “Less, I guess. But to be honest, who are they really cheating?” and “There's probably less cheating in an in-person setting, but at the end of the day, who's really cheating who. Tuition is already paid. If they don't want to learn, then so be it. It's their money that's going to waste.” These types of responses indicate that at least some of the students recognize the problem with cheating on exams. Finally, there might be a cultural aspect against cheating at this institution. One student expressed, “No, I feel as though it remains the same. Students are just as hardworking and studying!” This sentiment might indicate that the actual increase in academic dishonesty is closer to 20% instead of being much higher than what is reported in the literature.
Additionally, the response rates for the academic dishonesty question seem to indicate that even though academic dishonesty increased during the virtual semester it seems to have returned to pre-pandemic levels once classes returned to in-person delivery. Two student comments in regard to this reduction in academic dishonesty include: “Yes, as many have a chegg account and discord. In person assessment prevents that.” and “Yes, people don't bring up cheating/sharing answers as much anymore.” However, there were many students who commented that they did not notice an increase in academic dishonesty in the first place. Two of these comments include: “I have not really noticed a change in the dishonesty as classes are moving back to in-person mainly because I don't usually cheat and I am not looking for others who are cheating.” and “This is my first semester back after a year, I didn't notice much cheating back in 2020 when we first went online”. It is reassuring to see that once the modality returned to in-person the perception of academic dishonesty seems to have returned to pre-pandemic levels.
In the context of study habits and academic dishonesty, there are some interesting trends with GPA results. For example, the average GPA result for the Fall 2020 semester is not significantly different compared to the traditionally taught Fall 2016 semester and appears to be consistent with almost all the other in-person semesters prior to the pandemic. This seems to be unusual compared to other reports in the literature where students experienced pandemic-related stressors that negatively affected their academic performance (Hadwin et al., 2022; Hrelic and Anderson, 2022). Given that the COVID-19 pandemic was more severe to underrepresented groups (Molock and Parchem, 2022), it would follow that GPA scores should be lower, however, this is not the case here. This could be a result of the way the course was delivered, given that the materials were already posted online and the structure of the course remains largely unchanged. However, it should also be noted that this could also be a result of increased academic dishonesty or that the cohort of students who took the course that semester were, on average, academically stronger than in other semesters. Then, after this anomalous online semester, the two in-person semesters (Fall 2021 and Spring 2022) are both tied for the lowest average GPA result. It is important to note that the GPA results for these two semesters are not statistically different than the traditionally taught Fall 2016 semester. Regardless, this result may indicate that the increase in academic dishonesty/change in study habits during the online semester might have caused the GPA result to be consistent with GPA scores measured prior to the pandemic. Then, when students could not cheat in the same way once they returned to in-person instruction, coupled with the change in study habits that favored an online course style, and not in-person exams, the average GPA values dipped.
During this period (Fall 2020 onwards), the average SOQ scores also significantly dipped. This is interesting given that this includes both in-person and online semesters where the instructor did not change the course except during the Fall 2020 semester where the class met over Zoom and used breakout rooms to do the group work activities. This large drop in SOQ scores relative to pre-pandemic course offerings was not observed department-wide (Fig. 1b). Several hypotheses as to why this occurred include: first, during the pandemic, all instructors were forced to incorporate different online teaching resources. The sudden re-examination of how courses were delivered may have on average, increased the quality of instruction department-wide. Second, one of the strategies employed might have been to record their lectures/make dedicated lectures for their classes. The propagation of the method documented in this manuscript may have reduced how unique this course offering is and any added SOQ benefit that came with that. Third, students might just be tired of watching online instructional videos for their university courses. The bump in responses for JITT in Fall 2021 lends credibility to this idea as there seems to be an appetite for having a traditional style lecture course post-pandemic. Fourth, during the pandemic, there were many concessions/flexibilities that students were offered that have somewhat carried over into semesters when students were back in person. These concessions might have inflated the SOQs department-wide. In the course studied here, there were effectively no changes in expectations and deadlines, and that might be reflected in the SOQ scores.
5 Conclusion
This study presented the experience of using flipped classroom instruction in a senior physical chemistry course at a large, public, Hispanic serving institution before, during, and after the COVID-19 pandemic. Major findings include that in only one semester out of seven was the average GPA of the flipped classroom significantly larger than the one semester taught traditionally by the same instructor. The authors concede that the size of the traditional lecture control group was small which might have impacted our ability to quantify differences between the traditional lecture versus the flipped classroom. However, it is notable that the flipped classroom version of the course covered more material in greater depth than the traditional lecture version of the course. This could mean that any increase in GPA might have also been tempered by how students had more material to cover. Additionally, the authors hypothesize that one of the main reasons for not observing an increase in course GPA was due to there being a lack of homework that mimics questions that will be seen on summative assessments that is turned in for credit. A review of the literature shows that STEM courses that employ flipped classrooms that also have homework tends to observe increases in GPA while courses that do not have homework tend to not observe increases in GPA.The other major finding is that the COVID-19 pandemic affected students' study habits and course evaluations. Post COVID-19, female students, Pell recipients and students where at most one parent attended college see a decrease in their GPA relative to their pre-pandemic levels. Additionally, the instructor's student opinion questionnaire scores see a decrease relative to their pre-pandemic levels. Given that this course remained largely unchanged during virtual semesters due to the online nature of many elements already implemented into the course, these changes are attributed to how students perceptions towards education have changed in accordance with their study habits, and association with academic dishonesty.
Author contributions
Trisha M. Gomez did formal analysis, participated in visualization of data and contributed to writing – original draft. Charmaine Luciano did formal analysis and contributed to writing – original draft. Tam Nguyen did formal analysis. Sachel M. Villafañe co-lead conceptualization, data curation, formal analysis, methodology, project administration, supervision, validation, visualization, writing – original draft and writing – review & editing. Michael N Groves lead investigation and co-lead conceptualization, data curation, formal analysis, methodology, project administration, supervision, validation, visualization, writing – original draft and writing – review & editing.Data availability
The original data cannot be made available as it contains some identifying information on the students.Conflicts of interest
There are no conflicts to declare.Acknowledgements
The authors would like to thank the students who participated in answering the co-authors' surveys. Their candid responses form the basis of this manuscript.Notes and references
- Baker J., (2000), The ‘classroom flip’: using web course management tools to become the guide by the side, in Chambers J. (ed.), 11th International Conference on College Teaching and Learning, Center for the Advancement of Teaching and Learning, pp. 9–17.
- Bancroft S. F., Fowler S. R., Jalaeian M. and Patterson K., (2020), Leveling the field: flipped instruction as a tool for promoting equity in general chemistry, J. Chem. Educ., 97(1), 36–47.
- Bernard R. M., Borokhovski E., Schmid R. F., Tamim R. M. and Abrami P. C., (2014), A meta-analysis of blended learning and technology use in higher education: from the general to the applied, J. Comput. High. Educ., 26(1), 87–122.
- Bing M. N., Davison H. K., Vitell S. J., Ammeter A. P., Garner B. L. and Novicevic M. M., (2012), An experimental investigation of an interactive model of academic cheating among business school students. Acad. Manage. Learn. Educ., 11(1), 28–48.
- Bokosmaty R., Bridgeman A. and Muir M., (2019), Using a partially flipped learning model to teach first year undergraduate chemistry, J. Chem. Educ., 96(4), 629–639.
- Bopegedera A. M. R. P., (2020), Using familiar and new assessment tools in physical chemistry courses during covid-19, J. Chem. Educ., 97(9), 3260–3264.
- Bottomley S. and Denny P., (2011), A participatory learning approach to biochemistry using student authored and evaluated multiple-choice questions, Biochem. Mol. Biol. Educ., 39(5), 352–361.
- Brady D. and Voronova K., (2023), Flipped online active learning environment for large general chemistry courses, J. Chem. Educ., 100(3), 1109–1117.
- Casselman M. D., Atit K., Henbest G., Guregyan C., Mortezaei K. and Eichler J. F., (2020), Dissecting the flipped classroom: using a randomized controlled trial experiment to determine when student learning occurs, J. Chem. Educ., 97(1), 27–35.
- Christiansen M. A., (2014), Inverted teaching: Applying a new pedagogy to a university organic chemistry class, J. Chem. Educ., 91(11), 1845–1850.
- Contreras L. E., Sandoval A., Maya Hoyos M. and Soto Ospina C. Y., (2022), Remote learning of biochemistry during the covid-19 pandemic: case of undergraduate students in bogota, colombia, J. e-Learn. Res., 1(3), 1–12.
- Crimmins M. T. and Midkiff B., (2017), High structure active learning pedagogy for the teaching of organic chemistry: assessing the impact on academic outcomes, J. Chem. Educ., 94(4), 429–438.
- Crucho C. I. C., Avó J., Diniz A. M. and Gomes M. J. S., (2020), Challenges in teaching organic chemistry remotely, J. Chem. Educ., 97(9), 3211–3216.
- Daumiller M. and Janke S., (2020), Effects of performance goals and social norms on academic dishonesty in a test, Br. J. Educ. Psychol., 90(2), 537–559.
- Dehghan S., Horan E. M. and Frome G., (2022), Investigating the impact of the flipped classroom on student learning and enjoyment in an organic chemistry course, J. Chem. Educ., 99(7), 2512–2519.
- Denny P., Luxton-ReillyA. and Hamer J., (2008), The peerwise system of student contributed assessment questions, in Proceedings of the Tenth Conference on Australasian Computing Education, ACE '08, vol. 78, AUS: Australian Computer Society, Inc., pp. 69–74.
- Dicks A. P., Morra B. and Quinlan K. B., (2020), Lessons learned from the covid-19 crisis: adjusting assessment approaches within introductory organic courses, J. Chem. Educ., 97(9), 3406–3412.
- dos Santos Belmonte I., Borges A. V. and Garcia I. T. S., (2022), Adaptation of physical chemistry course in covid-19 period: reflections on peer instruction and team-based learning, J. Chem. Educ., 99(6), 2252–2258.
- Dukes III A. D., (2020), Teaching an instrumental analysis laboratory course without instruments during the covid-19 pandemic, J. Chem. Educ., 97(9), 2967–2970.
- Eaton, S. E., (2020), Academic integrity during covid-19: reflections from the university of calgary, Int. Studies Educ. Admin., 48(1), 1.
- Flynn A. B., (2015), Structure and evaluation of flipped chemistry courses: organic & spectroscopy, large and small, first to third year, english and French, Chem. Educ. Res. Pract., 16, 198–211.
- Freeman S., Eddy S. L., McDonough M., Smith M. K., Okoroafor N., Jordt H. and Wenderoth M. P., (2014), Active learning increases student performance in science, engineering, and mathematics. Proc. Natl. Acad. Sci. U. S. A., 111(23), 8410–8415.
- Galloway K. W. and Burns S., (2015), Doing it for themselves: students creating a high quality peer-learning environment. Chem. Educ. Res. Pract., 16, 82–92.
- Gamage K. A., Silva E. K. D. and Gunawardhana N., (2020), Online delivery and assessment during covid-19: safeguarding academic integrity. Educ. Sci., 10(11), 301.
- Gemmel P. M., Goetz M. K., James N. M., Jesse K. A. and Ratliff B. J., (2020), Collaborative learning in chemistry: impact of covid-19, J. Chem. Educ., 97(9), 2899–2904.
- George-Williams S., Motion A., Pullen R., Rutledge P. J., Schmid S. and Wilkinson S., (2020), Chemistry in the time of covid-19: reflections on a very unusual semester, J. Chem. Educ., 97(9), 2928–2934.
- Gross D., Pietri E. S., Anderson G., Moyano-Camihort K. and Graham M. J., (2015), Increased preclass preparation underlies student outcome improvement in the flipped classroom, CBE—Life Sci. Educ., 14(4), ar36.
- Hadwin A. F., Sukhawathanakul P., Rostampour R. and Bahena-Olivares L. M., (2022), Do self-regulated learning practices and intervention mitigate the impact of academic challenges and covid-19 distress on academic performance during online learning? Front. Psychol., 13, 1.
- Hodges C., Moore S., Lockee B., Trust T. and Bond A., (2020), The difference between emergency remote teaching and online learning, Educ. Rev., https://er.educause.edu/articles/2020/3/the-difference-between-emergency-remote-teaching-and-online-learning, March 27.
- Hrelic D. A. and Anderson J. G., (2022), Managing the unexpected: stressors and solutions for challenges experienced by rn-bsn students during an unprecedented global pandemic, J. Professional Nursing, 40, 48–56.
- Jensen J. L., Kummer T. A. and Godoy P. D. D. M., (2015), Improvements from a flipped classroom may simply be the fruits of active learning, CBE—Life Sci. Educ., 14(1), ar5.
- Lage M. J., Platt G. J. and Treglia M., (2000), Inverting the classroom: a gateway to creating an inclusive learning environment, J. Economic Educ., 31(1), 30–43.
- LeSuer R. J. and Reed C. R., (2022), Assessing technology's impact on general chemistry student engagement during covid-19, J. Chem. Educ., 99(11), 3687–3693.
- McCabe D. L., (2005a), Cheating among college and university students: a north american perspective, Int. J. Educ. Int., 1(1), 1.
- McCabe D. L., (2005b), It takes a village: academic dishonesty & educational opportunity, Liberal Educ., 91(3), 26–31.
- Mojica E.-R. E. and Upmacis R. K., (2022), Challenges encountered and students' reactions to practices utilized in a general chemistry laboratory course during the covid-19 pandemic, J. Chem. Educ., 99(2), 1053–1059.
- Molock S. D. and Parchem B., (2022), The impact of covid-19 on college students from communities of color, J. Am. College Health, 70(8), 2399–2405.
- Nag A., (2023), Insights gained from an inquiry-driven biochemistry laboratory during the covid-19 pandemic, J. Chem. Educ., 100(5), 2045–2049.
- Naibert N., Geye E., Phillips M. M. and Barbera J., (2020), Multicourse comparative study of the core aspects for flipped learning: investigating in-class structure and student use of video resources, J. Chem. Educ., 97(10), 3490–3505.
- Petillion R. J. and McNeil W. S., (2020), Johnstone's triangle as a pedagogical framework for flipped-class instructional videos in introductory chemistry, J. Chem. Educ., 97(6), 1536–1542.
- Ranga J. S., (2020), Factors influencing student learning in semi-flipped general chemistry courses, J. Chem. Educ., 97(8), 2130–2139.
- Rau M. A., Kennedy K., Oxtoby L., Bollom M. and Moore J. W., (2017), Unpacking “active learning”: a combination of flipped classroom and collaboration support is more effective but collaboration support alone is not, J. Chem. Educ., 94(10), 1406–1414.
- Rodríguez-Rodríguez E., Sánchez-Paniagua M., Sanz-Landaluze J. and Moreno-Guzmán M., (2020), Analytical chemistry teaching adaptation in the covid-19 period: experiences and students' opinion, J. Chem. Educ., 97(9), 2556–2564.
- Ryan B. J., (2013), Line up, line up: using technology to align and enhance peer learning and assessment in a student centred foundation organic chemistry module, Chem. Educ. Res. Pract., 14, 229–238.
- Ryan M. D. and Reid S. A., (2016), Impact of the flipped classroom on student performance and retention: a parallel controlled study in general chemistry, J. Chem. Educ., 93(1), 13–23.
- Schultz M., Lim K. F., Goh Y. K. and Callahan D. L., (2022), Ok google: what's the answer? characteristics of students who searched the internet during an online chemistry examination, Assess. Eval. High. Educ., 47(8), 1458–1474.
- Seery M. K., (2015), Flipped learning in higher education chemistry: emerging trends and potential directions, Chem. Educ. Res. Pract., 16, 758–768.
- Sigmon A. J. and Bodek M. J., (2022), Use of an online social annotation platform to enhance a flipped organic chemistry course, J. Chem. Educ., 99(2), 538–545.
- Smith J. D., (2013), Student attitudes toward flipping the general chemistry classroom, Chem. Educ. Res. Pract., 14, 607–614.
- Sorenson B. and Hanson K., (2023), Statistical comparison between in-person and online general chemistry exam outcomes: a covid-induced case study, J. Chem. Educ., 100(9), 3454–3461.
- Stowe R. L., Scharlott L. J., Ralph V. R., Becker N. M. and Cooper M. M., (2021), You are what you assess: The case for emphasizing chemistry on chemistry assessments, J. Chem. Educ., 98(8), 2490–2495.
- Strayer J. F., (2012), How learning in an inverted classroom influences cooperation, innovation and task orientation, Learn. Environ. Res., 15(2), 171–193.
- Sunasee R., (2020), Challenges of teaching organic chemistry during covid-19 pandemic at a primarily undergraduate institution, J. Chem. Educ., 97(9), 3176–3181.
- Teixeira A. A. C. and Rocha M. F., (2010), Cheating by economics and business undergraduate students: an exploratory international assessment, High. Educ., 59(6), 663–701.
- Torres D., Pulukuri S. and Abrams B., (2022), Embedded questions and targeted feedback transform passive educational videos into effective active learning tools, J. Chem. Educ., 99(7), 2738–2742.
- Tune J. D., Sturek M. and Basile D. P., (2013), Flipped classroom model improves graduate student performance in cardiovascular, respiratory, and renal physiology, Adv. Physiol. Educ., 37(4), 316–320.
- Valle-Suárez R. M., Calderón-Mendoza G. L., Lanza-Sorto N. A. and Ponce-Rodríguez H. D., (2020), Teaching instrumental analytical chemistry in the framework of covid-19: experiences and outlook, J. Chem. Educ., 97(9), 2723–2726.
- Van Heuvelen K. M., Daub G. W. and Ryswyk H. V., (2020), Emergency remote instruction during the covid-19 pandemic reshapes collaborative learning in general chemistry, J. Chem. Educ., 97(9), 2884–2888.
- Villanueva O., Behmke D. A., Morris J. D., Simmons R., Anfuso C., Woodbridge C. M. and Guo Y., (2020), Adapting to the covid-19 online transition: reflections in a general chemistry sequence taught by multiple instructors with diverse pedagogies, J. Chem. Educ., 97(9), 2458–2465.
- Vyas V. S. and Reid S. A., (2023), What moves the needle on dfw rates and student success in general chemistry? a quarter-century perspective, J. Chem. Educ., 100(4), 1547–1556.
- Weaver G. C. and Sturtevant H. G., (2015), Design, implementation, and evaluation of a flipped format general chemistry course, J. Chem. Educ., 92(9), 1437–1448.
- Wu F. and Teets T. S., (2021), Effects of the covid-19 pandemic on student engagement in a general chemistry course, J. Chem. Educ., 98(12), 3633–3642.
Footnote |
| † Electronic supplementary information (ESI) available: Sample surveys provided to students. See DOI: https://doi.org/10.1039/d4rp00074a |
| This journal is © The Royal Society of Chemistry 2025 |