DOI:
10.1039/D5RA07482G
(Paper)
RSC Adv., 2025,
15, 45061-45070
Influence of green fillers from oil palm trunk (Elaeis guineensis) on the thermal stability, tensile performance and morphological properties of reinforced epoxy composites
Received
2nd October 2025
, Accepted 6th November 2025
First published on 18th November 2025
Abstract
This study was done to investigate the effects of the addition of different green nanofillers as reinforcement materials, which were cellulose nanocrystals (CNCs) derived from oil palm trunk and extractive-free oil palm trunk (OPT), on the mechanical and thermal properties of epoxy composites. CNCs were extracted from oil palm trunk and oil palm trunk after extractive removal was used as green fillers, and 5% of both the fillers were incorporated into epoxy to create epoxy composites. TEM and XRD analyses were employed to characterize OPT and CNCs. The mechanical performance was evaluated using a tensile test by measuring the tensile strength, modulus of elasticity, and elongation at break. TGA was employed to evaluate their thermal stability. TEM results revealed a rod-like shape for the CNC sample, with a crystallinity value of 52.74%, as obtained by XRD. SEM results revealed the good bonding of CNC with epoxy, with the existence of a sharp intensity peak at 921 cm−1 that corresponded to the epoxide ring vibration from epoxy. This was followed by peaks at 2950 cm−1 and 2857 cm−1. Thus, the tensile properties of the 5% CNC–epoxy composite were enhanced, with strength and stiffness increasing by 32% and 12%, respectively. TGA results revealed the higher thermal stability of the 5% CNC–epoxy composite, with degradation onset obtained at a higher temperature (338 °C) than that of neat epoxy (334 °C), indicating almost a 1% increment. Thus, CNC–epoxy can be used for paneling and composite applications.
1. Introduction
In recent decades, the extraction of nanocellulose from biomass has gained increasing significance. The increased interest in natural fibers as alternatives is due to several factors, such as availability, cost-effectiveness, biodegradability, and environmental friendliness.1 The oil palm tree, with the scientific name Elaeis guineensis, is one of the main commodity crops in Malaysia and Indonesia that significantly contributes to the growth of the economy in both countries. Currently, Malaysia is the second largest producer and exporter of palm oil after Indonesia, claiming 24% of the global market of palm oil production.2 In this country, oil palm trees are planted in 5.9 million hectares of land. It is anticipated that palm oil production will surpass 20 million tons by 2024, after having reached 19.14 million tons in 2020.3 Due to the harvesting and pruning processes, numerous waste products are generated in addition to the crude palm oil used for cooking.4 The highest volumes of waste generated from oil palm trees are oil palm trunks (OPT) from logs, which make up more than 37 t ha−1 to 75.5 t ha−1 of wastes that are generated.5 Generally, OPT is only utilized until a tree reaches the age of twenty or more years, at which point oil production is deemed to be unproductive.6 Out of this waste, only 23% is used to produce products having added value. The remaining 77% is thrown away, burned, or disposed of in landfills, which causes more environmental issues.7 The chemical composition of OPT is 65–80% of holocellulose (α-cellulose and hemicellulose), 18–21% of lignin, and some amount of starch.8 This high cellulose content makes it perfect for use in the large-scale manufacturing of cellulose nanocrystals, which are produced from cellulose that is broken down to the nanoscale.9
Cellulose is the most abundantly available carbohydrate polymer and the main polysaccharide found in plants, wood, and other biomass resources.10 This carbohydrate polymer represents about one-third of plant tissues and can be formed by the photosynthesis process.11 Cellulose consists of β-(1-4)-D-glucopyranose units.9 Cellulose is considered an environmentally friendly green material that is renewable and have favorable mechanical properties. The mechanical properties of cellulose are dependent on the type of cellulose. Cellulose can be classified into I, II, III, and IV, with cellulose type I being the most prominent and abundantly found in nature or plants, which has great mechanical properties.12 Cellulose is typically used in different industries, such as textile, pharmaceutical, food, and paper industries.13–16 Cellulose nanocrystal or CNC is a material constructed from nanoscale particles made of cellulose. CNCs are a built-up form of amorphous and crystalline structures. The amorphous part is isotropic in nature and is responsible for flexibility, and the anisotropic crystalline part gives rigidity and material resistance to CNCs.17 Strong mineral acids, such as hydrochloric acid (HCl), sulfuric acid (H2SO4), hydrobromic acid (HBr), and phosphoric acid (H3PO4), are typically used in the extraction process of CNCs.18 Excellent suspension stability can be achieved by using the H2SO4 acid; however, the presence of negative charged sulfate groups introduced by the esterification process on the OH groups of the cellulose structure affects the final properties of the material, especially its thermal stability and mechanical performance.19 This means that CNCs produced by using H2SO4 have poor thermal properties, including heat transfer.20 HCl hydrolysis of CNCs does not cause esterification of the CNC hydroxyl groups and is thus not detrimental when exposed to heat.18 The stability of CNCs depends on a few factors, such as the presence of surface charges, the addition of surfactant, and the solution pH and temperature.21 Moreover, the use of HCl for the hydrolysis of CNCs appears to be a good choice for the improvement of other properties, such as mechanical performance, thermal properties, morphology and crystal structure. This will have a good reinforcement effect on the matrix, such as a polymer. Cellulose is the main component in CNCs and is considered the most widely used biopolymer in nature due to its excellent properties, such as renewability, degradability, and surface functionality.22 The rich hydroxyl groups on the cellulose structure contribute to the establishment of multiple hydrogen bonds between CNCs and the polymer matrix.22
Epoxy is a thermosetting polymer matrix that is widely used to develop advanced composite materials. Due to its great properties, such as high rigidity, low cost, ease of processing, chemical resistance, and good adhesion with different substrates, it is commonly used in electronics, semiconductor encapsulation, and electronic devices, as well as coatings and adhesives for flooring.23 However, epoxy, like other commonly used polymers, has poor thermal stability and fire resistance, and hence is vulnerable to melting when exposed to fire or heat.24,25 This thermosetting polymer with compact crosslinks can, however, be reinforced with different nanosized fillers for improving its properties. Using a relatively low-weight fraction of fillers, properties such as tensile strength, modulus, thermal, and viscoelasticity can be enhanced through improvement in interfacial shear and interfacial bonding between the matrix and fillers. Various types of nanofillers, such as cellulose nanocrystals (CNCs),26 carbon nanotubes (CNTs),27 graphene oxide (GO),28 nano clays,29 and nano silica30 have been used in the epoxy thermosetting matrix.
In the literature, the majority of studies concentrate on using H2SO4 to create CNCs, while studies devoted to enhancing the thermal stability and mechanical properties with the addition of CNCs using HCl hydrolysis are limited. To the best of our knowledge, no research has been done on CNCs isolated from OPT using HCl. The aim of this study was to investigate the properties of CNCs obtained from OPT as reinforcements in epoxy composites, focusing on their role in improving the mechanical properties and thermal stability. To achieve this, cellulose nanocrystals (CNCs) were extracted using the HCl hydrolysis technique and then further added to epoxy composites using the hand lay-up method. TEM and XRD were used to assess the characteristics of CNCs. Furthermore, their mechanical characterization was done using a tensile test, and the thermal stability was investigated by means of TGA. Moreover, the chemical properties and interactions of the polymers were assessed by FTIR. The morphological study was conducted using SEM.
2. Materials and methods
2.1 Materials
The oil palm trunk was supplied by the Malaysia Palm Oil Board (MPOB) from Bangi, Malaysia. OPT was extracted using a refiner to get small fiber sizes of around 1–2 cm. In this study, a proximate analysis was conducted. The composition (% w/w) of the oil palm fiber was approximated to a holocellulose content of 78.18% ± 1.35%, 60.65% ± 2.14% α-cellulose, and 17.62% ± 0.50% lignin. The procedure described in TAPPI T 222 cm-02 (Klason lignin content) was used to determine the lignin content. For estimating the holocellulose and cellulose content, the procedure specified in TAPPI T203 cm-74 was adopted. Chemicals, namely hydrochloric acid (95%), mono ammonium phosphate (MAP), ethanol (CH3CH2OH), glacial acetic acid (CH3COOH), sodium hydroxide (NaOH), and bisphenol A-(epichlorohydrin) as the epoxy and N(3-dimethylaminopropyl)-1,3-propylene diamine as the hardener, were used to fabricate the epoxy composite and nano epoxy composites. All these were obtained from local suppliers. All reagents were analytical grade and used without further purification. In addition, a cellulose dialysis membrane with a molecular weight cut-off of 14![[thin space (1/6-em)]](https://www.rsc.org/images/entities/char_2009.gif) 000 Da was also bought from a local supplier and used.
000 Da was also bought from a local supplier and used.
2.2 Preparation of oil palm trunk cellulose nanocrystals
Initially, a pulverizing machine was used to crush the OPT fibers into a powder with a mesh size of 50, which was subsequently screened using a sieve machine. Five grams of the OPT powder were placed in a cotton thimble and subsequently placed in a Soxhlet extractor equipped with a condenser to initiate the isolation of CNCs. The Soxhlet extraction procedure was employed using 300 mL of toluene/ethanol (v/v 2:1) to get rid of the extractive content from raw OPT. The lignin and hemicellulose components were subsequently removed from the extractive-free fiber by treating it with a 4% sodium hydroxide (NaOH) solution at 80 °C. After a duration of 30 minutes, the mixture was vacuum filtered using a Buchner filter. This procedure was conducted three times to ensure the total removal of all components (lignin and hemicellulose), leaving only cellulose. Subsequently, the remaining fibers were subjected to a bleaching process using 1 g of sodium chlorite (NaClO2) in 125 mL of DI water, creating an acidic solution with an approximate pH of 4. The experiment was conducted for 2 h at a temperature of 70 °C. Upon completion, 50 mL of distilled water was added to the mixture, followed by the collection of OPT cellulose using vacuum filtration and subsequent washing with distilled water. The OPT cellulose was subjected to drying in an oven at 50 °C overnight. Then, 2.0 g of the dried OPT cellulose was hydrolyzed in a 250 mL solution of 5 M hydrochloric acid (HCl) with vigorous agitation at ambient temperature for 45 minutes to extract nanocellulose. The reaction was immediately stopped by adding cold water. The precipitate was obtained after centrifugation for 15 minutes at 4500 rpm. Later, it was dialyzed until a neutral pH was attained (pH 7). The obtained CNCs were subsequently freeze-dried for further characterization and composite fabrication.
2.3 Epoxy composite fabrication
The hand lay-up and solution casting methods were used to prepare the epoxy composites. Firstly, the 5% CNC, epoxy, and hardener were mixed in a beaker by stirring. Then, the solution was poured into a silicon mold with dimensions of 100 × 100 × 30 mm3 and left overnight to cure. The procedure was repeated for the 5% OPT epoxy composite. The samples are denoted as neat epoxy, 5% CNC–epoxy, and 5% OPT–epoxy composites, respectively.
2.4 Characterization
2.4.1 Transmission electron microscopy (TEM). Initially, the CNC sample was diluted to 0.1% using DI water. After that, a plastic dropper was utilized to deposit one drop of this solution onto a copper grid. Then, the sample was negative-stained using a 2 wt% uranyl acetate solution. This solution was dropped onto the sample and allowed to dry at ambient temperature. The excess solution was then removed by using a piece of filter paper. A TEM microscope (Zeiss Libra 120, Carl Zeiss NTS GmbH) at an accelerating voltage of 120 kV was used to capture images to determine the sample size and structure.
2.4.2 X-ray diffraction (XRD). A PANalytical X'PERT PRO MRD PW 3040/60 device operated at 40 kV and 35 mA current, using monochromatic Cu Kα (λ = 1.54 Å), was employed to analyze the crystallinity index of the OPT and CNCs via X-ray diffraction (XRD). The diffractogram intensities were measured at a rate of 0.05° per minute, achieving a resolution of 0.25° within the range of 5 < 2θ < 40.The Segal equation (eqn (1)) was used to calculate the CrI of all samples.31 The analysis and peak determination were carried out using the PANalytical HighScore Plus 3.0d software.
| |
 | (1) |
whereas
I200 is the intensity of the main peak corresponding to (200) lattice diffraction (at
I200, 2
θ = 22.5° for cellulose I).
32 Iam refers to the intensity of diffraction of the amorphous part of cellulose (at 2
θ = 18° for cellulose I).
33
2.4.3 Fourier transform infrared (FTIR). The FTIR spectra were measured by the attenuated total reflection (ATR) method using a PerkinElmer Fourier transform infrared (FTIR) spectrometer equipped with an ATR attachment. A total of 16 scans were conducted at a scanning resolution of 4 cm−1, covering an infrared range from 4000 cm−1 to 600 cm−1.
2.4.4 Tensile properties of nanocomposites. The Universal Testing machine (model MTS Systems Corp., USA) was used for the tensile test to assess the elongation at break, Young's modulus, and tensile strength. A strain rate of 5 mm min−1 was used. The ASTM-D638 Type IV standard was followed for performing the tensile test.
2.4.5 Scanning electron microscopy (SEM). The morphology of the cross sections of the neat epoxy, 5% OPT–epoxy and 5% CNC–epoxy composites was observed by using a scanning electron microscope (SEM) (SU3500, Hitachi, Tokyo, Japan) at an accelerating voltage of 20 kV. All the samples were gold-coated prior to SEM imaging.
2.4.6 Thermogravimetry analysis (TGA). The thermal behavior and properties of each sample were evaluated using a PerkinElmer SDTA 6000 thermogravimetric analysis (TGA) instrument. The thermogravimetric analysis (TGA) was conducted at a heating rate of 10 °C min−1 and a nitrogen flow rate of 50 mL min−1. A temperature range of 25 °C to 700 °C was used for the TGA analysis. The thermal stability, onset degradation, and peak degradation temperature were measured for each sample.
3. Results and discussions
3.1 Transmission electron microscopy (TEM)
The size and diameter of the CNCs were observed and calculated. The TEM micrograph shown in Fig. 1 discloses that the effect of chemical hydrolysis and extraction resulted in a rod-like shape in the form of a network of cellulose nanocrystals. The average diameter was observed to be in the 5–15 nm range. This outcome is consistent with previous studies by Barbash et al.34 and da Silva et al.35 Fig. 2 shows the mechanism of CNC hydrolysis and extraction, starting with cellulose from OPT, which goes through the hydrolysis process with HCl acid. The HCl acid hydrolyzes the glycosidic bond in the amorphous region of cellulose. Then, the protonation of glycosidic oxygen occurs along with the cleavage of β-1,4-linked D-glucopyranose bonds to give monomers, and the crystalline region remains intact and contributes to the rod-like shape.
 |
| | Fig. 1 TEM micrograph of cellulose nanocrystals (CNCs) after hydrolysis (500 nm). The inset represents the magnified TEM image (100 nm). | |
 |
| | Fig. 2 Schematic of the mechanism of cellulose nanocrystal extraction. | |
3.2 X-ray diffraction (XRD)
The XRD analysis was utilized for studying the crystallinity of the sample. Moreover, XRD could evaluate the relationship between the crystal structure and its properties. Typically, the cellulose molecular structure is constituted partially by crystalline and amorphous parts, which means the polymerized chains are bonded by H-bonding in the region of the crystalline (ordered) part and there is no H-bonding in the disordered region or amorphous part.36 The crystallinity of CNCs was determined by the extraction method and surface modification.36 The XRD patterns of raw OPT and CNCs from OPT are displayed in Fig. 3. Both samples exhibited peaks at 2θ = 18°, 22.5° and 34.5° for the (110), (200) and (004) planes, respectively. These peaks are characteristic of cellulose type I, which is native to plants and biomass sources.37 The high intensity of the 2θ peak at 22° indicated the presence of cellulose crystallinity.38 The crystallinity index was calculated based on the Segal equation, which showed that the value for raw OPT was 31.05% and that for CNCs was 52.74%.
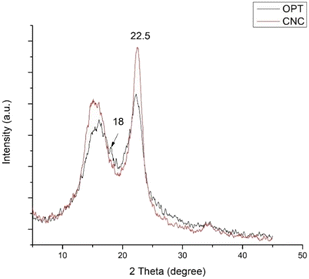 |
| | Fig. 3 XRD patterns of extractive-free oil palm trunk and cellulose nanocrystals. | |
3.3 Fourier transform infra-red (FTIR) spectroscopy
The FTIR spectra of neat epoxy and epoxy composites are depicted in Fig. 4. The neat epoxy sample displayed O–H group stretching vibrations, which appeared as a broad peak from 3000 cm−1 to 3600 cm−1 in all samples.39 This was contributed mostly by the free hydroxyl groups and moisture content. The stretching vibration of C–O bonds in the cellulose backbone was observed as peaks within 1730–1700 cm−1.40 The peak at 1505 cm−1 corresponded with the stretching of nitro compounds.41 The peak at 1013 cm−1 is attributed to the C–O–C stretching bands of the furan ring.42 The main functional groups of cellulose are the O–H stretching vibrations, C–H stretching, and the β-glucose peak at 921 cm−1.43 These peaks overlapped with the addition of fillers in the epoxy matrix. The 5% CNC epoxy and 5% OPT epoxy composites showed C–O stretching peaks that aligned with the existing peak at 1029 cm−1.43 The peaks at 1604 cm−1 and 1505 cm−1 corresponded with amine compounds that existed in OPT in the form of its lignin component.44 The 5% CNC epoxy composite displayed nearly the same spectra as the 5% OPT epoxy composite. A strong broad peak was observed in the region from 3000 cm−1 to 3600 cm−1 due to the stretching of O–H. The peak at 921 cm−1 is present in the FTIR spectra of all samples, which corresponded to epoxide ring vibration from the epoxy.45 This was followed by the existence of double peaks at 2950 cm−1 and 2857 cm−1 arising from the methyl (CH3) and methylene (CH2) groups.46 Both peaks are common in organic compounds, including epoxy and the green fillers. The appearance and enhancement of these groups after the addition of green fillers (CNC and OPT), together with the increase in OH groups, suggest chemical interactions and that the filler effectively integrated with the epoxy matrix, indicating interfacial bonding between both materials. Fig. 5 displays the schematic of the proposed mechanism of CNC interaction with epoxy. It can be seen that the OH groups are responsible for first bonding with the epoxy matrix.
 |
| | Fig. 4 FTIR spectra of the neat epoxy, 5% OPT–epoxy and 5% CNC–epoxy composites on their fracture surfaces. The inset represents the magnified FTIR spectrum of neat epoxy (3000–2500 cm−1). | |
 |
| | Fig. 5 Proposed mechanism of CNC interaction with epoxy. | |
3.4 Mechanical properties of composites
The mechanical properties, especially tensile properties, are crucial in determining the final application scope of composite materials. The tensile properties of the neat epoxy, 5% CNC–epoxy, and 5% CNC–epoxy composites are listed in Table 1, including tensile strength, Young's modulus, and elongation at break. The tensile strength for 5% CNC-epoxy was higher (4.6%) as compared to exoxy control (Fig. 6(a)). This was due to the strong hydrogen bonding between the CNCs and the physical bonding between the CNCs and the epoxy polymer chains. Another reason might be the intermolecular force, leading to the promotion of a slight increase in the tensile strength of the 5% CNC–epoxy composite. An increase in hard segment content and more energy dissipation during the tensile phase were caused by denser inter-chain hydrogen bonding.47 The addition of 5% OPT–epoxy was observed to show no significant difference in the tensile strength compared with the epoxy control; this is probably due to the bulky effect and inhomogeneous mixing between OPT fibers, which contribute to the weakening of the bonding with the matrix.48 The elongation at break was observed to be higher for the 5% OPT–epoxy composite than for the other samples (Fig. 6(b)). This was due to the existence of different components such as lignin, hemicellulose, and wax in OPT.49 Lignin plays an important role as a natural adhesive to bind the plant structure. Lignin also contributes to the plant's rigidity.50 This could be the main reason why the addition of 5% OPT to epoxy increased the elongation at break by up to 79% higher than the addition of 5% CNC–epoxy. The high crystallinity of CNCs makes them more brittle; thus, the addition of CNCs into epoxy imparts brittleness, which contributes to early fracture with minimal deformation. In other words, the crystallinity from CNCs contributed to the overall crystallinity of the composites. When the addition of CNC was too high, it destroyed the structure of the composite, causing the elongation at break to decrease. Moreover, the reduction in elongation at break is also caused by the strong hydrogen bonding interactions.
Table 1 Tensile properties of epoxy control, 5% OPT–epoxy and 5% CNC–epoxy (N-3)a
| Type of sample |
Epoxy control |
5% OPT–epoxy |
5% CNC–epoxy |
| Group with the same letter indicates there is no significant different at p < 0.05. |
| Tensile strength (MPa) |
14.0187 ± 0.6652a,b |
13.1463 ± 0.6734b,a |
14.4284 ± 0.9786c |
| Elongation at break (%) |
7.4727 ± 1.3809a,b |
11.6723 ± 0.6846b,a |
3.1017 ± 0.5840c |
| Young's modulus (MPa) |
15733.40 ± 707.6755a |
13269.67 ± 1202.4559b |
19598.67 ± 1749.7226c |
 |
| | Fig. 6 Tensile test data: (a) tensile strength, (b) elongation at break and (c) Young's modulus of neat epoxy, 5% OPT–epoxy and 5% CNC–epoxy composites. | |
The tensile strength and Young's modulus of neat epoxy were found to be 14.0 ± 0.6 MPa and 15733.40 ± 707.7 MPa, respectively (Table 1). The addition of 5% CNC into epoxy increased the tensile strength. This was due to good hydrogen bonding between CNCs and the physical interaction between the CNCs and epoxy polymer chains. This was in line with a study by Wongjaiyen et al.;51 in their study, the nanocellulose was extracted and reinforced with epoxy, and a tensile test was performed. They found that the strength and stiffness were increased by 32% and 12%, respectively, with the addition of CNFs up to 5.0% wt. This resulted from the physical interaction exhibited by well dispersed CNFs within the epoxy matrix. However, the elongation at break was reduced for 5% CNC–epoxy (Fig. 6(b)). This is because the addition of rigid CNCs to epoxy restricts the motion of polymer chains and thus decreases the elongation at break.52 The incorporation of relatively stiffer CNCs led to an improvement in tensile strength and tensile modulus. The added CNCs were found to have absorbed the molecular chains from the polymer matrix, leading to the formation of additional entanglement points that hinder the mobility of the polymeric chains.53 For 5% OPT–epoxy, the tensile strength and Young's modulus were decreased while elongation at break was increased compared with 5% CNC–epoxy (Fig. 6(a–c)). The incorporation of OPT fibers into the epoxy matrix leads to epoxy dilution, which can be attributed to the hydrophilic nature and residual moisture in the fibers, which hinder interfacial adhesion and interrupt the epoxy crosslinking network, thereby compromising the overall mechanical integrity of the composites. The adsorption of specific curing components onto the surfaces of the nanofibers may be a reason for the decreased crosslinking density in the matrix after the addition of nanofibers.54
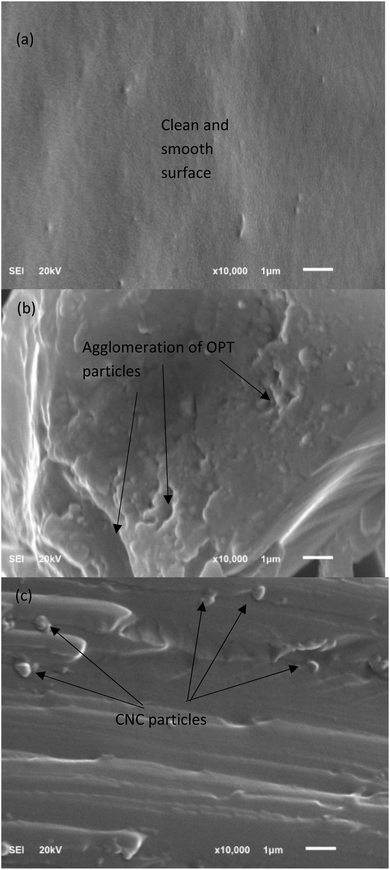
3.5 Fracture morphology
Fig. 7 displays the morphology of the fracture surfaces of epoxy and the epoxy composites. Fig. 7(a) shows that neat epoxy had a clean and smooth surface with tiny voids. The CNCs were uniformly embedded in the epoxy matrix with no CNC pullout, which confirmed the good interaction of CNCs and the epoxy matrix due to strong physical bonding and hydrogen bonding between the OH groups of the CNCs, as evidenced by FTIR (Fig. 4). The fracture morphology of 5% CNC–epoxy showed that CNCs and the epoxy matrix adhered quite well without any pores, as shown in Fig. 7(c). Microcracks and microvoids were observed at the interface of 5% OPT epoxy composite, leading to lower tensile strength (Fig. 7(b)). Thus, 5% CNC–epoxy had the highest value compared with the others.
 |
| | Fig. 7 SEM micrographs of fractured (a) neat epoxy, (b) 5% OPT–epoxy, (c) 5% CNC–epoxy. | |
As seen in Fig. 7(b), after 5% OPT loading in epoxy, there was a decline in structural destabilization. This can be explained by the weak compatibility between epoxy and the OPT particles, as well as the agglomeration of OPT. Strong hydrogen bonding between the OPT particles cause them to agglomerate and a weak spot is obtained on the epoxy structure. The voids and particle aggregates formed within the epoxy matrix act as concentration sites and cause cracking under applied stress.55 In mechanical testing, the fractures break the material, and the aggregates act as weak spots that initially cause the composites to rupture or fail. Once the OPT particles agglomerate, the interaction between the particles is stronger than that between the particles and the epoxy resin, which in turn reduces the mechanical properties.55 The presence of OPT agglomeration may result in a non-uniform distribution of OPT in the composite material and create blank spaces or voids within the polymer matrix, resulting in poor particle dispersion. This is in line with the study conducted by Taib et al.,56 who observed agglomeration due to the addition of CNCs at higher loading in an elastomer matrix. As seen in Fig. 7(c), the fracture surface showed no visible agglomerates. A minimal amount of CNC loading improves the CNC interconnections. This behavior explains how the loading quantity affects the interaction of the nanoparticles, improving their mechanical characteristics.57 This improvement may be attributed to the better dispersion of CNCs without nanoparticle agglomeration. The crack lines for 5% CNC-epoxy were stopped by the well-dispersed CNC fillers and prolong the rupture to occur.
3.6 Thermal behavior of cellulose nanocrystal (CNC)–epoxy composites
The composition of the OPT–epoxy and CNC–epoxy composites has an impact on and is crucial to their thermal stability. The TGA curves of all composites, as seen in Fig. 8(a), exhibited the same pattern, with a weight loss region below 100 °C due to moisture or water content.58 The degradation onset temperature was observed at 334 °C for neat epoxy, with a weight loss of around 87%. This increased by 4 °C for 5% CNC epoxy composite, with a weight loss of 74% at 338 °C. The addition of 5% OPT epoxy composite reduced the degradation onset temperature to 327 °C, with a weight loss of around 62%. A higher rate of onset degradation is the result of improved CNC crosslinking with the epoxy matrix.59 The dispersion of the nano-sized CNC particles functioned as a thermal barrier to the epoxy matrix, hence increasing the temperature.59 The higher amount of area exposed to OPT may have caused a decrease in thermal characteristics for the onset of degradation. Moreover, the decrease can be the result of a lack of fiber–matrix adhesion.60 The type and percentage of filler have a significant impact on the degree of compatibility and interfacial adhesion. The interfacial adhesion would be decreased by a higher percentage of fiber weight, which subsequently decreases the thermal stability of the composite material.45 This is followed by an increase in the polymeric chain mobility in the OPT–reinforced epoxy composite due to the increased fiber percentage. In the tested temperature range, the 5% CNC epoxy composite and 5% OPT epoxy composites showed significant weight losses of 74% and 62%, respectively. This is likely due to the elimination of carbohydrate-related groups before reaching a stable temperature and the beginning of initial degradation.
 |
| | Fig. 8 (a) TGA and (b) DTG curves of neat epoxy, 5% OPT–epoxy and 5% CNC–epoxy composites. | |
The peak degradation temperature (Tp), which indicates the degradation of the cellulosic backbone in CNC and OPT, was also found to vary significantly, as seen in Fig. 8(b). The degradation below the temperature of 100 °C is due to the removal of moisture or water content, and the highest value was recorded for the 5% OPT epoxy composite sample. OPT contains hemicellulose, cellulose, and lignin, which contribute to high moisture content,49 whereas the 5% CNC epoxy composite mainly contains the cellulose component with several OH groups. All samples exhibited two Tp peaks. The neat epoxy showed two peaks at 190 °C and 389 °C; the first was due to the slight removal of epoxy components and volatile components, and the latter was due to epoxy decomposition. This is in agreement with the study by Xu et al.,59 who observed two peaks for neat epoxy that contribute to the decomposition of epoxy components. For the 5% OPT epoxy composite, two peaks were found at 227 °C and 373 °C, respectively. This is due to the degradation of carbohydrate components in OPT, which later decreases the temperature for epoxy decomposition.61 For the 5% CNC epoxy composite, two peaks were seen at 270 °C and 400 °C, respectively. The former is due to the degradation of the CNC component, largely contributed by cellulose content, and the latter is due to a slight increase in the epoxy decomposition temperature. The thermal barrier caused by the good dispersion of CNCs in the epoxy matrix may contribute to the increase in the maximum temperature of epoxy decomposition. This is also in agreement with a previous study by Yusuf et al.,62 which stated that at low loading, the increased nano-level dispersion of CNF particles would act as a heat barrier for the polymer matrix.
4. Conclusions
Green nanofiller-reinforced epoxy composites were fabricated using 5% CNCs extracted from oil palm trunk and 5% of extractive-free OPT via a hand lay-up method. The TEM results showed a rod-like shape for CNCs, with dimensions between 5 and 15 nm. The XRD results showed that the highest crystallinity of up to 52% was obtained for CNCs. The FTIR showed strong hydrogen bonding between the CNCs and physical bonding between the CNCs and the epoxy polymer chains. The 5% CNC-incorporated epoxy composite outperformed neat epoxy in terms of flexural strength and modulus of elasticity. Good thermal stability was also observed with the addition of 5% CNCs to epoxy, with an improvement in the onset of degradation (338 °C) compared with neat epoxy (334 °C). Moreover, the SEM analysis demonstrated a strong interfacial interaction between the CNCs and the epoxy matrix, demonstrating its robust structural uses and a high degree of compatibility. Finally, in a nutshell, the 5% CNC–epoxy composite displayed exceptional thermal and flexural properties due to the strong interaction between the OH groups of CNCs and the epoxy resin. This research paves the path towards utilizing bio-based, renewable resources for lightweight structural applications. Moreover, this work proves that CNCs can be prepared from OPT using the HCl acid hydrolysis method and can be scaled for mass production for different industrial applications.
Author contributions
M. N. A. M. Taib: conceptualization, original idea for the scope of this study, methodology, supervision, writing – original draft, review and editing, and validation.
Conflicts of interest
There are no conflicts to declare.
Data availability
All data are made available in this manuscript.
Acknowledgements
This research is supported by Universiti Malaya Research Excellence Grant 2025 (UMREG002-2025). The author is grateful for the financial support given to this work by Universiti Malaya (UM).
References
- A. Karimah, M. R. Ridho, S. S. Munawar, I. Ismadi, Y. Amin, R. Damayanti, M. A. R. Lubis, A. P. Wulandari, N. Nurindah and A. H. Iswanto, Polymers, 2021, 13, 4280 CrossRef CAS PubMed.
- W. Y. Cheah, S. D. R. Pahri, S. T. K. Leng, A. Er and P. L. Show, Environ. Technol. Innovat., 2023, 103050 CrossRef.
- D. O. Darkwah and M. Ong-Abdullah, in Elaeis Guineensis, IntechOpen, 2021 Search PubMed.
- T. M. I. Mahlia, N. Ismail, N. Hossain, A. S. Silitonga and A. H. Shamsuddin, Environ. Sci. Pollut. Res., 2019, 26, 14849–14866 CrossRef CAS PubMed.
- T. Pulingam, M. Lakshmanan, J.-A. Chuah, A. Surendran, I. Zainab-L, P. Foroozandeh, A. Uke, A. Kosugi and K. Sudesh, Ind. Crops Prod., 2022, 189, 115827 CrossRef CAS.
- P. E. Poh, T. Y. Wu, W. H. Lam, W. C. Poon and C. S. Lim, Waste Management in the Palm Oil Industry: Plantation and Milling Processes, Springer Nature, 2020 Search PubMed.
- P.-A. C. Bejarano, J.-P. Rodriguez-Miranda, R. I. Maldonado-Astudillo, Y. I. Maldonado-Astudillo and R. Salazar, Processes, 2022, 10, 903 CrossRef CAS.
- S. Kumneadklang, Development of bioethanol production process from oil palm trunk with ethanol membrane separation, Thaksin University, 2019 Search PubMed.
- J. Lamaming, S. C. Chew, R. Hashim, O. Sulaiman and T. Sugimoto, J. Jpn. Inst. Energy, 2017, 96, 513–518 CrossRef CAS.
- A. A. Sundarraj and T. V. Ranganathan, Drug Invent, Today, 2018, 10, 89–94 Search PubMed.
- S. Giri, P. Dutta, D. Kumarasamy and T. K. Giri, in Plant and Algal Hydrogels for Drug Delivery and Regenerative Medicine, Elsevier, 2021, pp. 1–35 Search PubMed.
- M. Jonoobi, R. Oladi, Y. Davoudpour, K. Oksman, A. Dufresne, Y. Hamzeh and R. Davoodi, Cellulose, 2015, 22, 935–969 CrossRef CAS.
- C. Felgueiras, N. G. Azoia, C. Gonçalves, M. Gama and F. Dourado, Front. Bioeng. Biotechnol., 2021, 9, 608826 CrossRef PubMed.
- B. Sun, M. Zhang, J. Shen, Z. He, P. Fatehi and Y. Ni, Curr. Med. Chem., 2019, 26, 2485–2501 CrossRef CAS PubMed.
- M. Zhu, S. Huan, S. Liu, Z. Li, M. He, G. Yang, S. Liu, D. J. McClements, O. J. Rojas and L. Bai, Curr. Opin. Colloid Interface Sci., 2021, 56, 101512 CrossRef CAS.
- E. Małachowska, M. Dubowik, A. Lipkiewicz, K. Przybysz and P. Przybysz, Sustainability, 2020, 12, 7219 CrossRef.
- R. A. Chowdhury, M. Nuruddin, C. Clarkson, F. Montes, J. Howarter and J. P. Youngblood, ACS Appl. Mater. Interfaces, 2018, 11, 1376–1383 CrossRef PubMed.
- S. M. Mohomane, S. V. Motloung, L. F. Koao and T. E. Motaung, Cellul. Chem. Technol., 2022, 56, 691–703 CrossRef.
- M. Taib, W. A. Yehye and N. M. Julkapli, Cellul. Chem. Technol., 2020, 54, 11–25 CrossRef CAS.
- H.-Y. Yu, Z.-Y. Qin, L. Liu, X.-G. Yang, Y. Zhou and J.-M. Yao, Compos. Sci. Technol., 2013, 87, 22–28 CrossRef CAS.
- A. B. Rashid, M. E. Hoque, N. Kabir, F. F. Rifat, H. Ishrak, A. Alqahtani and M. E. Chowdhury, Polymers, 2023, 15, 4070 CrossRef CAS PubMed.
- H. Shaghaleh, X. Xu and S. Wang, RSC Adv., 2018, 8, 825–842 RSC.
- D. Liu, Y. Liu and G. Sui, Compos. Appl. Sci. Manuf., 2016, 84, 87–95 CrossRef CAS.
- P. Li, J. Wang, C. Wang, C. Xu and A. Ni, Polymers, 2024, 16, 631 CrossRef CAS PubMed.
- J. Wang, Y. Guo, S. Zhao, Z. Zhu, Y. Huang, T. Tian, Y. Zhou and L. Bi, React. Funct. Polym., 2022, 178, 105335 CrossRef CAS.
- M. N. A. M. Taib, T. S. Yee, D. Trache and M. Hazwan Hussin, Cellulose, 2024, 31, 997–1015 CrossRef CAS.
- B. Arash, Q. Wang and V. Varadan, Sci. Rep., 2014, 4, 6479 CrossRef CAS PubMed.
- W. Tong, Y. Zhang, Q. Zhang, X. Luan, Y. Duan, S. Pan, F. Lv and Q. An, Carbon, 2015, 94, 590–598 CrossRef CAS.
- M. Shettar, U. A. Kini, S. Sharma and P. Hiremath, Mater. Today: Proc., 2017, 4, 11158–11162 Search PubMed.
- J. Yuan, Z. Pei, S. Yang, H. Yu, X. Hu and H. Liu, J. Appl. Polym. Sci., 2023, 140, e53804 CrossRef CAS.
- L. Segal, J. J. Creely, A. E. Martin and C. M. Conrad, Text. Res. J., 1959, 29, 786–794 CrossRef CAS.
- A. D. French, Cellulose, 2014, 21, 885–896 CrossRef CAS.
- C. P. Azubuike, H. Rodríguez, A. O. Okhamafe and R. D. Rogers, Cellulose, 2012, 19, 425–433 CrossRef CAS.
- V. Barbash, O. Yaschenko, S. Alushkin, A. Kondratyuk, O. Y. Posudievsky and V. Koshechko, Nanoscale Res. Lett., 2016, 11, 410 CrossRef CAS PubMed.
- L. C. da Silva, A. Cassago, L. C. Battirola, M. d. C. Gonçalves and R. V. Portugal, Cellulose, 2020, 27, 5435–5444 CrossRef CAS.
- K. S. Salem, N. K. Kasera, M. A. Rahman, H. Jameel, Y. Habibi, S. J. Eichhorn, A. D. French, L. Pal and L. A. Lucia, Chem. Soc. Rev., 2023, 52, 6417–6446 RSC.
- P. H. F. Pereira, V. Arantes, B. Pereira, H. L. Ornaghi Jr, D. M. De Oliveira, S. H. Santagneli and M. O. H. Cioffi, Cellulose, 2022, 29, 8587–8598 CrossRef CAS.
- U. P. Agarwal, S. A. Ralph, C. Baez, R. S. Reiner and S. P. Verrill, Cellulose, 2017, 24, 1971–1984 CrossRef CAS.
- M. G. González, J. C. Cabanelas and J. Baselga, Infrared Spectroscopy-Materials Science, Engineering and Technology, 2012, vol. 2, pp. 261–284 Search PubMed.
- G. Paladini, V. Venuti, V. Crupi, D. Majolino, A. Fiorati and C. Punta, Polymers, 2021, 13, 528 CrossRef CAS PubMed.
- C. Sakthidharan, P. R. Sundararajan and M. Sarojadevi, New J. Chem., 2018, 42, 11202–11212 RSC.
- M. Khajouei, P. Pouresmaeel-Selakjani and M. Latifi, Bio-Based Epoxy Polymers, Blends and Composites: Synthesis, Properties, Characterization and Applications, 2021, pp. 267–281 Search PubMed.
- S. Y. Oh, D. I. Yoo, Y. Shin, H. C. Kim, H. Y. Kim, Y. S. Chung, W. H. Park and J. H. Youk, Carbohydr. Res., 2005, 340, 2376–2391 CrossRef CAS PubMed.
- R. Chazal, P. Robert, S. Durand, M.-F. Devaux, L. Saulnier, C. Lapierre and F. Guillon, Appl. Spectrosc., 2014, 68, 1342–1347 CrossRef CAS PubMed.
- S. Adil, B. Kumar, D. H. Pham and J. Kim, Int. J. Biol. MacroCarbohydr. Res.mol., 2024, 256, 128411 CAS.
- A. M. Salih, M. B. Ahmad, N. A. Ibrahim, K. Z. H. M. Dahlan, R. Tajau, M. H. Mahmood and W. M. Z. W. Yunus, Molecules, 2015, 20, 14191–14211 CrossRef CAS PubMed.
- S. Xue, Z. Yu, Z. Tang and Y. Liu, Mater. Horiz., 2025 10.1039/D5MH01385B.
- M. Chakkour, M. Ould Moussa, I. Khay, M. Balli and T. Ben Zineb, J. Reinf. Plast. Compos., 2023, 42, 222–263 CrossRef CAS.
- M. N. A. M. Taib, A. Salleh, N. A. N. Jamaluddin, T. Rasheed, M. H. Hussin, N. M. Julkapli, V. S. Saji and T. A. Saleh, Results Eng., 2025, 107049 CrossRef.
- N. N. Solihat, A. F. Hidayat, M. N. A. M. Taib, M. H. Hussin, S. H. Lee, M. A. A. Ghani, S. S. O. A. Edrus, H. Vahabi and W. Fatriasari, J. Polym. Environ., 2022, 30, 4517–4537 CrossRef CAS.
- T. Wongjaiyen, W. Brostow and W. Chonkaew, Polym. Bull., 2018, 75, 2039–2051 CrossRef CAS.
- M. Pereda, G. Amica, I. Rácz and N. E. Marcovich, J. Food Eng., 2011, 103, 76–83 CrossRef CAS.
- J. Li, Z. Song, D. Li, S. Shang and Y. Guo, Ind. Crops Prod., 2014, 59, 318–328 CrossRef CAS.
- L. Daelemans, W. Van Paepegem, D. R. D'hooge and K. De Clerck, Adv. Funct. Mater., 2019, 29, 1807434 CrossRef.
- H. A. Khalil, H. Fizree, A. Bhat, M. Jawaid and C. Abdullah, Composites, Part B, 2013, 53, 324–333 CrossRef.
- M. Taib, W. A. Yehye and N. M. Julkapli, Fibers Polym., 2019, 20, 165–176 CrossRef CAS.
- A. Kutvonen, G. Rossi, S. R. Puisto, N. K. Rostedt and T. Ala-Nissila, J. Chem. Phys., 2012, 21, 11320–11328 Search PubMed.
- H. Roozendaal, M. Abu-hardan and R. A. Frazier, J. Food Eng., 2012, 111, 606–611 CrossRef CAS.
- S. Xu, N. Girouard, G. Schueneman, M. L. Shofner and J. C. Meredith, Polymer, 2013, 54, 6589–6598 CrossRef CAS.
- X. Pei, W. Han, G. Ding, M. Wang and Y. Tang, J. Appl. Polym. Sci., 2019, 136, 48206 CrossRef.
- Z. Azwa and B. Yousif, Polym. Degrad. Stabil., 2013, 98, 2752–2759 CrossRef CAS.
- J. Yusuf, S. Sapuan, U. Rashid, R. Ilyas and M. Hassan, Int. J. Biol. Macromol., 2024, 278, 134421 CrossRef CAS PubMed.
|
| This journal is © The Royal Society of Chemistry 2025 |
Click here to see how this site uses Cookies. View our privacy policy here. 
 Open Access Article
 This Open Access Article is licensed under a Creative Commons Attribution-Non Commercial 3.0 Unported Licence


